Introduction
Lung cancer remains the leading cause of
cancer-related mortality globally (1). Lung adenocarcinoma (LUAD) constitutes
>40% of non-small cell lung cancer (NSCLC) cases, being the most
prevalent histological subtype (2).
Despite advances in targeted therapies and immunotherapy, the
5-year survival rate for advanced LUAD remains <20% (3), highlighting the critical need for more
accurate prognostic tools and novel biomarkers. Conventional TNM
staging offers limited predictive value for individualized
treatment outcomes, particularly with the emergence of immune
checkpoint inhibitors (4,5). Consequently, integrating molecular
profiles with tumor microenvironmental characteristics is essential
for enhanced prognostic assessment.
Keratins (KRTs) are structural proteins that form
the intermediate filament cytoskeleton of epithelial cells
(6). Traditionally, KRTs support
cell morphology and mechanical stability, earning them the title
‘cellular steel skeleton’. Aberrant KRT expression is linked to the
development and progression of epithelial tumors (7,8).
Dysregulated KRTs, in particular, contribute to malignant processes
such as epithelial-mesenchymal transition (EMT), increased
migration and invasion and resistance to chemotherapy (9).
In pathology, tissue-specific KRT expression
patterns are used as immunohistochemical markers for both diagnosis
and prognosis (9). For example,
KRT7, KRT18 and KRT80 are routinely used to differentiate tumor
subtypes (10,11). However, most studies focus on
individual KRTs, neglecting the potential synergistic effects of
the entire KRT family within the intricate tumor microenvironment
(12).
Research has unveiled non-canonical functions of
KRTs, particularly in immune regulation. KRT1, for instance,
modulates innate immunity by promoting interleukin-18 (IL-18)
release, while KRT6, KRT16 and KRT17 facilitate keratinocyte
proliferation and immune cell infiltration in inflammatory skin
conditions (13–15). Krt76-/- mice exhibit systemic
inflammation, marked by increased circulating B cells, regulatory T
cells and effector T cells (16,17).
These findings suggest that KRTs may function as
central players linking epithelial stress to immune responses,
challenging their traditional role as purely structural proteins.
Overall, the comprehensive role of the KRT gene family in shaping
the LUAD tumor immune microenvironment remains poorly understood.
In particular, the contribution of KRTs to immune evasion and the
effectiveness of immunotherapy is yet to be fully elucidated.
The present study integrated existing knowledge with
novel analyses to systematically delineate the roles of KRT genes
in LUAD. KRTs were assessed as diagnostic markers, immune
regulators and mediators of therapy resistance and their potential
prognostic and therapeutic significance was explored.
Materials and methods
Data sources
RNA sequencing data for a LUAD cohort (n=592) were
obtained from The Cancer Genome Atlas (TCGA) via the GDC portal
(portal.gdc.cancer.gov/) and processed using the GDC RNASeq
analysis pipeline (v32.0; docs.gdc.cancer.gov/Data/Bioinformatics_Pipelines/Expression_mRNA_Pipeline/).
Raw counts and clinical variables (age, sex, tumor stage, overall
survival and vital status) were retrieved from the UCSC Xena
database (18). Two independent
microarray datasets (GSE31210, n=226; GSE72094, n=398) were
obtained from Gene Expression Omnibus (GEO) for external validation
of prognostic findings (19). For
combined analyses, batch effects were removed using the ‘ComBat’
algorithm from the sva R package. Samples with missing survival
data or critical clinical information (e.g., TNM stage) were
excluded from corresponding analyses.
Machine learning feature gene
screening
A total of 18 candidate KRT genes were screened in
the TCGA dataset using two machine learning approaches. Least
Absolute Shrinkage and Selection Operator (LASSO) regression
(glmnet package, version 4.1–8;
cran.r-project.org/web/packages/glmnet/) with 10-fold
cross-validation was applied to select genes with non-zero
coefficients. A random survival forest model (randomForestSRC
package, version 3.2.3; http://cran.r-project.org/web/packages/randomForestSRC)
was then constructed, ranking genes by mean decrease in Gini
impurity, with the top 10 retained. The overlap between LASSO and
random forest results yielded nine consensus feature genes. An
extreme Gradient Boosting (XGBoost) model was trained on these
genes to classify tumor and normal samples. Shapley Additive
explanations (SHAP) values were calculated to quantify each gene's
contribution to tumor-normal classification in the XGBoost model
(20).
Construction of prognostic
signature
The ML.Dev.Prog.Sig framework (Mime1 package,
v1.0.0; github.com/Zaoqu-Liu/Mime) was applied to construct and
evaluate prognostic models for LUAD. A total of 101 candidate
models, including forward stepwise Cox regression, ridge
regression, random survival forest, XGBoost and gradient boosting
machine (GBM), were trained on the TCGA cohort with 10-fold
cross-validation. Model performance was assessed using Harrell's
C-index and time-dependent receiver operating characteristic (ROC)
area under the curve (AUC) at 1, 3 and 5 years. The optimal model
was selected based on predictive accuracy and stability across the
TCGA training set and the GEO validation cohorts (GSE31210 and
GSE72094).
Immune microenvironment analysis
Immune infiltration analysis was performed using the
IBOR package (21), stratifying
TCGA-LUAD individuals into high- and low-risk groups. CIBERSORT was
applied to estimate the relative abundance of 22 immune cell types
per tumor sample (22), with
differences visualized by heatmaps and boxplots. MCP-counter was
used to compute absolute abundance scores for eight major cell
populations, including CD8+ T cells, cytotoxic lymphocytes,
monocytes, dendritic cells, neutrophils, NK cells, B cells and
fibroblasts (23). Single-sample
GSEA (ssGSEA) was used to calculate enrichment scores for
immune-related pathways (24).
Expression of key immune checkpoint genes (PDCD1, CD274, CTLA4,
LAG3 and TIGIT) (25) was compared
between groups. Two-sided Wilcoxon tests were used for group
comparisons and P<0.05 was considered to indicate a
statistically significant difference.
GSEA and functional enrichment
analysis
Differentially expressed genes (DEGs) between high-
and low-risk groups were analyzed by gene set enrichment analysis
using the clusterProfiler package (26). Kyoto Encyclopedia of Genes and
Genomes (KEGG) pathway gene sets (c2.cp.kegg.v7.5.symbols) were
tested for enrichment with adjusted P<0.05.
Immunotherapy response prediction
The Tumor Immune Dysfunction and Exclusion (TIDE)
algorithm was used to estimate the likelihood of immune evasion
(27). For each patient, total
TIDE, T cell dysfunction and T cell exclusion scores were
calculated and compared between risk groups to predict potential
response to immune checkpoint inhibitors.
Drug sensitivity analysis
Drug response data for the NCI-60 cancer cell lines
were retrieved from the CellMiner database (28). Pearson correlation was employed to
analyze associations between the KRT risk score and
chemotherapeutic drug sensitivity. Correlations with |r| >0.3
and P<0.05 were considered statistically significant (29). This analysis aimed to explore
potential general relationships between KRT expression and drug
sensitivity, providing hypothesis-generating evidence based on
pan-cancer cell line data.
Cell culture and transfection
In total, five human cell lines were used: LUAD cell
lines A549 (TCHu150) and H1299 (TCHu160), normal human bronchial
epithelial cell line BEAS-2B (GNHu27) and lung cancer cell lines
NCI-H69 (SCSP-5077) and NCI-H196 (SCSP-5088). All cell lines were
obtained from the Cell Bank of the Chinese Academy of Sciences and
maintained at 37°C in a humidified incubator with 5%
CO2. Detailed culture conditions are provided in
Table SI. To investigate the
function of KRT81, cells were transfected with either a negative
control short hairpin (sh)RNA (sh-NC) or one of two shRNAs
targeting KRT81 (sh-KRT81; Shanghai GenePharma Co., Ltd.).
Transfections were conducted using Lipofectamine® 3000
(Thermo Fisher Scientific, Inc.) at 37°C according to the
manufacturer's instructions. Briefly, cells were incubated with the
transfection complexes for 6 h, after which the medium was replaced
with complete culture medium. Subsequent molecular and functional
experiments were performed 48 h after transfection. Knockdown
efficiency (>80%) was confirmed by fluorescence microscopy and
reverse transcription-quantitative (RT-q) PCR. The target sequences
and corresponding shRNA sequences are listed in Table SII.
RNA extraction and RT-qPCR
Total RNA was extracted from cells (5×10⁵ cells/well
in 6-well plates) using RNA-easy Isolation Reagent (cat. No. R701;
Vazyme Biotech Co., Ltd.) and reverse transcribed into cDNA using
the HiScript III RT SuperMix (Vazyme Biotech Co., Ltd.). All
procedures were performed according to the manufacturer's
protocols. RT-qPCR was performed on an ABI 7500 real-time PCR
system using SYBR Green chemistry (Vazyme Biotech Co., Ltd.).
Thermocycling conditions were as follows: Initial denaturation at
95°C for 30 sec, followed by 40 cycles of denaturation at 95°C for
5 sec and annealing/extension at 60°C for 30 sec. Primers used
were: KRT81 forward 5′-TTAAGGCACAGTATGACGACATTG-3′ and reverse
5′-TCTGGCACTTGGCATTCTCC-3′; GAPDH forward
5′-TGACTTCAACAGCGACACCCA-3′, reverse 5′-CACCCTGTTGCTGTAGCCAAA-3′.
Relative gene expression was calculated by the 2-ΔΔCq method
(30). All experiments were
performed in triplicate and repeated three times independently.
Western blotting
Cells were lysed in RIPA buffer (Beyotime, China)
with protease/phosphatase inhibitors. Protein concentration was
determined by BCA assay (Thermo Fisher, USA). Equal amounts of
protein (30 µg/lane) were separated on 10% SDS-PAGE and transferred
to polyvinylidene difluoride (PVDF) membranes (Millipore, USA).
Membranes were blocked with 5% non-fat milk (room temperature, 1
h), then incubated overnight at 4°C with primary antibodies:
anti-KRT81 (1:1,000, cat. 11342-1-AP, Proteintech) and anti-GAPDH
(1:5,000, cat. 60004-1-lg, Proteintech). After washing with TBST
(containing 0.1% Tween-20), membranes were incubated with
HRP-conjugated goat anti-rabbit (1:3,000, cat. A0208, Beyotime) or
mouse (1:3,000, cat. A0216, Beyotime) for 1 h at room temperature.
Bands were visualized using ECL reagent (Thermo Fisher) and imaged.
Densitometry was performed with ImageJ (v1.53; National Institutes
of Health).
CCK-8 assay
Cell proliferation was assessed using the Cell
Counting Kit-8 (CCK-8, Sigma). Transfected cells were seeded in
96-well plates (100 µl/well). At designated time points, 10 µl of
CCK-8 reagent was added to each well and incubated for 4 h.
Absorbance was measured at 450 nm with a microplate reader (Tecan
Infinite; Tecan Group, Ltd.).
Colony formation assay
For colony assays, transfected cells were plated at
1×10³ cells per well in 6-well plates and incubated for 14 days.
Colonies were defined as cell clusters containing at least 50
cells. Colonies were fixed with 4% paraformaldehyde for 20 min at
room temperature, stained with Giemsa for 15 min at room
temperature, and colonies were observed using a light microscope.
The number of colonies was quantified using ImageJ software
(version 1.53, National Institutes of Health).
Apoptosis assay
Cell apoptosis was assessed using an Annexin
V-FITC/PI staining kit (Nanjing KeyGen Biotech Co., Ltd.). Cells
were stained following the manufacturer's protocol and analyzed by
flow cytometry (FACSCalibur, BD Biosciences). Data were processed
using FlowJo software (version 10.6.2; BD Biosciences). The
apoptotic rate was calculated as the sum of the percentages of
early apoptotic cells (Annexin V+/PI−) and late apoptotic cells
(Annexin V+/PI+).
Scratch assay
Cell migration of A549 and H1299 cells was evaluated
by a wound-healing (scratch) assay. Transfected cells were grown to
confluence in 96-well plates. To minimize the influence of cell
proliferation on wound closure, the medium was replaced with
serum-free medium for 12 h prior to the assay. A uniform scratch
was made in the cell monolayer with a 200-µl pipette tip. After
scratching, the cells were washed twice with PBS to remove cell
debris and then maintained in serum-free medium. Images of the
wound area were captured at 0 and 24 h using a Cellomics imaging
system (light microscopy). The wound width was measured and the
migration rate was calculated as follows: Migration rate=(width at
0 h-width at 24 h)/Width at 0 h.
Transwell assay
Cell migration and invasion were assessed using
6.5-mm Transwell chambers (Corning, Inc.). For migration assays,
1×10⁴ transfected cells were seeded in the upper chamber in
serum-free medium. For invasion assays, the upper chamber was
pre-coated with Matrigel (Corning, Inc., 1:6 dilution). After 24 h,
cells on the lower membrane were fixed, stained with 0.1% crystal
violet and counted under a microscope.
Statistical analysis
Statistical analyses were conducted using R software
(version 4.3.1; r-project.org/) and GraphPad Prism (version 9.0;
Dotmatics). Survival curves were analyzed by the Kaplan-Meier
method with log-rank testing. Correlation analyses were performed
using Spearman's rank correlation coefficient. For multi-group
comparisons, normality was first assessed using the Shapiro-Wilk
test. Normally distributed data were analyzed using one-way
analysis of variance (ANOVA) with Bonferroni post hoc test for
multiple comparisons. Non-normally distributed data were analyzed
using the Kruskal-Wallis test followed by Dunn's test with
Bonferroni correction. Two-group comparisons were performed using
two-sided Student's t-test or Mann-Whitney U test, as appropriate.
Data are expressed as mean ± SD. P<0.05 was considered to
indicate a statistically significant difference.
Results
Differential expression and machine
learning-based feature gene screening
Differential expression analysis of 526 tumor and 59
normal lung samples from TCGA-LUAD identified KRT genes with
|log2FC| > 1 and false discovery rate (FDR) <0.05. In total,
18 KRT genes were significantly dysregulated in LUAD (Fig. 1A). Two feature selection methods,
LASSO regression and random forest analysis, were applied. LASSO
with 10-fold cross-validation identified 12 predictive genes
(Fig. 1B and C), while the random
forest model selected the top 10 genes ranked by mean decrease in
Gini impurity (Fig. 1D). The
overlap between methods yielded a nine-gene signature (KRT1, KRT4,
KRT27, KRT79, KRT80, KRT16, KRT15, KRT81 and KRT83).
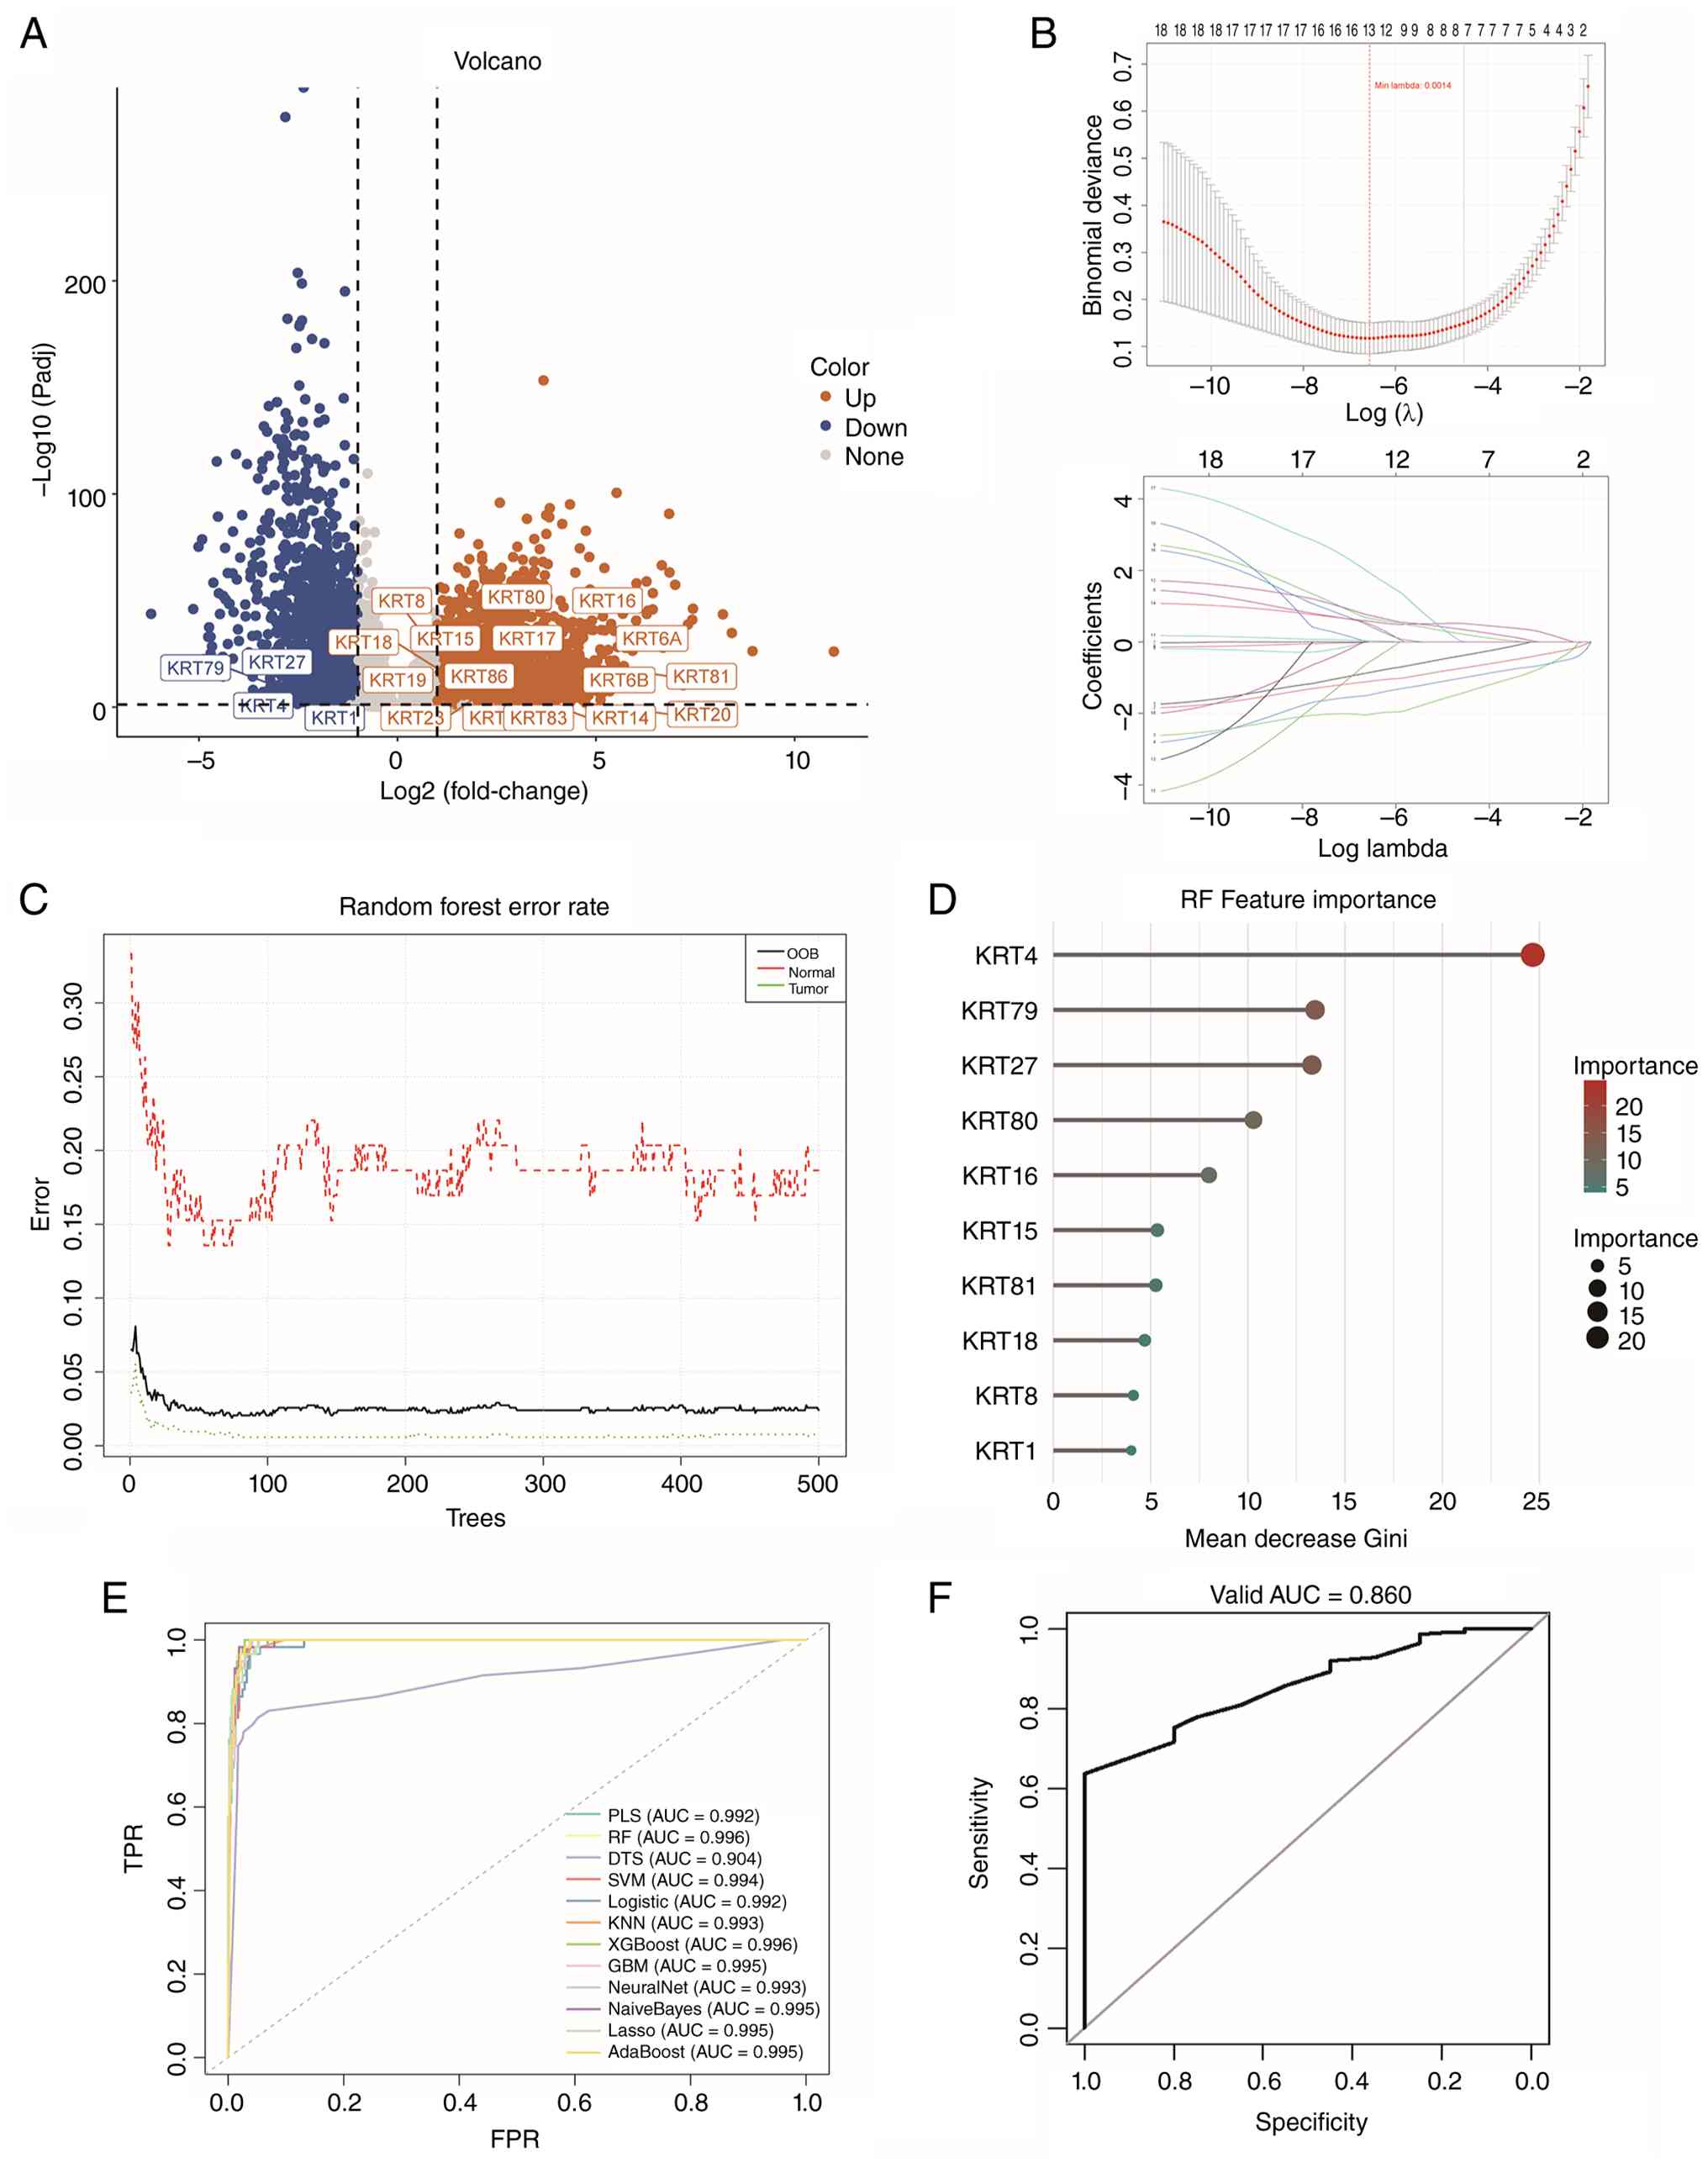 | Figure 1.Differential expression and feature
selection of keratin genes in LUAD. (A) Volcano plot of keratin
genes differentially expressed between TCGA-LUAD tumors and normal
lung tissues (|log2FC|>1, FDR<0.05). (B) LASSO coefficient
profiles and 10-fold cross-validation curve for identifying
diagnostic genes. (C) Out-of-bag error rate across trees during
random forest training. (D) Top 10 keratin genes ranked by
MeanDecreaseGini importance in the random forest model. (E) ROC
curves comparing LASSO, RF, XGBoost and other models on TCGA data.
(F) ROC curve for the optimal XGBoost model in the GSE31210
validation cohort (AUC=0.860). LUAD, lung adenocarcinoma; TCGA, The
Cancer Genome Atlas; FDR, false discovery rate; LASSO, Least
Absolute Shrinkage and Selection Operator; ROC, receiver operating
characteristic; XGBoost, extreme Gradient Boosting; RF, random
forest; AUC, area under the curve; TPR, true positive rate. |
The gene set was assessed using multiple
classification algorithms. XGBoost achieved the highest accuracy,
with an AUC of 0.996 in TCGA (Fig.
1E). External validation in GSE31210 confirmed robust
diagnostic performance (AUC=0.860; Fig.
1F), with KRT81 demonstrating particularly strong
discriminative ability. These results identify a small subset of
KRT genes with high diagnostic potential for LUAD, suggesting that
this signature can reliably distinguish tumors from normal lung
tissue.
SHAP-based interpretation of the
XGBoost diagnostic model
To elucidate the contribution of individual genes to
model decision-making, SHAP analysis was performed on the final
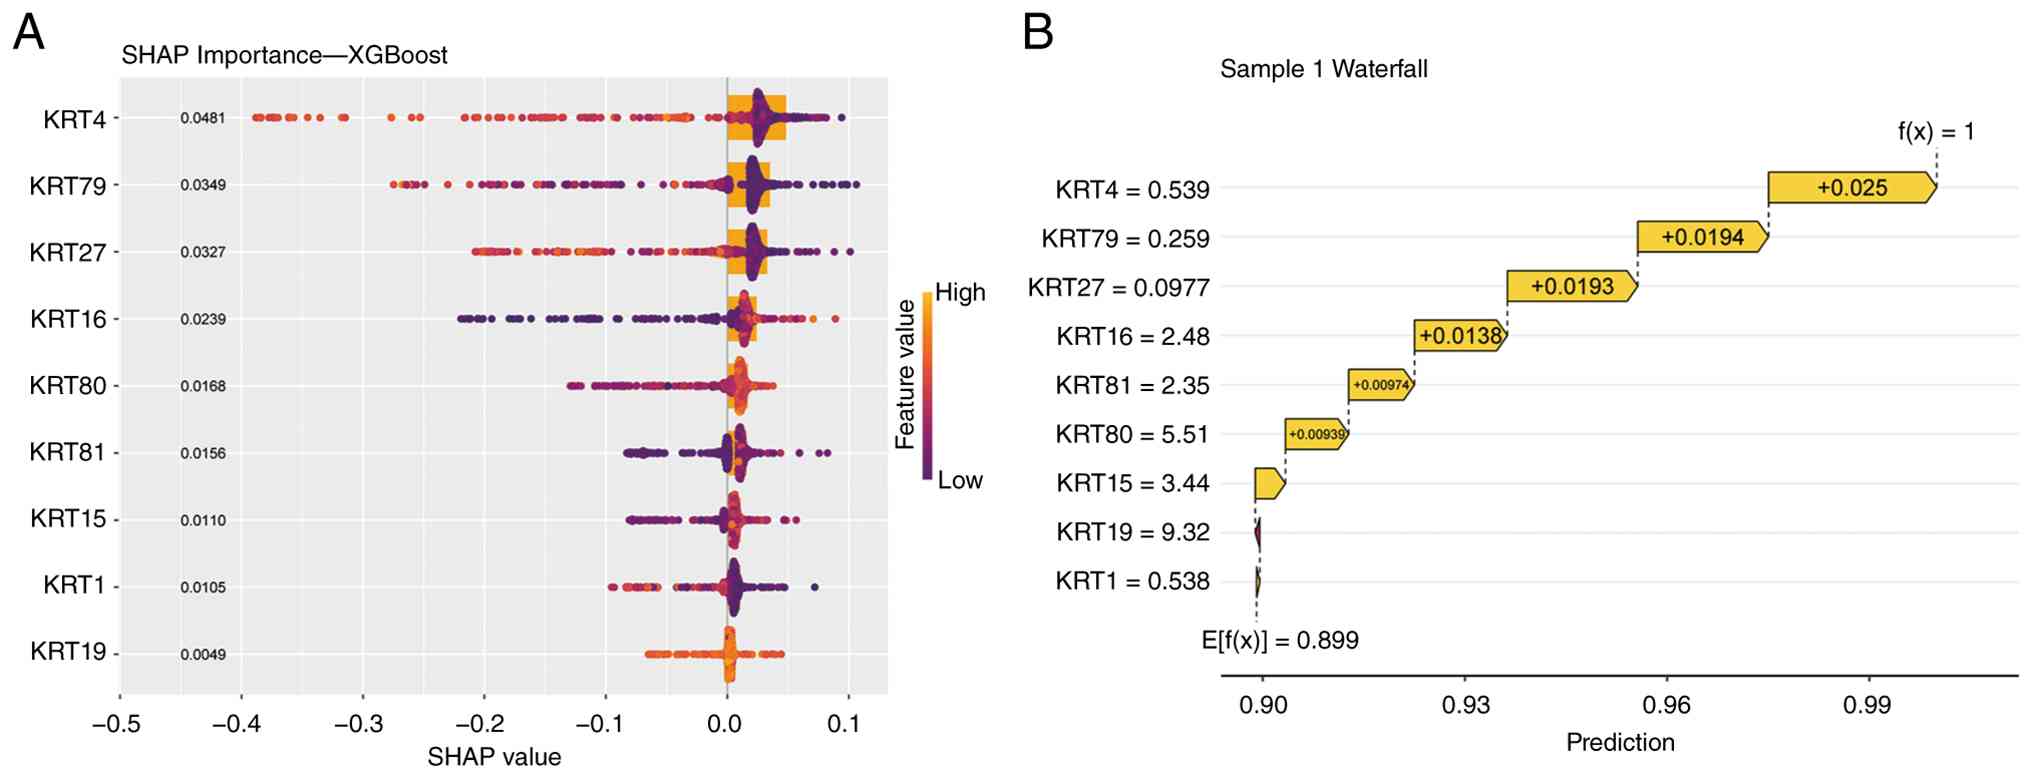
XGBoost classifier. The SHAP summary plot (Fig. 2A) ranked KRT genes by their overall
effect on prediction, revealing that KRT4, KRT79, KRT27, KRT16,
KRT80 and KRT81 exerted the strongest influence on the model
output. The distribution of SHAP values indicated that higher
expression of these genes predominantly shifted the prediction
toward tumor classification.
A representative SHAP waterfall plot (Fig. 2B) further illustrates how
gene-specific contributions accumulate to determine the final
predicted probability for an individual sample. In this example,
positive SHAP values for KRT4, KRT79, KRT27, KRT16, KRT81 and KRT80
elevate the prediction toward the tumor class, whereas genes with
minimal effect remain close to baseline expectations.
These SHAP analyses demonstrated that a small subset
of KRT genes consistently drives the classifier's decisions. This
pattern aligns with their biological dysregulation in LUAD,
highlighting their mechanistic relevance to the model's
discriminative performance.
Prognostic model construction
To identify keratin family members with prognostic
significance, univariate Cox regression analysis was performed in
the TCGA-LUAD cohort, which identified four KRTs significantly
associated with overall survival, including KRT27, KRT16, KRT80 and
KRT81, with KRT81 exhibiting the highest hazard ratio (Table SIII). These prognostic-relevant
genes were subsequently incorporated into a systematic modeling
framework. Among the 101 tested models, the combination of forward
stepwise Cox regression with Ridge regression achieved the highest
mean C-index (0.65 across cohorts; 0.66 in validation; Fig. 3A) and was selected as the final
prognostic model. This selection was based on its optimal balance
of predictive accuracy and stability: While achieving a top-tier
C-index, the forward stepwise approach ensured model parsimony by
selecting only the most informative genes and the incorporation of
Ridge regression helped stabilize coefficient estimates by
effectively handling multicollinearity among the keratin genes. The
corresponding regression coefficients were used to derive the
prognostic risk score formula: Risk
Score=−0.320×KRT27+0.159×KRT80+0.238×KRT16+0.120×KRT81. Using this
model, the present study calculated a risk score for each patient
and classified them into high- and low-risk groups at the median.
Kaplan-Meier analysis confirmed that high-risk patients had
significantly worse overall survival: in TCGA (HR=1.99; 95%
CI:1.39–2.85; Fig. 3B) and in both
validation cohorts (GSE31210: HR=2.47; 95% CI:1.21–5.06; Fig. 3C; GSE72094: HR=2.22, 95%
CI:1.53–3.23; Fig. 3D).
Time-dependent ROC curves further demonstrated the model's strong
predictive power: 5-year AUCs were 0.61, 0.7 and 0.7 in TCGA,
GSE31210 and GSE72094, respectively (Fig. 3E). These results demonstrate the
model's robust performance and potential for individualized risk
stratification in LUAD.
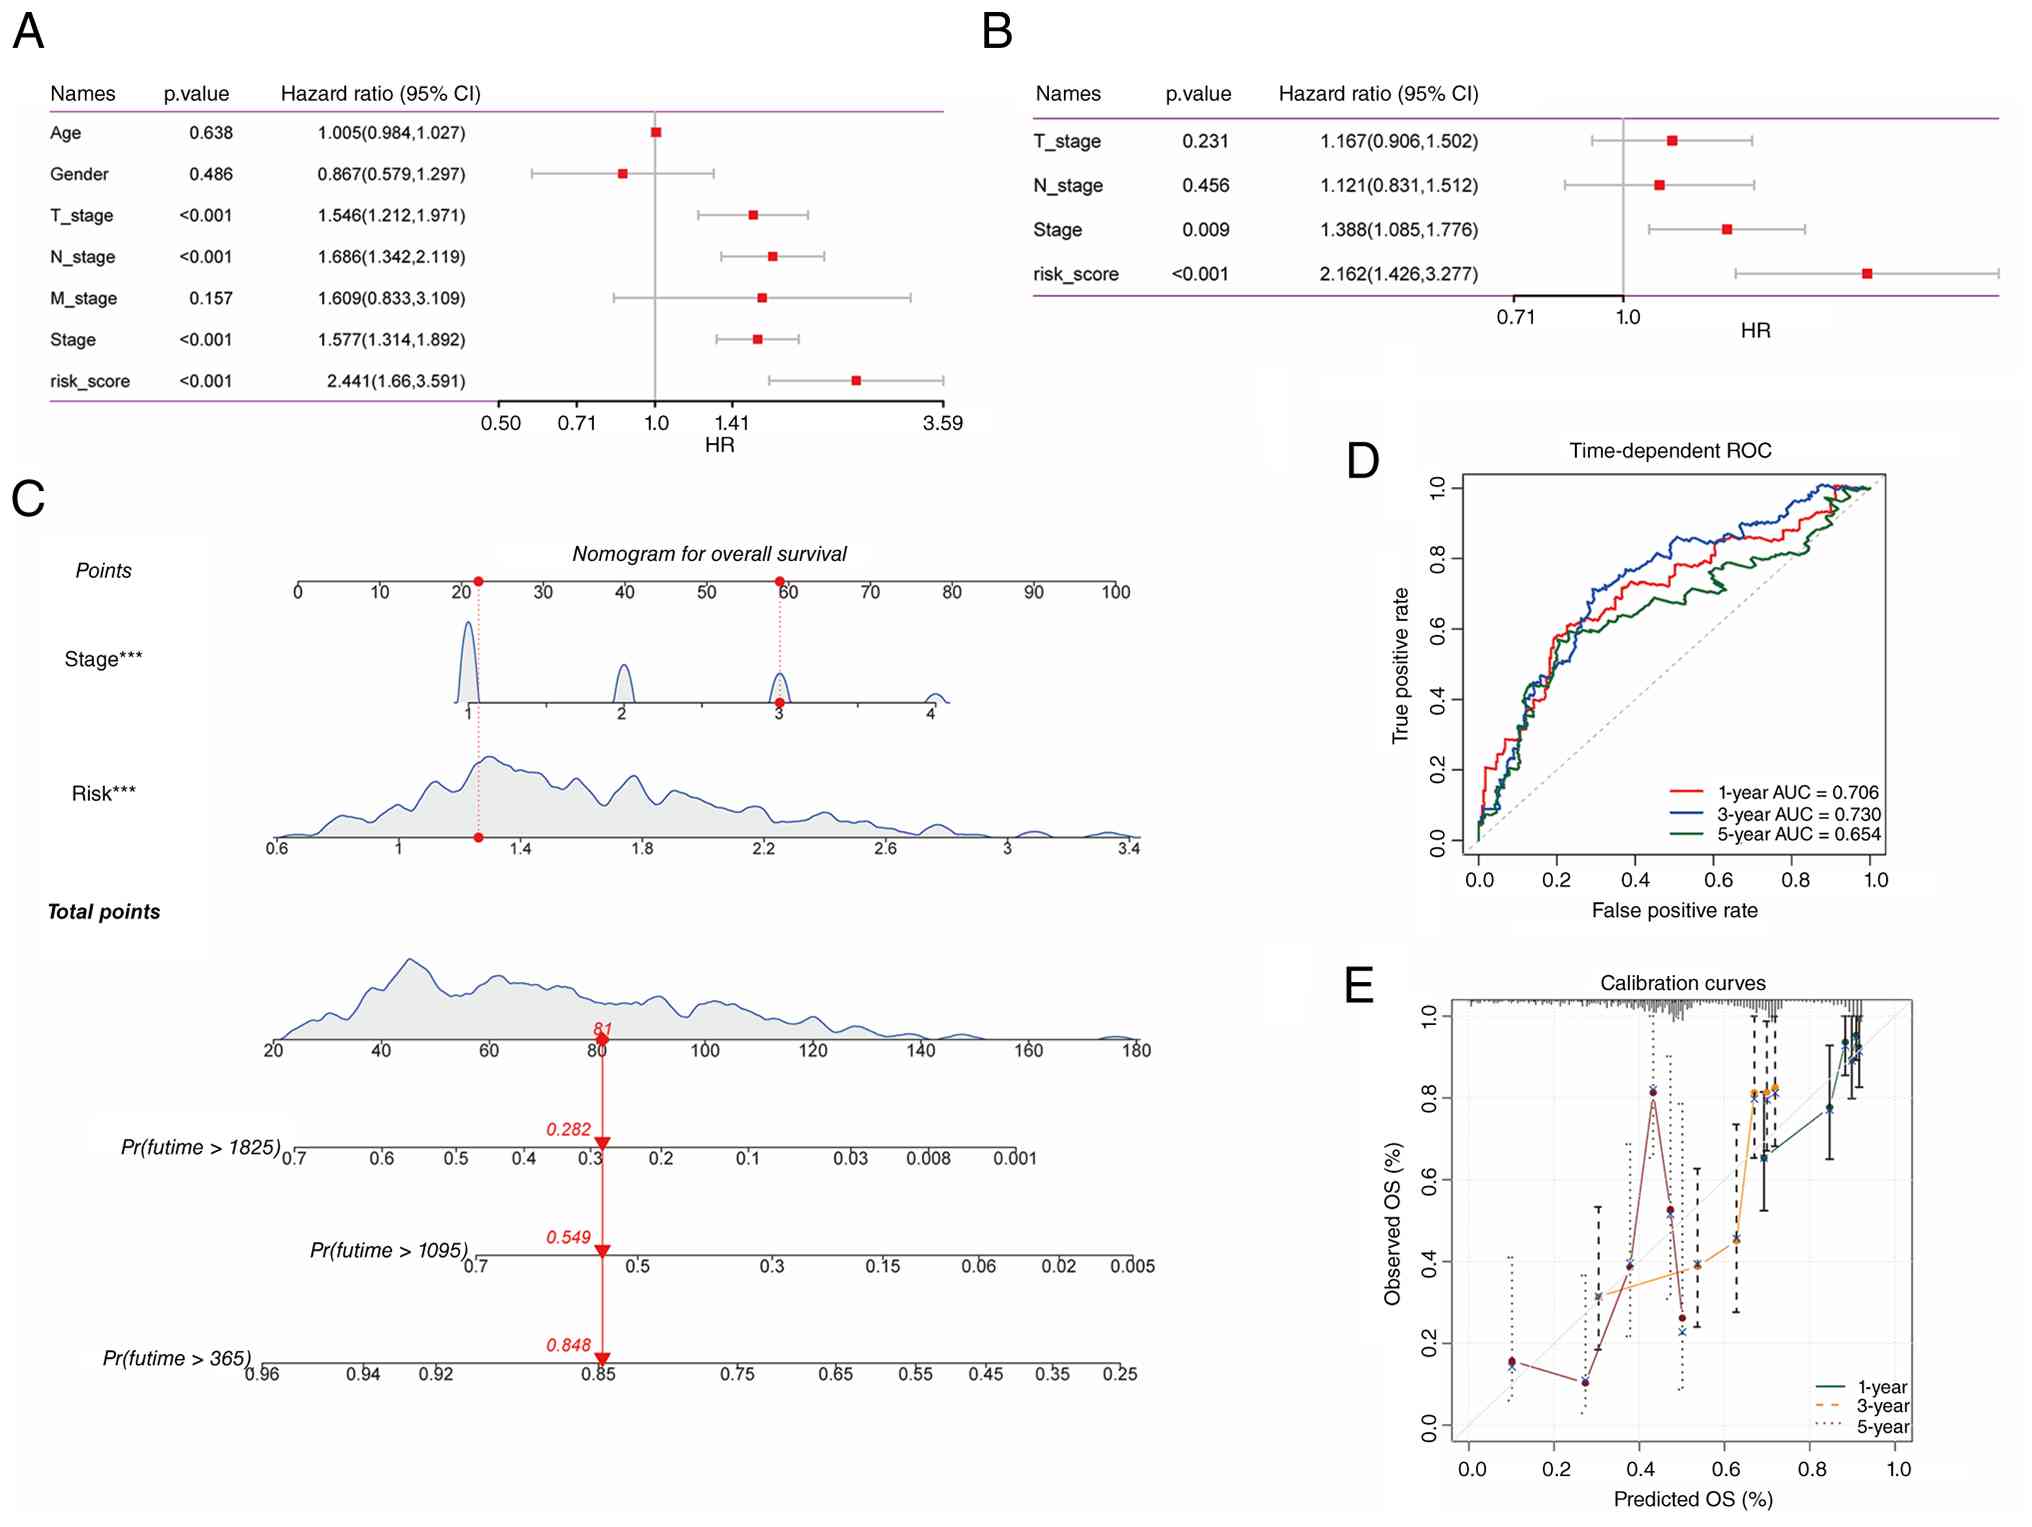
Clinical correlation analysis
Clinical relevance of the risk score was evaluated
in the TCGA cohort (n=500). Univariate Cox regression identified
tumor T stage, N stage, overall stage and the KRT risk score as
significant predictors of poor survival Fig. 4A), with the risk score exhibiting
the largest effect (HR=2.44). In multivariate analysis, the risk
score remained an independent prognostic factor (HR=2.16; 95%
CI:1.43–3.28), while T and N stages lost significance (Fig. 4B). Overall stage was significant
(HR=1.39), suggesting that the risk score offers complementary
prognostic value. A nomogram was then developed, integrating the
risk score and clinical stage to predict 1-, 3- and 5-year overall
survival (Fig. 4C). The nomogram
demonstrated moderate discrimination (AUCs=0.706, 0.730 and 0.654
at 1, 3 and 5 years; Fig. 4D), with
calibration curves showing good agreement between predicted and
observed outcomes (Fig. 4E). These
findings highlighted the potential of the KRT risk score to enhance
individualized survival predictions in LUAD.
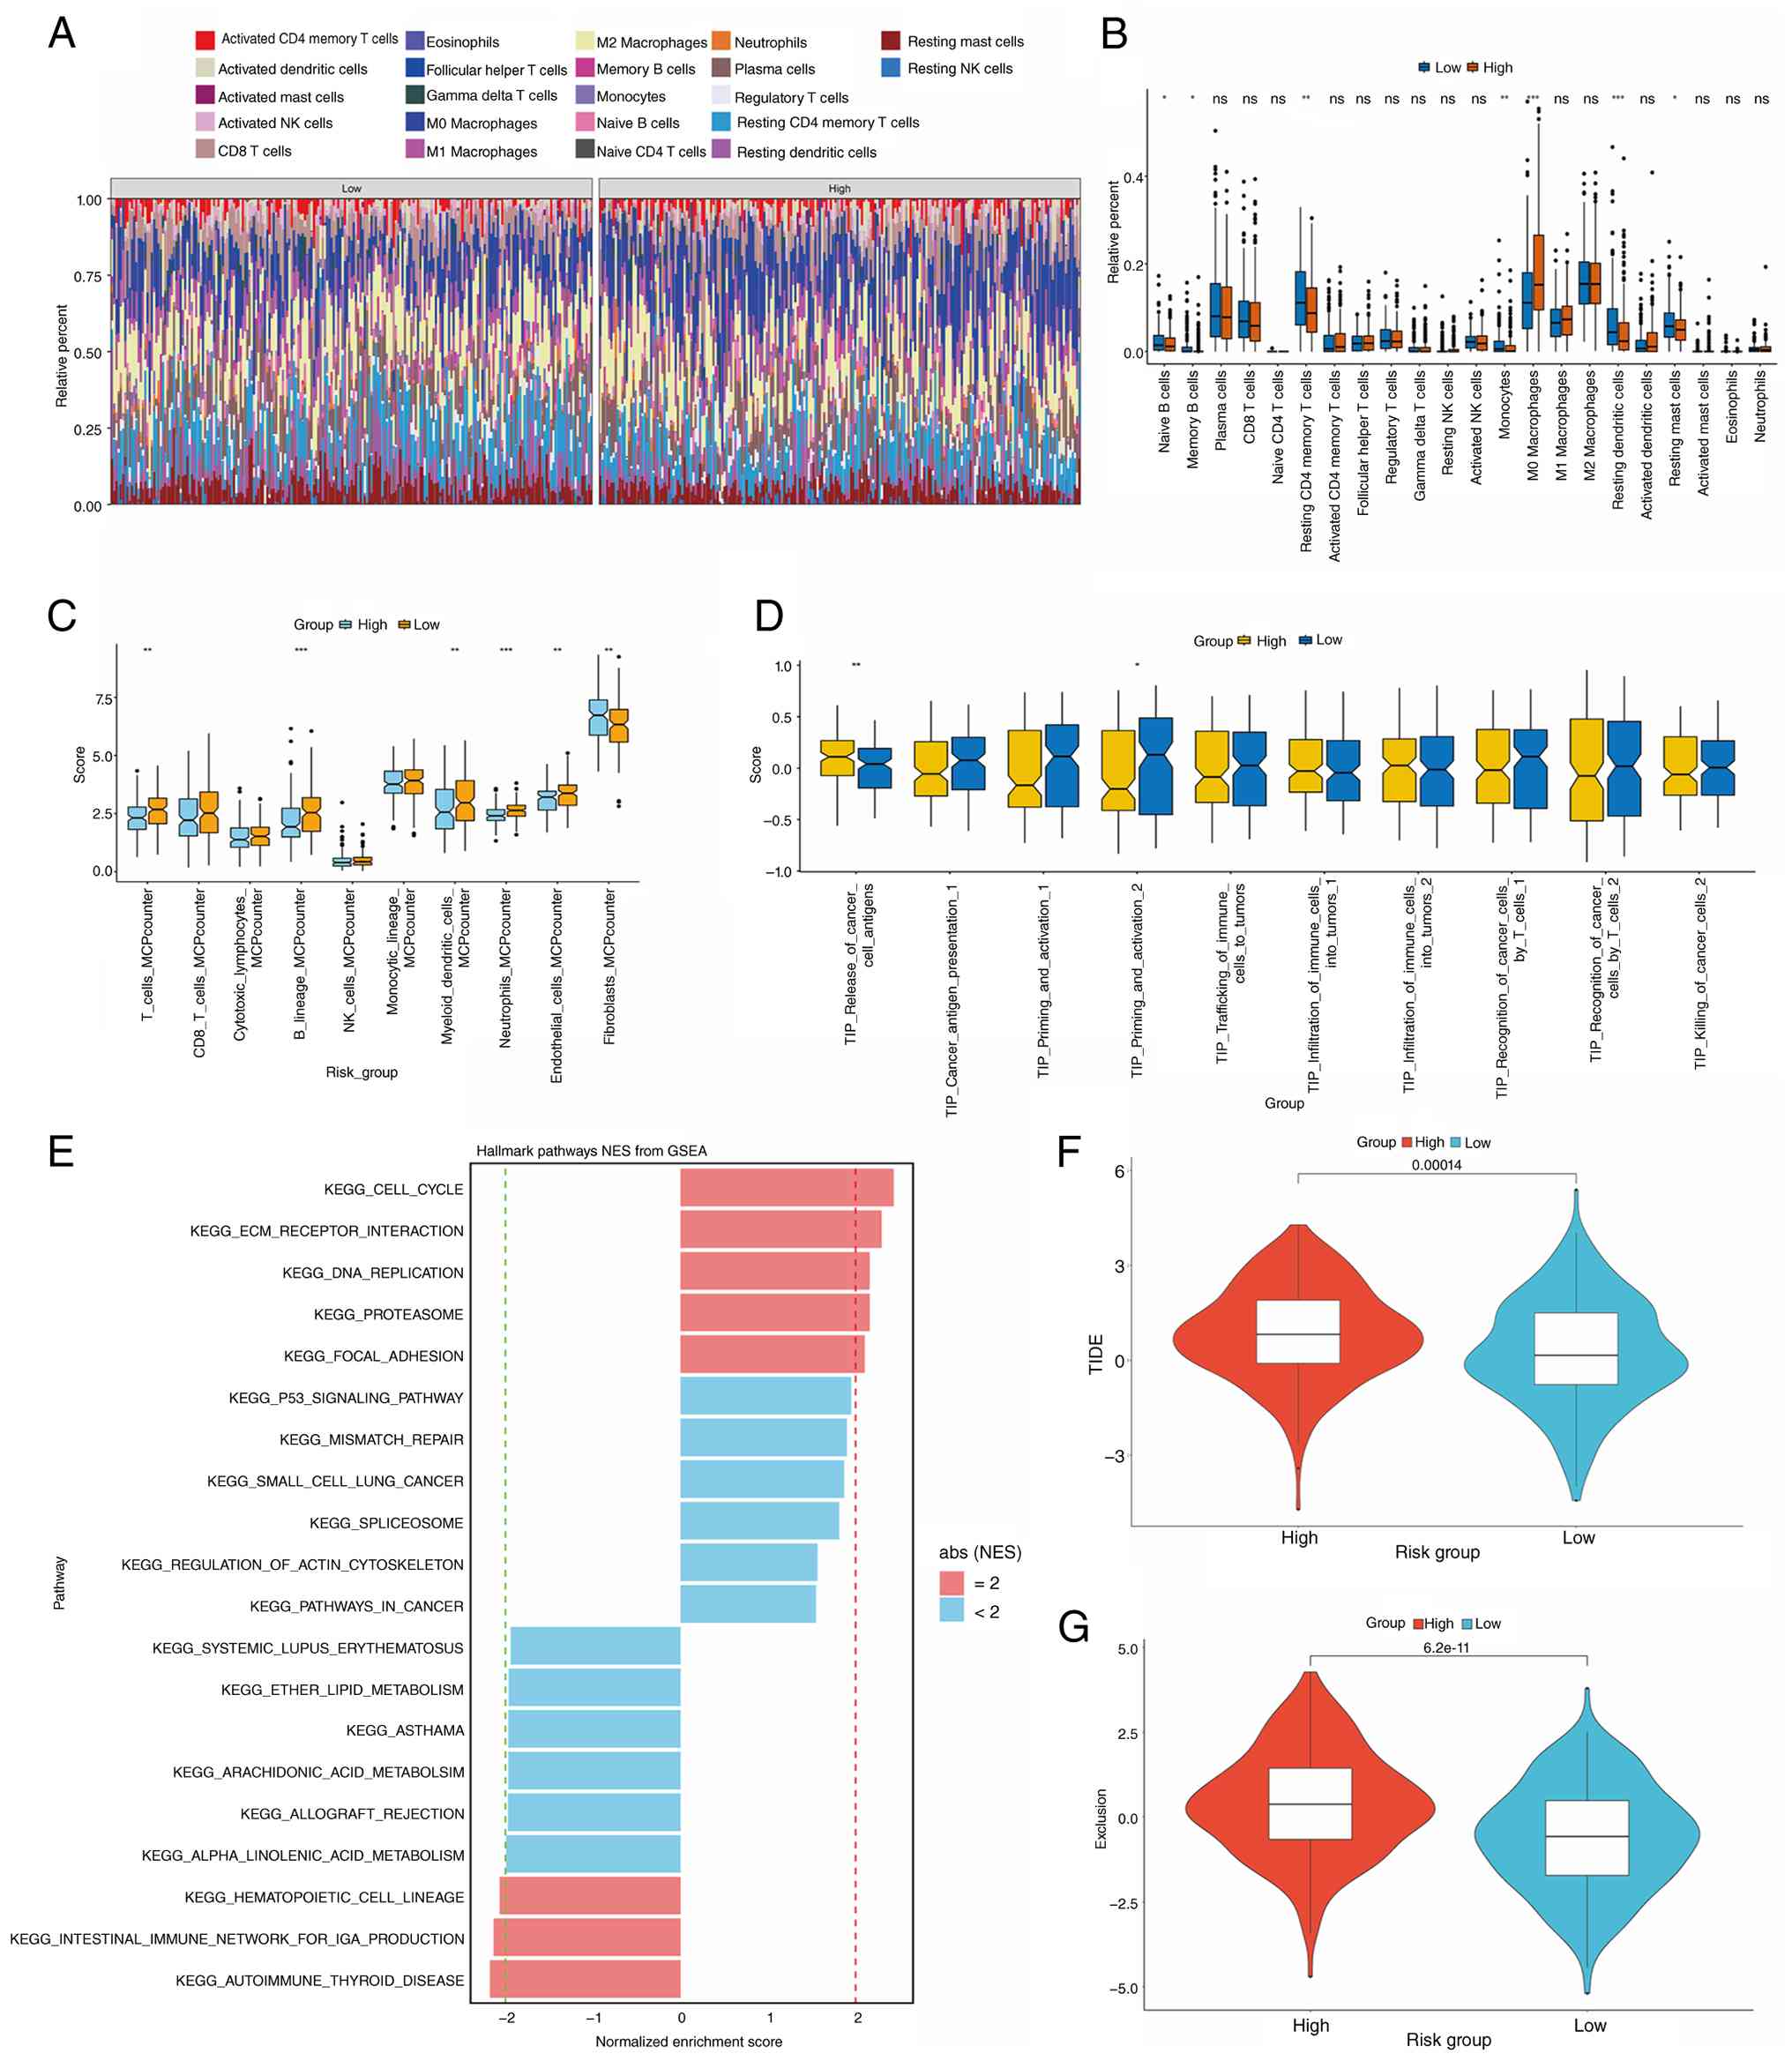
Immune microenvironment analysis
The tumor immune microenvironment was further
investigated in relation to the KRT risk score. CIBERSORT analysis
quantified the relative abundance of 22 immune cell subsets,
revealing that high-risk tumors had significantly lower levels of
CD4+ T cells, B cells, resting dendritic cells and resting mast
cells, while exhibiting higher proportions of M0 macrophages
compared with low-risk tumors (Fig. 5A
and B). Similarly, MCP-counter analysis of eight major immune
and stromal populations showed a marked reduction in cytotoxic
lymphocytes (including CD4+ T cells), B cells and dendritic cells,
along with increased infiltration of endothelial cells in high-risk
tumors (Fig. 5C). These results
suggested that the high-risk group is characterized by a more
immunosuppressive tumor microenvironment, marked by reduced
effector immune cell infiltration and an expanded stromal
compartment.
Immune-related pathways were further assessed using
ssGSEA (Fig. 5D). High-risk tumors
exhibited significantly lower enrichment of pathways involved in
antigen presentation and immune activation, reflecting impaired
antitumor immune responses. Moreover, immune checkpoint gene
profiling (Fig. S1) revealed
downregulation of several inhibitory receptors (such as BTLA,
BTNL9, CTLA4, BTN2A2 and BTNL3) alongside upregulation of
co-inhibitory ligands (PVR, CD276 and VTCN1) in high-risk tumors.
This altered checkpoint expression landscape suggests an adaptive
immune-escape mechanism. These immune landscape analyses reinforce
the conclusion that the KRT high-risk signature is associated with
an immune-cold, exclusionary tumor microenvironment.
GSEA and functional enrichment
analysis
GSEA of DEGs between the two risk groups revealed
distinct biological phenotypes. High-risk tumors were enriched in
pathways related to proliferation and invasion, including the cell
cycle, DNA repair, Extracellular Matrix (ECM)-receptor interaction,
focal adhesion and p53 signaling (Fig.
5E). By contrast, low-risk tumors were enriched in
immune-related pathways such as asthma, systemic lupus
erythematosus, Graves' disease and allograft rejection, indicating
a more active immune environment. These enrichments align with the
aggressive behavior of high-risk tumors and the robust immune
activity in low-risk tumors.
Immunotherapy response prediction
To predict response to immune checkpoint blockade,
the TIDE algorithm was applied. High-risk patients had
significantly higher overall TIDE scores (Fig. 5F) and higher T cell exclusion scores
(Fig. 5G) compared with low-risk
patients. This suggested that high-risk tumors were more prone to T
cell exclusion and dysfunction, potentially leading to poorer
responses to immunotherapy. In summary, the KRT risk signature may
identify patients less likely to benefit from immune checkpoint
inhibitors.
Drug sensitivity analysis
Using the NCI-60 pan-cancer cell line panel from the
CellMiner database, associations between the KRT signature and
chemotherapeutic drug sensitivity were explored. Across this
diverse collection of cancer cell lines, the KRT risk score showed
significant negative correlations with sensitivity to several
chemotherapeutic agents (Fig. S2),
suggesting that elevated expression of the KRT signature was
associated with chemotherapy resistance. These results implied that
patients with a high KRT risk score may have reduced responsiveness
to conventional chemotherapy, highlighting the need for alternative
therapeutic approaches.
Functional validation of KRT81 in LUAD
cells
Given its prognostic and diagnostic significance,
KRT81 was selected for experimental validation. KRT81 expression
was relatively high in LUAD cell lines A549, H1299 and NCI-H460
(Fig. 6A), as demonstrated by
RT-qPCR and western blotting A549 and H1299 cells were chosen for
further studies and shRNA-mediated KRT81 knockdown was confirmed by
RT-qPCR (Fig. 6B) and western
blotting (Fig. 6C). KRT81 silencing
significantly decreased cell viability in CCK-8 assays (Fig. 6D) and markedly increased apoptosis
in both cell lines (Fig. 6E and F).
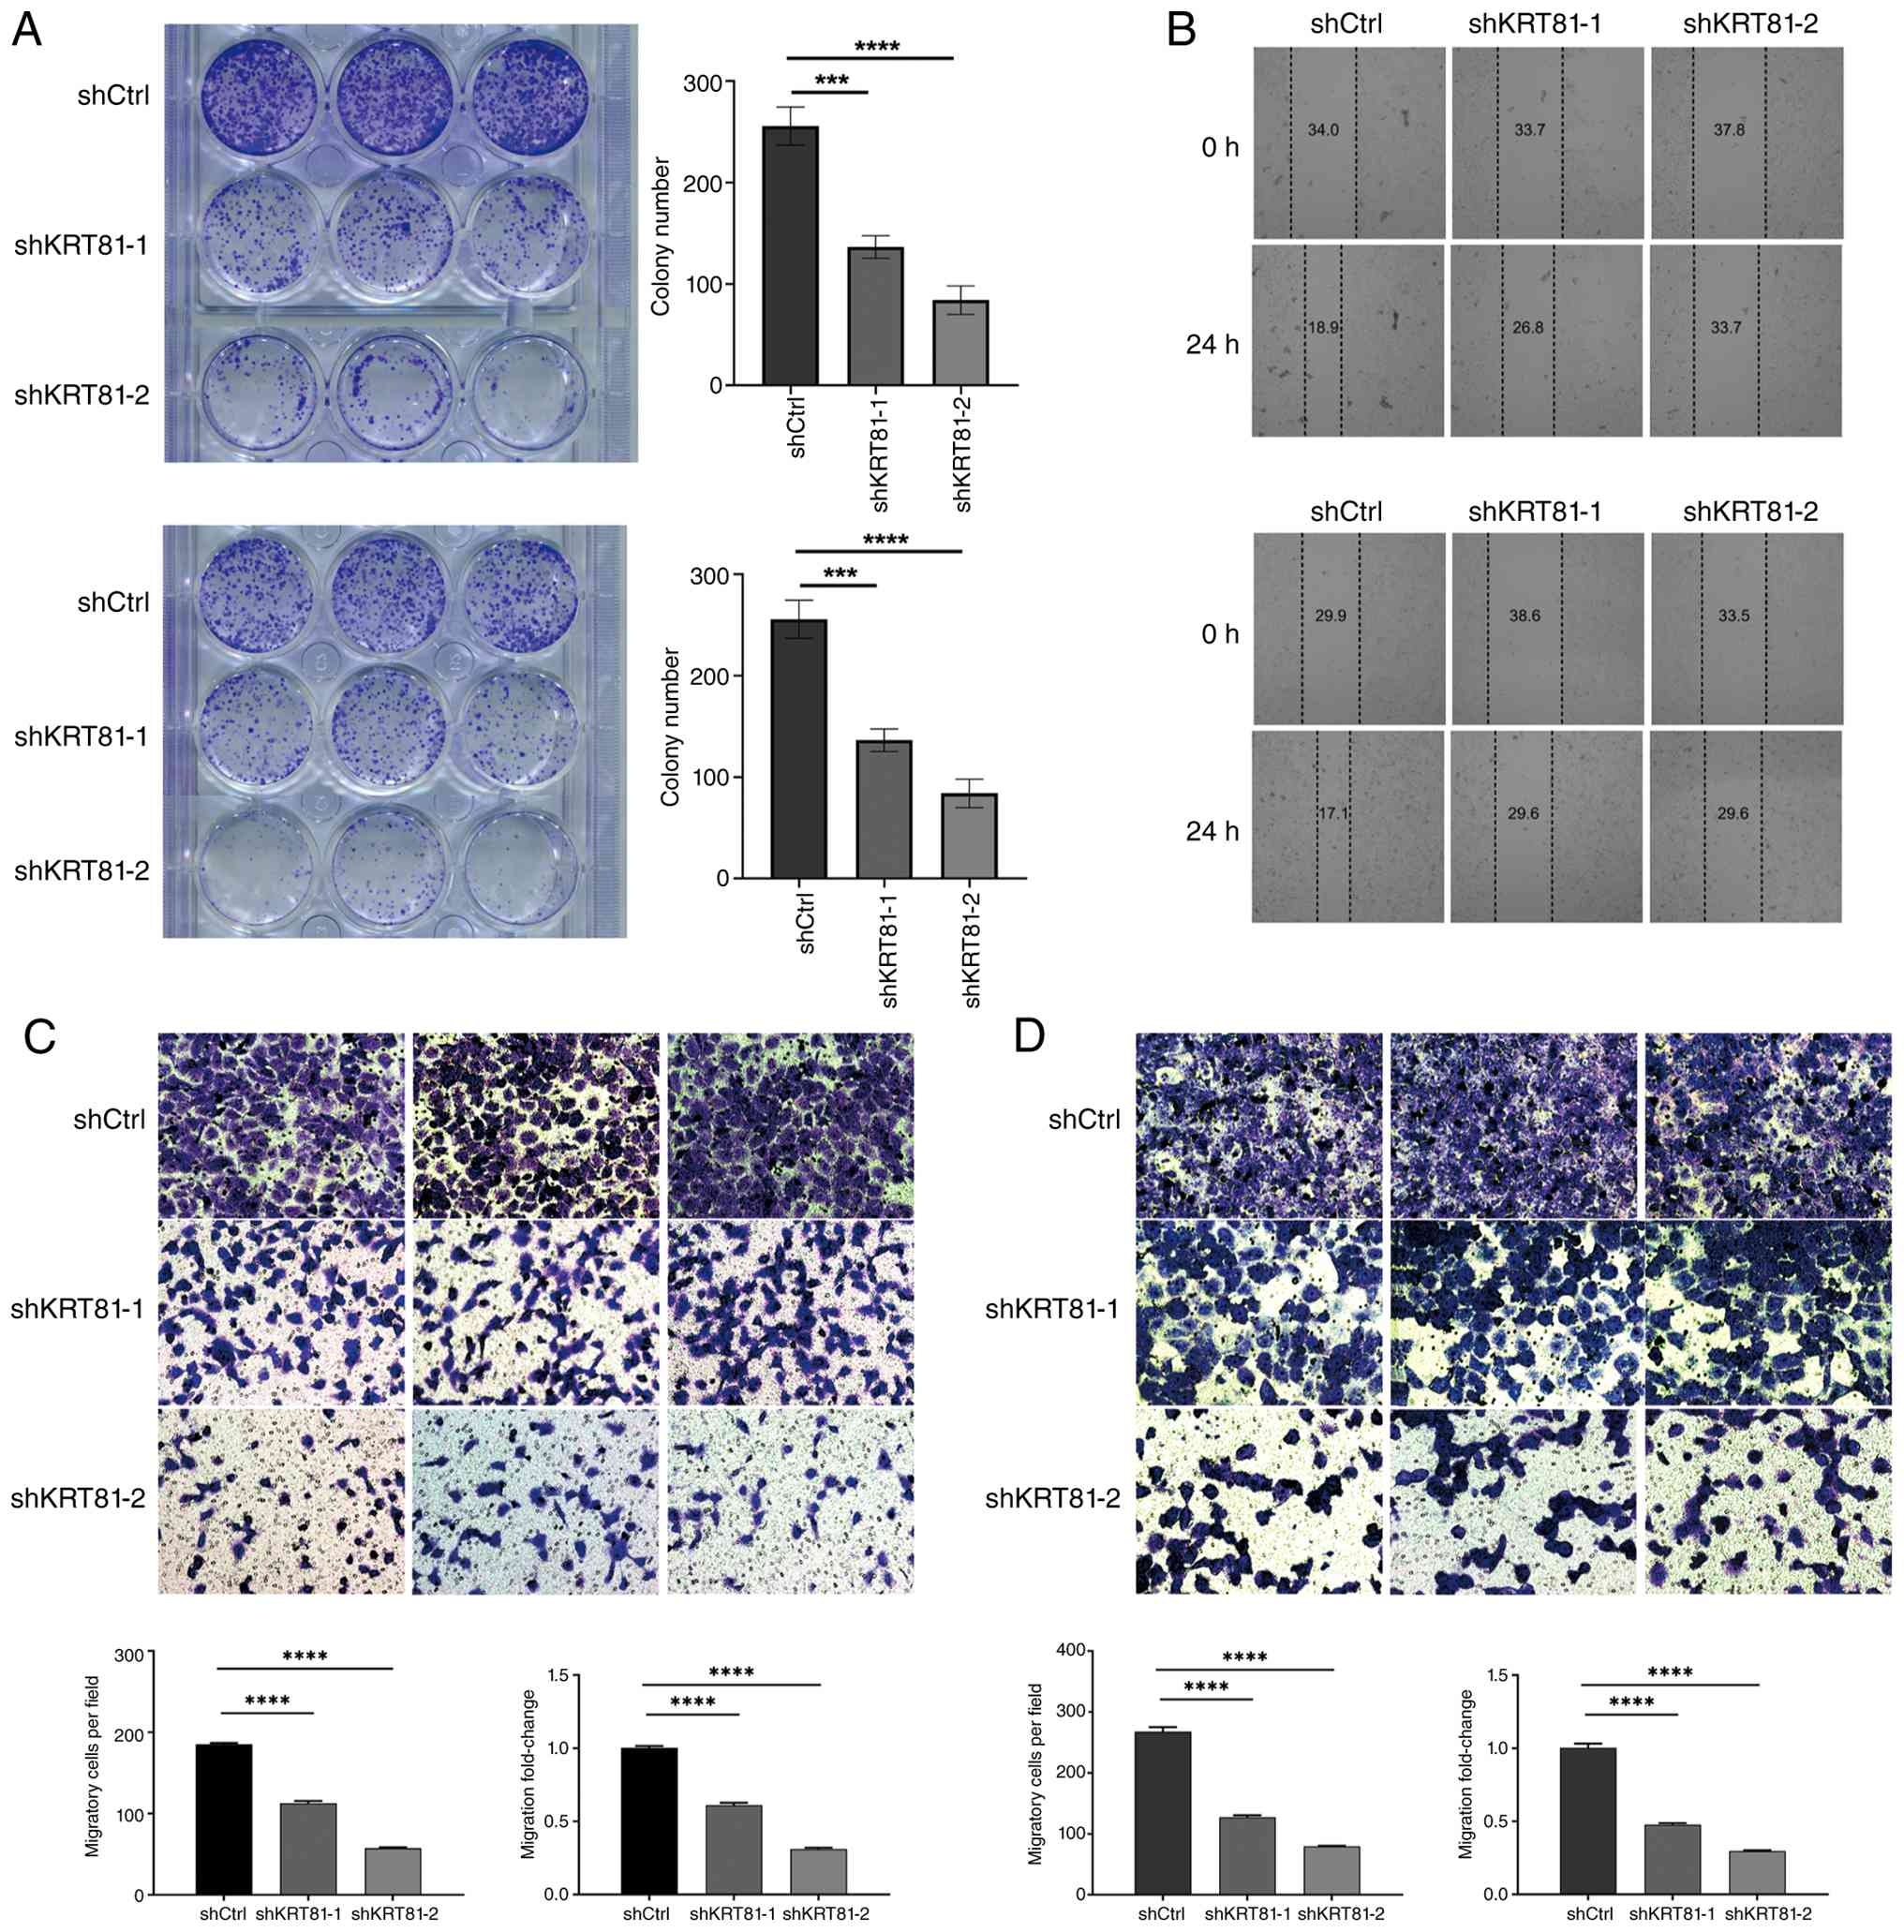
Colony formation assays revealed that KRT81 knockdown severely
impaired clonogenic growth of A549 and H1299 cells (Fig. 7A). Additionally, scratch
wound-healing (Fig. 7B) and
Transwell (Fig. 7C and D) assays
demonstrated that KRT81 depletion significantly suppressed cell
migration and invasion. These functional experiments indicate that
KRT81 promotes LUAD cell proliferation, survival and motility,
reinforcing its role as an oncogenic driver and a potential
therapeutic target in LUAD.
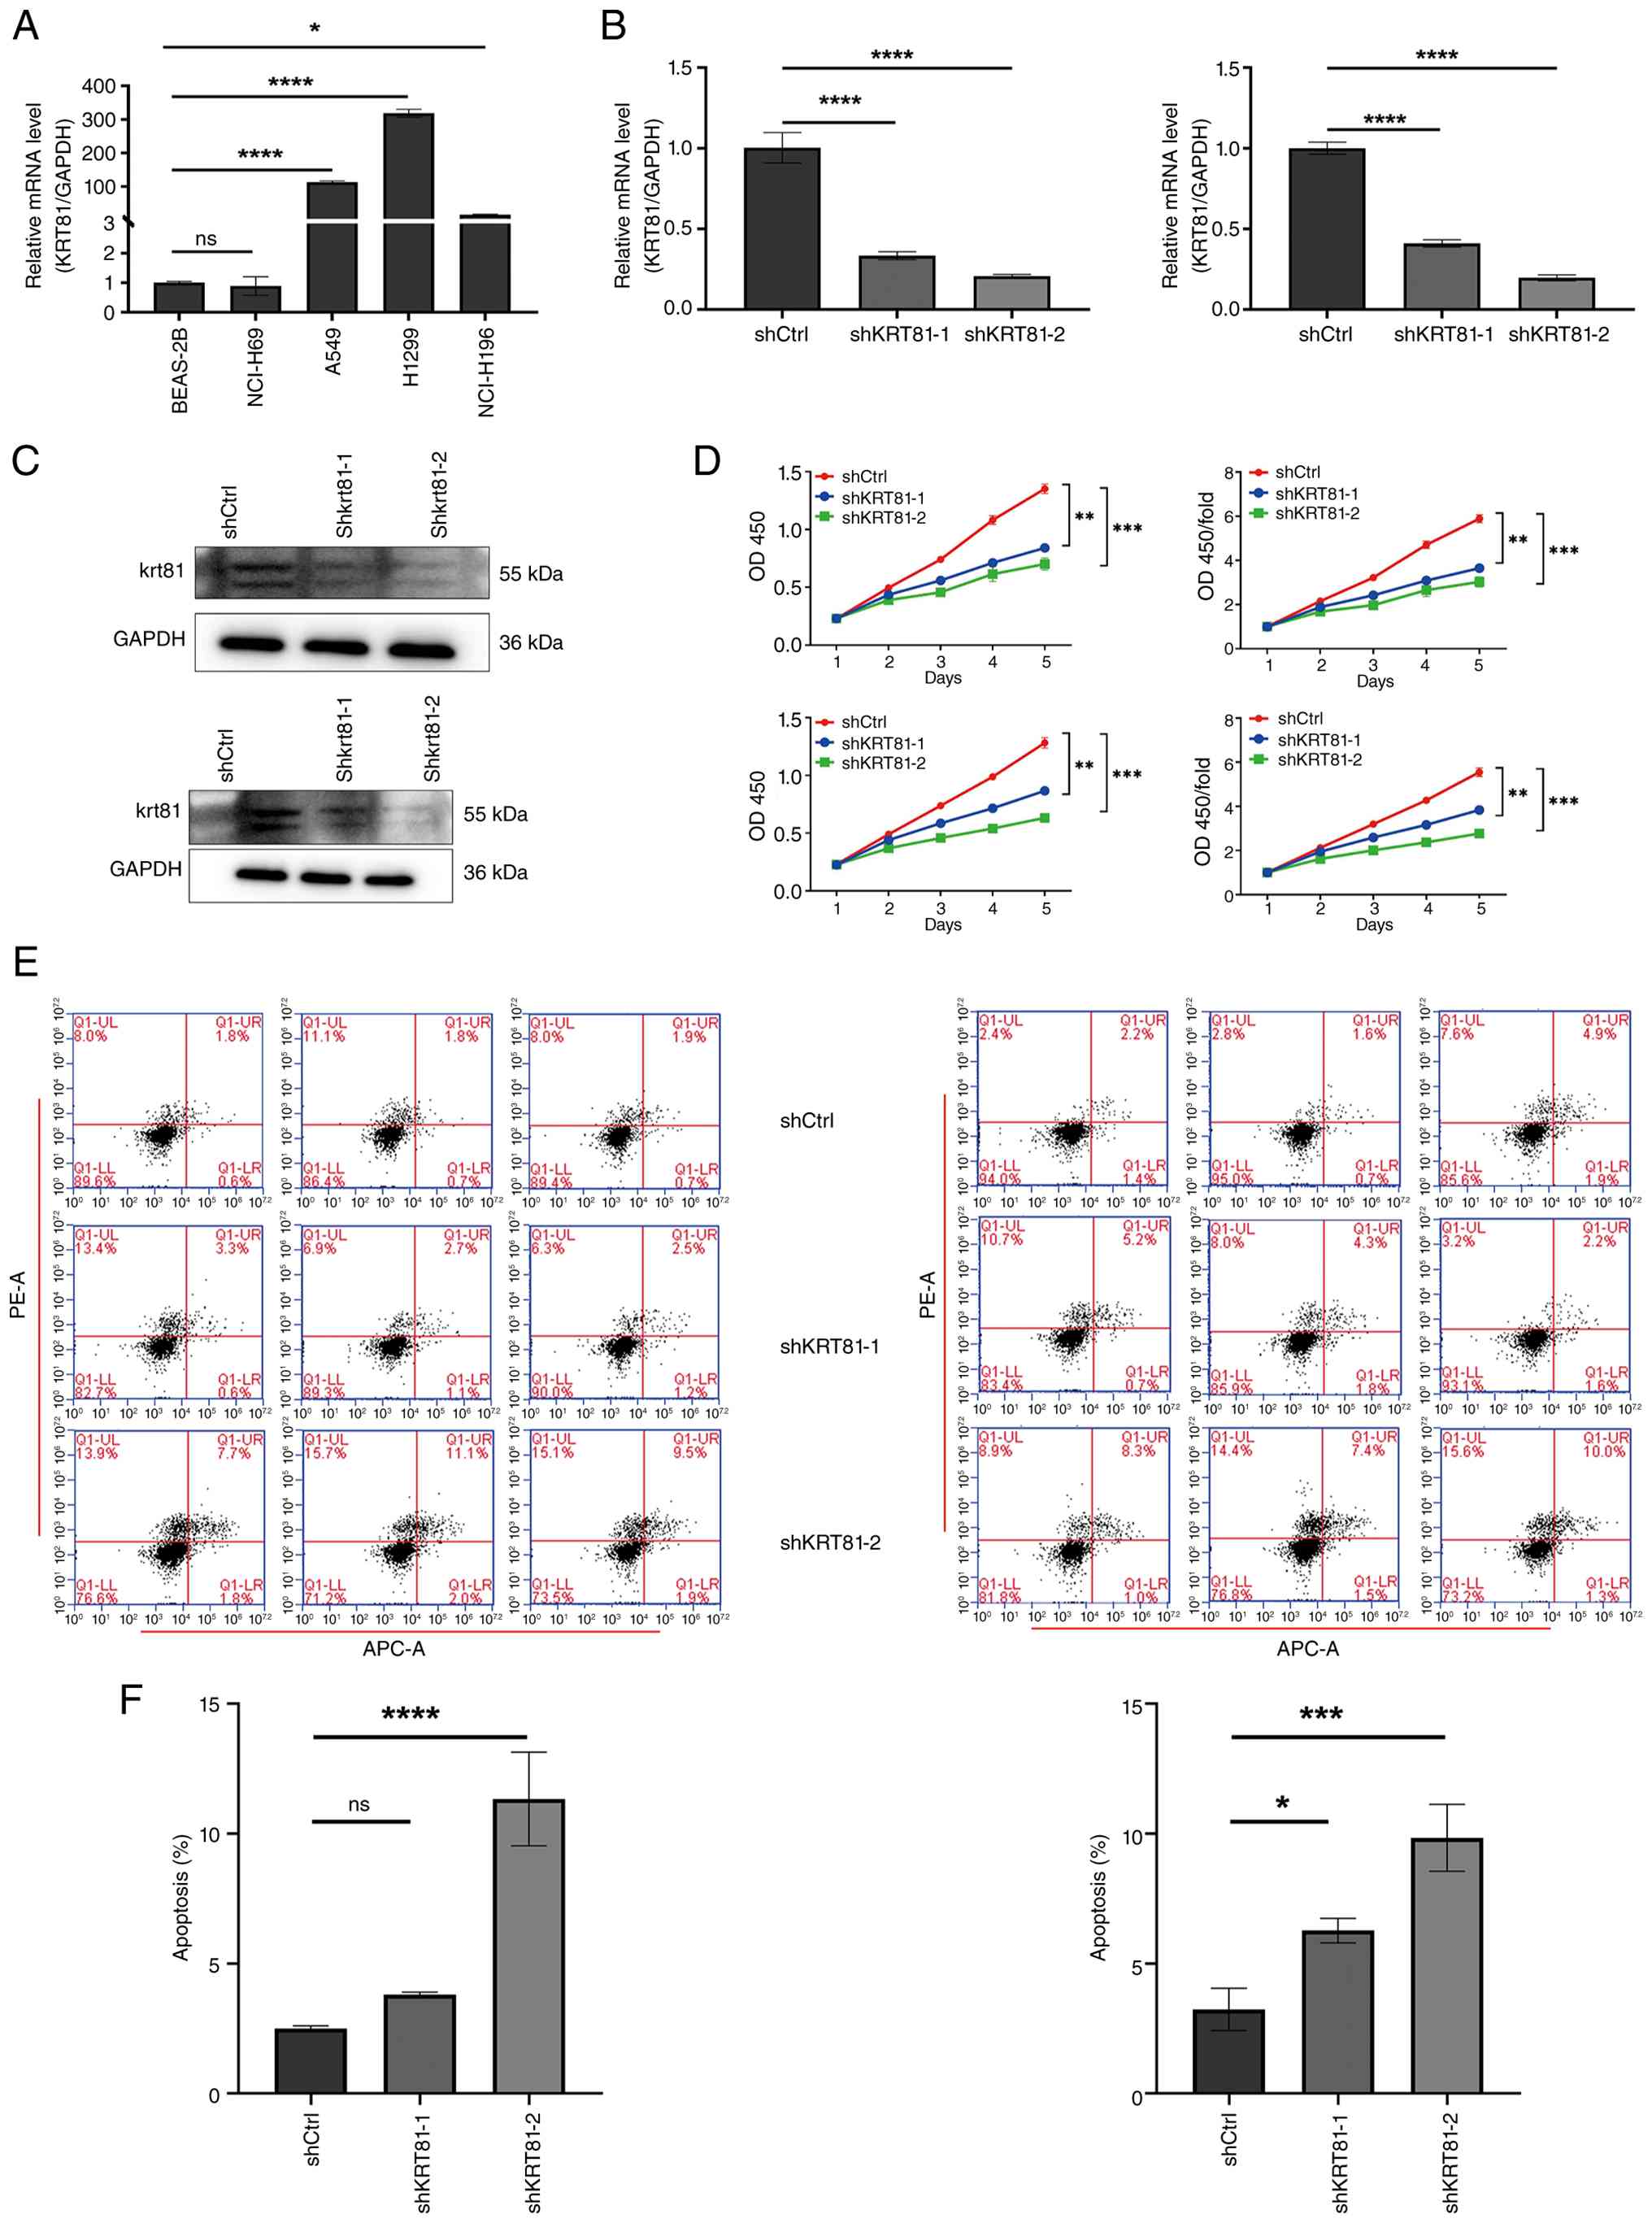 | Figure 6.KRT81 enhances proliferation and
inhibits apoptosis in A549 and H1299 cells. (A) qPCR analysis
revealed relatively high endogenous expression of KRT81 in A549 and
H1299 cells (P<0.05). (B) qPCR validation of KRT81
downregulation following shRNA transfection (left panel, A549;
right panel, H1299). (C) Western blotting confirming KRT81
knockdown at the protein level (top panel, A549; bottom panel,
H1299). (D) CCK-8 assays demonstrated significantly reduced cell
viability upon KRT81 silencing (top panel, A549; bottom panel,
H1299). (E) Flow cytometry and (F) analysis showed a significant
increase in apoptosis rates in KRT81 knockdown groups, with bar
graphs comparing apoptosis percentages between groups (left panel,
A549; right panel, H1299). *P<0.05, **P<0.01, ***P<0.001,
****P<0.0001; ns, not significant. qPCR, quantitative PCR. |
Discussion
The present study systematically evaluated the
diagnostic and prognostic relevance of KRT family genes in LUAD,
highlighting their close association with the tumor immune
microenvironment. A multi-gene diagnostic signature derived from
machine learning approaches demonstrated robust classification
performance across independent cohorts, underscoring the potential
of KRT-related markers for early detection. In parallel, a
parsimonious four-gene prognostic model enabled effective risk
stratification and showed consistent survival discrimination across
datasets, suggesting its potential utility in prognostic
assessment. The prognostic risk score remained an independent
predictor in multivariate analyses, suggesting it could complement
conventional TNM staging.
Previous studies have shown that KRT family members
play important roles in various malignancies (9,11), but
their mechanisms in LUAD remain unclear. KRT16 is upregulated in
metastatic lung cancer tissues and correlates with poor overall
survival; mechanistically, it interacts with vimentin to stabilize
its expression and promote EMT (31). KRT27 has been associated with
prolonged progression-free survival in NSCLC patients receiving
anti-PD-1 immunotherapy, suggesting its potential as a biomarker
for immunotherapy response (32).
KRT80 is highly expressed across multiple tumor types and its
upregulation promotes cancer cell proliferation, invasion and
migration, correlating with poor prognosis (33). By contrast, KRT81 exhibits both
oncogenic and immune-evasive properties; its overexpression is
strongly associated with immune-exclusion phenotypes and may
influence immunotherapy responsiveness (34). Based on these observations, KRT81
was prioritized for functional validation due to its strongest
prognostic association among KRT family members and its top
contribution in the XGBoost diagnostic model.
Mechanistically, high-risk tumors exhibited
enrichment in proliferation- and stroma-associated pathways,
including cell cycle regulation, DNA repair, ECM-receptor
interaction, focal adhesion and p53 signaling. These enrichments
are consistent with previous findings linking aberrant KRT
expression to cytoskeletal remodeling and EMT, supporting the
hypothesis that KRT dysregulation promotes invasion and progression
via EMT-associated mechanisms (35,36).
In parallel, shRNA-mediated KRT81 knockdown in LUAD cell lines
significantly reduced proliferation, migration and clonogenic
growth while increasing apoptosis. These data provide experimental
validation that KRT81 contributes to malignant phenotypes and may
serve as a potential therapeutic target.
Immune landscape analysis further revealed that
high-risk tumors display an immune-cold or immune-rejection
phenotype, characterized by reduced effector lymphocyte (T and B
cell) infiltration (37,38), downregulated antigen-presentation
and immune-activation pathways, increased endothelial cell
abundance and elevated TIDE scores, suggesting a potential for
decreased responsiveness to immune checkpoint blockade based on
computational inference. These findings were consistent with the
hypothesis that KRTs play a role in immune and inflammatory
regulation. In this context, KRTs such as KRT6, KRT16 and KRT17 act
as barrier alarmins and are involved in cytokine signaling,
including IL-18 pathway (13,39,40).
Abnormal KRT expression may facilitate immune escape by altering
chemokine/cytokine secretion or remodeling the extracellular
matrix, thus impairing effector immune cell recruitment and
function (41). These data suggest
that KRTs play roles beyond structural support, warranting further
investigation into their contribution to immune microenvironment
remodeling. Drug sensitivity analysis revealed that elevated KRT
risk scores negatively correlated with sensitivity to several
chemotherapeutic agents, indicating an association between high KRT
expression and chemotherapy resistance. Notably, this evidence is
derived from pan-cancer cell line datasets, which are not
LUAD-specific and should be interpreted with caution.
Despite its modest standalone predictive
performance, the KRT score. may serve as a complementary biomarker,
facilitating the refinement of risk stratification through
integration into a nomogram when used in conjunction with
pathological stage. Clinically, the signature aids in risk
stratification and treatment decision. The exploration of this
scoring system in combination with immunotherapy-related
biomarkers, such as PD-L1 expression and tumor mutation burden, has
the potential to optimize patient selection for immunotherapy.
Overall, the present study was largely consistent with previous
studies indicating that KRT family members contribute to tumor
progression, EMT and immune regulation. The findings largely
corroborated previous studies demonstrating that individual KRT
genes contribute to tumor progression, EMT and immune regulation.
For instance, surface-expressed KRT8/18/19 can physically mask HLA
I molecules or sequester chemokines such as CXCL12, thereby
impairing CD8+ T cell recognition and facilitating immune escape
(42,43). Similarly, elevated KRT expression
has been linked to activation of EMT-associated pathways, including
TGF-β and WNT/β-catenin signaling, which promote tumor invasiveness
and stemness (9). Notably, prior
research, including KGS-based analyses in LUAD, primarily
emphasizes prognostic assessment and EMT-related mechanisms,
without systematically evaluating the immune microenvironment. By
contrast, the present study integrated multi-gene KRT signatures
with comprehensive immune landscape analysis, providing a more
holistic view of how KRT dysregulation drives both EMT and immune
exclusion. Nevertheless, critical gaps remain, particularly
regarding the precise molecular mechanisms mediating KRT-driven
immune evasion and the lack of LUAD-specific immunotherapy
validation, highlighting key directions for future
investigation.
The present study presented several innovations.
Systematic comparison of 101 machine learning models minimized
algorithm selection bias and enhanced model robustness, while
SHAP-based interpretability improved transparency and biological
understanding of the predictive models. Furthermore, the
integration of diagnostic modeling, prognostic stratification and
immune microenvironment analysis provided a comprehensive framework
for understanding the multifaceted roles of KRTs in LUAD. Compared
with previous studies focusing on individual KRT genes, the present
study systematically integrated multi-gene, diagnostic, prognostic
and immune features, highlighting the knowledge gap in mechanisms
linking KRT dysregulation to immune exclusion and microenvironment
remodeling. The present study has several limitations. First, it
relied on retrospective bulk transcriptomic data, which may
introduce selection bias, Second, the immunotherapy-related
conclusions were primarily based on computational prediction (such
TIDE) rather than real-world LUAD immunotherapy cohorts, indicating
potential rather than definitive predictive power. Third, immune
deconvolution analyses provide indirect inferences and cannot
resolve complex intercellular interactions; integration with
single-cell and spatial omics is necessary for precise mapping of
KRT-associated immune modulation. Fourth, functional validation was
limited to KRT81 and the biological roles of KRT16, KRT27 and KRT80
remain untested. Moreover, in vivo validation was lacking; although
the in vitro experiments demonstrated that KRT81 promoted malignant
phenotypes in LUAD cell lines, animal models are necessary to
confirm its contributions to tumor growth and immune modulation in
a physiologically relevant context. Five, the precise molecular
mechanisms by which KRT dysregulation influences chemokine
secretion, antigen presentation and immune cell infiltration remain
to be elucidated. In conclusion, the present study proposed and
validated a four-gene KRT signature that integrated diagnostic,
prognostic and immune microenvironment data, supporting the notion
that KRTs may function as both drivers of invasion and modulators
of immune response in LUAD. Future efforts should prioritize
prospective clinical validation, in-depth single-cell and spatial
mechanistic studies and clinical evaluation of combination
therapies targeting the KRT-microenvironment axis to improve
outcomes for patients with LUAD.
Supplementary Material
Supporting Data
Supporting Data
Supporting Data
Supporting Data
Acknowledgements
Not applicable.
Funding
The present study was supported by the Precision Medicine
Project of Wuxi Health Commission (grant no. JZYX04).
Availability of data and materials
Public datasets analysed in the current study are
available from The Cancer Genome Atlas and Gene Expression Omnibus
under accession number TCGA-LUAD, GSE31210 and GSE72094or at the
following URL: portal.gdc.cancer.gov/projects/TCGA-LUAD,
ncbi.nlm.nih.gov/geo/query/acc.cgi?acc=GSE31210 and
ncbi.nlm.nih.gov/geo/query/acc.cgi?acc=GSE72094. The data generated
in the present study may be requested from the corresponding
author.
Authors' contributions
QL analyzed data and edited the manuscript. AC
performed experiments, statistical analysis and original draft
preparation. TG and FL performed experiments and manuscript review
and editing. MZ performed experiments. RB performed experiments and
statistical analysis. QL and AC confirm the authenticity of all the
raw data. All authors have read and approved the final
manuscript.
Ethics approval and consent to
participate
Not applicable.
Patient consent for publication
Not applicable.
Competing interests
The authors declare that they have no competing
interests.
References
|
1
|
Siegel RL, Miller KD, Wagle NS and Jemal
A: Cancer statistics, 2023. CA Cancer J Clin. 73:17–48.
2023.PubMed/NCBI
|
|
2
|
Herbst RS, Morgensztern D and Boshoff C:
The biology and management of non-small cell lung cancer. Nature.
553:446–454. 2018. View Article : Google Scholar : PubMed/NCBI
|
|
3
|
Gandhi L, Rodriguez-Abreu D, Gadgeel S,
Esteban E, Felip E, De Angelis F, Domine M, Clingan P, Hochmair MJ,
Powell SF, et al: Pembrolizumab plus chemotherapy in metastatic
non-small-cell lung cancer. N Engl J Med. 378:2078–2092. 2018.
View Article : Google Scholar : PubMed/NCBI
|
|
4
|
Gao Y, Feng Z, Zhao H, Liu X, Zhu M, Yu X,
Liu X, Wu X and Tao J: Integrating single-cell RNA-seq and bulk
RNA-seq to explore prognostic value and immune landscapes of
methionine metabolism-related signature in breast cancer. Front
Genet. 15:15212692024. View Article : Google Scholar : PubMed/NCBI
|
|
5
|
Sun D, Duan X, Li N, Qiao O, Hou Y, Ma Z,
Liu S, Gong Y and Liu Z: Construction of ubiquitination-related
risk model for predicting prognosis in lung adenocarcinoma. Sci
Rep. 15:117872025. View Article : Google Scholar : PubMed/NCBI
|
|
6
|
Jacob JT, Coulombe PA, Kwan R and Omary
MB: Types I and II Keratin Intermediate Filaments. Cold Spring Harb
Perspect Biol. 10:a0182752018. View Article : Google Scholar : PubMed/NCBI
|
|
7
|
Dmello C, Srivastava SS, Tiwari R,
Chaudhari PR, Sawant S and Vaidya MM: Multifaceted role of keratins
in epithelial cell differentiation and transformation. J Biosci.
44:332019. View Article : Google Scholar : PubMed/NCBI
|
|
8
|
Nowak E and Bednarek I: Aspects of the
epigenetic regulation of EMT related to cancer metastasis. Cells.
10:34352021. View Article : Google Scholar : PubMed/NCBI
|
|
9
|
Li G, Guo J, Mou Y, Luo Q, Wang X, Xue W,
Hou T, Zeng T and Yang Y: Keratin gene signature expression drives
epithelial-mesenchymal transition through enhanced TGF-β signaling
pathway activation and correlates with adverse prognosis in lung
adenocarcinoma. Heliyon. 10:e245492024. View Article : Google Scholar : PubMed/NCBI
|
|
10
|
Divate M, Tyagi A, Richard DJ, Prasad PA,
Gowda H and Nagaraj SH: Deep Learning-based Pan-cancer
classification model reveals tissue-of-origin specific gene
expression signatures. Cancers (Basel). 14:11852022. View Article : Google Scholar : PubMed/NCBI
|
|
11
|
Hosseinalizadeh H, Hussain QM, Poshtchaman
Z, Ahsan M, Amin AH, Naghavi S and Mahabady MK: Emerging insights
into keratin 7 roles in tumor progression and metastasis of
cancers. Front Oncol. 13:12438712023. View Article : Google Scholar : PubMed/NCBI
|
|
12
|
Konstantakou EG, Velentzas AD,
Anagnostopoulos AK, Litou ZI, Konstandi OA, Giannopoulou AF,
Anastasiadou E, Voutsinas GE, Tsangaris GT and Stravopodis DJ:
Deep-proteome mapping of WM-266-4 human metastatic melanoma cells:
From oncogenic addiction to druggable targets. PLoS One.
12:e01715122017. View Article : Google Scholar : PubMed/NCBI
|
|
13
|
Shi P, Chen W, Lyu X, Wang Z, Li W, Jia F,
Zheng C, Liu T, Wang C, Zhang Y, et al: Loss-of-function mutations
in Keratin 32 gene disrupt skin immune homeostasis in pityriasis
rubra pilaris. Nat Commun. 15:62592024. View Article : Google Scholar : PubMed/NCBI
|
|
14
|
Jin L and Wang G: Keratin 17: A critical
player in the pathogenesis of psoriasis. Med Res Rev. 34:438–454.
2014. View Article : Google Scholar : PubMed/NCBI
|
|
15
|
Mommers JM, van Rossum MM, van Erp PE and
van De Kerkhof PC: Changes in keratin 6 and keratin 10
(co-)expression in lesional and symptomless skin of spreading
psoriasis. Dermatology. 201:15–20. 2000. View Article : Google Scholar : PubMed/NCBI
|
|
16
|
Sequeira I, Neves JF, Carrero D, Peng Q,
Palasz N, Liakath-Ali K, Lord GM, Morgan PR, Lombardi G and Watt
FM: Immunomodulatory role of Keratin 76 in oral and gastric cancer.
Nat Commun. 9:34372018. View Article : Google Scholar : PubMed/NCBI
|
|
17
|
Sequeira I and Watt FM: The role of
keratins in modulating carcinogenesis via communication with cells
of the immune system. Cell Stress. 3:136–138. 2019. View Article : Google Scholar : PubMed/NCBI
|
|
18
|
Lee CM, Barber GP, Casper J, Clawson H,
Diekhans M, Gonzalez JN, Hinrichs AS, Lee BT, Nassar LR, Powell CC,
et al: UCSC Genome Browser enters 20th year. Nucleic Acids Res.
48:D756–D761. 2020.PubMed/NCBI
|
|
19
|
Barrett T, Wilhite SE, Ledoux P,
Evangelista C, Kim IF, Tomashevsky M, Marshall KA, Phillippy KH,
Sherman PM, Holko M, et al: NCBI GEO: Archive for functional
genomics data sets-update. Nucleic Acids Res. 41:D991–D995. 2013.
View Article : Google Scholar : PubMed/NCBI
|
|
20
|
Zhou K, Qin L, Chen Y, Gao H, Ling Y, Qin
Q, Mou C, Qin T and Lu J: A machine learning model for predicting
acute respiratory distress syndrome risk in patients with sepsis
using circulating immune cell parameters: A retrospective study.
BMC Infect Dis. 25:5682025. View Article : Google Scholar : PubMed/NCBI
|
|
21
|
Zeng D, Ye Z, Shen R, Yu G, Wu J, Xiong Y,
Zhou R, Qiu W, Huang N, Sun L, et al: IOBR: Multi-omics
Immuno-oncology biological research to decode tumor
microenvironment and signatures. Front Immunol. 12:6879752021.
View Article : Google Scholar : PubMed/NCBI
|
|
22
|
Newman AM, Liu CL, Green MR, Gentles AJ,
Feng W, Xu Y, Hoang CD, Diehn M and Alizadeh AA: Robust enumeration
of cell subsets from tissue expression profiles. Nat Methods.
12:453–457. 2015. View Article : Google Scholar : PubMed/NCBI
|
|
23
|
Helmink BA, Reddy SM, Gao J, Zhang S,
Basar R, Thakur R, Yizhak K, Sade-Feldman M, Blando J, Han G, et
al: B cells and tertiary lymphoid structures promote immunotherapy
response. Nature. 577:549–555. 2020. View Article : Google Scholar : PubMed/NCBI
|
|
24
|
Yi M, Nissley DV, McCormick F and Stephens
RM: ssGSEA score-based Ras dependency indexes derived from gene
expression data reveal potential Ras addiction mechanisms with
possible clinical implications. Sci Rep. 10:102582020. View Article : Google Scholar : PubMed/NCBI
|
|
25
|
Postow MA, Sidlow R and Hellmann MD:
Immune-related adverse events associated with immune checkpoint
blockade. N Engl J Med. 378:158–168. 2018. View Article : Google Scholar : PubMed/NCBI
|
|
26
|
Yu G, Wang LG, Han Y and He QY:
clusterProfiler: An R package for comparing biological themes among
gene clusters. OMICS. 16:284–287. 2012. View Article : Google Scholar : PubMed/NCBI
|
|
27
|
Jiang P, Gu S, Pan D, Fu J, Sahu A, Hu X,
Li Z, Traugh N, Bu X, Li B, et al: Signatures of T cell dysfunction
and exclusion predict cancer immunotherapy response. Nat Med.
24:1550–1558. 2018. View Article : Google Scholar : PubMed/NCBI
|
|
28
|
Shankavaram UT, Varma S, Kane D, Sunshine
M, Chary KK, Reinhold WC, Pommier Y and Weinstein JN: CellMiner: A
relational database and query tool for the NCI-60 cancer cell
lines. BMC Genomics. 10:2772009. View Article : Google Scholar : PubMed/NCBI
|
|
29
|
Zhang R, Wang C, Zheng X, Li S, Zhang W,
Kang Z, Yin S, Chen J, Chen F and Li W: Warburg effect-related risk
scoring model to assess clinical significance and immunity
characteristics of glioblastoma. Cancer Med. 12:20639–20654. 2023.
View Article : Google Scholar : PubMed/NCBI
|
|
30
|
Livak KJ and Schmittgen TD: Analysis of
relative gene expression data using real-time quantitative PCR and
the 2(−Delta Delta C(T)) method. Methods. 25:402–408. 2001.
View Article : Google Scholar : PubMed/NCBI
|
|
31
|
Wang W, Zhu L, Zhou J, Liu X, Xiao M, Chen
N, Huang X, Chen H, Pei X and Zhang H: Targeting the KRT16-vimentin
axis for metastasis in lung cancer. Pharmacol Res. 193:1068182023.
View Article : Google Scholar : PubMed/NCBI
|
|
32
|
Dora D, Revisnyei P, Pasic A, Galffy G,
Dulka E, Mihucz A, Roskó B, Szincsak S, Iliuk A, Weiss GJ and
Lohinai Z: Host and bacterial urine proteomics might predict
treatment outcomes for immunotherapy in advanced non-small cell
lung cancer patients. Front Immunol. 16:15438172025. View Article : Google Scholar : PubMed/NCBI
|
|
33
|
Wei XY, Zhao J, Tong HB, Cheng SJ, He N
and Song FX: Characters of KRT80 and its roles in neoplasms
diseases. Cancer Med. 12:13991–14003. 2023. View Article : Google Scholar : PubMed/NCBI
|
|
34
|
Yan Z, Zhong Z, Shi C, Feng M, Feng X and
Liu T: The prognostic marker KRT81 is involved in suppressing CD8 +
T cells and predicts immunotherapy response for triple-negative
breast cancer. Cancer Biol Ther. 25:23557052024. View Article : Google Scholar : PubMed/NCBI
|
|
35
|
Kim HJ, Choi WJ and Lee CH:
Phosphorylation and reorganization of keratin networks:
Implications for carcinogenesis and epithelial mesenchymal
transition. Biomol Ther (Seoul). 23:301–312. 2015. View Article : Google Scholar : PubMed/NCBI
|
|
36
|
Wu JS, Jiang J, Chen BJ, Wang K, Tang YL
and Liang XH: Plasticity of cancer cell invasion: Patterns and
mechanisms. Transl Oncol. 14:1008992021. View Article : Google Scholar : PubMed/NCBI
|
|
37
|
Li R, Tong R, Zhang JL, Zhang Z, Deng M
and Hou G: Comprehensive molecular analyses of cuproptosis-related
genes with regard to prognosis, immune landscape, and response to
immune checkpoint blockers in lung adenocarcinoma. J Cancer Res
Clin Oncol. 150:2462024. View Article : Google Scholar : PubMed/NCBI
|
|
38
|
Tietscher S, Wagner J, Anzeneder T,
Langwieder C, Rees M, Sobottka B, de Souza N and Bodenmiller B: A
comprehensive single-cell map of T cell exhaustion-associated
immune environments in human breast cancer. Nat Commun. 14:982023.
View Article : Google Scholar : PubMed/NCBI
|
|
39
|
Zhang X, Yin M and Zhang LJ: Keratin 6, 16
and 17-Critical barrier alarmin molecules in skin wounds and
psoriasis. Cells. 8:8072019. View Article : Google Scholar : PubMed/NCBI
|
|
40
|
Hatano Y and Elias PM:
‘Outside-to-inside,’ ‘inside-to-outside,’ and ‘intrinsic’
endogenous pathogenic mechanisms in atopic dermatitis:
Keratinocytes as the key functional cells involved in both
permeability barrier dysfunction and immunological alterations.
Front Immunol. 14:12392512023. View Article : Google Scholar : PubMed/NCBI
|
|
41
|
Li Y, Wang L, Ma W, Wu J, Wu Q and Sun C:
Paracrine signaling in cancer-associated fibroblasts: Central
regulators of the tumor immune microenvironment. J Transl Med.
23:6972025. View Article : Google Scholar : PubMed/NCBI
|
|
42
|
Wu MS, Li CH, Ruppert JG and Chang CC:
Cytokeratin 8-MHC class I interactions: A potential novel immune
escape phenotype by a lymph node metastatic carcinoma cell line.
Biochem Biophys Res Commun. 441:618–623. 2013. View Article : Google Scholar : PubMed/NCBI
|
|
43
|
Mohme M, Riethdorf S and Pantel K:
Circulating and disseminated tumour cells-mechanisms of immune
surveillance and escape. Nat Rev Clin Oncol. 14:155–167. 2017.
View Article : Google Scholar : PubMed/NCBI
|
















![Machine learning-based prognostic
model in LUAD. (A) Heatmap of mean C-index values for 101 model
combinations across TCGA, GSE31210 and GSE72094; the StepCox
[forward]+Ridge model is highlighted. Kaplan-Meier curves for
high-vs. low-risk groups in (B) TCGA, (C) GSE31210 and (D)
GSE72094; HR, 95% CI and P-value shown). (E) Time-dependent ROC
curves at 1, 3 and 5 years for the selected model in all three
cohorts. LUAD, lung adenocarcinoma; TCGA, The Cancer Genome Atlas;
HR, hazard ratio; ROC, receiver operating characteristic; CI,
confidence interval.](/article_images/ol/32/3/ol-32-03-15774-g02.jpg)