Introduction
Liver cancer is the sixth most common malignancy
worldwide. According to Global Cancer Statistics, it caused an
estimated 757,948 deaths in 2022, making it the third leading cause
of cancer-related death (1).
Hepatocellular carcinoma (HCC) accounts for 75–85% of primary liver
cancers (2). Current treatment
options include surgical resection, local ablative and
interventional therapy, systemic targeted therapy, immunotherapy
and liver transplantation (3).
However, potentially curative treatments are largely restricted to
selected patients with early-stage disease. As early symptoms are
often nonspecific, numerous patients are diagnosed at an
intermediate or advanced stage and continue to experience poor
long-term survival (4). Identifying
molecular markers associated with HCC biology and patient outcome
may therefore improve disease characterization and risk assessment
(5).
The family with sequence similarity 72 (FAM72) gene
family comprises FAM72A, FAM72B, FAM72C and FAM72D and has been
studied in neural progenitor-cell self-renewal and cancer biology
(6). FAM72D has been identified in
prognostic or proliferation-related transcriptional signatures in
prostate cancer, renal cell carcinoma and multiple myeloma
(7–9). FAM72A has also been associated with
clinicopathological characteristics, prognosis and drug sensitivity
in HCC (10). More recently, Kong
et al (11) systematically
examined the expression profiles and prognostic values of the FAM72
family, including FAM72D, in liver cancer. Pan-cancer and
experimental analyses have further connected FAM72D with aggressive
tumor-cell phenotypes (12). These
findings suggest that FAM72D may participate in a broader
proliferative program, but its malignant-cell distribution,
regulatory context, prognostic contribution and functional
relevance in HCC require integrated investigation.
The present study combined bulk RNA sequencing,
independent tissue-level cohorts, single-cell RNA sequencing,
spatial transcriptomics, immune-related analyses, tissue
immunohistochemistry and in vitro experiments to
characterize FAM72D in HCC. The present study first evaluated its
expression and prognostic significance, followed by patient-level
bootstrap validation of a locked clinical model. It then examined
the malignant-cell distribution of FAM72D and defined its
associated transcriptional, regulatory and immune context. Finally,
transient FAM72D silencing was used to determine its contribution
to HCC-cell proliferation, apoptosis and migration.
Materials and methods
Clinical and pathological data
sources
mRNA expression data generated by RNA sequencing and
corresponding clinical information were obtained from The Cancer
Genome Atlas liver hepatocellular carcinoma (TCGA-LIHC) cohort
(https://portal.gdc.cancer.gov/)
(13). Independent tissue-level
validation was conducted using datasets deposited in the Gene
Expression Omnibus (GEO; http://www.ncbi.nlm.nih.gov/geo/) (14). GSE76427 included 167 tissues from
115 patients, comprising 115 HCC and 52 adjacent non-tumor tissues
(15). GSE39791 included 144
tissues from 72 patients, with one paired HCC and non-tumor tissue
from each patient (16). GSE54236
initially contained 161 arrays from 77 patients; repeated arrays
representing the same patient-tissue combination were averaged,
yielding 154 patient-level tissue measurements comprising 77 HCC
and 77 non-tumor tissues (17).
Survival analysis
Overall-survival data were obtained from TCGA-LIHC.
The locked prognostic analysis included 341 patients with complete
data for the prespecified model variables, among whom 117
mortalities were observed. The multivariable Cox model included age
centered at the cohort mean and modeled per 10-year increase, sex
with female as the reference, pathologic stage with stage I as the
reference and continuous FAM72D expression measured as log2(TPM+1),
where TPM denotes transcripts per million. Stage II and stage
III/IV were represented by separate indicator variables.
Proportional-hazards assumptions were evaluated
using Schoenfeld-residual-based diagnostics and spline analyses
were used to assess potential nonlinearity of the continuous
predictors. Median-based FAM72D groups were retained for
descriptive Kaplan-Meier analyses but were not used in the locked
prognostic model.
Establishment and evaluation of the
HCC survival nomogram
A nomogram was constructed from the locked Cox model
to estimate 1-, 3- and 5-year overall-survival probabilities. Model
discrimination was quantified using Harrell's C-index. Internal
validation was performed using 1,000 patient-level bootstrap
resamples. In each resample, the model was refitted, optimism was
calculated as the difference between bootstrap-sample performance
and performance in the original cohort and mean optimism was
subtracted from the apparent C-index. Percentile bootstrap 95%
confidence intervals (CI) were calculated for the apparent
C-index.
Calibration was assessed at 1, 3 and 5 years by
comparing mean predicted mortality risk with Kaplan-Meier-observed
mortality across tertiles of predicted risk, followed by bootstrap
optimism correction. Decision curve analysis compared the net
benefit of the clinical model and the clinical-plus-FAM72D model
with treat-all and treat-none strategies. Threshold ranges were
0.05–0.40 for 1-year mortality, 0.10–0.70 for 3-year mortality and
0.20–0.77 for 5-year mortality.
Independent tissue-level Receiver Operating
Characteristic (ROC) validation was conducted in GSE76427, GSE39791
and GSE54236. Official platform annotations identified ILMN_1719870
on GPL10558 and A_32_P151800 on GPL6480 as the corresponding FAM72D
probes. Area Under the Curve (AUC) CIs were calculated using 2,000
patient-cluster bootstrap resamples, thereby preserving the
dependence between paired tissues and repeated measurements from
the same patient.
Gene set enrichment analysis (GSEA)
and Gene Ontology (GO) and Kyoto Encyclopedia of Genes and Genomes
(KEGG) analyses of bulk RNA-sequencing data
In TCGA-LIHC, GSEA was used to compare samples with
high and low FAM72D expression. Differentially expressed genes
(DEGs) were identified using thresholds of |logFC|>1.5 and
adjusted P<0.05. GO and KEGG enrichment analyses were performed
using the R packages clusterProfiler and org.Hs.eg.db (18–20).
For GSEA, |NES|>1, P<0.05 and FDR <0.25 were considered
statistically significant.
Protein-protein interaction (PPI)
network
A PPI network of genes coexpressed with FAM72D was
constructed using the STRING database (https://string-db.org) (21). Hub genes were selected and
visualized using Cytoscape version 3.10.1 (https://cytoscape.org/) (22).
Tumor Immune Dysfunction and Exclusion
(TIDE) analysis
The TIDE algorithm was used to compare
computationally inferred patterns of immune dysfunction and
exclusion between the FAM72D expression groups in the TCGA-HCC
cohort (23).
Tumor immune estimation resource
(TIMER) analysis
The TIMER web server (https://cistrome.shinyapps.io/timer/) was used to
estimate immune-cell abundance in HCC tissues (24). Associations between FAM72D mRNA
expression and the estimated abundance of B cells, CD4+ T cells,
CD8+ T cells, neutrophils, macrophages and dendritic cells were
examined. Associations with the expression of
immune-checkpoint-related genes were also assessed. Correlation
coefficients and P-values were obtained from the specified public
resources.
Cell clustering and annotation
A gene-by-cell UMI count matrix for GSE151530 was
obtained from GEO (25). Cells with
<200 detected genes, >6,000 detected genes, or >20%
mitochondrial transcripts were excluded. The matrix contained
56,721 cells and 18,667 genes before filtering and 51,759 cells and
18,667 genes after filtering.
The 46 sample identifiers were C25, C26a, C26b, C29,
C35, C39, C42, C46a, C46b, C52, C56, C60, C66, C76, H08, H18, H21,
H23, H28, H30, H34a, H34b, H34c, H37, H38, H41, H43, H49a, H49b,
H54, H55, H58a, H58b, H58c, H62, H63, H65, H68a, H68b, H70, H72,
H73a, H73b, H74, H75 and H77.
Single-cell analyses were performed using Seurat
version 5.0.3 (https://satijalab.org/seurat/). Data were
log-normalized and scaled and the percentage of mitochondrial
transcripts was regressed out. The 2,000 most variable genes were
selected using FindVariableFeatures with the vst method. Principal
component analysis was performed and the first 50 principal
components were retained. A shared nearest-neighbor graph was
constructed from these principal components and cells were
clustered using the Louvain algorithm with FindClusters at a
resolution of 1. No additional cross-sample batch-correction
algorithm was applied. Uniform manifold approximation and
projection (UMAP) was performed using the RunUMAP function in
Seurat, with principal components 1–50 as input, to visualize cell
populations and malignant-cell subclusters.
Cell identities were adopted from the dataset
annotations. Cells in the malignant-cell compartment were
reclustered at a resolution of 0.6. Cluster-specific DEGs were
identified using FindAllMarkers function in Seurat, with a Wilcoxon
test, log2FC >0.25 and Benjamini-Hochberg-adjusted P<0.05.
FAM72D-high and FAM72D-low cells were separated using the
central-tendency threshold implemented in the original analytical
workflow.
Gene regulatory network analysis
Regulon activity was reconstructed with SCENIC
version 1.3.1 (https://github.com/aertslab/SCENIC). Raw UMI counts
were used as input for the runCorrelation and runGENIE3 functions
to generate gene coexpression modules. Candidate regulons were
refined by motif-enrichment analysis using RcisTarget version
1.22.0 (https://bioconductor.org/packages/RcisTarget/) and
their activity in each cell was scored using AUCell version 1.24.0
(https://bioconductor.org/packages/AUCell/). The
resulting AUC scores were z-normalized across the dataset to
facilitate comparisons.
Spatial transcriptomic analysis
Spatially resolved gene-expression profiles were
analyzed using SpatialTME, a web-based platform integrating
histologic images with single-cell and spatial transcriptomic data
(26). The HRA000437 HCC dataset
was analyzed using the platform's workflow (27), which included spot-level expression
generation, exclusion of spots with <200 detected genes or
>15% mitochondrial transcripts, SCTransform normalization
(https://satijalab.org/seurat/reference/sctransform),
principal component analysis and Louvain clustering. FAM72D
transcript signals were compared between tumor and adjacent-tissue
regions using the supplied annotations.
Gene set variation analysis (GSVA) and
GO/KEGG analyses of single-cell RNA-sequencing data
GSVA was performed to visualize functional programs
across cell clusters. The resulting enrichment-score matrix was
z-scaled by row and displayed as a heatmap summarizing
pathway-activation patterns across the identified cell populations.
Differential expression among malignant-cell subclusters was
assessed using FindMarkers. Genes with adjusted P<0.05 and
log2FC >1.44 were considered markedly upregulated in individual
subclusters and were included in downstream enrichment
analyses.
Immunohistochemistry (IHC)
Written informed consent was obtained from all
patients who provided tissue samples for this study. The IHC cohort
comprised 10 patients, of 5 males and 5 females, recruited between
January 2023 and December 2023. The median age was 62 years (range,
48–72 years) and demographic data were available for all 10
patients. Paired HCC and adjacent non-tumor tissues were collected
at Hunan Provincial People's Hospital/The First Affiliated Hospital
of Hunan Normal University in Changsha, China. Adjacent non-tumor
tissues were obtained at least 2 cm from the tumor margin and were
confirmed by histopathological examination to be free of tumor
involvement. The inclusion criteria were age ≥18 years,
histopathologically confirmed primary HCC, availability of paired
tumor and adjacent non-tumor tissue specimens, and no anticancer
treatment before surgery. The exclusion criteria were recurrent
HCC, a concurrent malignancy and insufficient or inadequately
preserved tissue for IHC analysis.
Specimens were fixed in 10% neutral buffered
formalin (~4% formaldehyde) for 24 h at room temperature,
dehydrated through 70, 80 and 95% ethanol for 1 h each and absolute
ethanol twice for 1 h each, and cleared in xylene twice for 30 min
each. Tissues were infiltrated with paraffin at 60°C twice for 1 h
each, embedded and sectioned at 4 µm.
Sections were deparaffinized in xylene and
rehydrated through graded ethanol. Antigen retrieval was performed
in 10 mM citrate buffer (pH 6.0) at 95–98°C for 15 min. No separate
permeabilization step was used. Endogenous peroxidase activity and
nonspecific binding were blocked with 3% hydrogen peroxide for 10
min and 5% bovine serum albumin for 30 min, respectively, at room
temperature.
Sections were incubated with a rabbit FAM72-family
polyclonal antibody (1:100; catalog no. 21203-1-AP; Proteintech
Group, Inc.) for 16 h at 4°C, followed by an HRP-conjugated goat
anti-rabbit IgG secondary antibody (1:200; catalog no. 111-035-003;
Jackson ImmunoResearch Laboratories, Inc.) for 1 h at room
temperature. Staining was developed with 3,3′-diaminobenzidine,
followed by hematoxylin counterstaining for 1 min at room
temperature. Sections were examined using a bright-field light
microscope (BX53; Olympus Corporation). Because the primary
antibody recognizes multiple FAM72 family members, staining was
evaluated as FAM72-family immunoreactivity. Slides were examined
under an optical microscope (Nikon E1000; Nikon Corporation) and
independently evaluated by at least two pathologists. Five
representative fields from each specimen were assessed at
magnification, ×400. Positive FAM72-family immunoreactivity was
defined as distinct brown chromogenic signals in the cytoplasmic
and membranous compartments. Images were acquired using a Nikon
DS-Fi3 microscope imaging system (Nikon Corporation).
Cell transfection and proliferation
assays
FAM72D was knocked down in HuH7 cells using three
small interfering (si)RNAs targeting FAM72D and a negative-control
siRNA (si-NC; Shanghai GenePharma Co., Ltd.). Cells were seeded in
6-well plates at 2×10⁵ cells per well 24 h before
transfection and transfected at approximately 50–60% confluence.
Each targeting siRNA and si-NC were used at a final concentration
of 50 nM. For each well, 100 pmol siRNA was complexed with 5 µl
Lipofectamine® 3000 (Invitrogen; Thermo Fisher
Scientific, Inc.) in Opti-MEM reduced-serum medium and added to the
cells in a final volume of 2 ml. P3000 reagent was not used. Cells
were incubated with the transfection complexes at 37°C with 5%
CO2 for 6 h, after which the medium was replaced with
fresh complete culture medium. Knockdown efficiency was assessed 48
h after transfection. The siRNA sequences are provided in Table SI. The reagents designated _001,
_002 and _003 corresponded to si-FAM72D-1, si-FAM72D-2 and
si-FAM72D-3, respectively. si-FAM72D-3 showed the greatest
knockdown efficiency and was selected for subsequent
experiments.
Cell proliferation was evaluated using CCK-8
(Dojindo Laboratories, Inc.) and colony-formation assays. For the
CCK-8 assay, cells were seeded in 96-well plates at
2×10³ cells per well and absorbance at 450 nm was
measured with a microplate reader (Thermo Fisher Scientific, Inc.)
at 0, 24, 48 and 72 h after transfection. For the colony-formation
assay, 200 transfected cells per well were cultured in 6-well
plates at 37°C with 5% CO2 for 14 days. Colonies were
fixed with 75% ethanol for 15 min at room temperature and stained
with 0.1% crystal violet for 20 min at room temperature. Colonies
containing at least 50 cells were counted manually under a light
microscope.
RNA extraction, reverse transcription
and reverse transcription-quantitative (RT-q) PCR
HuH7 cells were collected 48 h following
transfection. Total RNA was extracted using the FastPure
Cell/Tissue Total RNA Isolation Kit (Vazyme Biotech Co., Ltd.).
Total RNA (1 µg) was reverse-transcribed using HiScript III RT
SuperMix for qPCR (+gDNA wiper; Vazyme Biotech Co., Ltd.), with
genomic DNA removal at 42°C for 2 min, reverse transcription at
37°C for 15 min and enzyme inactivation at 85°C for 5 sec.
RT-qPCR was performed using ChamQ Universal SYBR
qPCR Master Mix (Vazyme Biotech Co., Ltd) on a QuantStudio 6 Flex
Real-Time PCR System (Applied Biosystems; Thermo Fisher Scientific,
Inc.). The cycling conditions were 95°C for 30 sec, followed by 40
cycles of 95°C for 10 sec and 60°C for 30 sec. GAPDH was used as
the reference gene and si-NC was used as the calibrator. Relative
FAM72D expression was calculated using the 2−ΔΔCq method
(28). Primer sequences are
provided in Table SII. Three
independent biological experiments were performed, with three
technical replicates per biological replicate.
Wound-healing and migration
assays
For the wound-healing assay, standardized scratches
were made in confluent monolayers using sterile 200-µl pipette
tips. Migration distances were measured after 24 h of serum-free
incubation. Transwell migration assays were performed in uncoated
chambers with 8-µm pores (Corning, Inc.); neither Matrigel nor
another extracellular-matrix coating was used. A total of
2×10⁵ cells in serum-free medium were added to the upper
chamber, while medium containing 10% fetal bovine serum was added
to the lower chamber. After 24 h, migrated cells were fixed with 4%
paraformaldehyde for 15 min at room temperature, stained with 0.1%
crystal violet for 20 min at room temperature and counted at ×200
magnification.
Flow cytometry
Cells (5×10⁴ per well) were harvested 48
h after transfection by trypsinization without EDTA. Apoptotic
cells were quantified by flow cytometry (BD FACSCanto II; BD
Biosciences) after staining with 5 µl of Annexin V-FITC and 10 µl
of propidium iodide for 20 min at room temperature. Flow cytometry
data were analyzed using FlowJo version 10.8.1 (BD Biosciences).
The apoptotic rate was calculated as the sum of the percentages of
early apoptotic cells (Annexin V-positive/propidium
iodide-negative) and late apoptotic cells (Annexin
V-positive/propidium iodide-positive) within the gated single-cell
population following exclusion of debris and doublets.
Statistical analysis
Statistical analyses included Wilcoxon tests,
unpaired Student's t-tests, χ2 tests, Kruskal-Wallis
tests, Kaplan-Meier analysis, Cox regression, ROC analysis,
bootstrap internal validation, calibration analysis and decision
curve analysis, as appropriate. All tests were two-sided and
P<0.05 was considered to indicate a statistically significant
difference.
The locked Cox model used continuous FAM72D
expression rather than a data-dependent cutoff. Patient-level
resampling was used for TCGA internal validation and
patient-cluster resampling was used for the GEO ROC analyses to
account for paired tissues. The original transcriptomic analyses
were performed primarily using R version 4.3.3 (https://www.r-project.org/), and the additional
validation analyses were performed using Python (https://www.python.org/).
Results
FAM72D is consistently upregulated in
HCC and associated with disease progression
The present study first characterized FAM72D mRNA
expression in TCGA and three independent GEO cohorts. In TCGA-LIHC,
FAM72D expression was significantly higher in HCC tissues than in
adjacent non-tumor tissues (P<0.001; Fig. 1A and B). Consistent expression
differences were observed in GSE76427, GSE39791 and GSE54236
(Fig. 1C-E), demonstrating
reproducible FAM72D upregulation across independent patient cohorts
and two microarray platforms.
In TCGA-LIHC, FAM72D expression varied according to
pathologic T category, pathologic N category, pathologic stage and
overall-survival event status (Fig.
1F-I). Spatial transcriptomic analysis further showed stronger
FAM72D transcript signals in tumor-labeled regions than in
adjacent-tissue-labeled regions in HRA000437 (Fig. 1J-M).
Tissue-level staining also revealed stronger
FAM72-family immunoreactivity in HCC tissues than in paired
adjacent non-tumor tissues. Among the 10 paired samples, 9 HCC
tissues showed high FAM72-family immunoreactivity, whereas all 10
adjacent non-tumor tissues showed low immunoreactivity (Fig. 1N and O). Collectively, these
findings establish elevated FAM72D expression as a reproducible
molecular feature of HCC closely linked to disease progression.
FAM72D expression is independently
associated with unfavorable overall survival in TCGA-LIHC
A locked multivariable Cox model was developed using
age, sex, pathologic stage and continuous FAM72D expression in 341
patients with 117 mortalities. Stage III/IV disease was associated
with poorer overall survival than stage I disease [hazard ratio
(HR)=2.25; 95% confidence interval (CI) 1.46–3.45; P<0.001).
Higher FAM72D expression remained independently associated with
poorer overall survival after adjustment for the clinical variables
(HR per 1-unit increase in log2[TPM + 1]=2.02, 95% CI 1.45–2.81;
P<0.001; Fig. 2A).
 | Figure 2.Prognostic modeling, internal
validation and independent tissue-level validation of FAM72D in
HCC. (A) Forest plot of the locked multivariable Cox model
including age per 10 years, sex, pathologic stage and continuous
FAM72D expression. Hazard ratios are shown with 95% confidence
intervals. (B) Nomogram derived from the same locked model for
estimation of 1-, 3- and 5-year overall-survival probabilities. (C)
Harrell's C-indices for the clinical model and clinical-plus-FAM72D
model. Open circles and horizontal bars represent apparent
C-indices and bootstrap 95% CI; diamonds represent
optimism-corrected C-indices obtained from 1,000 bootstrap
resamples. (D) Bootstrap-corrected calibration of 1-, 3- and 5-year
mortality risk. Orange squares indicate apparent Kaplan-Meier
estimates, blue circles indicate optimism-corrected estimates and
dashed lines indicate ideal calibration. (E) Decision curve
analysis of the clinical-plus-FAM72D model, clinical model,
treat-all strategy and treat-none strategy at 1, 3 and 5 years. (F)
Independent tissue-level ROC validation in GSE76427, GSE39791 and
GSE54236. AUC confidence intervals were calculated using 2,000
patient-cluster bootstrap resamples. FAM72D, family with sequence
similarity 72 member D; HCC, hepatocellular carcinoma; HR, hazard
ratio; CI, confidence interval; ROC, Receiver Operating
Characteristic; AUC. Area Under the Curve. |
A nomogram based on the same locked model was
constructed to estimate 1-, 3- and 5-year overall-survival
probabilities (Fig. 2B).
Descriptive Kaplan-Meier and subgroup analyses consistently linked
higher FAM72D expression to unfavorable survival and are presented
in Fig. S1.
The clinical model had an apparent C-index of 0.628
(bootstrap 95% CI 0.575–0.677) and an optimism-corrected C-index of
0.611. After FAM72D was added, the apparent C-index increased to
0.678 (bootstrap 95% CI 0.623–0.726) and the optimism-corrected
C-index increased to 0.662. The resulting optimism-corrected
increment in C-index was 0.051, while mean optimism remained small
for both models (Fig. 2C).
Bootstrap-corrected calibration showed favorable
agreement between predicted and observed mortality risks at 1, 3
and 5 years (Fig. 2D). The
group-weighted mean absolute deviations were 0.045, 0.030 and
0.013, respectively. Decision curve analysis showed incremental net
benefit from adding FAM72D, with the most consistent advantage
observed for 1-year mortality prediction across thresholds of
0.06–0.40 (Fig. 2E). The maximum
incremental net benefits were 0.048, 0.044 and 0.054 at 1, 3 and 5
years, respectively.
Independent tissue-level validation further
demonstrated consistent discrimination between HCC and non-tumor
liver tissues. The AUC was 0.861 in GSE76427 (patient-cluster
bootstrap 95% CI 0.795–0.919), 0.926 in GSE39791 (95% CI
0.878–0.961) and 0.832 in GSE54236 (95% CI 0.770–0.891) (Fig. 2F). All 2,000 bootstrap resamples
were successful in each cohort. Together, these analyses
demonstrate that FAM72D provides prognostic information beyond
conventional clinical variables and reproducibly distinguishes HCC
from non-tumor liver tissue.
FAM72D defines a highly proliferative
malignant-cell population in HCC
Single-cell RNA-sequencing data from GSE151530 were
analyzed to determine the cellular distribution of FAM72D. Uniform
manifold approximation and projection (UMAP) visualization
identified epithelial, immune and stromal populations based on the
dataset annotations (Fig. 3A). The
malignant-cell compartment was subsequently divided into nine
transcriptional subclusters, designated C0-C8 (Fig. 3B).
FAM72D expression was strongly enriched in
subcluster C5 (Fig. 3C). Cell-cycle
analysis showed that C5 contained a higher proportion of cells in
G2/M phase and had higher G2/M scores than
the other malignant-cell subclusters (Fig. 3D and E). C5 also exhibited
pronounced activation of cell-cycle, DNA-repair and mitotic
programs (Fig. 3F-H).
GO enrichment analysis showed that FAM72D-high
malignant cells were enriched in cell-cycle and mitotic processes,
including positive regulation of the cell cycle, mitotic cell-cycle
phase transition, G2/M-phase transition and mitotic
spindle organization. Enriched molecular functions and cellular
components included kinase binding and
spindle/microtubule-cytoskeleton-related terms (Fig. 3I). These results identified FAM72D
as a defining molecular feature of a highly proliferative
malignant-cell population in HCC.
FAM72D-centered transcriptional
programs converge on cell-cycle regulation and FOXM1 activity
To define the transcriptional architecture
associated with FAM72D, DEGs were identified between TCGA-LIHC
samples with high and low FAM72D expression (|logFC| >1.5 and
adjusted P<0.05; Fig. 4A). GO
and KEGG enrichment analyses showed that the FAM72D-high phenotype
was dominated by programs involving nuclear division, cell-cycle
progression, chromosome organization, humoral immune responses,
channel activity and neuroactive ligand-receptor interactions
(Fig. 4B).
 | Figure 4.FAM72D-centered transcriptional
features and FOXM1 regulon activity. (A) Volcano plot of DEGs
between FAM72D-high and FAM72D-low TCGA-LIHC samples, with selected
highly altered genes highlighted. (B) KEGG and GO enrichment
analyses of DEGs (|logFC| >1.5 and adjusted P<0.05). (C and
D) GSEA results. (E) Heatmap of regulon activity in C5 vs. the
other malignant-cell subclusters. (F) FOXM1 regulon-activity
feature plot and association between FOXM1 regulon activity and the
G2/M score. (G) PPI network of FAM72D-associated DEGs.
FAM72D, family with sequence similarity 72 member D; FOXM1,
forkhead box M1; DEGs, differentially expressed genes; TCGA, The
Cancer Genome Atlas; LIHC, liver hepatocellular carcinoma; KEGG,
Kyoto Encyclopedia of Genes and Genomes; GO, Gene Ontology; GSEA,
gene set enrichment analysis; PPI, protein-protein interaction. |
GSEA showed positive enrichment of Reactome pathways
related to sister-chromatid cohesion resolution, mitotic
prometaphase, sister-chromatid separation, mitotic
G2-G2/M phases and mitotic metaphase/anaphase
in samples with high FAM72D expression (Fig. 4C). By contrast, bio-oxidation,
biotransformation and metabolic signatures were relatively reduced
in the FAM72D-high group (Fig.
4D).
SCENIC analysis revealed marked enrichment of
proliferative regulons in C5. FOXM1 was among the regulons showing
increased activity in C5 relative to the other malignant-cell
subclusters (Fig. 4E). FOXM1
regulon activity was concentrated in C5 and closely aligned with
the G2/M transcriptional score (Fig. 4F). PPI analysis of FAM72D-associated
DEGs further revealed a densely connected gene network dominated by
proliferation-related components (Fig.
4G).
The agreement among differential-expression
analysis, pathway enrichment, single-cell scoring, regulon activity
and PPI connectivity places FAM72D within a tightly coordinated
FOXM1-centered proliferative network in HCC malignant cells.
The FAM72D-high phenotype is coupled
to an altered immune context in HCC
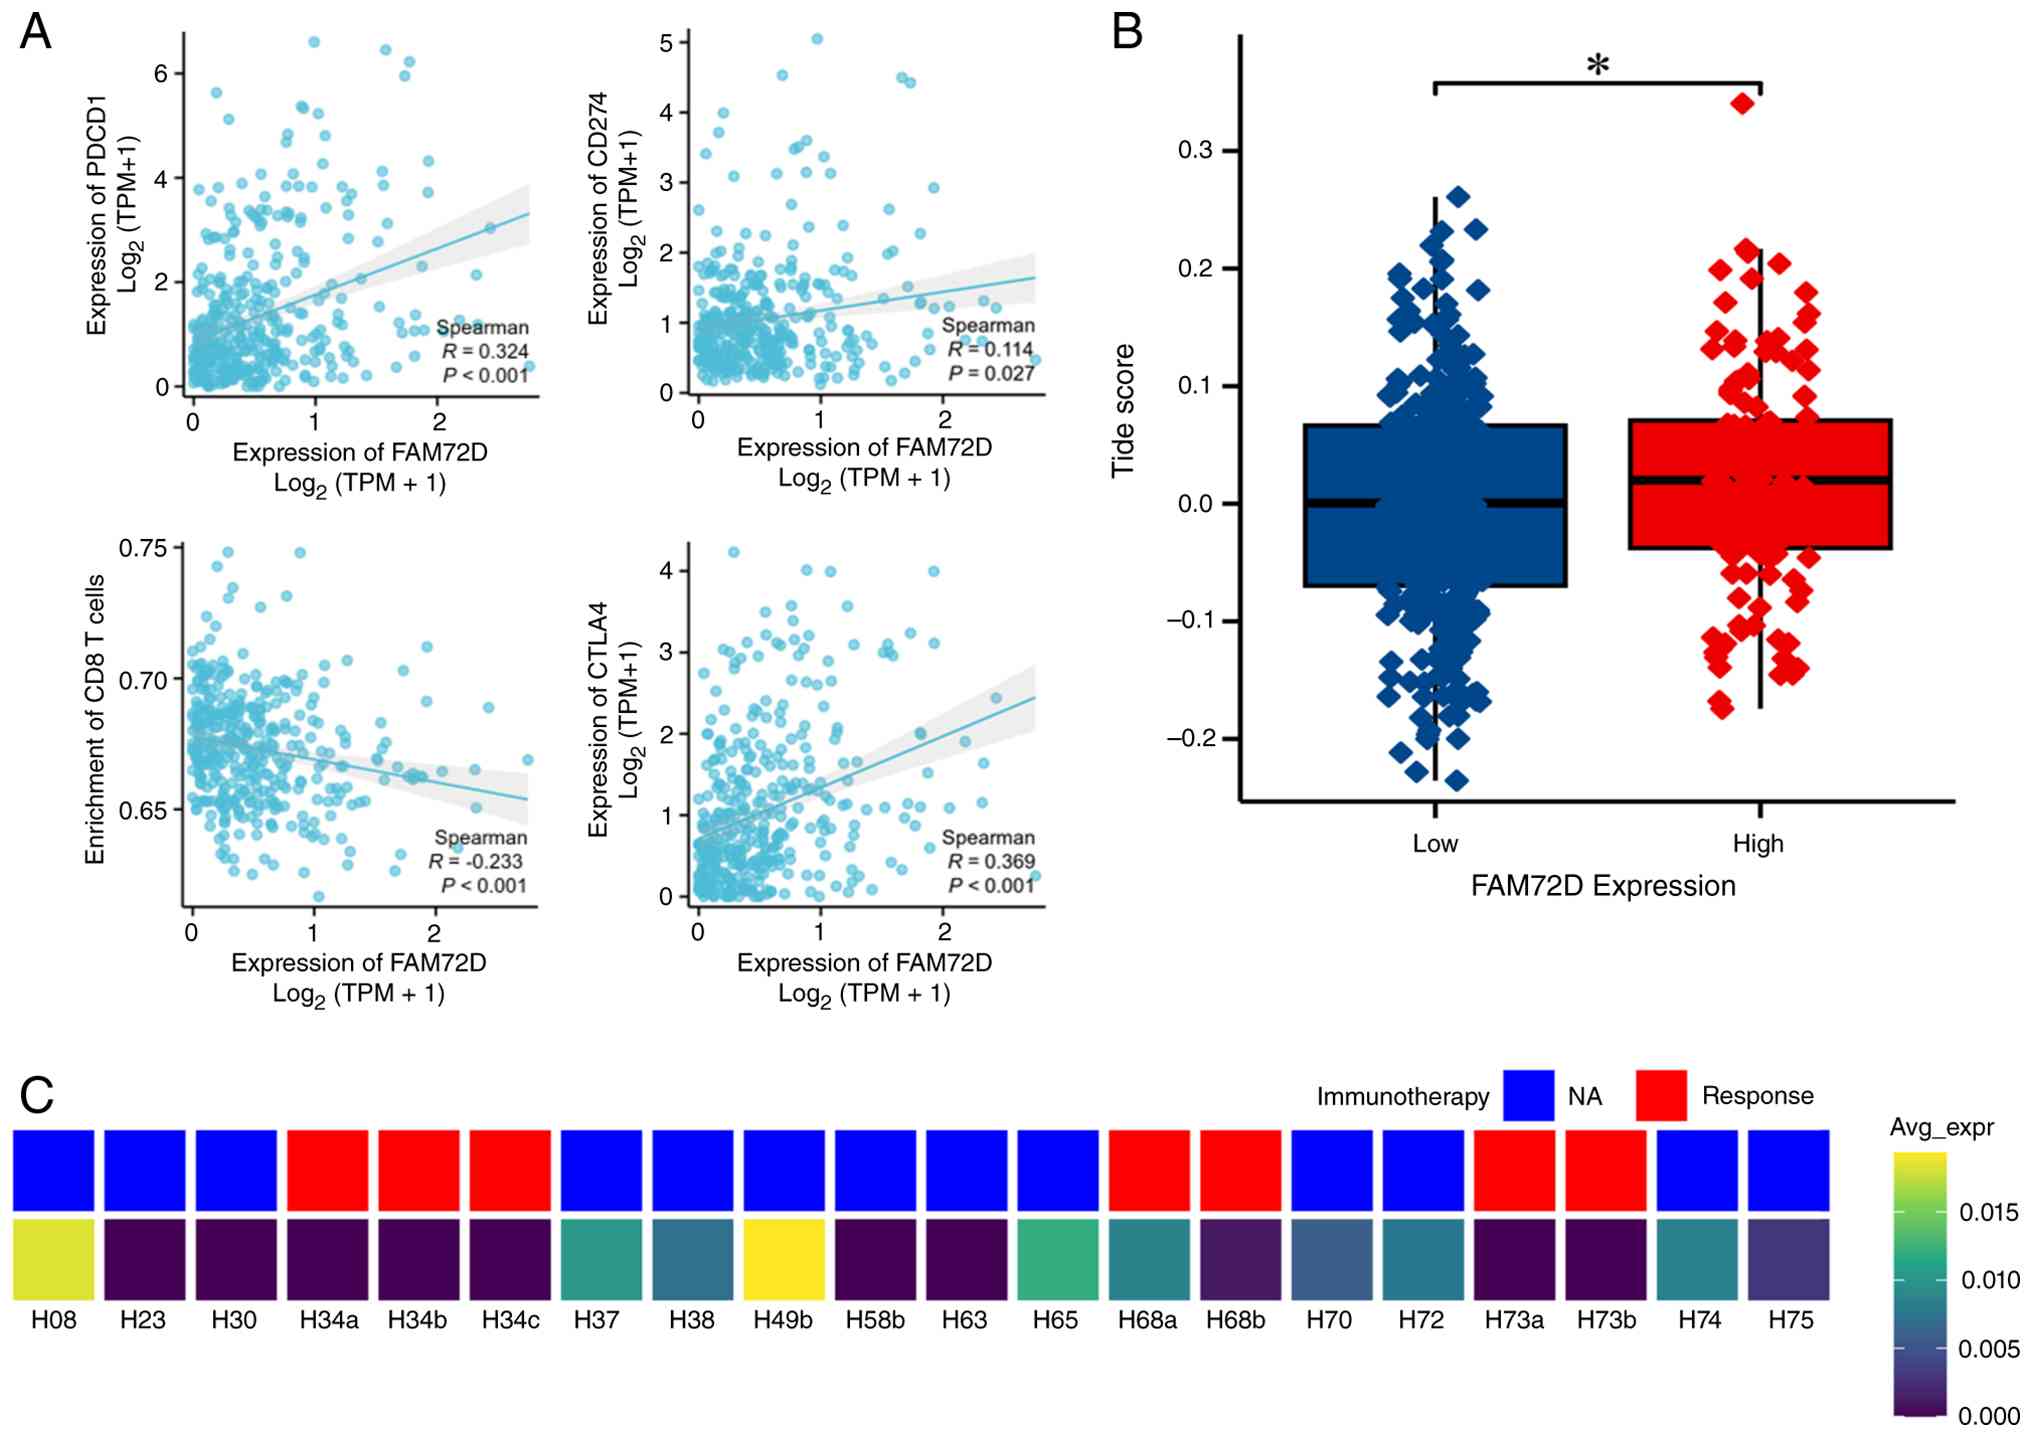
TIMER-based analysis showed that FAM72D expression
was positively correlated with the immune-checkpoint-related genes
PDCD1 (R=0.324; P<0.001), CD274 (R=0.114; P=0.027) and CTLA4
(R=0.369; P<0.001). By contrast, FAM72D expression was
negatively correlated with estimated CD8+ T-cell abundance
(R=−0.233; P<0.001; Fig.
5A).
The FAM72D-high group had higher TIDE scores than
the FAM72D-low group (P<0.05; Fig.
5B), connecting elevated FAM72D expression with transcriptional
features of T-cell dysfunction and exclusion. In GSE151530, FAM72D
expression was additionally visualized alongside the
treatment-outcome annotations provided for the selected samples
(Fig. 5C). Together, these findings
indicated that the FAM72D-high proliferative phenotype is coupled
to increased immune-checkpoint expression, reduced estimated CD8+
T-cell abundance and an immune-dysfunction-associated tumor
context.
FAM72D silencing suppresses
proliferative and migratory phenotypes in HCC cells
To examine the functional contribution of FAM72D,
HuH7 cells were transiently transfected with three si-FAM72D
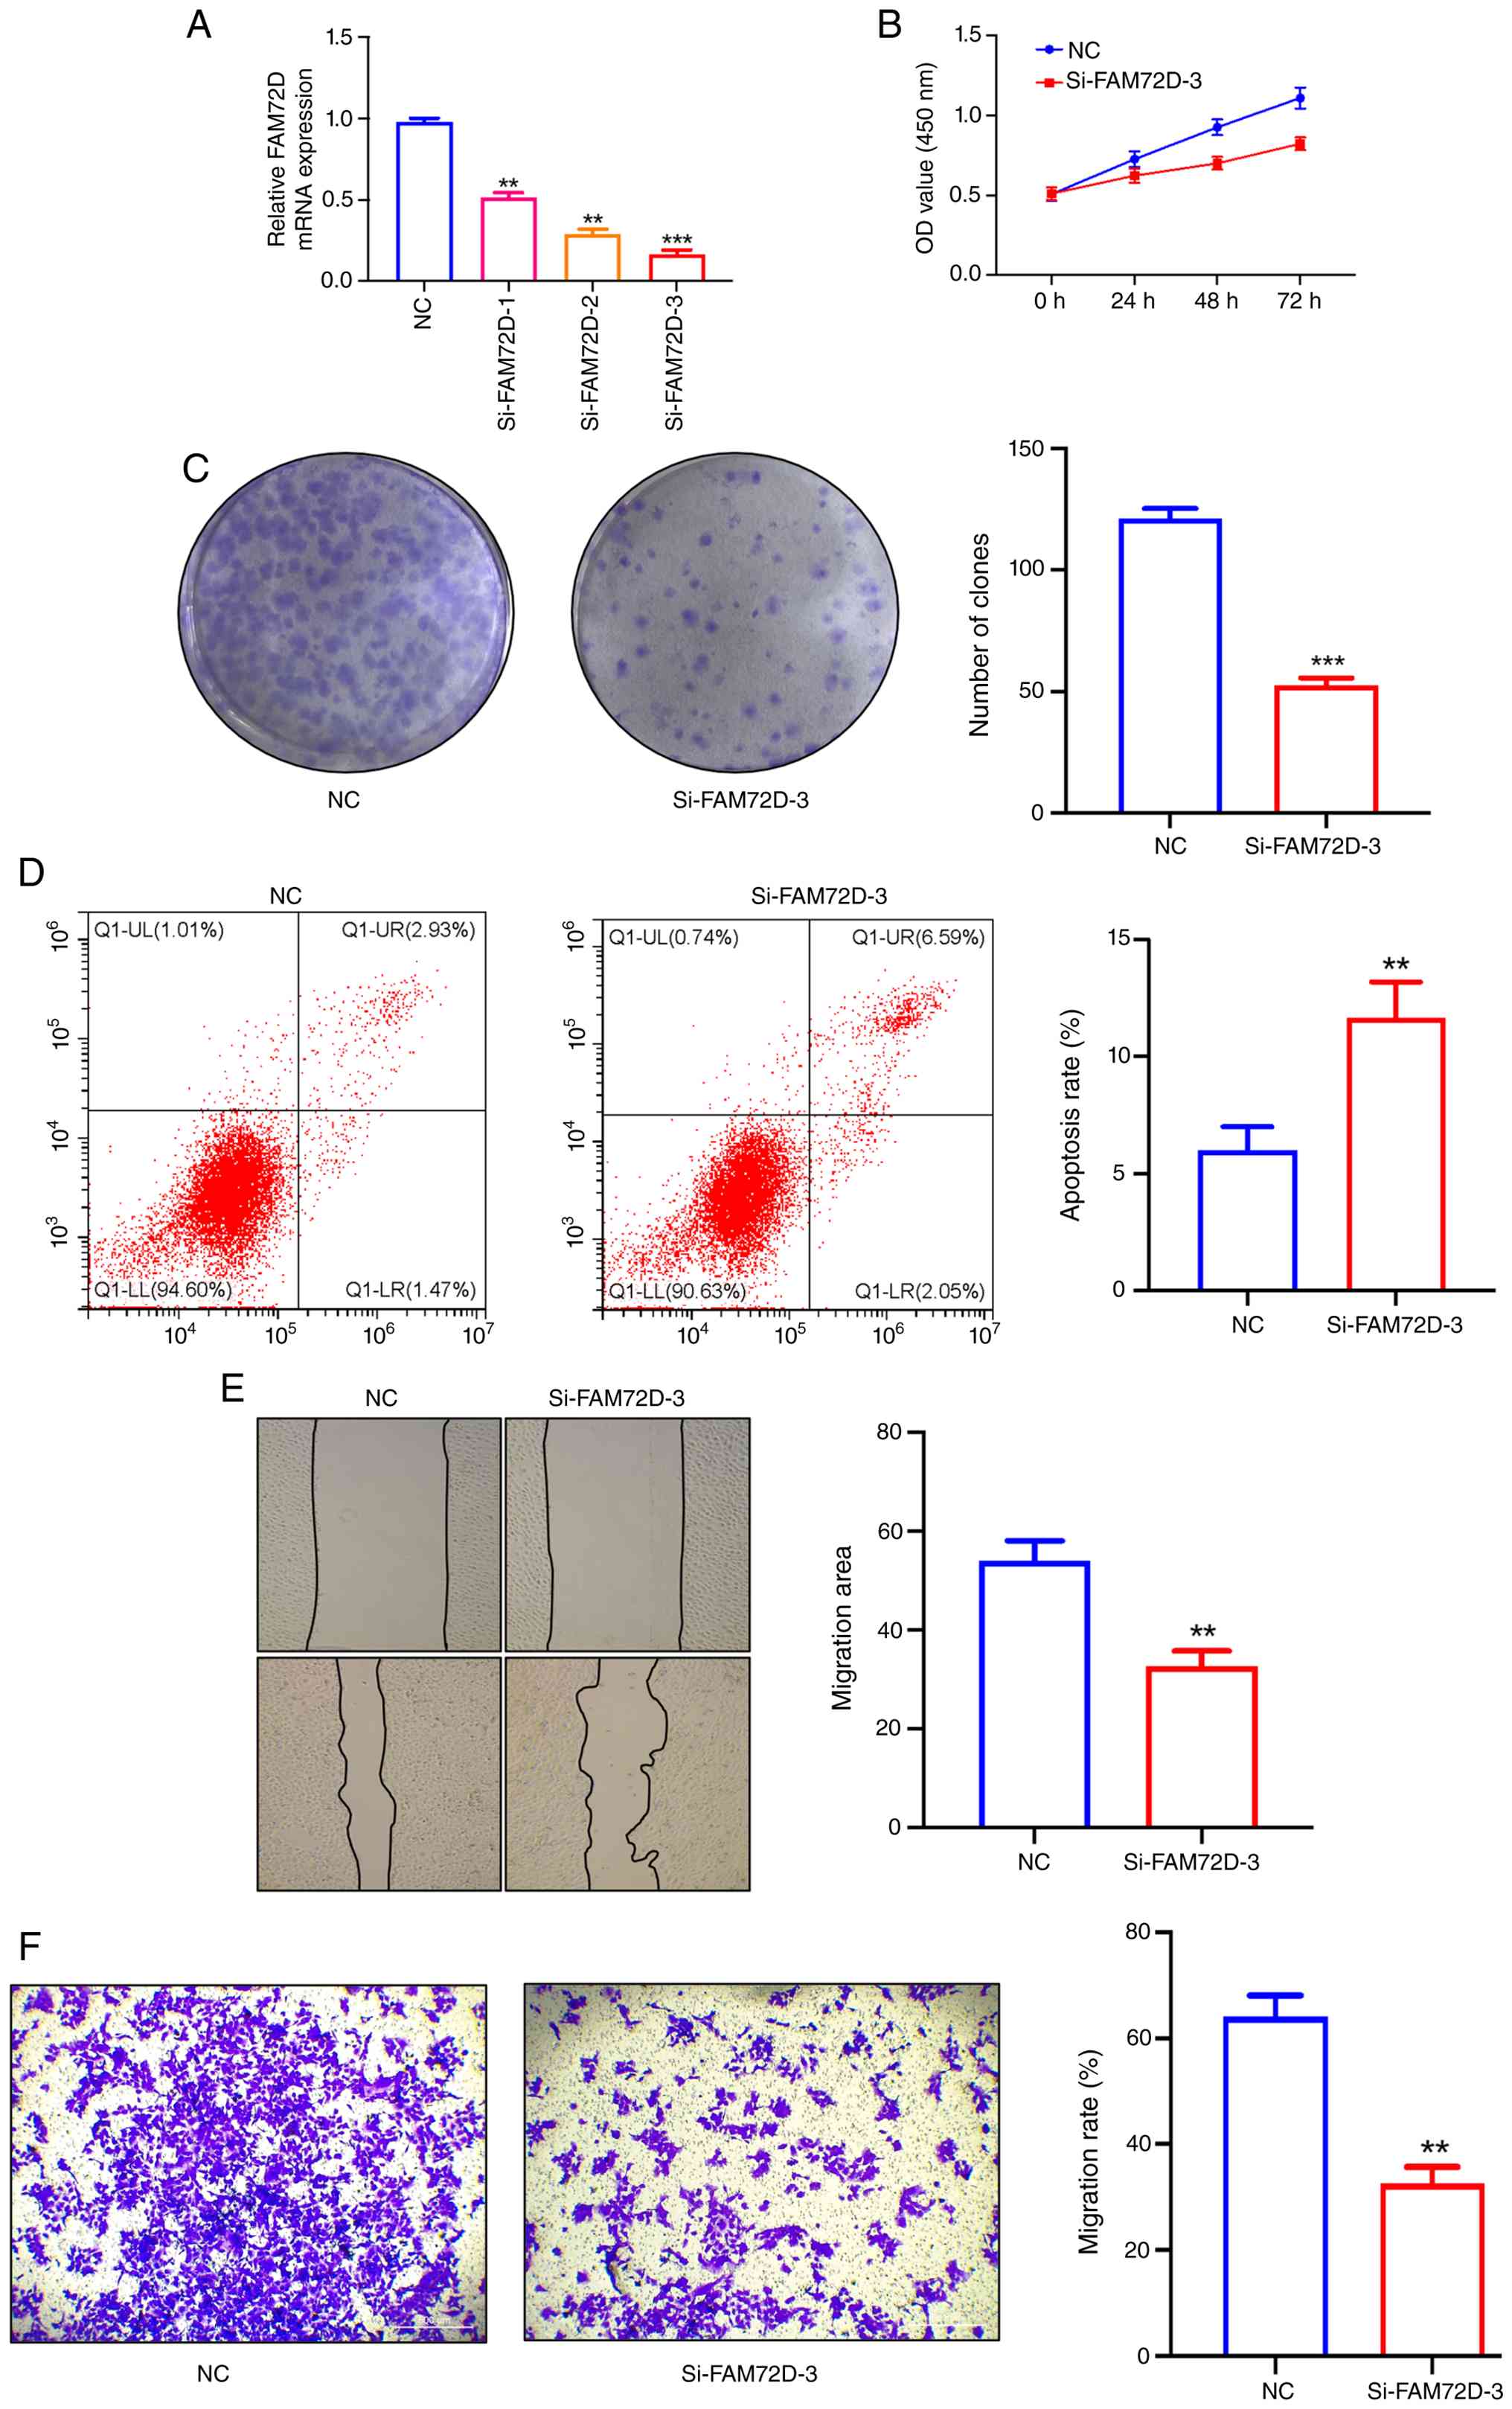
reagents. RT-qPCR confirmed significant reductions in FAM72D mRNA
expression, with si-FAM72D-3 producing the greatest knockdown
efficiency (Fig. 6A). si-FAM72D-3
was therefore selected for the subsequent experiments.
Compared with si-NC, FAM72D silencing markedly
reduced HuH7-cell viability and colony formation (Fig. 6B and C). Flow-cytometric analysis
further showed an increase in Annexin V-FITC/PI-positive apoptotic
cells following FAM72D knockdown (Fig.
6D).
Wound-healing and uncoated Transwell assays both
demonstrated markedly reduced HuH7-cell migration after FAM72D
silencing (Fig. 6E and F). These
functional changes were concordant with the cell-cycle and
proliferative programs identified by the bulk and single-cell
transcriptomic analyses. Collectively, the experimental findings
support an active contribution of FAM72D to HCC-cell proliferation,
survival and migration.
Discussion
The analyzed datasets consistently showed higher
FAM72D expression in HCC. In TCGA-LIHC, higher FAM72D expression
was independently associated with unfavorable overall survival,
while single-cell analysis showed enrichment of FAM72D in an
annotation-defined malignant-cell population with a highly
proliferative transcriptional state. Integrated bulk and
single-cell analyses further linked FAM72D to a coordinated
transcriptional program involving cell-cycle progression, DNA
replication, mitosis and FOXM1 regulon activity. Elevated FAM72D
expression was also associated with increased immune-checkpoint
expression, lower estimated CD8+ T-cell abundance and higher TIDE
scores. In HuH7 cells, FAM72D silencing was accompanied by reduced
proliferation and migration and increased apoptosis. Together,
these findings supported an association between FAM72D, unfavorable
prognosis and proliferative malignant-cell states in HCC.
The FAM72 family has previously been linked to
neuronal progenitor-cell self-renewal and cancer-associated
proliferation (6). FAM72D has also
emerged in prognostic or proliferation-related signatures in
prostate cancer, renal cell carcinoma, multiple myeloma and lung
adenocarcinoma (7–9,12). In
HCC, earlier studies primarily focused on FAM72A or on the
expression and prognostic profiles of the FAM72 family (10,11).
The present study extended this work by integrating FAM72D
expression with patient-level prognostic modeling, malignant-cell
heterogeneity, regulon activity, immune context and experimentally
measured tumor-cell phenotypes.
Contemporary HCC management incorporates
surveillance, prevention, locoregional therapy, systemic treatment,
immunotherapy and liver transplantation (29–31).
At the same time, recent studies have emphasized the importance of
spatially organized stromal niches and exhausted T-cell-macrophage
interactions in shaping HCC progression and treatment response
(32,33). Against this heterogeneous clinical
background, FAM72D remained independently associated with overall
survival after adjustment for age, sex and pathologic stage. Its
addition increased the optimism-corrected C-index by ~0.05 and the
increment persisted after patient-level bootstrap correction. The
calibration and decision curve analyses further supported the
contribution of FAM72D to prognostic stratification, while the
three GEO cohorts independently reproduced its marked
tumor-versus-normal expression difference.
The concentration of FAM72D in the C5 malignant-cell
population provides a cellular explanation for its elevated
bulk-tissue expression and adverse clinical association.
Transcriptome-based risk studies in other tumors have similarly
highlighted recurrence-associated proliferative programs (34). Cell-cycle progression is coordinated
by interacting E2F, mTORC1, MYC and FOXM1 networks (35–38).
In HCC, FOXM1 upregulation has been associated with metastatic
progression and unfavorable prognosis (39). In the present analysis, FAM72D-high
malignant cells displayed concordant activation of G2/M,
mitotic, DNA-replication, DNA-repair, chromosome-segregation and
spindle-related programs. Rather than representing a nonspecific
tumor-associated transcript, FAM72D therefore delineates a
malignant-cell population with a pronounced proliferative
identity.
FOXM1 regulon activity was elevated in the
FAM72D-high C5 population and was associated with the
G2/M program. This finding was reinforced by the
convergence of bulk-tissue GSEA, single-cell pathway scores, SCENIC
regulon activity and PPI-network connectivity. The consistency
across these independent analytical layers positions FAM72D within
a proliferative program associated with FOXM1 regulon activity and
provides a coherent transcriptional framework linking elevated
FAM72D expression to aggressive HCC-cell behavior.
HCC progression is also shaped by immune escape,
lymphocyte recruitment, angiogenic remodeling, oncogenic signaling
and inflammatory cell-death pathways (40–44).
In the present study, elevated FAM72D expression was accompanied by
higher PDCD1, CD274 and CTLA4 expression, reduced estimated CD8+
T-cell abundance and higher TIDE scores. FOXM1 has also been
connected to PD-L1 expression and antitumor immune responses in
other tumor systems (45,46). These findings place the FAM72D-high
proliferative phenotype within a broader
immune-dysfunction-associated tumor context and suggest
coordination between malignant-cell proliferation and immune
remodeling in HCC.
The in vitro experiments provide functional
support for the transcriptomic findings. FAM72D silencing reduced
cell viability and colony formation, increased apoptosis and
impaired migration in both wound-healing and uncoated Transwell
assays. These phenotypic effects align closely with the enrichment
of cell-cycle and mitotic programs in FAM72D-high malignant cells
and indicate that FAM72D is not merely a passive marker of
proliferative HCC cells. Instead, the combined evidence supports an
active contribution of FAM72D to the maintenance of proliferative,
survival and migratory phenotypes.
Several limitations should be acknowledged. The
survival model was internally validated but was not evaluated in an
independent cohort with fully compatible survival and clinical
variables. The IHC reagent recognized the FAM72 protein family and
therefore did not provide FAM72D-specific protein quantification.
The in vitro experiments were performed in HuH7 cells using
transient siRNA-mediated knockdown and validation in additional HCC
models, rescue experiments and in vivo systems would extend
the functional findings. In addition, the retained single-cell and
spatial-transcriptomic outputs did not preserve all sample-level
quality-control and section-level metadata. Future studies
incorporating prospective clinical cohorts, FAM72D-specific
protein-level assays and direct perturbation of the
FOXM1-associated program will help define the translational and
mechanistic scope of these findings.
In conclusion, FAM72D is consistently upregulated in
HCC, independently predicts unfavorable overall survival and
defines a highly proliferative malignant-cell population.
Integrated bulk, single-cell and regulatory-network analyses place
FAM72D within a coordinated program involving cell-cycle
progression, DNA replication, mitosis and FOXM1 activity. The
suppression of HCC-cell proliferation and migration and induction
of apoptosis following FAM72D silencing further support its
functional contribution to aggressive tumor-cell phenotypes.
Collectively, these findings establish FAM72D as a biologically
relevant prognostic marker and an integral component of the
proliferative program of HCC malignant cells.
Supplementary Material
Supporting Data
Supporting Data
Acknowledgements
Not applicable.
Funding
Funding: No funding was received.
Availability of data and materials
The data generated in the present study are included
in the figures and/or tables of this article.
Authors' contributions
QJ and QY conceptualized the study. QJ, YL and WD
developed the methodology. CZ and JY validated the findings using
independent datasets and experimental assays. JY prepared the
figures and graphical representations of the analytical results. CZ
and QY wrote the original draft. CZ, QY and WD reviewed and edited
the manuscript. CZ and QJ confirm the authenticity of all the raw
data. All authors read and approved the final manuscript.
Ethics approval and consent to
participate
All the human tissue samples involved in this study
have been approved by the Ethics Committee of Hunan Provincial
People's Hospital [(2024) −108] and with the informed consent of
the patients themselves or their guardians and have followed the
ethical guidelines of the Declaration of Helsinki.
Patient consent for publication
Not applicable.
Competing interests
The authors declare that they have no competing
interests.
References
|
1
|
Bray F, Laversanne M, Sung H, Ferlay J,
Siegel RL, Soerjomataram I and Jemal A: Global cancer statistics
2022: GLOBOCAN estimates of incidence and mortality worldwide for
36 cancers in 185 countries. CA Cancer J Clin. 74:229–263.
2024.PubMed/NCBI
|
|
2
|
Kulik L and El-Serag HB: Epidemiology and
management of hepatocellular carcinoma. Gastroenterology.
156:477–491.e1. 2019. View Article : Google Scholar : PubMed/NCBI
|
|
3
|
European Association for the Study of the
Liver, . EASL clinical practice guidelines on the management of
hepatocellular carcinoma. J Hepatol. 82:315–374. 2025. View Article : Google Scholar : PubMed/NCBI
|
|
4
|
Zhang X, El-Serag HB and Thrift AP:
Predictors of five-year survival among patients with hepatocellular
carcinoma in the United States: An analysis of SEER-medicare.
Cancer Causes Control. 32:317–325. 2021.PubMed/NCBI
|
|
5
|
Sun B, Ding P, Song Y, Zhou J, Chen X,
Peng C and Liu S: FDX1 downregulation activates mitophagy and the
PI3K/AKT signaling pathway to promote hepatocellular carcinoma
progression by inducing ROS production. Redox Biol. 75:1033022024.
View Article : Google Scholar : PubMed/NCBI
|
|
6
|
Kutzner A, Pramanik S, Kim PS and Heese K:
All-or-(N)One-an epistemological characterization of the human
tumorigenic neuronal paralogous FAM72 gene loci. Genomics.
106:278–285. 2015. View Article : Google Scholar : PubMed/NCBI
|
|
7
|
Wang Y, Lin J, Yan K and Wang J:
Identification of a robust five-gene risk model in prostate cancer:
A robust likelihood-based survival analysis. Int J Genomics.
2020:10976022020. View Article : Google Scholar : PubMed/NCBI
|
|
8
|
Hu F, Zeng W and Liu X: A gene signature
of survival prediction for kidney renal cell carcinoma by
multi-omic data analysis. Int J Mol Sci. 20:57202019. View Article : Google Scholar : PubMed/NCBI
|
|
9
|
Chatonnet F, Pignarre A, Sérandour AA,
Caron G, Avner S, Robert N, Kassambara A, Laurent A, Bizot M,
Agirre X, et al: The hydroxymethylome of multiple myeloma
identifies FAM72D as a 1q21 marker linked to proliferation.
Haematologica. 105:774–783. 2020. View Article : Google Scholar : PubMed/NCBI
|
|
10
|
Zhou Q, Chen L, Yang L, Zhou H, Chen Y and
Guo Y: Integrated systemic analysis of FAM72A to identify its
clinical relevance, biological function, and relationship to drug
sensitivity in hepatocellular carcinoma. Front Oncol.
12:10464732022. View Article : Google Scholar : PubMed/NCBI
|
|
11
|
Kong W, Teng L, Zhang K, Zou Y, Wang X and
Zhang J: Systematic analysis of the expression profiles and
prognostic values of the FAM72 family in liver cancer. Biochem
Biophys Rep. 44:1023582025.PubMed/NCBI
|
|
12
|
Zhou Z, Fan B, Qiu Q, Cheng H, Wang L, Wu
Y, Xie J, Ni C and Li N: Pan-cancer analysis and experimental
validation reveal FAM72D as a potential novel biomarker and
therapeutic target in lung adenocarcinoma. Gene. 928:1487642024.
View Article : Google Scholar : PubMed/NCBI
|
|
13
|
Tomczak K, Czerwinska P and Wiznerowicz M:
The cancer genome atlas (TCGA): An immeasurable source of
knowledge. Contemp Oncol (Pozn). 19:A68–A77. 2015.PubMed/NCBI
|
|
14
|
Clough E and Barrett T.: The gene
expression omnibus database. Methods Mol Biol. 1418:93–110. 2016.
View Article : Google Scholar : PubMed/NCBI
|
|
15
|
Grinchuk OV, Yenamandra SP, Iyer R, Singh
M, Lee HK, Lim KH, Chow PKH and Kuznetsov VA: Tumor-adjacent tissue
co-expression profile analysis reveals pro-oncogenic ribosomal gene
signature for prognosis of resectable hepatocellular carcinoma. Mol
Oncol. 12:89–113. 2018. View Article : Google Scholar : PubMed/NCBI
|
|
16
|
Kim JH, Sohn BH, Lee HS, Kim SB, Yoo JE,
Park YY, Jeong W, Lee SS, Park ES, Kaseb A, et al: Genomic
predictors for recurrence patterns of hepatocellular carcinoma:
Model derivation and validation. PLoS Med. 11:e10017702014.
View Article : Google Scholar : PubMed/NCBI
|
|
17
|
Critelli RM, Milosa F, Romanzi A, Lasagni
S, Marcelli G, Di Marco L, Pivetti A, Schepis F, Romagnoli D,
Mancarella S, et al: Upregulation of the oestrogen target gene SIX1
is associated with higher growth speed and decreased survival in
HCV-positive women with hepatocellular carcinoma. Oncol Lett.
24:3952022. View Article : Google Scholar : PubMed/NCBI
|
|
18
|
Kanehisa M, Furumichi M, Sato Y, Kawashima
M and Ishiguro-Watanabe M: KEGG for taxonomy-based analysis of
pathways and genomes. Nucleic Acids Res. 51:D587–D592. 2023.
View Article : Google Scholar : PubMed/NCBI
|
|
19
|
Ogata H, Goto S, Sato K, Fujibuchi W, Bono
H and Kanehisa M: KEGG: Kyoto encyclopedia of genes and genomes.
Nucleic Acids Res. 27:29–34. 1999. View Article : Google Scholar : PubMed/NCBI
|
|
20
|
Kanehisa M: Toward understanding the
origin and evolution of cellular organisms. Protein Sci.
28:1947–1951. 2019. View
Article : Google Scholar : PubMed/NCBI
|
|
21
|
Von Mering C, Huynen M, Jaeggi D, Schmidt
S, Bork P and Snel B: STRING: A database of predicted functional
associations between proteins. Nucleic Acids Res. 31:258–261. 2003.
View Article : Google Scholar : PubMed/NCBI
|
|
22
|
Shannon P, Markiel A, Ozier O, Baliga NS,
Wang JT, Ramage D, Amin N, Schwikowski B and Ideker T: Cytoscape: A
software environment for integrated models of biomolecular
interaction networks. Genome Res. 13:2498–2504. 2003. View Article : Google Scholar : PubMed/NCBI
|
|
23
|
Jiang P, Gu S, Pan D, Fu J, Sahu A, Hu X,
Li Z, Traugh N, Bu X, Li B, et al: Signatures of T cell dysfunction
and exclusion predict cancer immunotherapy response. Nat Med.
24:1550–1558. 2018. View Article : Google Scholar : PubMed/NCBI
|
|
24
|
Li T, Fan J, Wang B, Traugh N, Chen Q, Liu
JS, Li B and Liu XS: TIMER: A web server for comprehensive analysis
of tumor-infiltrating immune cells. Cancer Res. 77:e108–e110. 2017.
View Article : Google Scholar : PubMed/NCBI
|
|
25
|
Ma L, Wang L, Khatib SA, Chang CW,
Heinrich S, Dominguez DA, Forgues M, Candia J, Hernandez MO, Kelly
M, et al: Single-cell atlas of tumor cell evolution in response to
therapy in hepatocellular carcinoma and intrahepatic
cholangiocarcinoma. J Hepatol. 75:1397–1408. 2021. View Article : Google Scholar : PubMed/NCBI
|
|
26
|
Shi J, Wei X, Xun Z, Ding X, Liu Y, Liu L
and Ye Y: The web-based portal SpatialTME integrates histological
images with single-cell and spatial transcriptomics to explore the
tumor microenvironment. Cancer Res. 84:1210–1220. 2024. View Article : Google Scholar : PubMed/NCBI
|
|
27
|
Wu R, Guo W, Qiu X, Wang S, Sui C, Lian Q,
Wu J, Shan Y, Yang Z, Yang S, et al: Comprehensive analysis of
spatial architecture in primary liver cancer. Sci Adv.
7:eabg37502021. View Article : Google Scholar : PubMed/NCBI
|
|
28
|
Livak KJ and Schmittgen TD: Analysis of
relative gene expression data using real-time quantitative PCR and
the 2(−Delta Delta C(T)) method. Methods. 25:402–408. 2001.
View Article : Google Scholar : PubMed/NCBI
|
|
29
|
Zheng J, Wang S, Xia L, Sun Z, Chan KM,
Bernards R, Qin W, Chen J, Xia Q and Jin H: Hepatocellular
carcinoma: Signaling pathways and therapeutic advances. Signal
Transduct Target Ther. 10:352025. View Article : Google Scholar : PubMed/NCBI
|
|
30
|
Magyar CTJ, O'Kane GM, Aceituno L, Li Z,
Vogel A, Bruix J, Mazzaferro V and Sapisochin G: Liver
transplantation for hepatocellular carcinoma: An expanding
cornerstone of care in the era of immunotherapy. J Clin Oncol.
43:589–604. 2025. View Article : Google Scholar : PubMed/NCBI
|
|
31
|
Yeo YH, Abdelmalek M, Khan S, Moylan CA,
Rodriquez L, Villanueva A and Yang JD: Current and emerging
strategies for the prevention of hepatocellular carcinoma. Nat Rev
Gastroenterol Hepatol. 22:173–190. 2025. View Article : Google Scholar : PubMed/NCBI
|
|
32
|
Jian Q, Li Y, Duan W, Yang J, Zheng Z, Xie
Q, Yu J, Sun B, Deng Y, He L and Liu S: Hypoxia-induced ADAM8+
macrophages and FAP+ fibroblasts form an extracellular
matrix-remodeling niche at the tumor boundary in HCC. Cancer
Immunol Res. 14:1254–1271. 2026. View Article : Google Scholar : PubMed/NCBI
|
|
33
|
Yang R, Lu C, Jian Q, Song Y, Sun B, He W,
Li J, Yang F, Wang X, Tan Z, et al: HBV-driven expansion of
CXCR6+-exhausted T cells and CXCL16+ macrophage interaction:
Implications for immunotherapy in HCC. Innovation (Camb).
7:1012742026.PubMed/NCBI
|
|
34
|
Song X, Zhang Y, Li T, Wang W, Xie Z and
Han B: Identification and validation of alkaliptosis
resistance-associated genes in prostate cancer via transcriptome
sequencing and prediction of biochemical recurrence. Mol
Biotechnol. 68:105–119. 2026. View Article : Google Scholar : PubMed/NCBI
|
|
35
|
Lammens T, Li J, Leone G and De Veylder L:
Atypical E2Fs: New players in the E2F transcription factor family.
Trends Cell Biol. 19:111–118. 2009. View Article : Google Scholar : PubMed/NCBI
|
|
36
|
Ben-Sahra I and Manning BD: mTORC1
signaling and the metabolic control of cell growth. Curr Opin Cell
Biol. 45:72–82. 2017. View Article : Google Scholar : PubMed/NCBI
|
|
37
|
Bretones G, Delgado MD and Leon J: Myc and
cell cycle control. Biochim Biophys Acta. 1849:506–516. 2015.
View Article : Google Scholar : PubMed/NCBI
|
|
38
|
Liao GB, Li XZ, Zeng S, Liu C, Yang SM,
Yang L, Hu CJ and Bai JY: Regulation of the master regulator FOXM1
in cancer. Cell Commun Signal. 16:572018. View Article : Google Scholar : PubMed/NCBI
|
|
39
|
Xia L, Huang W, Tian D, Zhu H, Zhang Y, Hu
H, Fan D, Nie Y and Wu K: Upregulated FOXM1 expression induced by
hepatitis B virus X protein promotes tumor metastasis and indicates
poor prognosis in hepatitis B virus-related hepatocellular
carcinoma. J Hepatol. 57:600–612. 2012. View Article : Google Scholar : PubMed/NCBI
|
|
40
|
Huang XY, Zhang PF, Wei CY, Peng R, Lu JC,
Gao C, Cai JB, Yang X, Fan J, Ke AW, et al: Circular RNA circMET
drives immunosuppression and anti-PD1 therapy resistance in
hepatocellular carcinoma via the miR-30-5p/snail/DPP4 axis. Mol
Cancer. 19:922020. View Article : Google Scholar : PubMed/NCBI
|
|
41
|
Nishina S, Yamauchi A, Kawaguchi T, Kaku
K, Goto M, Sasaki K, Hara Y, Tomiyama Y, Kuribayashi F, Torimura T
and Hino K: Dipeptidyl peptidase 4 inhibitors reduce hepatocellular
carcinoma by activating lymphocyte chemotaxis in mice. Cell Mol
Gastroenterol Hepatol. 7:115–134. 2019. View Article : Google Scholar : PubMed/NCBI
|
|
42
|
Dong ZR, Sun D, Yang YF, Zhou W, Wu R,
Wang XW, Shi K, Yan YC, Yan LJ, Yao CY, et al: TMPRSS4 drives
angiogenesis in hepatocellular carcinoma by promoting HB-EGF
expression and proteolytic cleavage. Hepatology. 72:923–939. 2020.
View Article : Google Scholar : PubMed/NCBI
|
|
43
|
Garcia-Lezana T, Lopez-Canovas JL and
Villanueva A: Signaling pathways in hepatocellular carcinoma. Adv
Cancer Res. 149:63–101. 2021. View Article : Google Scholar : PubMed/NCBI
|
|
44
|
Liedtke C and Trautwein C: The role of
TNF- and Fas-dependent signaling in animal models of inflammatory
liver injury and liver cancer. Eur J Cell Biol. 91:582–589. 2012.
View Article : Google Scholar : PubMed/NCBI
|
|
45
|
Madhi H, Lee JS, Choi YE, Li Y, Kim MH,
Choi Y and Goh SH: FOXM1 inhibition enhances the therapeutic
outcome of lung cancer immunotherapy by modulating PD-L1 expression
and cell proliferation. Adv Sci (Weinh). 9:e22027022022. View Article : Google Scholar : PubMed/NCBI
|
|
46
|
Ziman B, Yang Q, Zheng Y, Sheth M, Nam C,
Zhao H, Zhang L, Hu B, Bhowmick NA, Sinha UK and Lin DC: Epigenomic
analyses identify FOXM1 as a key regulator of antitumor immune
response in esophageal adenocarcinoma. Cell Death Dis. 15:1522024.
View Article : Google Scholar : PubMed/NCBI
|