Introduction
Recently, the anti-epileptic drug valproate, also
used for the treatment of bipolar disorder, migraine and
neuropathic pain, has attracted increased interest for its use in
cancer therapy. Many clinical studies have shown that VPA, alone or
in combination with other non-classical anti-leukaemic compounds,
exerts significant anti-leukaemic effects in patients with chronic
myeloid leukaemia (CML). Studies have also demonstrated that VPA
inhibits histone deacetylases (HDAC), modulates cell cycle, induces
tumour cell death and inhibits angiogenesis in various tumour
models. The exact molecular mechanisms underlying the observed
anti-CML effect, however, remain to be elucidated.
Cancer formation and persistence may not only be a
result of genetic mutations, but may also be due to changes in the
patterns of epigenetic modifications. Various epigenetic factors
interact with each other to co-regulate gene expression, including
the alternative splicing (AS) of mRNA. These processes mediate the
progression of cancer. The most common epigenetic modifications
include the methylation of CpG islands within the DNA and the
modification of amino acids in the N-terminal histone tails,
particularly reversible histone acetylation. Accumulating sources
of evidence indicate that AS is altered or becomes aberrant during
the progression of CML. For example, unusual splice variants of
several genes, including BCR-ABL1, Ikaros, osteocalcin (OCN),
growth factor independent 1b (Gfi1b) and c-Fes, have been detected
in CML cell lines and or tumour tissues (1–5). These
observed changes may potentially be a result of epigenetic
modifications. Recently, DNA methylation and histone acetylation
status of 5′ sequences of CD7 and ELA2, genes associated with CML
clinical outcome, in leukaemic cell lines and primitive leukaemic
cells from chronic phase CML patients have been reported to
contribute to the variable expression of these two genes (6).
VPA exposure, similar to other HDAC inhibitors,
results in the altered expression of many genes and the switching
of splice sites in certain diseases by promoting histone
acetylation and/or inducing demethylation (7–9). For
example, VPA was found to trigger DNA demethylation and restore the
splicing pattern of SMN2 transcripts in fibroblast cultures derived
from proximal spinal muscular atrophy (SMA) patients via Htra2-β1,
the splicing factor essential for the inclusion of exon 7 into SMN2
mRNA (10). Since AS studies have
traditionally focused on single genes, little is known about
genome-wide shifting of splicing sites during the progression of
CML in a controlled setting or following VPA treatment. Recently,
exon microarrays have been successfully used to evaluate
genome-wide splicing events in other cancer types (11,12).
Simultaneous detections of the expression profiling and splicing
events based on the same exon microarray have also been reported
(13,14). In the current study, we investigated
the effect of VPA treatment on the K562 cell line, a model for CML,
at the cell level using the Annexin-V/PI dual staining method and
genome-wide expression and AS levels using exon microarray.
Materials and methods
Culture of K562 cell line
K562, a human chronic myelogenious leukemic cell
line was obtained from the Sun Yat-sen University Cancer Center.
K562 cells were grown and maintained in RPMI-1640 (Life Technology
Corp., Camarillo, CA) containing 15% FBS, 100 U/ml penicillin and 1
mg/ml streptomycin in a 5% CO2 incubator at 37°C.
Assessment of apoptosis by Annexin-V/PI
dual staining method
Apoptotic cells were determined by
fluorescence-activated cell sorting (FACS) analysis after staining
with Annexin-V/PI. Briefly, K562 cells were exposed to 2 mM of VPA
for 48 h. The control group received drug-free medium. At the end
of the treatment period, the control (untreated) and treated cells
were harvested, washed twice with cold PBS at 1,000 rpm for 5 min
and passed through a 400-mesh cell strainer. Then cells were
collected and gently resuspended to a final concentration of
1×10⁶/ml in binding buffer. Annexin-V-FITC (5 μl) and 10
μl 50 mg/l PI were added to 100 μl of cell suspension and incubated
with cells in the dark for 15 min. At the end of incubation, 400 μl
binding buffer were added and analysis by a FACScan flow cytometer
was carried out to discriminate between live and apoptotic
cells.
Analysis of gene expression profile and
AS by the Agilent human exon microarray
K562 cells were either treated with 2 mM VPA for 12
h or left untreated as a control. RNA was extracted from cultured
cells using the RNeasy Mini Kit (Qiagen, USA) according to the
manufacturer’s instructions. RNA quality was assessed using
formaldehyde agarose gel electrophoresis and was quantified via
spectrophotometry (Nanodrop, Wilmington, DE). RNA was amplified
using the Agilent Low Input Quick Amp WT labeling kit according to
the manufacturer’s guidelines with a small modification. Briefly,
100 ng of total RNA was used to synthesise double-stranded cDNA.
RNA was amplified by in vitro transcription using WT Primer
mix that reverse transcribed throughout the 3′ to 5′ end of mRNA,
replacing the T7 promoter primer using in standard expression
array, in which only the 3′ end of mRNA was reverse-transcribed.
aRNA was then reverse transcribed into cDNA and was labelled with
cy3-dCTP or cy5-dCTP using Klenow enzyme. Fluorescent dye-labelled
cDNA was hybridised to an Agilent Human 4×180K Exon Microarray,
which included 174,458 exon probes, targeting 20,411 genes.
Hybridisation, scanning and washing were performed on Agilent’s
Microarray Platform according to Agilent’s standard protocols. The
array data were analysed with Agilent Feature Extraction software.
Following global mean normalization, probes with an intensity
<400 were removed for further analysis. The geometric mean of
all exon-level probe signalling for each transcript was considered
the transcript-level probe signalling of this transcript. Based on
the evaluation of the systematic noise of microarray experiments
using self-to-self comparisons (15), we defined differentially expressed
genes as genes with at least a 2-fold change in transcript-level
probe signalling in VPA-treated samples relative to those observed
in control samples.
Differentially expressed genes were further analysed
based on a significant enrichment of GO terms using hypergeometric
distribution in the R language package software.
Detection of AS genes was based on the ‘Splicing
Index (SI)’ model (16), which
aimed to identify exons that have differential inclusion rates
(relative to the gene level) between two sample groups.
Validation of differentially expressed
genes and AS genes
From the differentially expressed genes identified
by microarray analysis, six genes were selected based on the
function of interest and expression levels were confirmed using
quantitative real-time RT-PCR. One microgram of DNase-treated total
RNA, isolated from K562 cell line treated with or without valproate
exclusively for validation of differentially expressed genes and AS
genes, were reverse transcribed with oligo(dT)15 using M-MLV
reverse transcriptase (Life Technologies) in a total volume of 20
μl reaction volume. Following reverse transcription reaction, 1 μl
of this mixture was employed for a qPCR program of 45 cycles of
melting (30 sec at 94°C), annealing (30 sec at 58°C) and extension
(30 sec at 72°C). The 20 μl reaction mixture contained 1X PCR
Buffer (Mg2+ Plus), 200 μM of each dNTP, 0.5 μM of
forward primer, 0.5 μM of reverse primer (Table I), and EvaGreen Master Mix in a
LightCycler® 480 Real-Time PCR System (Roche Applied
Science). Data were analysed by the 2−ΔΔCt method
(17) using glyceraldehyde
3-phosphate dehydrogenase (GADPH) as a reference gene. All other
results are shown as fold-change relative to GADPH control.
 | Table IPrimer pairs for qRT-PCR validation of
the differentially expressed genes. |
Table I
Primer pairs for qRT-PCR validation of
the differentially expressed genes.
| Gene symbol | GenBank accession
no. | Primer (5′→3′) |
|---|
| BCL2L12 | NM_138639 | F:
TCTCCTGTTCCAACTCCACCTA
R: CGCAGTATGGCTTCCTTCTCT |
| BTG2 | NM_006763 | F:
CCAAACACTCTCCCTACCCATT
R: GAGACCATGAGGCTGCTTCTAA |
| BAX | NM_138764 | F:
TTCTGACGGCAACTTCAACTG
R: TCTTCTTCCAGATGGTGAGTGAG |
| BID | NM_197966 | F:
GGTCTGCTGTTCCAGTGGTAA
R: TGAGTCCGTCAGTGCCCTTA |
| CUL1 | NM_003592 |
F:TGGAGCGAGTGGATGGTGAA
R: AATGGCGTTGGTGTCCGTATT |
| PRKCA | NM_002737 | F:
GGCACACCAGACAATCGTAATC
R: GAGGCAGGAGAATCGCTTGAA |
Alternative forms of genes are often found to be
expressed at lower levels than constitutive forms. In such cases,
traditional flanking-PCR, in which primers target constant exon
sequences flanking each alternative exon, results in a poor
sensitivity for detecting alternative variants. To validate the
alternatively spliced genes detected by the exon array, we
conducted semi-nested PCR analyses using reverse primers that
target the predicted exon rather than the constitutive exon and
that were designed specifically for two rounds of PCR, as described
by Leparc and Mitra (18). Briefly,
1 μg of DNase-treated total RNA, isolated from the K562 cell line
treated with or without valproate exclusively for validation of
differentially expressed genes and AS genes, was reverse
transcribed with random hexanucleotide primers using M-MLV reverse
transcriptase in a total reaction volume of 20 μl. Following
reverse transcription, 1 μl of this cDNA mixture was used for a
first round program of 25 cycles of melting (30 sec at 94°C),
annealing (30 sec at 55°C) and extension (30 sec at 72°C). The 20
μl reaction mixture contained 1X PCR Buffer (Mg2+ Plus),
200 μM of each dNTP, 0.5 μM of forward primer, 0.5 μM of reverse
primer (primer sequences are provided in Table II), 0.5 unit of Takara Taq HS and
1.0 μl of cDNA. The second round reaction was performed for 30
cycles using the same program but with a 1:100 dilution of first
round reaction as the template. PCR products were separated on 2%
agarose gels supplemented with ethidium bromide. DNA was visualised
under a UV light.
| Table IIPrimer pairs for semi-nested PCR
validation of alternatively spliced genes. |
Table II
Primer pairs for semi-nested PCR
validation of alternatively spliced genes.
| Gene symbol | GenBank accession
no. | Primer (5′→3′) |
|---|
| CBLC | NM_012116_exon
2 | F1:
ACCACCATTGACCTCACCTG |
| NM_012116_ exon
4 |
R1:TTTGTTGGCAGGGATGGTCT |
| NM_012116_ exon
3 | F2:
ATGAGGTCCAAGAGCGTCTG |
| NM_012116_ exon
4 | R2:
TTTGTTGGCAGGGATGGTCT |
| TEAD4 | NM_003213_ exon
3 | F1:
AGCTGATTGCCCGCTACATC |
| NM_003213_ exon
5 | R1:
GGCCATGCTACTGTGGAAGG |
| NM_003213_ exon
4 | F2:
GCTAAAGGACCAGGCAGCTAA |
| NM_003213_ exon
5 | R2:
GGCCATGCTACTGTGGAAGG |
| TBX1 | NM_005992_ exon
1 | F1:
CACTTCAGCACCGTCACCA |
| NM_005992_ exon
3 | R1:
ACGAAGTCCATGAGCAGCATAT |
| NM_005992_ exon
2 | F2:
CACCGAGATGATCGTCACCAA |
| NM_005992_ exon
3 | R2:
ACGAAGTCCATGAGCAGCATAT |
Statistics
The Student’s t-test (Microsoft Excel, Microsoft
Corp., Seattle, WA) was performed to determine the significance
between groups. A P-value of <0.05 was considered statistically
significant. The microarray data have been deposited in NCBI’s Gene
Expression Omnibus (http://www.ncbi.nlm.nih.gov/geo) and are accessible
through GEO series accession number GSE 38252.
Results
Analysis of apoptosis using the
Annexin-V/PI dual staining method
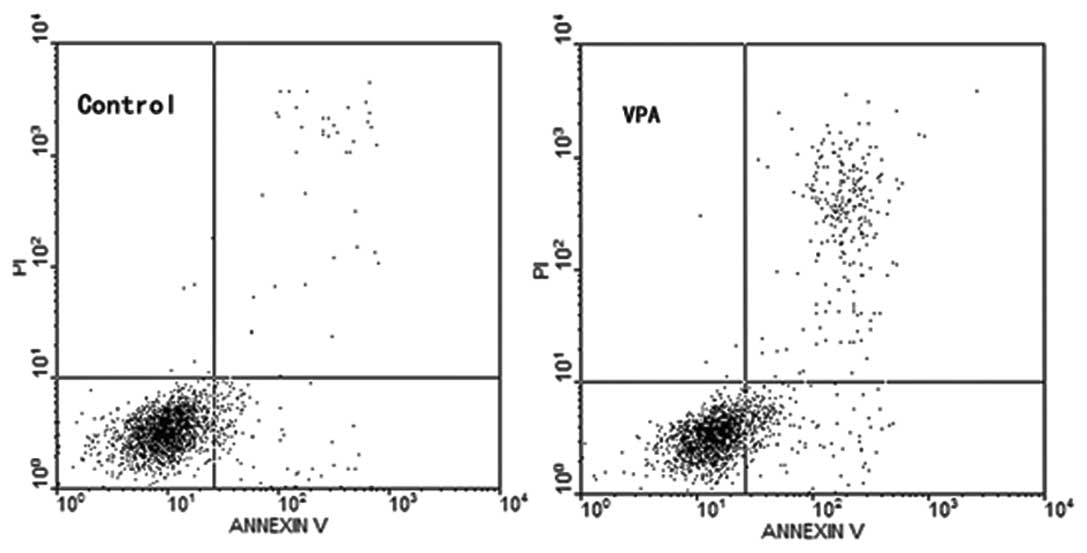
Control and treated K562 cells were stained with
Annexin-V-FITC/PI and gated into LR (lower right) and UR (upper
right) quadrants. Cells in the LR and UR quadrants were considered
early apoptotic (Annexin+/PI−) and late
apoptotic (Annexin+/PI+), respectively
(Fig. 1). The extent of apoptosis
was expressed as the sum of the percentage of cells gated in LR and
UR quadrants. Relative to the K562 control, a significant increase
in apoptosis was observed in K562 cells exposed to 2 mM VPA for 48
h (Table III).
| Table IIIApoptosis rate of K562 cells due to
exposure of 2 mM VPA for 48 h. |
Table III
Apoptosis rate of K562 cells due to
exposure of 2 mM VPA for 48 h.
| Groups | n | Percentage of
apoptosis (%) |
|---|
| VPA treatment | 3 | 11.47±0.25a |
| Control | 3 | 4.77±0.40 |
Differentially expressed genes in K562
cells pretreated with VPA detected by Agilent human exon
microarray
Differentially expressed genes are more easily
detected in cells during the primary response phase of a drug
exposure at certain doses that result in a 10–20% decrease in cell
viability. Based on this information, we pretreated K562 cells with
2 mM VPA for 12 h, a dose resulting in an approximately 12%
decrease in cell viability. The Agilent Human 4×180K Exon
Microarray, with probes targeting all exons within genes, can
provide gene-level expression information as well as AS
information. Using this Agilent microarray platform, the
transcription profiles of K562 cells treated with or without VPA
were analysed. A total of 628 transcripts were identified as being
significantly differentially expressed (full list of differentially
expressed genes is available upon request). The number of genes
demonstrating increased expression levels was greater than the
number of genes demonstrating decreased expression levels (445 vs.
183 genes, respectively).
The significant enrichment analysis of GO terms for
the differentially expressed genes using the R language package
software revealed that these genes are involved in many important
biological processes, including apoptosis and the regulation of B
cell differentiation. As shown in Table IV, there were five differentially
expressed genes involved in the positive regulation of
anti-apoptosis and three differentially expressed genes involved in
the induction of apoptosis by intracellular signals.
| Table IVSignificant enrichment analysis of GO
terms of the differentially expressed genes using the R language
package software. |
Table IV
Significant enrichment analysis of GO
terms of the differentially expressed genes using the R language
package software.
| Pathways | Genes |
|---|
|
|
|---|
| Name | P-valuea | Name | Fold-change | Gene
description |
|---|
| Positive regulation
of anti-apoptosis | 0.0011 | CDKN1A | 2.03 | Cyclin-dependent
kinase inhibitor 1A |
| | IL6ST | 3.40 | Interleukin 6
signal transducer |
| | LIFR | 2.84 | Leukaemia
inhibitory factor receptor α |
| | BTG2 | 2.68 | B-cell
translocation gene 2 |
| | CAV1 | 7.99 | Caveolae
protein |
| Regulation of B
cell differentiation | 0.0047 | CD24 | 4.50 | CD24 antigen |
| | PTPRC | −2.23b | Protein tyrosine
phosphatase, receptor type, c polypeptide |
| Leukaemia
inhibitory factor signalling pathway | 0.0047 | IL6ST | 3.40 | Interleukin 6
signal transducer |
| | LIFR | 2.85 | Leukaemia
inhibitory factor receptor α1 |
| Induction of
apoptosis by intracellular signals | 0.0067 | CD24 | 4.50 | CD24 antigen |
| | CDKN1A | 2.03 | Cyclin-dependent
kinase inhibitor 1A |
| | CUL4A | −2.12 | Cullin 4A |
| Negative regulation
of cytokine-mediated signalling pathway | 0.0077 | PTPRC | −2.23 | Protein tyrosine
phosphatase, receptor type, c polypeptide |
| | CAV1 | 7.99 | Caveolae
protein |
| Collagen
biosynthetic process | 0.0077 | COL1A1 | 2.19 | Collagen, type I,
α1 |
| | SERPINH1 | −2.63 | Serpin peptidase
inhibitor, clade H, member 1 |
Validation of the differentially
expressed genes using qRT-PCR
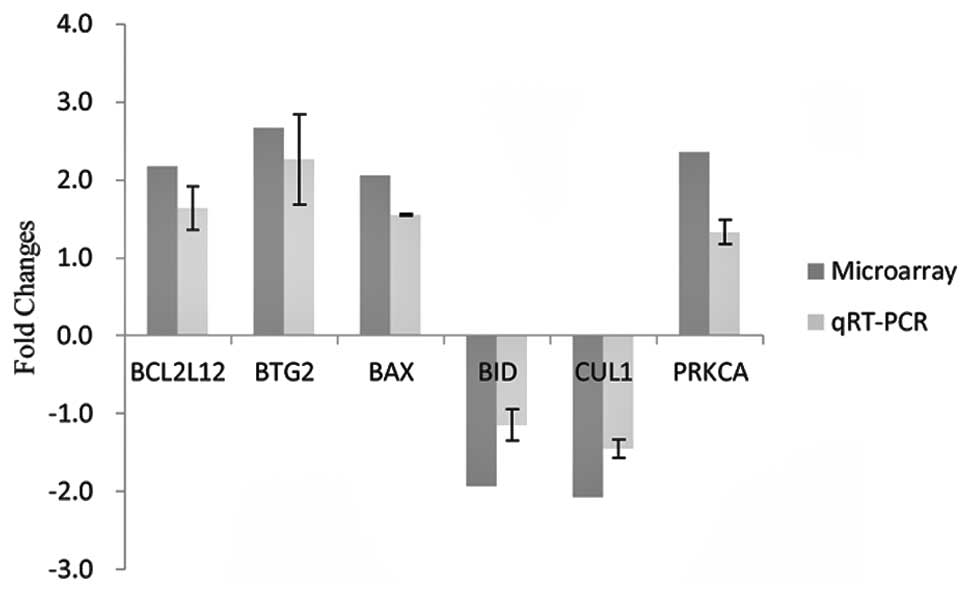
Based on the microarray results, the differentially
expressed genes with high probe signals in the categories of
positive regulation of anti-apoptosis and induction of apoptosis by
intracellular signals were selected for qRT-PCR confirmation. As
depicted in Fig. 2 and consistent
with the results obtained from microarray analysis, BCL2L12, BTG2,
BAX and PRKCA were upregulated and CUL1 was downregulated.
AS events in K562 cells pretreated with
VPA detected by Agilent human exon microarray
In the present study, differentially expressed
splice variants in K562 cells treated with VPA were evaluated using
an Agilent Human 4×180K Exon Microarray designed to detect
differential splicing of 20,411 genes (174,458 exon probes). In
total, 198 candidates of AS variants were identified (full list of
candidate AS variants is available upon request). The significant
enrichment analysis of GO terms for the AS genes using the R
language package software revealed that the AS genes were involved
in many important biological processes, including negative
regulation of the cytokine-mediated signalling pathway, negative
regulation of erythrocyte differentiation, positive regulation of
γ-δ T cell differentiation, mitotic cell cycle spindle assembly
checkpoint, positive regulation of neuron apoptosis, DNA damage
checkpoint and the Wnt receptor signalling pathway (Table V).
| Table VSignificant enrichment analysis of GO
terms of the alternative splicing genes using the R language
package software. |
Table V
Significant enrichment analysis of GO
terms of the alternative splicing genes using the R language
package software.
| Pathways | Genes |
|---|
|
|
|---|
| Name | q-value | Name | SI | Gene
description |
|---|
| L-alanine
transport | 0.018 | SLC38A3 | 0.26 | Solute carrier
family 38, member 3 |
| | SLC36A1 | 0.31 | Solute carrier
family 36 member 1 |
| Negative regulation
of cytokine-mediated signaling pathway | 0.019 | PTPRC | 4.91 | Protein tyrosine
phosphatase, receptor type, C |
| | PTPRF | 3.12 | Protein tyrosine
phosphatase, receptor type, F |
| Negative regulation
of erythrocyte differentiation | 0.019 | STAT5A | 3.40 | Signal transducer
and activator of transcription |
| | LDB1 | 5.86 | LIM domain binding
1 isoform 3 |
| Positive regulation
of γ-δ T cell differentiation | 0.022 | PTPRC | 4.91 | Protein tyrosine
phosphatase, receptor type, C |
| | STAT5A | 3.40 | Signal transducer
and activator of transcription |
| Mitotic cell cycle
spindle assembly checkpoint | 0.042 | CENPF | 3.55 | Centromere protein
F |
| | ATM | 53.02 | Ataxia
telangiectasia mutated isoform 1 |
| Regulation of Rab
GTPase activity | 0.042 | TBC1D10C | 0.26 | TBC1 domain family,
member 10C |
| | TBC1D2 | 3.74 | TBC1 domain family,
member 2 |
| | TBC1D15 | 40.77 | TBC1 domain family,
member 15 isoform 1 |
| Positive regulation
of neuron apoptosis | 0.042 | ATM | 53.02 | Ataxia
telangiectasia mutated isoform 1 |
| | PTPRF | 3.12 | Protein tyrosine
phosphatase, receptor type, F |
| DNA damage
checkpoint | 0.042 | ATM | 53.02 | Ataxia
telangiectasia mutated isoform 1 |
| | BRIP1 | 69.68 | BRCA1 interacting
protein C-terminal helicase 1 |
| Wnt receptor
signaling pathway, calcium modulating pathway | 0.042 | ROR2 | 3.00 | Receptor tyrosine
kinase-like orphan receptor 2 |
| | WNT11 | 4.05 | Wingless-type MMTV
integration site family |
| Lactation | 0.042 | STAT5A | 3.40 | Signal transducer
and activator of transcription |
| | USF2 | 4.20 | Upstream
stimulatory factor 2 isoform 1 |
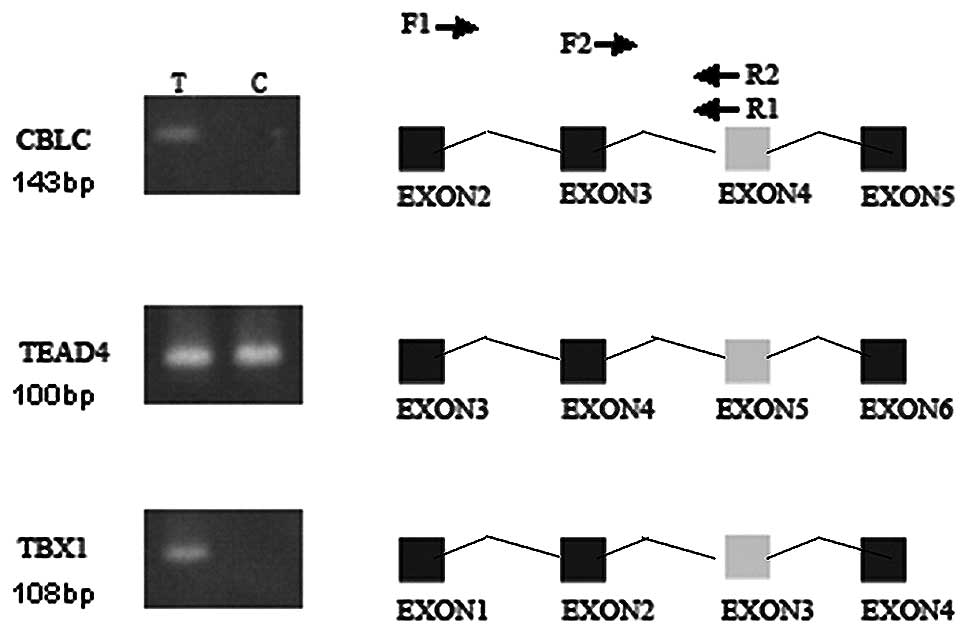
After filtering and inspecting the results in order
to characterise the candidate splicing events, CBLC, TEAD4 and TBX1
were selected for validation by semi-nested PCR. Events for CBLC
and TBX1 were confirmed (Fig.
3).
Discussion
In this current study, we first investigated the
effects of VPA treatment on growth and survival of K562 cells. VPA
is a short-chain, branched fatty acid that has recently been
described as a potent inhibitor of HDAC at therapeutic
concentrations. Unlike other HDAC inhibitors, which are associated
with various toxic side effects, VPA is clinically available. It
can be taken orally, can cross the blood-brain barrier and can be
used for extended periods. HDAC inhibition is responsible for the
acetylation of histones, a process mediated by HATs. This event has
been associated with the induction of apoptosis in many models of
leukaemia (19,20). Thus, the use of VPA prior to or
concurrently with anticancer drugs may prove to be a beneficial
treatment of leukaemia (21,22).
The K562 cell line, originating from a patient diagnosed with CML
in terminal blast crisis, is highly undifferentiated and of the
granulocytic series. Our data demonstrate that VPA exposure induces
cell death in K562 cells in a dose-dependent manner. This result is
in agreement with previous reports on CML (23,24)
and other types of leukaemia (25,26).
Microarrays allow for the analysis of global gene
expression profiles in a single experiment. This assay also
provides a high-throughput tool to disclose the molecular
mechanisms of anti-leukaemic activity observed following exposure
to certain compounds. Based on this high-throughput technology, the
underlying molecular mechanisms for the observed anti-leukaemic
activity of VPA in CLL cells (27)
and AML cells (25,28) have been described. Genome-wide gene
expression changes in CML, however, have not been reported. CML is
a type of myeloproliferative disease associated with a
characteristic chromosomal translocation called the Philadelphia
chromosome. Conversely, CLL affects B cell lymphocytes, and AML is
characterized by the rapid growth of abnormal white blood cells
that accumulate in the bone marrow and interfere with the
production of normal blood cells. The observed clinical features
and pathology of CML patients, as well as the therapy options, are
quite different from that of CLL and AML patients. Consequently,
the effect of VPA treatment on CML patients and the underlying
molecular mechanisms may be different from effects observed in CLL
and AML patients. Based on this information, we investigated the
global gene expression profile of K562 cells exposed to VPA using
an exon microarray. Our microarray data demonstrated that VPA
exposure resulted in widespread gene expression changes in this
cell line. We observed a greater number of upregulated genes than
downregulated genes (445 genes vs. 173 genes, respectively).
Studies have demonstrated that histone acetylation leads to the
relaxation of the nucleosome structure, releasing the DNA to allow
for transcription. Inhibition of HDAC promotes decondensed
chromatin formation, thereby promoting the expression of genes;
therefore, our observation that the number of upregulated genes was
greater than that of downregulated genes is consistent with VPA
acting as an HDAC inhibitor. Among these differentially expressed
genes, two functional categories of these genes are of particular
interest because the differential expression may indicate the
mechanism underlying VPA-induced apoptosis in K562 cells. Based on
this data, six of these genes were selected to undergo qRT-PCR
validation. BCL2L12, BTG2, BAX and PRKCA were confirmed to be
upregulated following VPA exposure, and CUL1 was downregulated.
These results suggest that VPA exposure induces K562 cells
apoptosis by interfering with genes involved in apoptosis,
including both the anti-apoptotic and pro-apoptotic pathways.
AS is a mechanism that increases transcriptome and
proteome diversity by allowing for the generation of multiple mRNA
products from a single gene. This process is a vast source of
biological regulation and diversity that is mis-regulated in cancer
(29–31). Antagonistic splice variants of genes
involved in apoptosis often exist in a delicate equilibrium, which
is perturbed in tumours (32,33).
To gain a better understanding of the anti-cancer and pro-apoptotic
mechanisms of VPA exposure in a CML model, we used an exon
microarray to further investigate the genome-wide shifting of
splicing sites in K562 cells treated with or without VPA. In total,
198 candidates of AS variants were identified. CBLC and TBX1 were
confirmed as AS by semi-nested PCR. It is interesting to note that
VPA-exposed K562 cells exhibited increased AS variants for CBLC and
TBX1 than normal (untreated) K562 cells. Studies have demonstrated
that cancerous tissues exhibit lower levels of AS than normal
tissues (30,34). We hypothesise that CML may result in
a loss of AS events and that VPA exposure may restore these lost
events.
CBLC is phosphorylated upon activation of a variety
of receptors that signal via protein tyrosine kinases. This process
is involved in many important molecular pathways, including the
ErbB signalling pathway, ubiquitin-mediated proteolysis,
endocytosis, the Jak-STAT signalling pathway, the T cell receptor
signalling pathway and CML. Mutations in the Cbl family RING finger
domain or linker sequence constitute important pathogenic lesions
associated with not only preleukaemic CMML, juvenile myelomonocytic
leukeamia (JMML), and other myeloproliferative neoplasms (MPN), but
also progression to AML, suggesting that impaired degradation of
activated tyrosine kinases constitutes an important cancer
mechanism (35). CBLC has two
splice isoforms. In this study, we detected the long (CBLC-L) and
short forms of CBLC (CBLC-S) in VPA-exposed K562 cells, while only
CBLC-S was detected in normal K562 cells. Currently, it is unclear
whether CBLC-L has a therapeutic benefit in CML patients or whether
it is merely a marker of therapeutic improvement in CML patients.
Previous study has demonstrated that CBLC-L, but not CBLC-S, is
involved in MAPK signalling (36).
We hypothesise that the presence of CBLC-L in VPA-exposed K562
cells may be associated with VPA-induced apoptosis.
TBX1 is a member of a phylogenetically conserved
family of genes that share a common DNA-binding domain, the T-box.
T-box genes encode transcription factors involved in the regulation
of developmental processes. Studies using mouse models of DiGeorge
syndrome suggest a major role for this gene in the molecular
etiology of DGS/VCFS. Currently, only three isoforms of AS
(NM_005992.1, NM_080646.1 and NM_080647.1) have been described for
this gene, and they all contain exon 3. In this study, we detected
an aberrant variant that lacked exon 3 in normal K562 cells. It
remains to be elucidated whether the presence of this aberrant
variant occurred only after cells have been transformed or whether
this form plays a role in the initiation of tumourigenesis. The
emergence of an AS variant containing exon 3 in VPA-exposed K562
cells, however, seems to suggest that VPA exposure restores the
aberrant AS in K562 cells.
The significant enrichment analysis of GO terms
revealed that the differentially expressed genes were involved in
the regulation of B cell differentiation, and the AS genes were
involved in the positive regulation of γ-δ T cell differentiation.
These results suggest that in addition to inducing apoptosis, VPA
exposure may also modulate immune responses to CML.
In conclusion, we observed that VPA exposure altered
mRNA expression and AS events in the K562 cell line. These
alterations might be associated with the pro-apoptotic effect of
VPA. The data obtained in this study may provide the basis for
further studies to elucidate the molecular and therapeutic
potential of VPA in leukaemia treatment.
Acknowledgements
This study was supported by the Guangdong Province
Science and Technology Fund no. 2009B030803033.
Abbreviations:
|
CML
|
chronic myelogenous leukaemia
|
|
VPA
|
sodium valproate
|
|
AS
|
alternative splicing
|
References
|
1
|
Carlson A, Berkowitz JM, Browning D,
Slamon DJ, Gasson JC and Yates KE: Expression of c-Fes protein
isoforms correlates with differentiation in myeloid leukemias. DNA
Cell Biol. 24:311–316. 2005. View Article : Google Scholar : PubMed/NCBI
|
|
2
|
Gaillard JB, Arnould C, Bravo S, et al:
Exon 7 deletion in the bcr-abl gene is frequent in chronic myeloid
leukemia patients and is not correlated with resistance against
imatinib. Mol Cancer Ther. 9:3083–3089. 2010. View Article : Google Scholar : PubMed/NCBI
|
|
3
|
Matulic M, Paradzik M, Puskaric BJ, Stipic
J and Antica M: Analysis of Ikaros family splicing variants in
human hematopoietic lineages. Coll Antropol. 34:59–62.
2010.PubMed/NCBI
|
|
4
|
Vassen L, Khandanpour C, Ebeling P, et al:
Growth factor independent 1b (Gfi1b) and a new splice variant of
Gfi1b are highly expressed in patients with acute and chronic
leukemia. Int J Hematol. 89:422–430. 2009. View Article : Google Scholar : PubMed/NCBI
|
|
5
|
Wihlidal P, Varga F, Pfeilstocker M and
Karlic H: Expression and functional significance of osteocalcin
splicing in disease progression of hematological malignancies. Leuk
Res. 30:1241–1248. 2006. View Article : Google Scholar : PubMed/NCBI
|
|
6
|
Rogers SL, Zhao Y, Jiang X, Eaves CJ,
Mager DL and Rouhix A: Expression of the leukemic prognostic marker
CD7 is linked to epigenetic modifications in chronic myeloid
leukemia. Mol Cancer. 9:412010. View Article : Google Scholar : PubMed/NCBI
|
|
7
|
Luco RF, Allo M, Schor IE, Kornblihtt AR
and Misteli T: Epigenetics in alternative pre-mRNA splicing. Cell.
144:16–26. 2011. View Article : Google Scholar : PubMed/NCBI
|
|
8
|
Luco RF, Pan Q, Tominaga K, Blencowe BJ,
Pereira-Smith OM and Misteli T: Regulation of alternative splicing
by histone modifications. Science. 327:996–1000. 2010. View Article : Google Scholar : PubMed/NCBI
|
|
9
|
Milutinovic S, D’Alessio AC, Detich N and
Szyf M: Valproate induces widespread epigenetic reprogramming which
involves demethylation of specific genes. Carcinogenesis.
28:560–571. 2007. View Article : Google Scholar : PubMed/NCBI
|
|
10
|
Brichta L, Hofmann Y, Hahnen E, et al:
Valproic acid increases the SMN2 protein level: a well-known drug
as a potential therapy for spinal muscular atrophy. Hum Mol Genet.
12:2481–2489. 2003. View Article : Google Scholar : PubMed/NCBI
|
|
11
|
Langer W, Sohler F, Leder G, et al: Exon
array analysis using re-defined probe sets results in reliable
identification of alternatively spliced genes in non-small cell
lung cancer. BMC Genomics. 11:6762010. View Article : Google Scholar : PubMed/NCBI
|
|
12
|
Moller-Levet CS, Betts GN, Harris AL,
Homer JJ, West CM and Miller CJ: Exon array analysis of head and
neck cancers identifies a hypoxia related splice variant of LAMA3
associated with a poor prognosis. PLoS Comput Biol. 5:e10005712009.
View Article : Google Scholar : PubMed/NCBI
|
|
13
|
Chen H, Guo Y, Hu M, Duan W, Chang G and
Li C: Differential expression and alternative splicing of genes in
lumbar spinal cord of an amyotrophic lateral sclerosis mouse model.
Brain Res. 1340:52–69. 2010. View Article : Google Scholar : PubMed/NCBI
|
|
14
|
Johnson MB, Kawasawa YI, Mason CE, et al:
Functional and evolutionary insights into human brain development
through global transcriptome analysis. Neuron. 62:494–509. 2009.
View Article : Google Scholar : PubMed/NCBI
|
|
15
|
Shi YH, Zhu SW, Mao XZ, et al:
Transcriptome profiling, molecular biological, and physiological
studies reveal a major role for ethylene in cotton fiber cell
elongation. Plant Cell. 18:651–664. 2006. View Article : Google Scholar : PubMed/NCBI
|
|
16
|
Gardina PJ, Clark TA, Shimada B, et al:
Alternative splicing and differential gene expression in colon
cancer detected by a whole genome exon array. BMC Genomics.
7:3252006. View Article : Google Scholar : PubMed/NCBI
|
|
17
|
Livak KJ and Schmittgen TD: Analysis of
relative gene expression data using real-time quantitative PCR and
the 2(−Delta Delta C(T)) Method. Methods. 25:402–408. 2001.
|
|
18
|
Leparc GG and Mitra RD: A sensitive
procedure to detect alternatively spliced mRNA in pooled-tissue
samples. Nucleic Acids Res. 35:e1462007. View Article : Google Scholar : PubMed/NCBI
|
|
19
|
Romanski A, Bacic B, Bug G, et al: Use of
a novel histone deacetylase inhibitor to induce apoptosis in cell
lines of acute lymphoblastic leukemia. Haematologica. 89:419–426.
2004.PubMed/NCBI
|
|
20
|
Morotti A, Cilloni D, Messa F, et al:
Valproate enhances imatinib-induced growth arrest and apoptosis in
chronic myeloid leukemia cells. Cancer. 106:1188–1196. 2006.
View Article : Google Scholar : PubMed/NCBI
|
|
21
|
Raffoux E, Cras A, Recher C, et al: Phase
2 clinical trial of 5-azacitidine, valproic acid, and all-trans
retinoic acid in patients with high-risk acute myeloid leukemia or
myelodysplastic syndrome. Oncotarget. 1:34–42. 2010.PubMed/NCBI
|
|
22
|
Fredly H, Stapnes Bjornsen C, Gjertsen BT
and Bruserud O: Combination of the histone deacetylase inhibitor
valproic acid with oral hydroxyurea or 6-mercaptopurin can be safe
and effective in patients with advanced acute myeloid leukaemia: a
report of five cases. Hematology. 15:338–343. 2010. View Article : Google Scholar : PubMed/NCBI
|
|
23
|
Buchi F, Pastorelli R, Ferrari G, et al:
Acetylome and phosphoproteome modifications in imatinib resistant
chronic myeloid leukaemia cells treated with valproic acid. Leuk
Res. 35:921–923. 2011. View Article : Google Scholar : PubMed/NCBI
|
|
24
|
Kircher B, Schumacher P, Petzer A, et al:
Anti-leukemic activity of valproic acid and imatinib mesylate on
human Ph+ ALL and CML cells in vitro. Eur J Haematol.
83:48–56. 2009. View Article : Google Scholar : PubMed/NCBI
|
|
25
|
Cheng YC, Lin H, Huang MJ, Chow JM, Lin S
and Liu HE: Downregulation of c-Myc is critical for valproic
acid-induced growth arrest and myeloid differentiation of acute
myeloid leukemia. Leuk Res. 31:1403–1411. 2007. View Article : Google Scholar : PubMed/NCBI
|
|
26
|
Bokelmann I and Mahlknecht U: Valproic
acid sensitizes chronic lymphocytic leukemia cells to apoptosis and
restores the balance between pro- and antiapoptotic proteins. Mol
Med. 14:20–27. 2008. View Article : Google Scholar : PubMed/NCBI
|
|
27
|
Stamatopoulos B, Meuleman N, De Bruyn C,
et al: Antileukemic activity of valproic acid in chronic
lymphocytic leukemia B cells defined by microarray analysis.
Leukemia. 23:2281–2289. 2009. View Article : Google Scholar : PubMed/NCBI
|
|
28
|
Khanim FL, Bradbury CA, Arrazi J, et al:
Elevated FOSB-expression; a potential marker of valproate
sensitivity in AML. Br J Haematol. 144:332–341. 2009. View Article : Google Scholar : PubMed/NCBI
|
|
29
|
Skotheim RI and Nees M: Alternative
splicing in cancer: noise, functional, or systematic? Int J Biochem
Cell Biol. 39:1432–1449. 2007. View Article : Google Scholar : PubMed/NCBI
|
|
30
|
He C, Zhou F, Zuo Z, Cheng H and Zhou R: A
global view of cancer-specific transcript variants by subtractive
transcriptome-wide analysis. PLoS One. 4:e47322009. View Article : Google Scholar : PubMed/NCBI
|
|
31
|
Fackenthal JD and Godley LA: Aberrant RNA
splicing and its functional consequences in cancer cells. Dis Model
Mech. 1:37–42. 2008. View Article : Google Scholar : PubMed/NCBI
|
|
32
|
Schwerk C and Schulze-Osthoff K:
Regulation of apoptosis by alternative pre-mRNA splicing. Mol Cell.
19:1–13. 2005. View Article : Google Scholar : PubMed/NCBI
|
|
33
|
Wang Q and Silver PA: Genome-wide RNAi
screen discovers functional coupling of alternative splicing and
cell cycle control to apoptosis regulation. Cell Cycle.
9:4419–4421. 2010. View Article : Google Scholar : PubMed/NCBI
|
|
34
|
Kim E, Goren A and Ast G: Insights into
the connection between cancer and alternative splicing. Trends
Genet. 24:7–10. 2008. View Article : Google Scholar
|
|
35
|
Makishima H, Cazzolli H, Szpurka H, et al:
Mutations of e3 ubiquitin ligase cbl family members constitute a
novel common pathogenic lesion in myeloid malignancies. J Clin
Oncol. 27:6109–6116. 2009. View Article : Google Scholar : PubMed/NCBI
|
|
36
|
Keane MM, Ettenberg SA, Nau MM, et al:
cbl-3: a new mammalian cbl family protein. Oncogene. 18:3365–3375.
1999. View Article : Google Scholar : PubMed/NCBI
|