Introduction
Although epithelial ovarian cancer accounts for 3%
of cancers in women, it is the leading cause of death from
gynecological cancer and the fifth leading cause of all
cancer-related deaths among women in the USA (1). Due to the invasive nature of these
tumors and the current inability to detect the disease at early
stages, a significant number of women are initially diagnosed only
after the neoplasia has spread throughout the peritoneal cavity
(2). Consequently, despite
advancements in surgical debulking techniques, optimization of
chemotherapeutic regimens, and improvements in radiotherapy, 5-year
progression-free survival and overall survival rates remain low
(3,4). Accurate and reliable diagnostic means
are essential to improve the outcome of these patients. The genetic
events that are associated with carcinogenesis are often
accompanied by metabolic alterations. A technique that may discover
biochemical features associated with the malignant changes may be
an important tool for ovarian cancer research.
Magnetic resonance spectroscopy (MRS) technology is
a relatively novel technique which has been developed over the past
five decades. It monitors radiofrequency-induced transitions
between the spin states of atomic nuclei in an external magnetic
field, and is currently used to provide physiological and
biochemical information about cells and tissues in vitro and
in vivo. The development of solenoidal coils has allowed
non-invasive, high-resolution 31P-MRS of both animal and
human tumors in vivo(5–7).
3IP-MR spectra primarily provide information about lipid
and high energy phosphate metabolism, which may be used clinically
in the prediction and monitoring of tumor treatment response
(8–10). Moreover, the ability to follow the
cell metabolism pattern in malignant cells, before and after drug
treatment, may assist in predicting treatment success. In our
previous study we applied 31P-MRS to in vitro
studies of various breast cancer cells grown in culture, and
observed the effects of the drugs on the cells (11). Only a few MRS studies have been
reported on human ovarian pathologies, essentially confined to the
analysis of fluids from ovarian cysts. From these analyses,
significant differences in a variety of soluble metabolite
concentrations (some still unassigned) were found between benign
and malignant ovarian cysts (12,13).
While cancerous tissues or animal models have been
frequently used to study tumor behavior, these approaches are
sometimes complex and intractable, presenting challenges for
interpreting discrepancies (14) in
addition to other difficulties and costs dealing with tissues and
animals. On the other hand, traditional 2D cell culture, the widely
used standard monolayer culture for cancer cells, provides few
physiological resemblance of a tumor growth environment in
vivo attributed from morphology, cell-cell and cell-matrix
interactions. To fill in the gap between the monolayer cell culture
and whole animal, the 3D in vitro culture has emerged as a
third approach that mimics the in vivo cell growth
environment. Three-dimensional tumor models have emerged as
valuable in vitro research tools, though the power of such
systems as quantitative reporters of tumor treatment response has
not been adequately explored. The goal of the 3D culture is to
permit researchers to investigate the cellular mechanisms and
effects of antitumor agents in conditions resembling those found
in vivo(14,15) while taking advantage of in
vitro culture’s simplicity and low cost (as opposed to the
tissues/animals’ complexity, intractability and high cost). In the
current study we aimed to determine the metabolic profile and the
effects of chemotherapy on several human ovarian cancer cell lines
in a perfused 3D vs. a 2D construct using 31P-MRS. Based
on our knowledge in this field (16), we hypothesized that for optimal
experimental purposes, perfused 3D cell constructs represent a
superior model. They provide a metabolically stable and homogeneous
environment which resembles the in vivo conditions more
closely, and is therefore more appropriate for studying cellular
mechanisms.
Materials and methods
Human ovarian cancer cell lines
Three human ovarian carcinoma cell lines were used
for this study: OC238, an ovarian carcinoma cell line of epithelial
origin obtained from malignant ascites. It was histopathologically
determined as serous cystadenocarcinoma and was
immunohistologically stained for the CA-125 marker. Its tumorigenic
nature was determined by injection of the established in
vitro cultures to nude mice and the creation of growing tumors
(17). The A2780 (ECACC No.
93112519) ovarian adenocarcinoma cell line was established from
tumor tissue from an untreated patient. The A2780cisR (ECACC No.
93112517) cisplatin-resistant cell line has been developed by
chronic exposure of the parent cisplatin-sensitive A2780 cell line
to increasing concentrations of cisplatin. A2780cisR is
cross-resistant to melphalan, doxorubicin and irradiation. An
increased ability to repair DNA damage as well as cytogenetic
abnormalities have been observed in this cell line (data from
ECACC). All cell cultures were grown in DMEM supplemented with 10%
FCS, 1% sodium pyruvate solution 100 mM, 1% L-glutamine solution
200 mM, 1% MEM-vitamins solution 100X, 1% MEM-non-essential amino
acids solution 100X and 1% penicillin-streptomycin solution
(Biological Industries, Israel). The two cell lines, A2780 and
A2780cisR were also supplemented with bovine insulin solution 10
mg/ml (Sigma) diluted to 10 μg/ml. Cell cultures were grown either
in 92×17-mm dishes for further culturing or in 144×21-mm dishes
(Nunclon) when larger amounts of cells were required. Cultures were
regularly fed every 3–4 days and sub-cultured by a 1:30–40 split
ratio by detaching cells after one PBS wash with trypsin (0.05%)
EDTA (0.02%) solution (Biological Industries). Cultures were
occasionally frozen in fresh medium containing 10% DMSO. A2780cisR
cells which had a higher rate of growth than the other two cell
lines, were split in higher dilutions (1:50–1:70). All cultures
were incubated at 37°C with 5% CO2.
Three-dimensional Matrigel construct
In order to follow changes occurring in living cells
using the MRS technique, the cells were packed in the MRS tube in
Matrigel (BD Matrigel™ Matrix, BD Biosciences, USA), a solubilized
basement membrane preparation extracted from EHS mouse sarcoma, (a
tumor rich in ECM proteins) whose major components are laminine
(56%), followed by collagen IV (31%), heparan sulfate
proteoglycans, and entactin (8%). At room temperature, Matrigel
polymerizes to produce biologically active matrix material
resembling the mammalian cellular basement membrane. Prior to the
procedure, Matrigel was thawed at 4°C in an ice-water bath, a flask
was filled with 60 ml of fresh medium either with or without drugs,
and a 60-cm long teflon tube of 0.5 mm inner diameter was attached
to a sterile 23G needle on a 10-ml syringe. The tube was washed
twice with 70% ethanol and the whole apparatus was kept in ethanol
until it was used. For each experiment 3 dishes of 144×21-mm were
cultured to full confluency. Cells were detached using trypsin and
centrifuged for 5 min at 1,000 rpm. The medium was removed and the
tube containing the cells was set on ice in a box, which was
earlier sterilized with ethanol. Cold (4°C) Matrigel (1.5 ml) was
added to the cells using a cold sterile pipette. The cells and the
Matrigel were gently mixed into a homogenous suspension. Matrigel
threads were then prepared one after the other as quickly as
possible in order to place the cells back into the medium rapidly.
The suspension was gently drawn into the teflon tube and was left
in the tube at room temperature for 30–120 sec until it
polymerized. The teflon tube was occasionally cleaned with a tissue
soaked in ethanol and then the thread was pushed out of the tube
and into the flask containing the medium. After the whole
suspension was transformed into semi-solid threads, the cells were
left to incubate in the medium for about 30–33 h in the incubator
at 37°C, 5% CO2.
Perfusion system
For the MRS analysis, Matrigel threads containing
the ovarian cancer cells were transferred to the 10-mm sterilized
MRS tube attached to a perfusion system activated by a peristaltic
pump. The system allowed constant perfusion of fresh medium to the
threads, while the Matrigel was holding the cells. Prior to the
experiments the tubing was washed with ethanol and then with the
medium. After attaching the tube to the system, the pump was turned
on and the medium was constantly replaced during the experiment at
a rate of 0.5 ml/min. A mixture of 95% O2 and 5%
CO2 was bubbled into the medium to assure the viability
of the cells. MRS analysis of the living CEM was conducted
overnight and the total incubation time of the cells in the
Matrigel was about 45 h. A set of experiments was performed with
each cell line. At least two experiments were performed without any
drug, as control, followed by the chemotherapeutic experiments for
each cell line with each drug. The concentrations of drugs added to
the media for the experiments in living CEM were 10 times higher
than the LC50 values for CGM, as previously reported
(11).
Determination of cell growth in
Matrigel
Cells were embedded in Matrigel threads in several
concentrations depending on the cell line proliferation profile.
Every 24 h, threads were extruded into Petri dishes containing 10
ml of medium and placed in an incubator. At each time point, two
threads were dissolved in Matrisperse (for 1 h on ice). The number
of cells was determined by a homocytometer.
The two-dimensional cell monolayer
construct
A common method for characterization of the
intracellular components of cell monolayers is by extracting
tissues and cells and conducting MRS detection of the solubilized
extracts. Perchloric acid extracts enable detection of
water-soluble metabolites such as amino acids, sugars and
phospholipids. Chloroform/methanol extracts allow characterization
of lipophilic compounds, such as membrane phospholipids. These
extracts produce homogenous solutions that generate highly resolved
spectra and allow detection of metabolites of low concentrations.
In order to have a sufficient amount of material for the MRS
analysis a ~3×10⁸ cells were extracted for each sample.
To reach this number, cells were cultured in 3 dishes of 144× 21-mm
size and were extracted only when the dishes were fully confluent.
Cells were detached using the trypsin-EDTA solution and were
collected in a 50-ml tube for centrifugation for 5 min at 1,000
rpm. The supernatant was removed and 1 ml of HClO4 0.5 M
was added to the tube which was kept on ice during the whole
procedure. The incubation in perchloric acid lasted 5 min and the
solution was occasionally mixed by vortexing. The acid was then
neutralized to pH 7.0 using KOH and was centrifuged for 15 min at
10,000 rpm (4°C). The supernatant was transferred to a 20-ml
plastic bottle and was mixed with 0.2 g Chelex 100 (Bio-Rad
Laboratories, Hercules, CA, USA) for 1 h at 4°C. The solution was
then filtered through a GF/B (1.0 μM pore size) 2.5 cm diameter
Glass Microfibre filter (Whatman, UK) into a 150-ml glass flask.
The filter was washed with cold double-distilled water (DDW) before
and after filtration. The filtrate was frozen in liquid nitrogen
and lyophilized overnight until dried. The dry sample was kept
sealed in the flask, at −80°C until analysis.
Antimitotic drugs
Three antimitotic drugs were used: paclitaxel
(Taxol, Bristol-Myers Squibb, USA), cisplatin (Vianex, Greece) and
carboplatin (Paraplatin; Bristol-Myers Squibb, Italy). Stock
concentrations of the drugs were: paclitaxel 6 mg/ml, cisplatin 1
mg/ml and carboplatin 10 mg/ml. Paclitaxel was further diluted in
DMSO and the platinum compounds were diluted in DDW. In order to
determine the effective concentrations of the drugs to be used with
the cell cultures, a series of experiments were conducted to
determine the LC50. The following procedure was
performed at least twice with each cell line. Cells were seeded in
a 12-well plate (6 duplicates) at 10,000 cells/ml at 2 ml/well.
About 24 h after seeding the drug was added to five of the six
duplicates in increasing concentrations. Two wells were left
untouched, as controls. The middle concentration was close to the
estimated LC50, two duplicates had higher concentrations
and two had lower. The volume of the drug solution, which was added
to the well, was never >1% of the total volume. After 48 h of
incubation with the drugs, the wells were washed with PBS in order
to wash away dead cells and the adherent cells were detached using
trypsin. The cells were transferred to a cuvette and diluted in PBS
to a total volume of 20 ml. Cells were counted in a Coulter
Counter®, (Beckman Coulter) which was calibrated to the
proper size of particles after a sample manual counting. Each
cuvette was counted four times and all counts were compared to the
control count of the clean PBS. Counting results were analyzed
using Microsoft Excel and the derived LC50 parameters
were used in the chemotherapeutic experiments.
Magnetic resonance spectroscopy
The dry extracts were disolved in 700 μl cold
D2O, mixed and moved to a 1.5 ml eppendorf tube for
10-min centrifugation at 10,000 rpm. D2O enables the
lock signal on the nuclear magnetic resonance (NMR) machine to be
used. The solution was then transferred to a 5-mm NMR tube and was
kept at 4°C until analysis. Before MR analysis for 31P
containing compounds, 70 μl of EDTA solution (0.2 M) was added to
the NMR tube to remove paramagnetic ions. Samples were constantly
kept on ice. Most of the MR experiments were performed on the
Varian Inova 500 machine that detects 31P-nuclei at 202
MHz. Prior to each series of experiments, the values of
T1 and the required 90° pulse width (pw) were determined
and then used for the analysis. MR experiments of all extracts were
carried out using the 5BB probe at 10°C. The spectometer frequency
(sfrq) was set at −202.319 MHz for the 31P detection.
Parameters were set: transmitter power (tpwr) of 56; pw of 7.0
μsec, (flip angle of 66.3°); d1 of 2.00 sec; at of 1.60 sec.
Broad-band decoupling was activated to suppress the proton
detection: dn, 1H; dpwr of 40; dm=y; dmm=w. Scans (n=3,000) were
accumulated to produce the final spectrum. All spectra were
analyzed with the MestRe-C software version 3.6.9. Processing
included line broadening of 2.00, and manual or auto phasing where
necessary. Spectra were manually integrated by marking the
beginning and ending of each signal of interest. The first signal
marked was automatically set as 1 and all other referred to it. The
signal of β-ATP at -21 ppm was set as a reference. All integrals of
all signals were set in tables in Microsoft Excel spreadsheets. The
averages and standard deviations were calculated where the database
was sufficient, using functions of the Microsoft Excel software.
Figures were created using Microsoft Excel.
The main phosphorus-containing metabolites that are
present in the 31P-NMR spectra of cells are
phosphomonoesters (PME), phosphorylcholine (PChol) and
phosphorylethanolamine (PEtn) that are the substrates for the
biosynthesis of phosphatidylcholine (PtdCho) and
phosphatidylethanolamine (PtdEtn), respectively. PtdCho is the
major phospholipid component of eukaryotic cells, involved in
membrane structure, signal transduction and lipoprotein metabolism.
PtdEtn is one of the other phospholipids forming cellular
membranes. PtdCho can be broken down by a specific phospholipase C
to produce diacylglycerol which is an important second messenger in
many cellular metabolic pathways. Phosphodiesters (PDE) include
glycerophosphocholine (GPC) and glycerophosphoethanolamine (GPE).
GPC is the product of the complete deacylation of PtdChol and is
also the inhibitor (negative feedback) of lysophospholipase which
is one of the enzymes responsible for the breakdown of PtdCho. GPC
is a precursor in the production of choline that is the precursor
for phospholipids and acetylcholine. GPE is a derivative and a
substrate in the biosynthesis of PtdEtn (18). Phosphocreatine (PCr) is a highly
important molecule in the energetic cycles in the cell. It readily
donates a phosphate to ADP in order to produce ATP whenever it is
required (19). Uridine
diphosphosugar (UDPS) is a key group of intermediates in
carbohydrate metabolism, which serve as precursors for glycogen and
can be metabolized into UDP galactose and UDP glucuronic acid which
are incorporated into polysaccharides as galactose and glucuronic
acid. They also serve as precursors for sucrose
lipopolysaccharides, and glycosphingolipids. Nicotinamide adenine
dinucleotide phosphate (NADP) is an important oxidizing co-enzyme
participating in many anabolic processes (e.g., lipid, amino acid,
sugar and nitrogen metabolism) (19).
Statistical analysis
Data are expressed as mean ± SEM. Statistical
significance was assessed by a Student two-tailed t-test, and
analysis of variance as indicated. A value of P<0.05 represents
significance compared to untreated controls, unless otherwise
indicated.
Results
Characterization of cell lines by
MRS
Only experiments in which the levels of β-ATP did
not decrease significantly were included in the analysis to assure
that the changes observed are due to the chemotherapeutic effect
and not to cell death. While the 3D Matrigel construct allowed MRS
assessment of viable cells, the 2D monolayer permitted evaluation
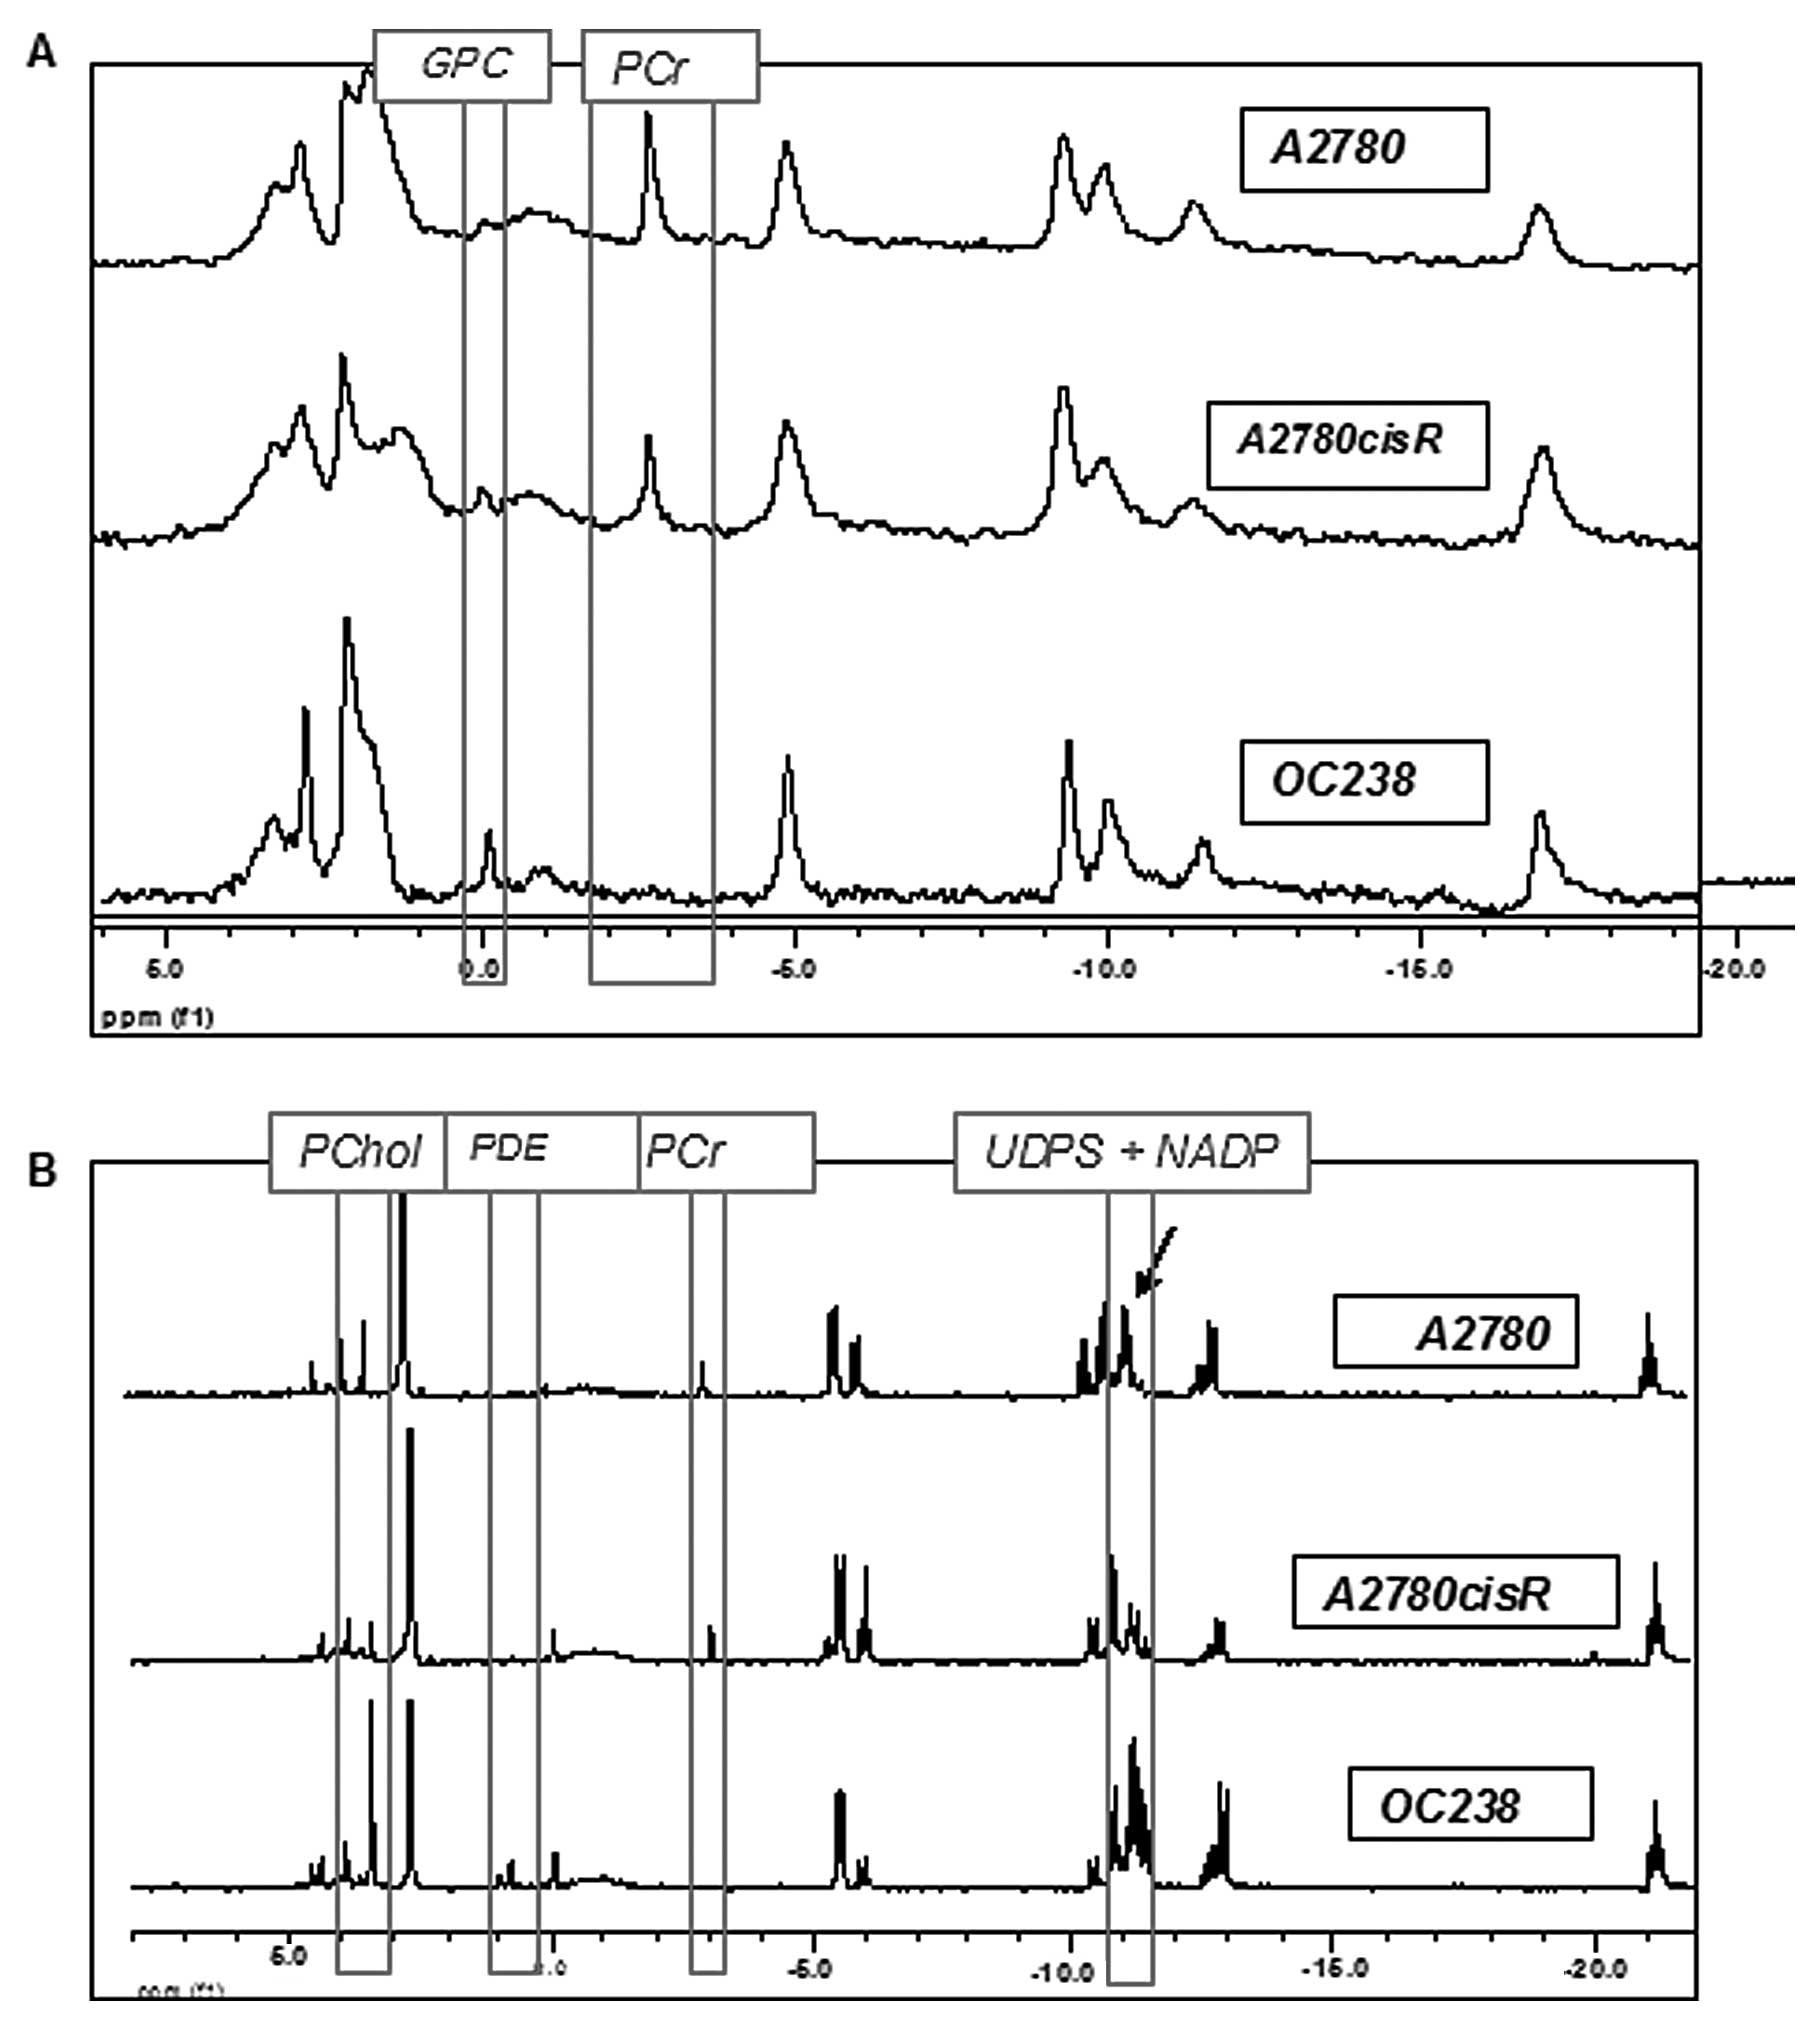
of non-viable cell extracts only. Significant differences in the
31P-MR spectra could be detected between the different
cell lines. As shown in Fig. 1A,
the spectra of intact CEM had relatively lower resolution and
signal-to-noise ratio compared to the spectra of the extracts,
probably due to the non-homogeneity of the samples. In both viable
CEM and in cell extracts, A2780 and A2780cisR cell lines had a high
phosphocreatine (PCr) signal which was absent in the OC238 cell
line (Fig. 1). While viable cells
in Matrigel showed only a higher GPC signal in OC238 compared to
A2780 and 2780cisR cell lines (Fig.
1A), extracted cells from the monolayer showed higher PChol,
PDE, UDPS and NADP signals in the OC238 cell line (Fig. 1B).
Changes in metabolite levels following
chemotherapy
The concentration that causes death in 50% of the
cells, LC50, was calculated for all three cell lines,
either grown in monolayers or embedded in Matrigel. According to
our previous data (11), the
LC50 for CEM was higher by one order of magnitude
compared to that of CGM. After the cultures were incubated with the
drugs in the LC50, they underwent MRS analysis. In
contrast to the CGM, cells grown in the 3D Matrigel construct
allowed continuous monitoring of the changes in 31P-MRS
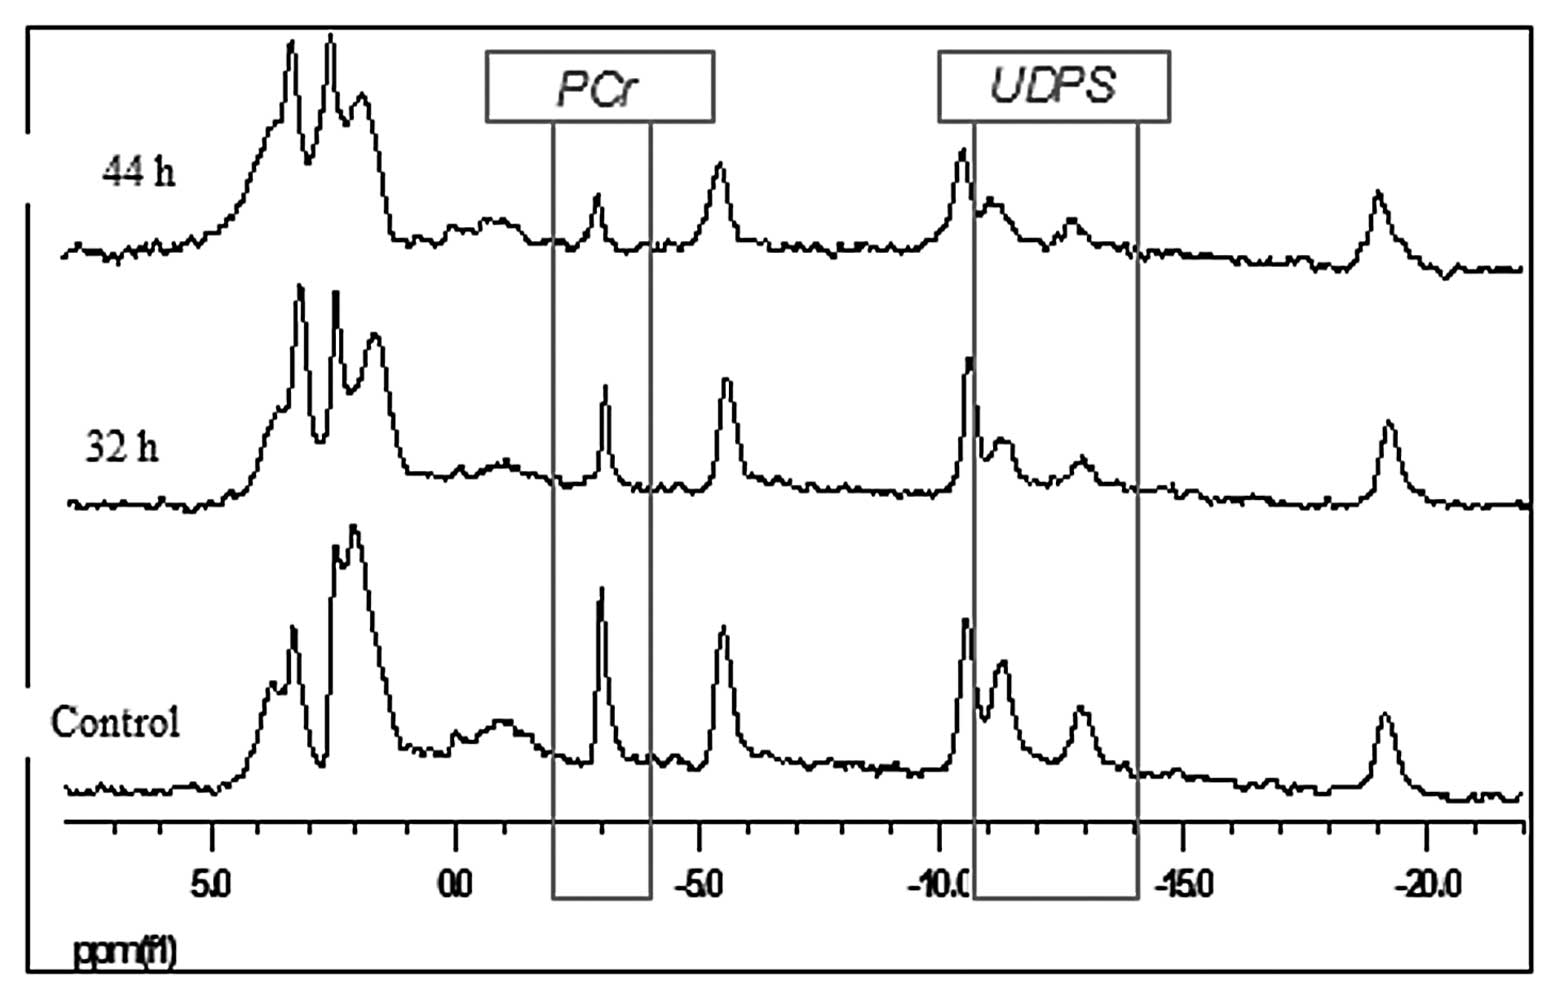
spectra following incubation with cytotoxic drugs. The
31P-MRS spectra of the A2780 cell line in living CEM and
incubated with cisplatin for 44 h are presented in Fig. 2. Compared to the control specimen
whose spectra did not significantly change over time, the PCr and
UDPS gradually decreased in response to cisplatin exposure. In
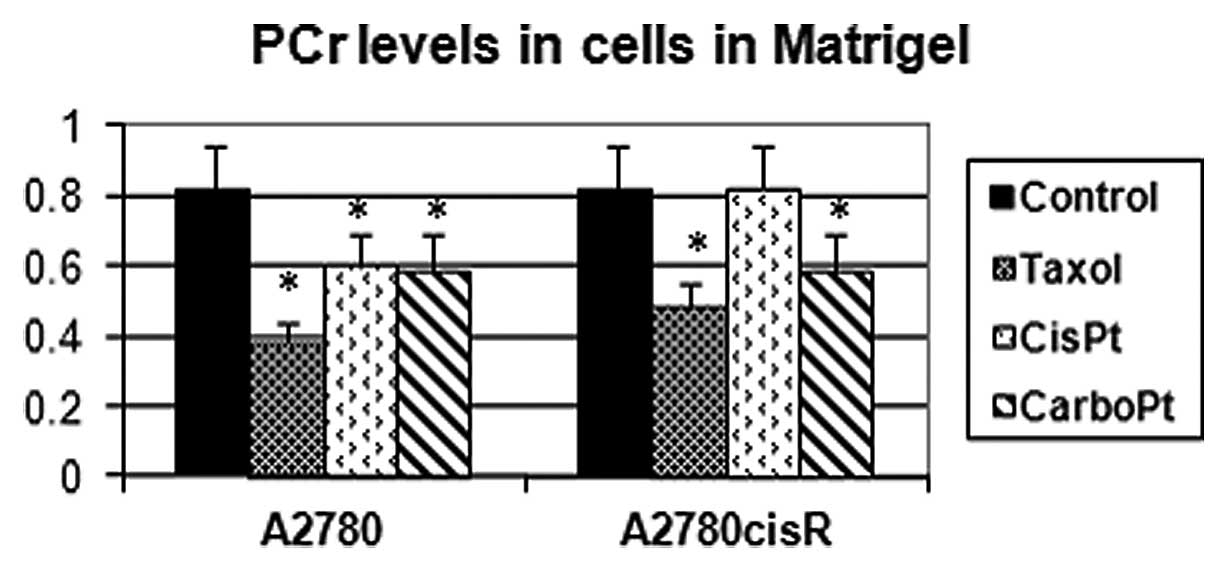
order to compare the different samples in a quantitative manner, a
common integration method was used. The intensity of the β-ATP
signal was chosen as a reference value since it has been shown to
be proportional to the number of cells in the sample and to their
state of vitality (prior to extraction). The signal of β-ATP was
integrated first and was automatically given the value of one (by
the software). All other integrals were calculated relative to it.
The integrals of the magnetic resonance spectra of A2780 and
A2780cisR (the cisplatin-resistant variant) cell lines grown in
Matrigel and exposed to various antimitotic drugs are presented in
Fig. 3. While PCr levels decreased
in response to all three cytotoxic drugs in the A2780 cell line,
they remained unchanged in response to cisplatin in the A2780cisR
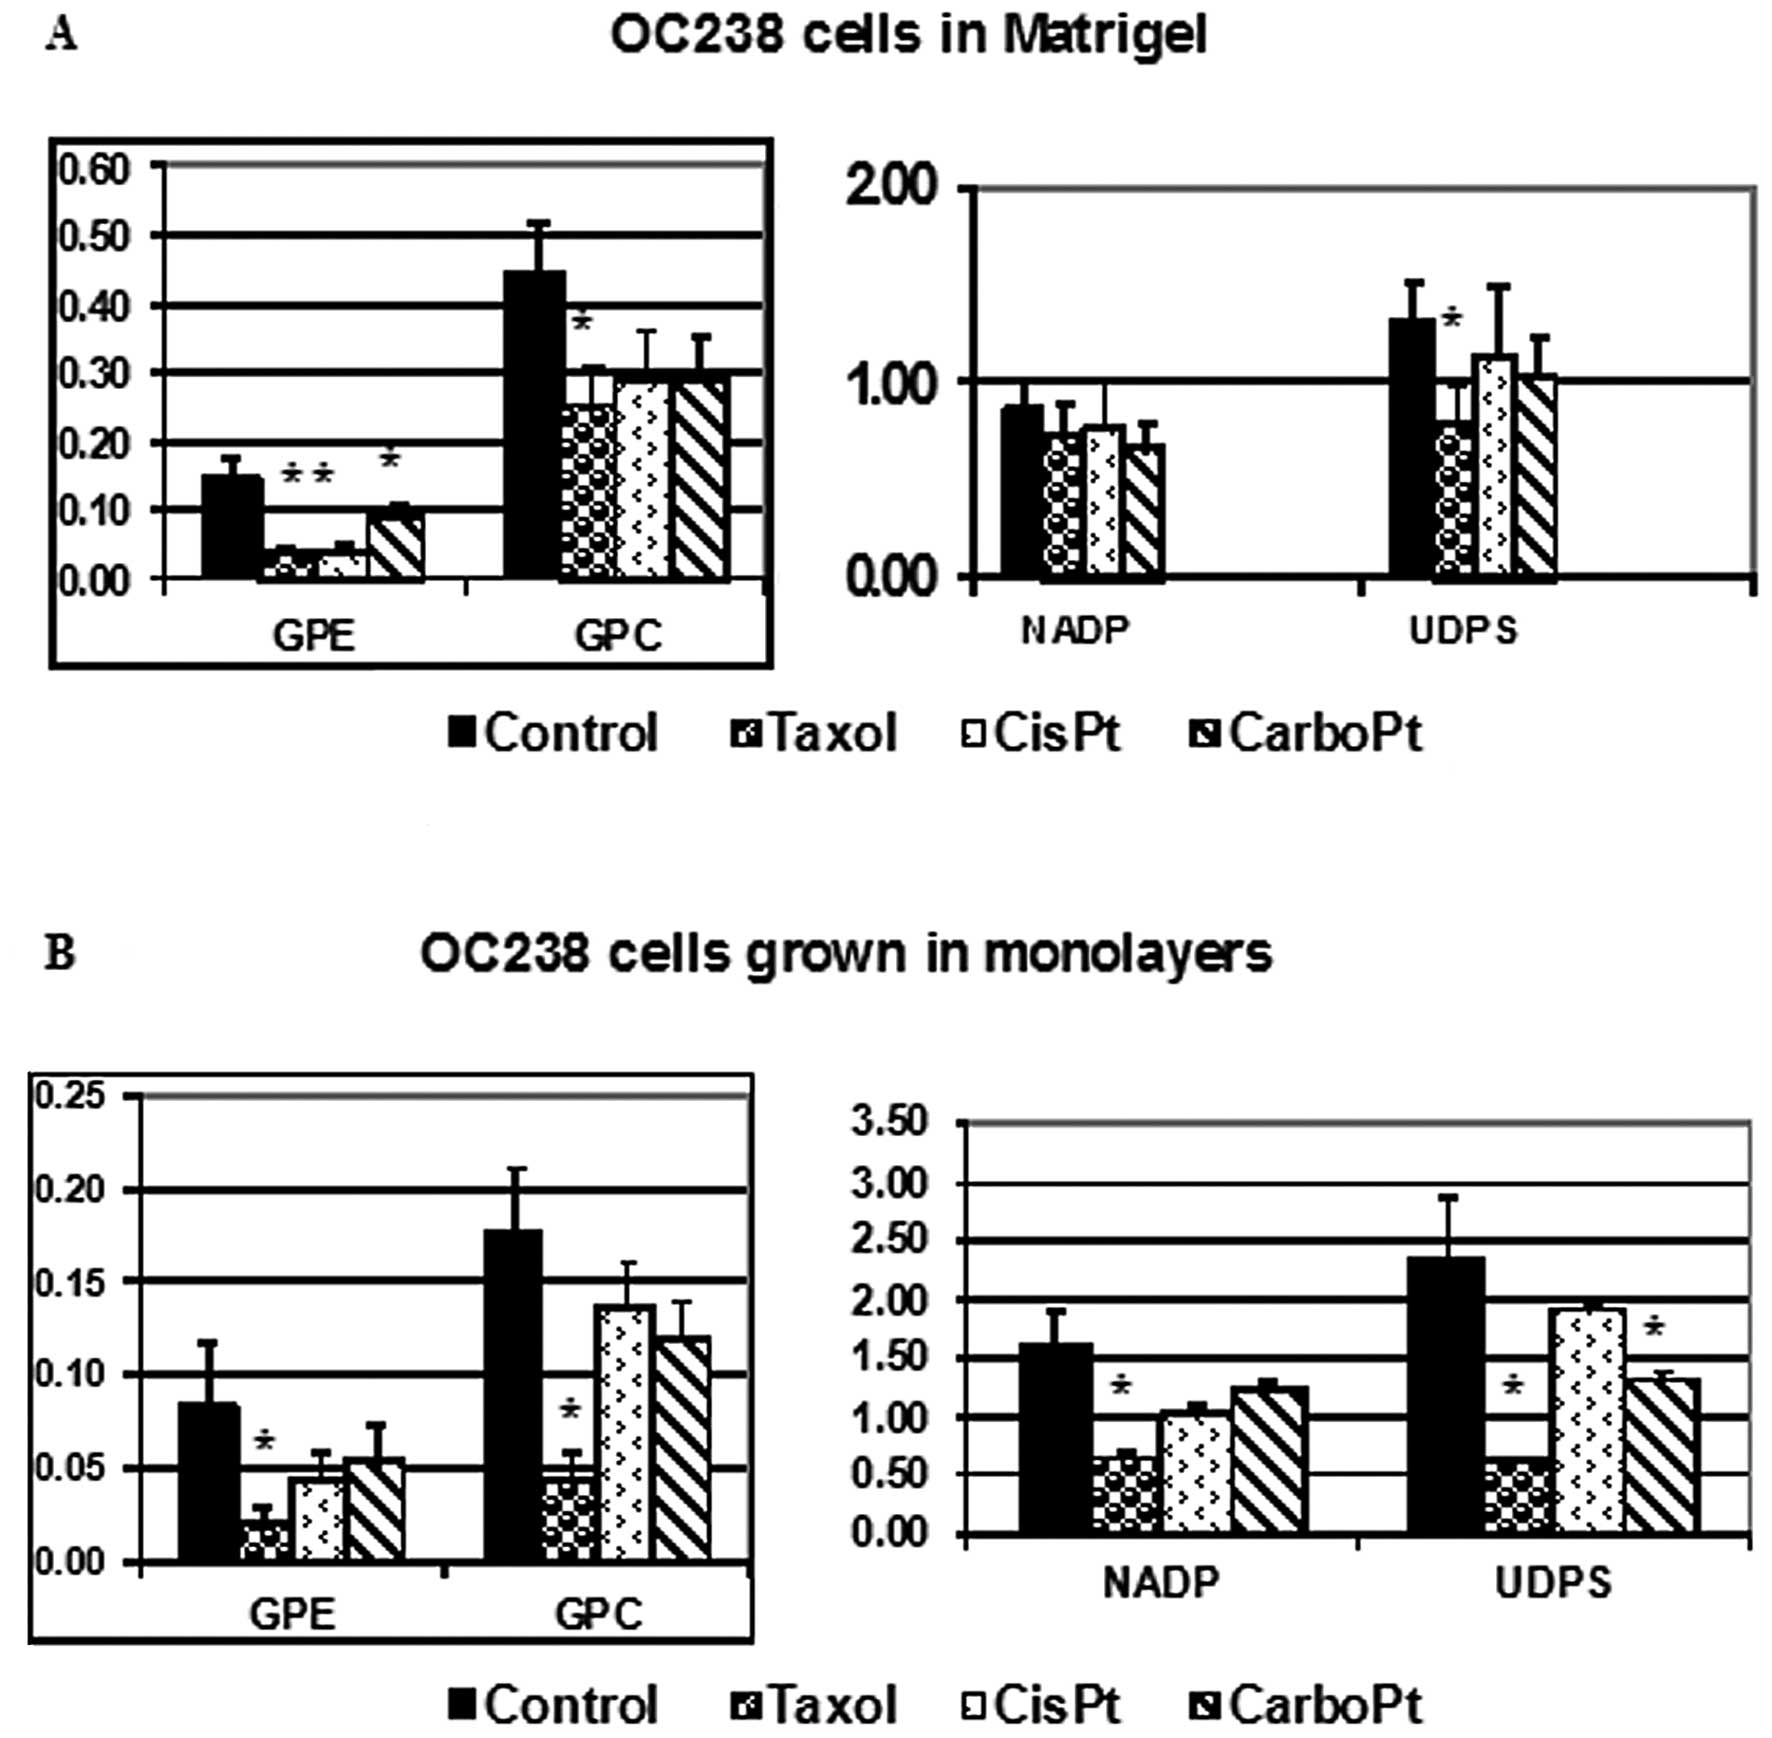
cell line. Changes in the integrals of magnetic resonance spectra
of OC238 cells grown in a perfused 3D Matrigel construct (Fig. 4A) or in monolayers (Fig. 4B), and exposed to various
antimitotic drugs were demonstrated. While viable OC238 cells in
Matrigel showed a significant decrease in GPE in response to
paclitaxel, cisplatin and carboplatin (Fig. 4A), CGM showed a significant decrease
in GPE in response to paclitaxel (Fig.
4B). Both OC238 CEM and CGM showed a significant decrease in
GPC levels in response to paclitaxel (Fig. 4). While CEM showed no changes in
NADP in response to any of the cytotoxic drugs (Fig. 4A), CGM showed a significant decrease
in NADP in response to paclitaxel (Fig.
4B). While CEM showed a significant decrease in UDPS in
response to paclitaxel, CGM showed a decrease in UDPS in response
to both paclitaxel and carboplatin.
Discussion
Ovarian cancer is the leading cause of death in
women with gynecological malignancies. For the majority of
patients, ovarian cancer is diagnosed at a late stage characterized
by disseminated studding of the peritoneal surfaces with tumor
nodules ranging in size from microscopic clusters of a few cells to
large cakes of disease spanning several centimeters (1,2,20,21).
Primary cytoreductive surgery followed by platinum-based
chemotherapy is the standard treatment for this cancer. However,
the low survival rate despite these treatments, which has improved
only marginally over the course of decades, leads to the need for
new physiologically relevant research platforms to meaningfully
examine treatment response and devise more effective
strategies.
Magnetic resonance spectroscopy is a relatively
novel technology which enables non-invasive continuous monitoring
of biochemical processes. It can detect metabolic alterations
associated with malignant phenotypes of cancer cells in
vitro, as a basis for a possible in vivo monitoring of
clinical lesions. In particular, 31P-MRS spectra of
intact cells and tissues allow detection and quantification of a
number of intracellular metabolites and their fluxes in either
ubiquitous or tissue-specific biochemical pathways. Among these,
particular attention has been devoted to metabolites involved in
phospholipid biosynthesis and catabolism (18). 31P-MRS analysis has
helped in the understanding of the multidrug resistance mechanism
and to distinguish between levels of malignancy and differentiation
in neoplastic tissues (16). It has
also been used to follow changes occurring in the phospholipid
profile of breast cancer cells after addition of precursors such as
ethanolamine and choline. We have previously published a
31P-MRS study characterizing different types of breast
cancer cells, with a unique fingerprint for each cell line,
representing different stages of tumor progression (11). Moreover, 31P-MRS
observations revealed a correlation between the mode of action of
anticancer drugs and the observed changes in cell metabolic
profile.
The study of ovarian cancer by MRS has been limited
and performed mainly by proton MRS. One study managed to
distinguish ovarian carcinomas from normal and benign tissues,
based on alterations of cellular lipid, creatine/PCr, and
lysine/polyamines ratios (22). In
another study a statistical pattern recognition technique of linear
discriminant analysis was used to analyze ovarian cancer biopsy
spectra. Using this method, normal and benign samples were
distinguished from borderline and malignant samples with a
sensitivity of 95% and a specificity of 86%. This method also
helped to distinguish between untreated and recurrent ovarian
cancer with an overall accuracy of 97%, suggesting that proton MRS
can detect chemotherapy-induced changes in ovarian neoplasms
(23). In the current study, the
state of phosphate-containing metabolites was recorded for three
different ovarian cancer cell lines. The results indicate that
different ovarian cancer cell lines show characteristic
31P-MRS fingerprints and specific metabolic changes in
response to cytotoxic drug treatment.
The evaluation of newly developed anticancer drugs
is usually performed initially in the traditional 2D culture.
However, most drugs that are promising in the 2D culture are rarely
effective in vivo in animals or clinical trials, partially
because the clinically relevant tumors do not exist as monolayers
in vivo. In fact, 2D monolayer cell cultures represent
highly reductionist models of epithelial cell cancers, due to the
loss of physiological extracellular matrix on artificial plastic
surfaces. Consequently, cells lose relevant properties, such as
differentiation, polarization, cell-cell communication and
extracellular matrix contacts. This imbalance contributes to the
poor predictive value of compound efficacies between in
vitro and in vivo experiments. There is no doubt that
the development of 3D cultures represents a valuable tool for
understanding the pathogenesis of cancer (24,25).
Three-dimensional cultures mimic the normal phenotype of epithelial
cells in vivo and provide a functional and structural
environment to investigate the activities of cancer genes. In
pioneering studies, the Bissel laboratory established in
vitro 3D breast cancer models in which normal and malignant
breast epithelial cells grown on a bed of growth-factor-reduced GFR
Matrigel form polarized 3D acinar structures (26). Matrigel represents a reconstituted,
laminine-rich basement membrane, which supports processes such as
cell polarity, cell-cell- and cell-matrix interaction, and
re-expression of differentiation markers even in transformed lines
(27). Implementing these 3D models
to understand cell signaling in relation to position within an
acinus, their group and others were able to establish basic tumor
biology insights into breast carcinogenesis and progression, which
would not be possible in monolayer cultures (25,28).
While these reports demonstrate the importance of restoring key
architectural cues in vitro, the full capability of 3D tumor
models as a biologically relevant platform for analysis of tumor
growth and cytotoxic response has not yet been adequately explored.
In vitro 3D tumor systems, could be used as tools to provide
a window into tumor growth mechanisms in vivo, while
providing a level of access for imaging and manipulation of the
system that is difficult to achieve in animal models. We adopted an
ovarian cancer model that draws on the established in vitro
models of breast cancer in which cells are overlaid on a bed of
Matrigel threads. Accordingly, we developed an in vitro
perfused 3D model which, in conjunction with 31P-MRS
allows for a continuous metabolic assessment of perfused viable
ovarian cancer cells. The in vitro 3D platform of ovarian
cancer described here fills a critical niche in translational
science by bridging the gap between resource-intensive animal
models and traditional monolayer cultures that lack important
determinants of tumor growth and treatment response. The 3D
perfused Matrigel construct seems to be superior to the 2D tissue
monolayer for 31P-MRS studies as it permits continuous
MRS monitoring of drug-induced metabolic changes over time. Indeed,
the 3D and 2D constructs revealed differences in the fingerprints
of the various cancer cell lines as well as different metabolic
changes in response to chemotherapy. Treatment response studies
have shown that cancer cells induced to form 3D spheroids are
vastly less sensitive to chemotherapy than monolayer cells
(30). In the current study, the
LC50 for CEM was higher by one order of magnitude than
that of CGM. This cannnot be explained by lower drug penetration
through the Matrigel (11).
Therefore, the components of the Matrigel or the experimental
conditions have some protective action on cancer cells. These data
are in accordance with previous studies (31,32), which reported
that traditional monolayer cultures significantly overestimate the
sensitivity of ovarian cancer cells to cytotoxic treatments, which
limits their value as tools to evaluate therapeutic efficacy.
Acknowledgements
This study was funded by the Zaltzberg Research
Fund, Hadassah Medical Organization, Israel.
Abbreviations:
|
31P
|
phosphorus-31
|
|
ADP
|
adenosine diphosphate
|
|
ATP
|
adenosine triphosphate
|
|
CEM
|
cells embedded in Matrigel
|
|
CGM
|
cells grown in monolayers
|
|
ER
|
estrogen receptor
|
|
GPC
|
glycerophosphocholine
|
|
GPE
|
glycerophosphoethanolamine
|
|
MHz
|
megaHertz
|
|
MRS
|
magnetic resonance spectroscopy
|
|
NADP
|
nicotine adenine diphosphate
|
|
NMR
|
nuclear magnetic resonance
|
|
PBS
|
phosphate-buffered saline
|
|
PCr
|
phosphocreatine
|
|
PC
|
phosphorylcholine
|
|
PCA
|
perchloric acid
|
|
PDE
|
phosphodiesters
|
|
Pi
|
inorganic phosphate
|
|
PME
|
phosphomonoesters
|
|
PtdC
|
phosphatidylcholine
|
|
UDPS
|
uridine diphospho-sugar
|
|
PtdE
|
phosphatidylethanolamine
|
|
PtdI
|
phosphatidylinositol
|
|
PtdS
|
phosphatidylserine;
|
References
|
1
|
National Cancer Institute. www.cancer.gov/cancertopics/types/ovarianurisimplewww.cancer.gov/cancertopics/types/ovarian.
A snapshot of ovarian cancer. Last updated, October 2011.
|
|
2
|
Jemal A, Siegel R, Ward E, Hao Y, Xu J and
Thun MJ: Cancer statistics 2009. CA Cancer J Clin. 59:225–249.
2009. View Article : Google Scholar
|
|
3
|
Bast RC, Hennessy B and Mills GB: The
biology of ovarian cancer: new opportunities for translation. Nat
Rev Cancer. 9:415–428. 2009. View
Article : Google Scholar : PubMed/NCBI
|
|
4
|
Chi DS, Eisenhauer EL, Zivanovic O, et al:
Improved progression-free and overall survival in advanced ovarian
cancer as a result of a change in surgical paradigm. Gynecol Oncol.
114:26–31. 2009. View Article : Google Scholar
|
|
5
|
Ng TC and Glickson JD: Shielded solenoidal
probe for in vivo NMR studies of solid tumors. Magnet Reson Med.
2:169–175. 1985. View Article : Google Scholar : PubMed/NCBI
|
|
6
|
Glickson JD, Evanochko WT, Sakai TT and Ng
TC: In vivo NMR studies of RIF-1 tumors. Magnetic Resonance in
Cancer. Allen PS, Boisvert DPJ and Lentie BC: Pergamon Press;
Toronto: pp. 71–82. 1986
|
|
7
|
Maris JM, Evans AE, McLaughlin AC, D’Angio
GJ, Bolinger L, Manos H and Chance B: 31P nuclear magnetic
resonance spectroscopic investigation of human neuroblastoma in
situ. N Engl J Med. 312:1500–1505. 1985. View Article : Google Scholar : PubMed/NCBI
|
|
8
|
Evanochko WT, Ng TC, Lilly MB, Lawson AJ,
Corbett TH, Durant JR and Glickson JD: In vivo 31P NMR
study of the metabolism of murine mammary 16/C adenocarcinoma and
its response to chemotherapy, x-radiation, and hyperthermia. Proc
Natl Acad Sci USA. 80:334–338. 1983.
|
|
9
|
Okunieff PG, Koutcher JA, Gerweck L,
McFarland E, Hitzig B, Urano M, Brady T, Neuringer L and Suit HD:
Tumor size dependent changes in a murine fibrosarcoma: use of in
vivo 31P NMR for non-invasive evaluation of tumor
metabolic status. Int J Radiat Oncol Biol Phys. 12:793–799. 1986.
View Article : Google Scholar : PubMed/NCBI
|
|
10
|
Ng TC, Evanochko WT, Hiramoto RN, Chanta
VK, Lilly MB, Lawson AJ, Corbett TH, Durant JR and Glickson JD: P
NMR spectroscopy of in vivo tumors. J Magnet Res. 49:271–286.
1986.
|
|
11
|
Sterin M, Cohen JS, Mardor Y, Berman E and
Ringel I: Levels of phospholipid metabolites in breast cancer cells
treated with antimitotic drugs: a 31P-magnetic resonance
spectroscopy study. Cancer Res. 61:7536–7543. 2001.PubMed/NCBI
|
|
12
|
Massuger LFAG, van Vierzen PBJ, Engelke U,
Heerschap A and Wevers R: 1H-magnetic resonance spectroscopy: a new
technique to discriminate benign from malignant ovarian tumors.
Cancer. 82:1726–1730. 1998. View Article : Google Scholar : PubMed/NCBI
|
|
13
|
Boss EA, Moolenaar SH, Massuger LF,
Boonstra H, Engelke UF, de Jong JG and Wevers RA: High-resolution
proton nuclear magnetic resonance spectroscopy of ovarian cyst
fluid. NMR Biomed. 13:297–305. 2000. View Article : Google Scholar : PubMed/NCBI
|
|
14
|
Yamada KM and Cukierman E: Modeling tissue
morphogenesis and cancer in 3D. Cell. 130:601–610. 2007. View Article : Google Scholar : PubMed/NCBI
|
|
15
|
Ritter CA, Perez-Torres M, Rinehart C,
Guix M, Dugger T, Engelman JA, et al: Human breast cancer cells
selected for resistance to trastuzumab in vivo overexpress
epidermal growth factor receptor and ErbB ligands and remain
dependent on the ErbB receptor network. Clin Cancer Res.
13:4909–4919. 2007. View Article : Google Scholar
|
|
16
|
Cohen JS, Jaroszewski JW, Kaplan O,
Ruiz-Cabello J and Collier S: A history of biological applications
of NMR spectroscopy. J Prog Nucl Magn Reson Spectrosc. 28:53–85.
1995. View Article : Google Scholar
|
|
17
|
Maymon R, Bar-Shira Maymon B, Holzinger M,
Tartakovsky B and Leibovici J: Augmentative effects of
intracellular chemotherapy penetration combined with hyperthermia
in human ovarian cancer cells lines. Gynecol Oncol. 55:265–270.
1994. View Article : Google Scholar
|
|
18
|
Podo F: Tumor phospholipid metabolism. NMR
Biomed. 12:413–439. 1999. View Article : Google Scholar
|
|
19
|
Nakayama S and Clark JF: Smooth muscle and
NMR review: an overview of smooth muscle metabolism. Mol Cell
Biochem. 244:17–30. 2003. View Article : Google Scholar : PubMed/NCBI
|
|
20
|
Cho KR and Shih IeM: Ovarian cancer. Annu
Rev Pathol. 4:287–313. 2009. View Article : Google Scholar
|
|
21
|
Berek JS and Bast RCJ: Ovarian cancer.
Cancer Medicine. Kufe DW, Pollack RE, Weichselbaum RR, Bast RCJ,
Gansler TS, Holland JF and Frei EI: 6th edition. BC Decker;
Hamilton, Ontario: pp. 1831–1861. 2003
|
|
22
|
Mackinnon WB, Russell P, May GL and
Mountford CE: Characterization of human ovarian epithelial tumors
(ex vivo) by proton magnetic resonance spectroscopy. Int J Gynecol
Cancer. 5:211–221. 1995. View Article : Google Scholar : PubMed/NCBI
|
|
23
|
Wallace JC, Raaphorst GP, Somorjai RL, Ng
CE, Fung Kee Fung M, Senterman M and Smith IC: Classification of
1H MR spectra of biopsies from untreated and recurrent
ovarian cancer using linear discriminant analysis. Magn Reson Med.
38:569–576. 1997.
|
|
24
|
Kim JB: Three-dimensional tissue culture
models in cancer biology. Semin Cancer Biol. 15:365–377. 2005.
View Article : Google Scholar : PubMed/NCBI
|
|
25
|
Debnath J and Brugge JS: Modelling
glandular epithelial cancers in three-dimensional cultures. Nat Rev
Cancer. 5:675–688. 2005. View Article : Google Scholar : PubMed/NCBI
|
|
26
|
Lee GY, Kenny PA, Lee EH and Bissell MJ:
Three-dimensional culture models of normal and malignant breast
epithelial cells. Nat Methods. 4:359–365. 2007. View Article : Google Scholar : PubMed/NCBI
|
|
27
|
Streuli CH, Schmidhauser C, Bailey N, et
al: Laminin mediates tissue-specific gene expression in mammary
epithelia. J Cell Biol. 129:591–603. 1995. View Article : Google Scholar : PubMed/NCBI
|
|
28
|
Debnath J, Mills KR, Collins NL, Reginato
MJ, Muthuswamy SK and Brugge JS: The role of apoptosis in creating
and maintaining luminal space within normal and oncogene-expressing
mammary acini. Cell. 111:29–40. 2002. View Article : Google Scholar : PubMed/NCBI
|
|
29
|
Ohmori T, Yang JL, Price JO and Arteaga
CL: Blockade of tumor cell transforming growth factor-beta enhances
cell cycle progression and sensitizes human breast carcinoma cells
to cytotoxic chemotherapy. Exp Cell Res. 245:350–359. 1998.
View Article : Google Scholar : PubMed/NCBI
|
|
30
|
Ruiz-Cabello J, Berghmans K, Kaplan O,
Lippman ME, Clarke R and Cohen JS: Hormone dependence of breast
cancer cells and the effects of tamoxifen and estrogen:
31P NMR studies. Breast Cancer Res Treat. 33:209–217.
1995. View Article : Google Scholar : PubMed/NCBI
|
|
31
|
Pike MC, Kredich NM and Snyderman R:
Influence of cytoskeletal assembly on phosphatidylcholine synthesis
in intact phagocytic cells. Cell. 20:373–379. 1980. View Article : Google Scholar : PubMed/NCBI
|