Introduction
Pre-operative CRT followed by surgery is the
standard treatment for patients with locally advanced rectal
cancer. However, disease recurrence remains the major cause of
mortality in these patients (1,2).
Identifying predictors for disease recurrence or poor prognosis
would aid in the successful treatment of these patients. Tumor
regression grade (TRG) following pre-operative CRT is determined by
quantifying the proportion of residual cancer cells to the stroma
of the entire tumor bed. In rectal cancer, several studies have
found that TRG or pathologic response is a predictor of clinical
outcome, including disease recurrence and survival (3–8).
Hence, it is possible that gene expression correlated with TRG
might reflect the characteristics, including resistance to CRT, of
residual cancer cells and might be associated with prognosis in
patients with rectal cancer after pre-operative CRT. DNA repair
pathways (9), cell cycle pathways
(10), hypoxia (11,12),
anti-apoptosis (13) and cancer
stem cells (14,15) have been implicated in the mechanisms
of CRT resistance. Twenty genes were selected for a comparison in
expression levels between CRT responders and non-responders:
PCNA and MKI67 (Ki67) as proliferative
markers; CDKN1A (p21Cip1) and
CDK2 as cell cycle associated markers after irradiation;
CHEK1 and PDRG1 (p53 and DNA downregulated gene) as
DNA damage associated makers; LGR5, PROM1 known as
CD133, CD44, SOX2, POU5F1 known as OCT4 and
LKB1 known as SKT11, as stem cell associated markers;
VEGFA, HGF and MET as growth factors;
HIF1 and GLUT1 as hypoxia associated markers;
BAX and BCL2 as apoptosis associated markers in this
transcriptional analysis. The aim of this retrospective study was
to examine the expression of certain genes in TRGs and determine if
the two are associated with clinical outcome in patients with
locally advanced rectal cancer after pre-operative CRT.
Materials and methods
Patients and specimens
From 2001 to 2008, 64 patients with rectal cancer
received pre-operative CRT followed by surgery at Mie University
Hospital. The following criteria were used for induction of
pre-operative CRT. Patients must i) be no more than 80 years of
age; ii) be in clinical stage II/III based on the International
Union Against Cancer TNM classification, with no evidence of
distant metastases; iii) exhibit no invasion of the external
sphincter muscle or elevator muscle of the anus; and iv) show no
evidence of deep venous thrombosis. A total of 52 cases that
received a curative operation and excluded pathological complete
response were available for this study. The study design was
approved by the hospital ethics review board. All patients signed
informed consent forms allowing use of their tissues in this
study.
5-Fluorouracil-based chemoradiotherapy
regimen
Patients with rectal cancer were treated with
short-course (a dose of 20 Gy in four fractions) or long-course (a
dose of 45 Gy in 25 fractions) radiotherapy using a four-field box
technique with concurrent chemotherapy to take advantage of
5-fluorouracil (5-FU) radio-sensitization. Patients underwent
concurrent pharmacokinetic modulation chemotherapy (5-FU given by
intravenous infusion, 600 mg/m2 for 24 h and
tegafur-uracil (UFT) given orally, 400 mg/m2) orally for
5 days (16). Forty-one patients
received short-course radiotherapy with chemotherapy over 1 week.
The remaining eleven patients received long-course radiotherapy
with chemotherapy for 4 weeks. The time interval between
pre-operative CRT and surgery was 2–3 weeks for short-course
irradiation patients, and 4–6 weeks for long-course irradiation
patients. All patients underwent standard surgery, including total
mesorectal excision, and received 5-FU-based adjuvant chemotherapy
after surgery for 6 months to 1 year.
Clinical and pathological response to
CRT
The clinical response after pre-operative CRT was
evaluated by barium enema, endoscopy, computed tomography and
magnetic resonance imaging, and was then graded as a complete
response, a partial response, no change or progressive disease.
Histological sections were sliced at a thickness of 5 μm and
stained with hematoxylin and eosin. The TRG method for sampling and
examining the tumor site from colorectal excision specimens removed
following neoadjuvant therapy was found in Bateman et
al(17). The median number of
sections per case examined was 4.5 (range, 2–7). TRG was evaluated
using criteria from four sources: Japanese Society for Cancer of
the Colon and Rectum (JSCCR) (18),
Mandard et al(19), Dworak
et al(20) and Rödel et
al(3). Each TRG was evaluated
by two investigators (K. Tanaka and Y. Okugawa) in a blinded
fashion without knowledge of the clinical and pathological
information.
Microdissection and RNA extraction from
formalin-fixed paraffin-embedded specimens
Microdissection of formalin-fixed paraffin-embedded
(FFPE) was performed as previously described (21). Microdissected specimens were
digested with proteinase K in lysis buffer containing Tris-HCl,
ethylenediaminetetraacetic acid and sodium dodecyl sulfate, as
previously published with minor modifications (22). RNA was purified by phenol/chloroform
extraction and precipitated using ethanol. The concentration and
quality of RNA was measured with UV absorbance at 260 and 280 nm
(A260/280 ratio).
cDNA synthesis
The fragmented mRNA from FFPE tissue materials was
reverse transcribed using random hexamer priming instead of
oligo(dt)-based priming. cDNA was synthesized with random hexamers
and Superscript III Reverse Transcriptase (Invitrogen, Carlsbad,
CA) according to the manufacturer’s instructions.
Quantitative real-time polymerase chain
reaction
Real-time quantitative RT-PCR analysis was performed
using a fluorescence-based real-time detection method (TaqMan) and
an ABI PRISM 7700 Sequence Detection System (Applied Biosystems,
Inc., Foster City, CA). Although SYBR-Green-based detection is less
specific than TaqMan-based detection, we used SYBR-Green due to
time and cost constraints. Primers were strictly selected or
designed to span introns to avoid amplification from contaminating
genomic DNA. Target sequences were kept as small as possible (~100
bp) to ensure the detection of fragmented and partially degraded
RNA. To confirm primer specificity, a single band of expected
amplicon size for each target gene was verified using gel
electrophoresis on a 2% agarose gel and visualized with ethidium
bromide. Primers for PCNA, MKI67, CDKN1A
(p21Cip1), CDK2, CHEK1,
PDRG1, LGR5, PROM1 (CD133),
CD44, SOX2, POU5F1 (OCT4), LKB1,
VEGF, EGFR, HGF, MET, HIF1,
GLUT1, BAX, BCL2, GAPDH and ACTB
(β-actin) were designed with Primer3 software (Biology Workbench
Version 3.2, San Diego Supercomputer Center, University of
California, San Diego). Primer sequences are shown in Table I. PCR was performed in a final
volume of 25 μl with a SYBR-Green PCR Master Mix using 1 μl cDNA
and 400 nM of each primer for the respective genes. Cycling
conditions were 50°C for 2 min and 95°C for 10 min followed by 40
cycles at 95°C for 15 sec and 60°C for 1 min.
 | Table IPrimer sequences of target genes. |
Table I
Primer sequences of target genes.
| Gene symbol | Forward | Reverse |
|---|
| PCNA |
GAAGCACCAAACCAGGAGAA |
TATCGGCATATACGTGCAAA |
| MKI67 |
TGAGCCTGTACGGCTAAAACA |
TTGACTTCCTTCCATTCTGAAG |
| CDKN1A |
GACTCTCAGGGTCGAAAACG |
GGATTAGGGCTTCCTCTTGG |
| CDK2 |
CATTCCTCTTCCCCTCATCA |
TTTAAGGTCTCGGTGGAGGA |
| CHEK1 |
GACTGGGACTTGGTGCAAAC |
CACTGCGACTGATTCAG |
| PDRG1 |
CCTCACCCTGAGACAAAGGA |
GGCGGTTGACCTTCACTTTA |
| LGR5 |
GATGTTGCTCAGGGTGGACT |
GGGAGCAGCTGACTGATGTT |
| PROM1 |
GCTTTGCAATCTCCCTGTTG |
TTGATCCGGGTTCTTACCTG |
| CD44 |
CGGACACCATGGACAAGTTT |
CACGTGGAATACACCTGCAA |
| SOX2 |
CAAGATGCACAACTCGGAGA |
GCTTAGCCTCGTCGATGAAC |
| POU5F1 |
CTGGAGAAGGAGAAGCTGGA |
CAAATTGCTCGAGTTCTTTCTG |
| LKB1 |
CTCTTACGGCAAGGTGAAGG |
TTGTGCCGTAACCTCCTCAG |
| VEGFA |
CAGAAGGAGGAGGGCAGAA |
CTCGATTGGATGGCAGTAGC |
| EGFR |
CCTATGTGCAGAGGAATTATGATCTTT |
CCACTGTGTTGAGGGCAATG |
| HGF |
ATTTGGCCATGTTTTGACC |
AGCTGCGTCCTTTACCAATG |
| MET |
AGGTGTGGGAAAAACCTGA |
ATTCAGCTGTTGCAGGGAAG |
| HIF1 |
CCGCTGGAGACACAATCATA |
CTTCCTCAAGTTGCTGGTCA |
| GLUT1 |
CCTGCAGTTTGGCTACAACA |
GTGGACCCATGTCTGGTTG |
| BAX |
CTTTGCCAGCAAACTGGTG |
CAGCCCATGATGGTTCTGA |
| BCL2 |
TCGCCCTGTGGATGACTGA |
CAGAGACAGCCAGGAGAAATCAA |
| GAPDH |
GGAAGGTGAAGGTCGGAGTC |
AATGAAGGGGTCATTCATGG |
| ACTB |
ACAGAGCCTCGCCTTTGC |
GCGGCGATATCATCATCC |
Relative mRNA levels of target genes
The parameter Ct (threshold cycle) is defined as the
fractional cycle number at which the fluorescence generated by
cleavage of the probe passes a fixed threshold above baseline. The
Ct is inversely proportional to the amount of cDNA, i.e., a higher
Ct value means that more PCR cycles are required to reach a certain
level of detection. Relative mRNA levels were determined using a
standard curve. Standard curves and line equations were generated
using 5-fold serially diluted solutions of cDNA from the LoVo colon
cancer cell line or from qPCR Human Reference Total RNA (Clontech,
Mountain View, CA). All standard curves were linear in the analyzed
range with an acceptable correlation coefficient (R2).
Target gene expression was calculated using the standard curve.
Quantitative normalization of cDNA in each sample was performed
using expression of the ACTB and GAPDH gene as
internal controls. Finally, mRNA levels of the target gene were
presented as ratios between the genes of interest and the internal
reference gene. Real-time PCR assays were performed twice for each
sample and mean values were used for calculations of mRNA
levels.
Statistical analyses
All statistical analyses were performed using Stat
View 5.0 for Windows (SAS Institute Inc., Cary, NC). Values of each
target gene are expressed as median values (inter-quartile range)
in tables. Associations between continuous variables and
categorical variables were evaluated using the Mann-Whitney U test
for two groups. Recurrence-free survival (RFS) and overall survival
(OS) time were calculated from the date of surgery to the date of
disease recurrence and death, respectively. RFS and OS probability
were calculated using the Kaplan-Meier product limit method;
intergroup differences were determined using a log-rank test.
Two-sided P-values of <0.05 were considered statistically
significant.
Results
Patient and tumor characteristics
The median age of the patients was 64.5 years
(range, 38–77 years) and the median follow-up period was 52 months
(range, 3–129 months). The male to female ratio was 2.9:1. The
median age was 64.5 years (range, 37–77 years) and the male to
female ratio was 3.7:1. The post-CRT pathological T stages were pT1
(n=5), pT2 (n=12), pT3 (n=33) and pT4 (n=2). Seventeen patients
(33%) had lymph node metastases. Forty-four tumors (84.6%) showed
well or moderately differentiated adenocarcinoma histology. Three
patients (5.7%) had local recurrence alone. A total of 12 patients
(23.1%) had distant recurrence. Patterns of distant recurrence were
seen as liver and lung metastases in 2 patients, lung metastasis
alone in 6 patients and peritoneal metastasis in 2 patients
(Table II).
| Table IIPatient and tumor
characteristics. |
Table II
Patient and tumor
characteristics.
| Variables | n=52 (%) |
|---|
| Age, median 64.5
years (range, 38–77) |
| Gender |
| Male | 41 (79.0) |
| Female | 11 (21.0) |
| Pre-T
classification |
| 1/2 | 10 (19.2) |
| 3/4 | 42 (80.8) |
| Pre-N
classification |
| Negative | 17 (32.7) |
| Positive | 35 (67.3) |
| Pre-stage |
| I/II | 17 (32.7) |
| III | 35 (67.3) |
| Down staging |
| No | 29 (55.8) |
| Yes | 23 (44.2) |
| Post-T
classification |
| 1/2 | 17 (32.7) |
| 3/4 | 35 (67.3) |
| Post-N
classification |
| Negative | 35 (67.3) |
| Positive | 17 (32.7) |
| Lymphatic
invasion |
| Negative | 13 (25.0) |
| Positive | 39 (75.0) |
| Vascular
invasion |
| Negative | 21 (40.4) |
| Positive | 31 (59.6) |
| Histology |
|
Well/moderately | 44 (84.6) |
|
Poorly/signet/mucinous | 8 (15.4) |
| Post-operative
stage |
| I/II | 33 (63.5) |
| III | 19 (36.5) |
| Radiation |
| Short, 20 Gy/4
fractions | 41 (78.8) |
| Long, 45 Gy/25
fractions | 11 (21.2) |
| Recurrence |
| None | 37 (71.2) |
| Local alone | 3 (5.7) |
| Distant
with/without local failure | 12 (23.1) |
Evaluation of pathological response by
TRG
Table III shows
the pathological response after CRT using each TRG. Responders were
categorized as patients with JSCCR TRG 2, Mandard TRG 2, Dworak and
Rödel TRG 3. The others were non-responders. We excluded the cases
with pathological complete response and no regression in this study
(JSCCR TRG 0 and 3, Mandard TRG 1 and 5, Dworak TRG 0 and 4, Rödel
TRG 0 and 4).
| Table IIIEvaluation of pathological response
by TRGs. |
Table III
Evaluation of pathological response
by TRGs.
| Criteria | n=52 (%) |
|---|
| JSCCR |
| TRG 0 | - |
| TRG 1a | 13 (25.0) |
| TRG 1b | 30 (57.6) |
| TRG 2 | 9 (17.4) |
| TRG 3 | - |
| Mandard |
| TRG 1 | - |
| TRG 2 | 15 (28.8) |
| TRG 3 | 23 (44.2) |
| TRG 4 | 14 (27.0) |
| TRG 5 | - |
| Dworak |
| TRG 0 | - |
| TRG 1 | 14 (27.0) |
| TRG 2 | 32 (61.5) |
| TRG 3 | 6 (11.5) |
| TRG 4 | - |
| Rödel |
| TRG 0 | - |
| TRG 1 | 10 (19.2) |
| TRG 2 | 22 (42.3) |
| TRG 3 | 20 (38.5) |
| TRG 4 | - |
Gene expression profiles of residual
cancer according to TRG
Total RNA was isolated from 52 specimens and
transcriptional analysis was performed for 20 genes. Table IV shows the gene expression levels
of residual cancer according to TRG. LGR5 gene expression in
non-responders was significantly higher than in responders among
all TRG systems. Patients with elevated PDRG1 and
GLUT1 gene expression had poor pathological response using
the JSCCR, Dworak and Rödel TRG criteria. MKI67 gene
expression in non-responders was significantly higher than in
responders in the JSCCR and Rödel TRG systems. While, BAX
gene expression in responders was significantly higher than in
non-responders in Mandard TRG system. Patients with poor
pathological response based on the Rödel criteria had significantly
higher gene expression of MKI67, PDRG1, LGR5,
LKB1, EGFR, MET and GLUT1.
| Table IVGene expression profiles of residual
cancer according to TRG systems. |
Table IV
Gene expression profiles of residual
cancer according to TRG systems.
| JSCCR | Mandard | Dworak | Rödel |
|---|
|
|
|
|
|
|---|
| Gene symbol
(range) | Non-responder
(n=43) | Responder
(n=9) | P-value | Non-responder
(n=37) | Responder
(n=15) | P-value | Non-responder
(n=46) | Responder
(n=6) | P-value | Non-responder
(n=32) | Responder
(n=20) | P-value |
|---|
| PCNA
(0–0.433) | 0.0248 | 0.0057 | 0.2122 | 0.0248 | 0.0104 | 0.2975 | 0.0221 | 0.0063 | 0.1396 | 0.0414 | 0.0091 | 0.0585 |
| MKI67
(0–46.647) | 2.1635 | 0.0002 | 0.0282a | 2.4304 | 0.2072 | 0.0554 | 2.0224 | 0.0003 | 0.2521 | 2.7135 | 0.3099 | 0.0207a |
| CDKN1A
(0–11.562) | 1.4291 | 1.9966 | 0.3393 | 1.4604 | 1.4038 | 0.7542 | 1.4448 | 1.5462 | 0.9999 | 1.6539 | 1.2498 | 0.3766 |
| CDK2
(0–32.813) | 0.4628 | 0.2893 | 0.7333 | 0.5166 | 0.2893 | 0.4644 | 0.4405 | 0.0733 | 0.4115 | 0.5279 | 0.2484 | 0.2332 |
| CHEK
(0–0.318) | 0.0205 | 0.0037 | 0.6646 | 0.0238 | 0.0022 | 0.1475 | 0.0192 | 0.0055 | 0.7974 | 0.0258 | 0.0044 | 0.5879 |
| PDRG1
(0–0.308) | 0.0485 | 0.0091 | 0.0077a | 0.0438 | 0.0096 | 0.0841 | 0.0409 | 0.0048 | 0.0296a | 0.1068 | 0.0118 | 0.0135a |
| LGR5
(0–54.643) | 7.7440 | 0.1810 | 0.0018a | 10.6660 | 2.0120 | 0.0037a | 7.2345 | 0.0905 | 0.0039a | 9.7080 | 7.4985 | 0.0105a |
| PROM1
(0–0.523) | 0.1070 | 0.0280 | 0.4533 | 0.1070 | 0.0660 | 0.6937 | 0.1110 | 0.0195 | 0.2519 | 0.1040 | 0.0820 | 0.5662 |
| CD44
(0–1.274) | 0.1500 | 0.1080 | 0.9130 | 0.1500 | 0.1080 | 0.9354 | 0.1510 | 0.0525 | 0.4549 | 0.1740 | 0.1050 | 0.1025 |
| SOX2
(0–71.914) | 2.2590 | 3.2150 | 0.3273 | 2.2590 | 0.2541 | 0.1404 | 2.4000 | 1.6905 | 0.2290 | 2.8365 | 1.7595 | 0.0923 |
| POU5F1
(0–600.343) | 6.7220 | 5.7540 | 0.2506 | 6.7220 | 5.7540 | 0.2623 | 9.6385 | 3.2130 | 0.0758 | 6.0060 | 10.9950 | 0.5473 |
| LKB1
(0–0.442) | 0.0233 | 0.0027 | 0.0712 | 0.0233 | 0.0163 | 0.2793 | 0.0226 | 0.0095 | 0.2623 | 0.0319 | 0.0057 | 0.0110a |
| VEGFA
(0–0.092) | 0.0289 | 0.0331 | 0.7555 | 0.0278 | 0.0316 | 0.9378 | 0.0309 | 0.0316 | 0.6733 | 0.0278 | 0.0316 | 0.7618 |
| EGFR
(0–0.256) | 0.0128 | 0.0183 | 0.4835 | 0.0142 | 0.0104 | 0.2886 | 0.0129 | 0.0189 | 0.7518 | 0.0148 | 0.0093 | 0.0377a |
| HGF
(0–1.2323) | 0.1334 | 0.0316 | 0.7226 | 0.1792 | 0.0078 | 0.2741 | 0.14405 | 0.0158 | 0.4005 | 0.2008 | 0.03055 | 0.0621 |
| MET
(0–3.477) | 0.26 | 0.066 | 0.1239 | 0.26 | 0.066 | 0.1851 | 0.257 | 0.059 | 0.0801 | 0.526 | 0.063 | 0.0310a |
| HIF1
(0–0.390) | 0.0775 | 0.1553 | 0.5836 | 0.0775 | 0.1388 | 0.3581 | 0.0776 | 0.1130 | 0.9088 | 0.0776 | 0.0722 | 0.8361 |
| GLUT1
(0–8.189) | 0.7059 | 0.3017 | 0.0151a | 0.6598 | 0.5140 | 0.2295 | 0.6408 | 0.1904 | 0.0274a | 0.7259 | 0.3981 | 0.0352a |
| BAX
(0–15.062) | 0.7128 | 1.0788 | 0.0696 | 0.6855 | 1.0548 | 0.0339a | 0.7171 | 1.0668 | 0.1118 | 0.7751 | 0.7063 | 0.8655 |
| BCL2
(0–0.617) | 0.0336 | 0.1139 | 0.6801 | 0.0366 | 0.0745 | 0.9204 | 0.0316 | 0.1696 | 0.2986 | 0.0393 | 0.0607 | 0.9835 |
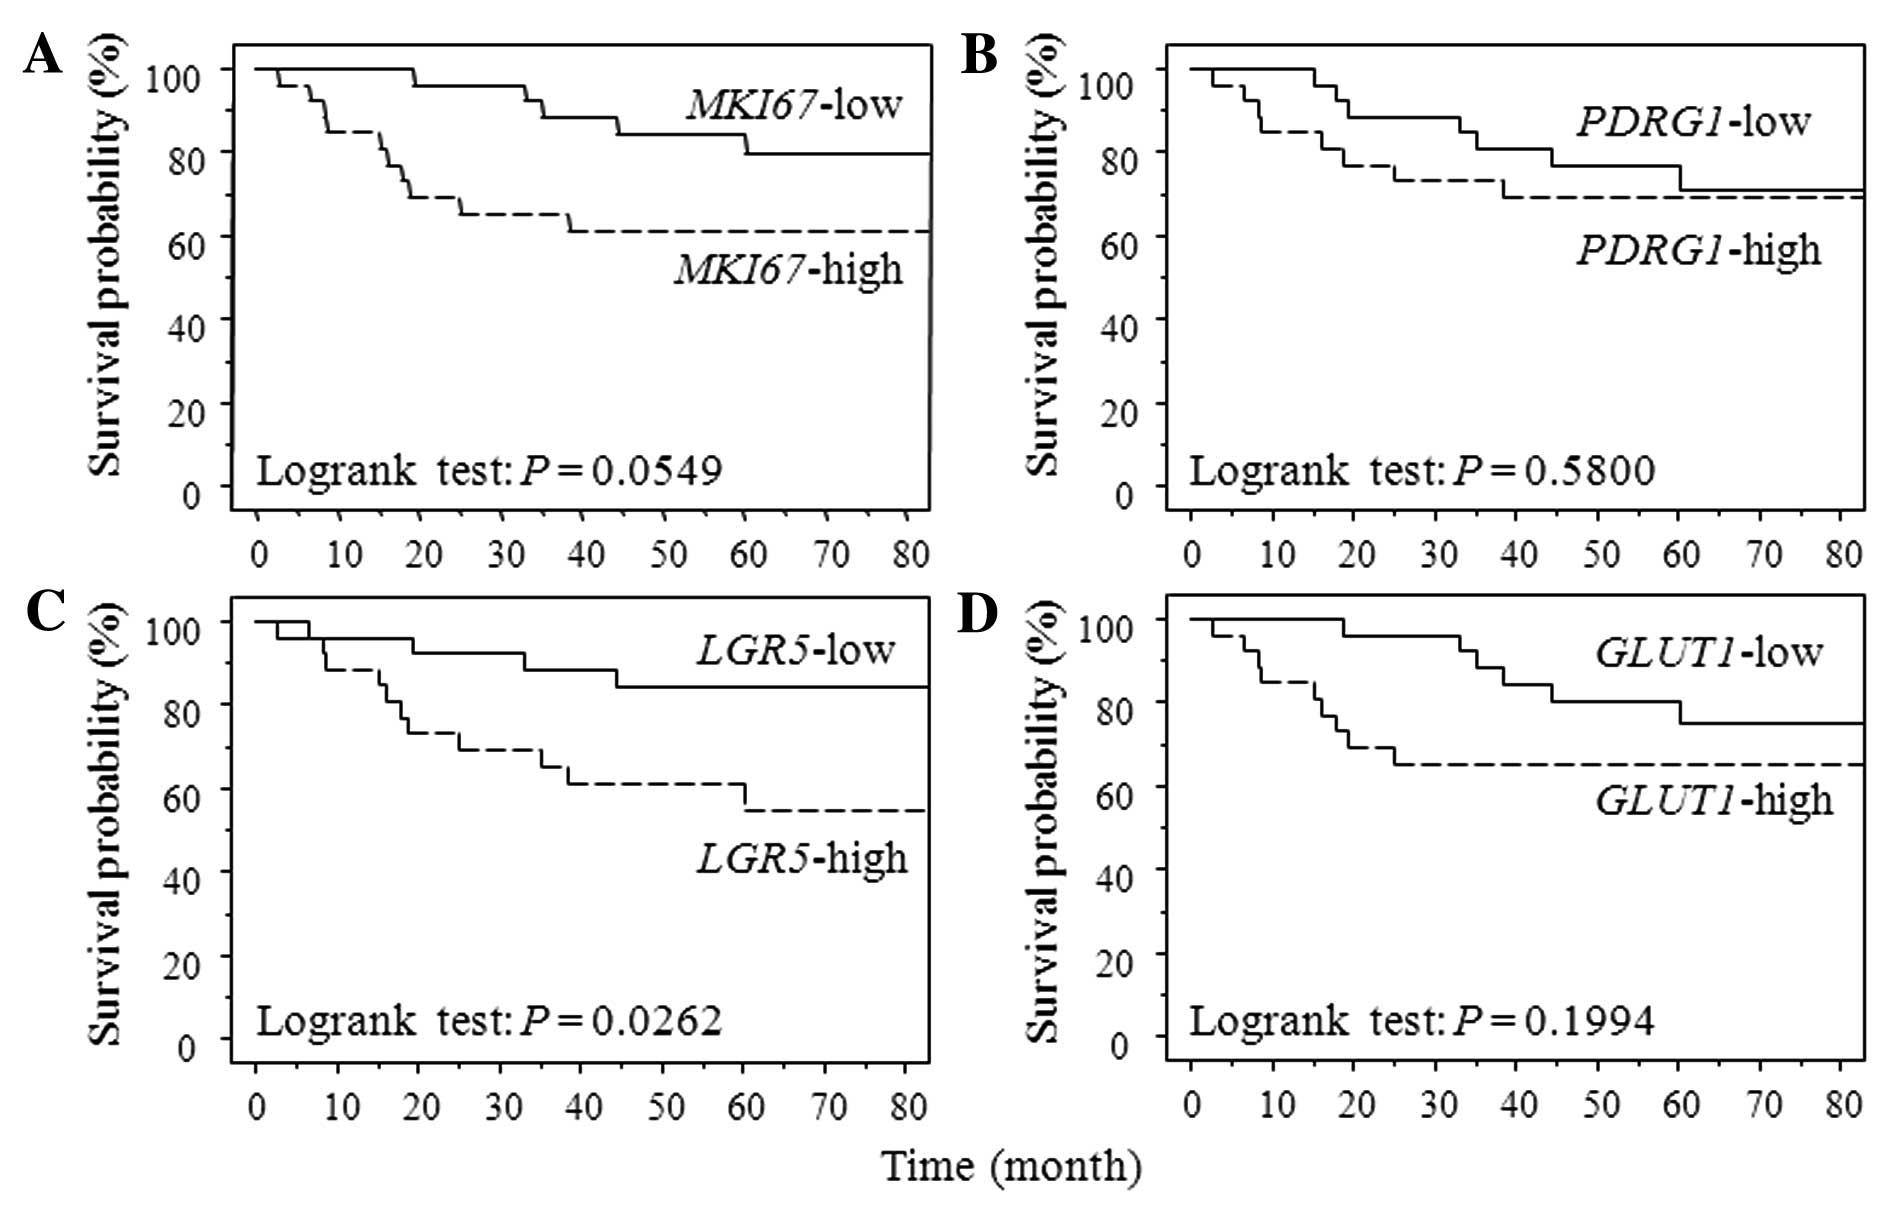
Recurrence-free and overall survival
based on expression levels of PDRG1, LGR5 and GLUT1
We investigated whether the gene expression levels
correlated with TRG were also associated with patient prognosis
after pre-operative CRT followed by curative surgery because it has
been reported as a predicter of clinical outcome. Four genes were
selected (MKI67, PDRG1, LGR5 and GLUT1)
that were significantly correlated with more than two TRG systems.
The median value of MKI67, PDRG1, LGR5 and
GLUT1 gene expression was 0.00000895, 0.0308, 6.295 and
0.566, respectively. We categorized the case with more than the
median value as the high gene expression group, and the remaining
as the low group. Fig. 1 shows the
survival curve for RFS according to each gene expression level
using Kaplan-Meier analysis. Patients with LGR expression
levels above the cut-off values showed a significantly poorer RFS
than did patients with expression levels below the cut-off values
(P=0.0262). Patients in high MKI67 expression group had
poorer RFS than that in low group without significant difference
(P=0.0549). Patients with high GLUT1 gene expression had
significantly poorer OS than those with low one (GLUT1
P=0.0093). MKI67, PDRG1 and LGR5 gene
expression were not associated with OS (MKI67, P=0.6018;
PDRG1, P=0.5493; LGR5, P=0.6487) (data not
shown).
Discussion
Rectal cancer is one of the most common cancers in
Japan and the Western world. The introduction of pre-operative CRT
and total mesorectal excision for the management of locally
advanced rectal cancer significantly decreased local recurrence
rates and improved sphincter preservation and patient survival
(23–26). However, tumor recurrence remains the
major cause of mortality in these patients, and the mechanism of
tumor recurrence after pre-operative CRT remains unclear. In this
study, the expression levels of 20 genes were correlated with TRG
to determine if gene expression levels can be associated with tumor
recurrence in locally advanced rectal cancer after pre-operative
CRT.
Tumor down-staging, post-operative stage, N, T
classification and TRG have been identified as important prognostic
factors in rectal cancer patients following pre-operative CRT
(3–8,27–29).
We observed that advanced post-operative stage, the presence of
lymph node metastasis and poor pathological response based on JSCCR
and Rödel TRGs were significantly associated with recurrence-free
survival in this study of 52 patients (log-rank test;
post-operative stage, P=0.0137; presence of lymph node metastasis,
P=0.0244; JSCCR, P=0.0464; Rödel, P=0.0338) (data not shown). Our
data were similar to previous studies although down-staging and T
classification were not associated with clinical outcome.
Transcriptional analyses of gene expression according to TRG were
then performed. To the best of our knowledge, there are few reports
on the correlation between TRG and gene expression of residual
cancer cells after pre-operative CRT. The expression levels of
eight genes were correlated with TRGs. LGR5 gene expression
levels in non-responders was significantly higher than those in
responders in all four TRG systems. LGR5 is a potential marker for
stem cells in the small intestine and colon (30). Overexpression of LGR5 has also been
implicated in colorectal carcinogenesis (31). Elevated PDRG1 and
GLUT1 gene expression level was significantly correlated
with poor pathological response in three of the four TRG systems
(JSCCR, Dworak and Rödel). PDRG1 is regulated by DNA damage
due to ultraviolet radiation and is implicated in tumor cell growth
(32,33). GLUT1 serves as a hypoxic
indicator and is a hypoxic marker in colorectal cancer (34). Immunohistochemistry of GLUT1
expression in pre-treatment rectal cancer biopsy samples suggests
that GLUT1 might be a useful predictive marker of response to CRT
in rectal cancer (35).
MKI67, LKB1, EGFR, MET and BAX
expression levels were significantly correlated with one to two TRG
systems. MKI67 is a proliferative marker (36) and LKB1 has been implicated in
the maintenance of hematopoietic stem cells and tumorigenesis
through the suppression of apoptosis (37–39).
BCL2/BAX act as anti- or pro-apoptotic regulator. We
observed that high BAX, but not BCL2, expression was
correlated with better pathological response based on Mandard TRG
system. Reduction of BAX function in human colorectal cancer
cells has been associated with resistance to chemotherapy (40) and BAX expression was
correlated with outcome to neoadjuvant CRT (41) using imuunohistochemistry in pre-CRT
samples. Our result suggested that post-CRT BAX expression
also might reveal the correlation of resistance to CRT. We examined
whether gene expression of TRGs were associated with prognosis in
rectal cancer after pre-operative CRT followed by surgery. We
observed that patients with high LGR5 expression had
significant correlation to RFS. Elevated GLUT1 expression
was significantly associated with poor OS.
Biomarkers for tumor recurrence and prognosis after
pre-operative CRT followed by curative surgery remain to be
established. Our results may help identify prognostic predictors
and clarify the strategy of adjuvant therapy for tumor recurrence
after pre-operative CRT. However, it is not clear if the gene
expressions correlated with TRGs are inherent or acquired after CRT
due to the inability to compare expression levels between pre- and
post-CRT samples. Therefore, these results did not directly show
the predictive value of response to pre-operative CRT. We plan to
examine the gene expression levels between pre-CRT biopsy and
post-CRT samples.
In conclusion, TRG may reflect certain
characteristics, such as proliferative activity, stemness potency
and resistance to hypoxia, of residual cancer cells after
pre-operative CRT. Moreover, the gene expression levels correlated
with TRG were associated with poor recurrence-free survival in
patients with locally advanced rectal cancer after neoadjuvant CRT.
However, data in this study should be interpreted with some
caution. The major limitation was the small number of patients,
especially for patients with recurrence, and the retrospective
nature of the study. A larger study population will allow us to
validate these conclusions.
Acknowledgements
The authors would like to thank Yuka Kato and Motoko
Ueda for providing excellent technical assistance.
References
|
1
|
Van den Brink M, Stiggelbout AM, van den
Hout WB, et al: Clinical nature and prognosis of locally recurrent
rectal cancer after total mesorectal excision with or without
preoperative radiotherapy. J Clin Oncol. 22:3958–3964.
2004.PubMed/NCBI
|
|
2
|
Collette L, Bosset JF, den Dulk M, et al:
Patients with curative resection of cT3-4 rectal cancer after
preoperative radiotherapy or radiochemotherapy: does anybody
benefit from adjuvant fluorouracil-based chemotherapy? A trial of
the European Organisation for Research and Treatment of Cancer
Radiation Oncology Group. J Clin Oncol. 25:4379–4386. 2007.
|
|
3
|
Rodel C, Martus P, Papadoupolos T, et al:
Prognostic significance of tumor regression after preoperative
chemoradiotherapy for rectal cancer. J Clin Oncol. 23:8688–8696.
2005. View Article : Google Scholar : PubMed/NCBI
|
|
4
|
Vironen J, Juhola M, Kairaluoma M, et al:
Tumour regression grading in the evaluation of tumour response
after different preoperative radiotherapy treatments for rectal
carcinoma. Int J Colorectal Dis. 20:440–445. 2005. View Article : Google Scholar
|
|
5
|
Vecchio FM, Valentini V, Minsky BD, et al:
The relationship of pathologic tumor regression grade (TRG) and
outcomes after preoperative therapy in rectal cancer. Int J Radiat
Oncol Biol Phys. 62:752–760. 2005. View Article : Google Scholar : PubMed/NCBI
|
|
6
|
Bujko K, Michalski W, Kepka L, et al:
Association between pathologic response in metastatic lymph nodes
after preoperative chemoradiotherapy and risk of distant metastases
in rectal cancer: an analysis of outcomes in a randomized trial.
Int J Radiat Oncol Biol Phys. 67:369–377. 2007. View Article : Google Scholar
|
|
7
|
Dhadda AS, Dickinson P, Zaitoun AM, et al:
Prognostic importance of Mandard tumour regression grade following
pre-operative chemo/radiotherapy for locally advanced rectal
cancer. Eur J Cancer. 47:1138–1145. 2011. View Article : Google Scholar
|
|
8
|
Topova L, Hellmich G, Puffer E, et al:
Prognostic value of tumor response to neoadjuvant therapy in rectal
carcinoma. Dis Colon Rectum. 54:401–411. 2011. View Article : Google Scholar : PubMed/NCBI
|
|
9
|
Jorgensen TJ: Enhancing radiosensitivity:
targeting the DNA repair pathways. Cancer Biol Ther. 8:665–670.
2009. View Article : Google Scholar : PubMed/NCBI
|
|
10
|
Maity A, McKenna WG and Muschel RJ: The
molecular basis for cell cycle delays following ionizing radiation:
a review. Radiother Oncol. 31:1–13. 1994. View Article : Google Scholar : PubMed/NCBI
|
|
11
|
Coleman CN: Hypoxia in tumors: a paradigm
for the approach to biochemical and physiologic heterogeneity. J
Natl Cancer Inst. 80:310–317. 1988. View Article : Google Scholar : PubMed/NCBI
|
|
12
|
Overgaard J: Hypoxic radiosensitization:
adored and ignored. J Clin Oncol. 25:4066–4074. 2007. View Article : Google Scholar : PubMed/NCBI
|
|
13
|
Deorukhkar A and Krishnan S: Targeting
inflammatory pathways for tumor radiosensitization. Biochem
Pharmacol. 80:1904–1914. 2010. View Article : Google Scholar : PubMed/NCBI
|
|
14
|
Baumann M, Krause M and Hill R: Exploring
the role of cancer stem cells in radioresistance. Nat Rev Cancer.
8:545–554. 2008. View
Article : Google Scholar : PubMed/NCBI
|
|
15
|
Zeki SS, Graham TA and Wright NA: Stem
cells and their implications for colorectal cancer. Nat Rev
Gastroenterol Hepatol. 8:90–100. 2011. View Article : Google Scholar : PubMed/NCBI
|
|
16
|
Yoshikawa R, Kusunoki M, Yanagi H, et al:
Dual antitumor effects of 5-fluorouracil on the cell cycle in
colorectal carcinoma cells: a novel target mechanism concept for
pharmacokinetic modulating chemotherapy. Cancer Res. 61:1029–1037.
2001.
|
|
17
|
Bateman AC, Jaynes E and Bateman AR:
Rectal cancer staging post neoadjuvant therapy - how should the
changes be assessed? Histopathology. 54:713–721. 2009. View Article : Google Scholar : PubMed/NCBI
|
|
18
|
Japanese Society for Cancer of the Colon
and Rectum. General rules for clinical and pathological studies on
cancer of the colon, rectum and anus. Kanehara & Co; Tokyo:
2006
|
|
19
|
Mandard AM, Dalibard F, Mandard JC, et al:
Pathologic assessment of tumor regression after preoperative
chemoradiotherapy of esophageal carcinoma. Clinicopathologic
correlations. Cancer. 73:2680–2686. 1994. View Article : Google Scholar
|
|
20
|
Dworak O, Keilholz L and Hoffmann A:
Pathological features of rectal cancer after preoperative
radiochemotherapy. Int J Colorectal Dis. 12:19–23. 1997. View Article : Google Scholar : PubMed/NCBI
|
|
21
|
Saigusa S, Tanaka K, Toiyama Y, et al:
Correlation of CD133, OCT4, and SOX2 in rectal cancer and their
association with distant recurrence after chemoradiotherapy. Ann
Surg Oncol. 16:3488–3498. 2009. View Article : Google Scholar : PubMed/NCBI
|
|
22
|
Bijwaard KE, Aguilera NS, Monczak Y, et
al: Quantitative real-time reverse transcription-PCR assay for
cyclin D1 expression: utility in the diagnosis of mantle cell
lymphoma. Clin Chem. 47:195–201. 2001.PubMed/NCBI
|
|
23
|
Sauer R, Becker H, Hohenberger W, et al:
Preoperative versus postoperative chemoradiotherapy for rectal
cancer. N Engl J Med. 351:1731–1740. 2004. View Article : Google Scholar : PubMed/NCBI
|
|
24
|
Gerard JP, Chapet O, Nemoz C, et al:
Improved sphincter preservation in low rectal cancer with high-dose
preoperative radiotherapy: the lyon R96–02 randomized trial. J Clin
Oncol. 22:2404–2409. 2004.PubMed/NCBI
|
|
25
|
Guillem JG, Chessin DB, Cohen AM, et al:
Long-term oncologic outcome following preoperative combined
modality therapy and total mesorectal excision of locally advanced
rectal cancer. Ann Surg. 241:829–838. 2005. View Article : Google Scholar
|
|
26
|
Bosset JF, Collette L, Calais G, et al:
Chemotherapy with preoperative radiotherapy in rectal cancer. N
Engl J Med. 355:1114–1123. 2006. View Article : Google Scholar : PubMed/NCBI
|
|
27
|
Kaminsky-Forrett MC, Conroy T, Luporsi E,
et al: Prognostic implications of downstaging following
preoperative radiation therapy for operable T3-T4 rectal cancer.
Int J Radiat Oncol Biol Phys. 42:935–941. 1998. View Article : Google Scholar : PubMed/NCBI
|
|
28
|
Chapet O, Romestaing P, Mornex F, et al:
Preoperative radiotherapy for rectal adenocarcinoma: which are
strong prognostic factors? Int J Radiat Oncol Biol Phys.
61:1371–1377. 2005. View Article : Google Scholar : PubMed/NCBI
|
|
29
|
Kim TH, Chang HJ, Kim DY, et al:
Pathologic nodal classification is the most discriminating
prognostic factor for disease-free survival in rectal cancer
patients treated with preoperative chemoradiotherapy and curative
resection. Int J Radiat Oncol Biol Phys. 77:1158–1165. 2010.
View Article : Google Scholar
|
|
30
|
Barker N, van Es JH, Kuipers J, et al:
Identification of stem cells in small intestine and colon by marker
gene Lgr5. Nature. 449:1003–1007. 2007. View Article : Google Scholar : PubMed/NCBI
|
|
31
|
Uchida H, Yamazaki K, Fukuma M, et al:
Overexpression of leucine-rich repeat-containing G protein-coupled
receptor 5 in colorectal cancer. Cancer Sci. 101:1731–1737. 2010.
View Article : Google Scholar : PubMed/NCBI
|
|
32
|
Luo X, Huang Y and Sheikh MS: Cloning and
characterization of a novel gene PDRG that is differentially
regulated by p53 and ultraviolet radiation. Oncogene. 22:7247–7257.
2003. View Article : Google Scholar : PubMed/NCBI
|
|
33
|
Jiang L, Luo X, Shi J, et al: PDRG1, a
novel tumor marker for multiple malignancies that is selectively
regulated by genotoxic stress. Cancer Biol Ther. 11:567–573. 2011.
View Article : Google Scholar : PubMed/NCBI
|
|
34
|
Chung FY, Huang MY, Yeh CS, et al: GLUT1
gene is a potential hypoxic marker in colorectal cancer patients.
BMC Cancer. 9:2412009. View Article : Google Scholar : PubMed/NCBI
|
|
35
|
Brophy S, Sheehan KM, McNamara DA, et al:
GLUT-1 expression and response to chemoradiotherapy in rectal
cancer. Int J Cancer. 125:2778–2782. 2009. View Article : Google Scholar : PubMed/NCBI
|
|
36
|
Hofstadter F, Knuchel R and Ruschoff J:
Cell proliferation assessment in oncology. Virchows Arch.
427:323–341. 1995. View Article : Google Scholar
|
|
37
|
Herrmann JL, Byekova Y, Elmets CA, et al:
Liver kinase B1 (LKB1) in the pathogenesis of epithelial cancers.
Cancer Lett. 306:1–9. 2011. View Article : Google Scholar : PubMed/NCBI
|
|
38
|
Gurumurthy S, Xie SZ, Alagesan B, et al:
The Lkb1 metabolic sensor maintains haematopoietic stem cell
survival. Nature. 468:659–663. 2010. View Article : Google Scholar : PubMed/NCBI
|
|
39
|
Gan B, Hu J, Jiang S, et al: Lkb1
regulates quiescence and metabolic homeostasis of haematopoietic
stem cells. Nature. 468:701–704. 2010. View Article : Google Scholar : PubMed/NCBI
|
|
40
|
Yamaguchi H, Bhalla K and Wang HG: Bax
plays a pivotal role in thapsigargin-induced apoptosis of human
colon cancer HCT116 cells by controlling Smac/Diablo and Omi/HtrA2
release from mitochondria. Cancer Res. 63:1483–1489.
2003.PubMed/NCBI
|
|
41
|
Chang HJ, Jung KH, Kim DY, et al: Bax, a
predictive marker for therapeutic response to preoperative
chemoradiotherapy in patients with rectal carcinoma. Hum Pathol.
36:364–371. 2005. View Article : Google Scholar : PubMed/NCBI
|