Introduction
Prognosis of patients with pancreatic cancer (PC) is
poor because of belated diagnosis and lack of effective therapies.
This disease is characterized by rapid tumor spread, and the median
survival is less than 12 months with an overall 5-year survival
rate of <5% (1). It is imminent
therefore to find more effective biomarkers for the diagnosis of
patients with pancreatic cancer and to clarify the biological
characteristics of rapid aggressiveness of PC.
In recent years, proteomics has been widely applied
to the identification of candidate biomarkers and therapeutic
targets in various cancers (2–5).
Two-dimensional gel electrophoresis (2-DE) and liquid
chromatography-tandem mass spectrometry (LC-MS/MS) are the major
proteomics techniques, which are utilized in analyzing proteins
comprehensively.
The proteomics technology is an ideal option for
finding biomarkers and therapeutic targets in cancer. By applying
2-DE and LC-MS/MS combined with western blotting, we found six
differentially expressed proteins between pancreatic cancerous and
non-cancerous tissues, and among them vinculin was identified as a
potential biomarker for PC diagnosis or prognosis.
Materials and methods
Pancreatic tissues and sample
preparation
Thirty pairs of non-cancerous and cancerous
pancreatic tissues were obtained from 30 patients (Table I) who underwent resection of
pancreas with diagnosis of pancreatic cancer at the Department of
Surgery II, Yamaguchi University Hospital.
 | Table IClinicopathological parameters of
patients with pancreatic cancer. |
Table I
Clinicopathological parameters of
patients with pancreatic cancer.
| No. | Age | Gender | TNM stage | Tumor grade |
|---|
| 1a | 79 | Male | III | Moderately
differentiated |
| 2a | 67 | Male | III | Moderately
differentiated |
| 3a | 54 | Male | III | Moderately
differentiated |
| 4a | 75 | Male | IVb | Poorly
differentiated |
| 5a | 71 | Female | III | Well
differentiated |
| 6a | 58 | Male | IVb | Mucinous
carcinoma |
| 7a | 70 | Female | III | Moderately
differentiated |
| 8a | 64 | Male | III | Moderately
differentiated |
| 9a | 61 | Male | IVa | Moderately
differentiated |
| 10a | 51 | Female | II | Moderately
differentiated |
| 11 | 67 | Male | IVa | Well
differentiated |
| 12 | 60 | Female | III | Moderately
differentiated |
| 13 | 48 | Female | IVa | Moderately
differentiated |
| 14 | 73 | Male | IVa | Moderately
differentiated |
| 15 | 54 | Male | IVa | Moderately
differentiated |
| 16 | 57 | Male | IVb | Moderately
differentiated |
| 17 | 54 | Male | III | Moderately
differentiated |
| 18 | 74 | Female | IVa | Poorly
differentiated |
| 19 | 72 | Male | III | Moderately
differentiated |
| 20 | 72 | Male | IVa | Well
differentiated |
| 21 | 76 | Female | IVa | Moderately
differentiated |
| 22 | 73 | Female | III | Papillary
carcinoma |
| 23 | 53 | Male | IVb | Well
differentiated |
| 24 | 69 | Female | III | Moderately
differentiated |
| 25 | 79 | Male | IVb | Mucinous
carcinoma |
| 26 | 34 | Male | IVb | Acinor carcinoma |
| 27 | 71 | Female | III | Moderately
differentiated |
| 28 | 67 | Female | IVa | Moderately
differentiated |
| 29 | 68 | Male | III | Moderately
differentiated |
| 30 | 60 | Male | IVb | Moderately
differentiated |
None of the patients received any preoperative
therapy. Written informed consent was obtained from all patients
before surgery. Tissues were obtained immediately after surgery and
stored at −80°C until use. The study protocol was approved by the
Institutional Review Board for Human Use of the Yamaguchi
University School of Medicine. The tissues were homogenized in
lysis buffer (1% NP-40, 1 mM sodium vanadate, 1 mM PMSF, 10 mM NaF,
10 mM EDTA, 50 mM Tris, 165 mM NaCl, 10 μg/ml leupeptin, and 10
μg/ml aprotinin) on ice (5).
Suspensions were incubated for 2 h at 4°C, and the supernatants
were stored at −80°C until they were used as samples. Ten pairs of
samples were used for 2-DE, and twenty pairs for western
blotting.
Two-dimensional gel electrophoresis
(2-DE)
As the first dimension, isoelectric focusing (IEF)
was conducted in an IPGphor 3 IEF unit (GE Healthcare,
Buckinghamshire, UK) on 11-cm and pH 3–10 linear gradient IPG
strips (Bio-Rad, Hercules, CA, USA) at 50 μA/strip. Protein (80 μg)
was used for each 2-DE. Samples were mixed with 200 μl of
rehydration buffer [8 M urea, 2% CHAPS, 0.01% bromophenol blue,
1.2% Destreak reagent (GE Healthcare)] and 0.5% IPG buffer, and
loaded in the IPGphor strip holder. The strips were then focused by
the following program: rehydration for 10 h (no voltage); 0–500 V
for 4 h; 500–1,000 V for 1 h; 1,000–8,000 V for 4 h; 8,000 V for 20
min; and the final phase of 500 V from 20,000–30,000 Vh (6). After IEF, sodium dodecyl
sulfate-polyacrylamide gel electrophoresis (SDS-PAGE) was performed
on a precast polyacrylamide gel with a linear concentration
gradient of 5–20% (Bio-Rad) (7).
The IPG strips were first equilibrated in equilibration buffer 1 (6
M urea, 0.5 M Tris-HCl, pH 8.8, 30% glycerol, 2% SDS, 2% 2-ME) for
10 min, and further in equilibration buffer 2 (6 M urea, 0.5 M
Tris-HCl, pH 8.8, 30% glycerol, 2% SDS, 2.5% iodoacetamide) for 10
min. The IPG strips were then transferred onto the gels, which were
run at 200 V (8). Each sample was
replicated three times to ensure protein pattern
reproducibility.
Fluorescence staining
The SDS-PAGE gels were fixed with 40% ethanol and
10% acetic acid for 2.5 h. The gels were then treated with a
fluorescent gel staining, Flamingo™ Fluorescent Gel Stain
(Bio-Rad), for 18 h (9). The
stained gels were washed with Milli-Q water 3 times, for 5 min
each. These experimental procedures were carried out on a
shaker.
Image analysis and spot picking
The gels were scanned by using the ProXpress 2-D
Proteomic Imaging System (PerkinElmer, Waltham, MA, USA) and then
analyzed by using the Progenesis SameSpots software (Nonlinear
Dynamics, Newcastle, UK) following the user manual. After image
analysis, the gels were stained with See Pico™ (Benebiosis Co.,
Ltd., Seoul, Korea) overnight (10). The selected protein spots that
displayed different intensities were cut from the gels and
subjected to mass spectrometry (MS) analysis.
In-gel digestion
The gel pieces were destained by rinsing three times
in 60% methanol, 0.05 M ammonium bicarbonate, and 5 mM DTT for 15
min. The sample in the gel piece was reduced twice in 50% methanol,
0.05 M ammonium bicarbonate, and 5 mM DTT for 10 min. The gel
pieces were dehydrated twice in 100% acetonitrile (ACN) for 30 min.
Enzyme digestion was carried out with an in-gel digestion reagent
containing 10 μg/ml sequencing-grade-modified trypsin (Promega
Corporation, Madison, WI, USA) in 30% ACN, 0.05 M ammonium
bicarbonate, and 5 mM DTT at 30°C for 16 h. The samples were
lyophilized overnight with the use of Labconco Lyph-lock 1L Model
77400 (Labconco, Kansas, MO, USA).
LC-MS/MS analysis
The lyophilized samples were dissolved in 15 μl of
0.1% formic acid, and then analyzed by using the LC-MS/MS system.
Peptide sequencing of identified protein spots was carried out by
using LC-MS/MS with a Spectrum Mill MS Proteomics Workbench
(Agilent Technologies, Palo Alto, CA, USA). Fifteen microliters of
each sample was injected and placed into separated columns (Zorbax
300SB-C18, 75 μm, 150 mm, Agilent Technologies). The Agilent 1100
capillary pump was operated in the following conditions: solvent A,
0.1% formic acid; solvent B, ACN in 0.1% formic acid; column flow,
0.3 μl/min for primary flow, otherwise 300 μl/min; gradient, 0–5
min 2% B and 60 min 60% B; stop time: 60 min. Proteins were
identified in the Agilent Spectrum Mill MS Proteomics Workbench
against the Swiss-Prot protein database search engine (http://kr.expasy.org/sprot/) and MASCOT MS/MS Ions
Search engine (http://www.matrixscience.com/search_form_select.html).
Standards for induction of candidate proteins were set as follows:
filter by protein score >10.0, and filter peptide by score >8
(percent scored peak intensity).
Western blotting
The samples were separated by electrophoresis with
SDS-PAGE gels and then transferred onto PVDF membranes at 90 mA for
78 min. The membranes were blocked overnight with TBS containing 5%
milk at 4°C (11). They were
incubated with the primary antibody against vinculin (anti-vinculin
mouse monoclonal antibody, Sigma, St. Louis, MO, USA; 1:10,000),
α-enolase (anti-enolase goat polyclonal antibody, Santa Cruz
Biotechnology, Inc., Santa Cruz, CA; 1:1,000) and actin (anti-actin
goat polyclonal antibody, Santa Cruz Biotechnology, Inc.; 1:200).
The membranes were incubated with the secondary antibody conjugated
with horseradish peroxidase (1:10,000) for 1 h at room temperature
after washing three times with TBS containing Tween-20 and once
with TBS. The membranes were treated with the
ImmunoStar® LD chemiluminescent reagent (Wako Pure
Chemical Industries Ltd., Osaka, Japan), and protein spots were
detected by using the Image Reader LAS-1000 Pro (Fujifilm
Corporation, Tokyo, Japan).
Results
Detection of protein spots in pancreatic
cancerous and non-cancerous tissues on 2-DE gels
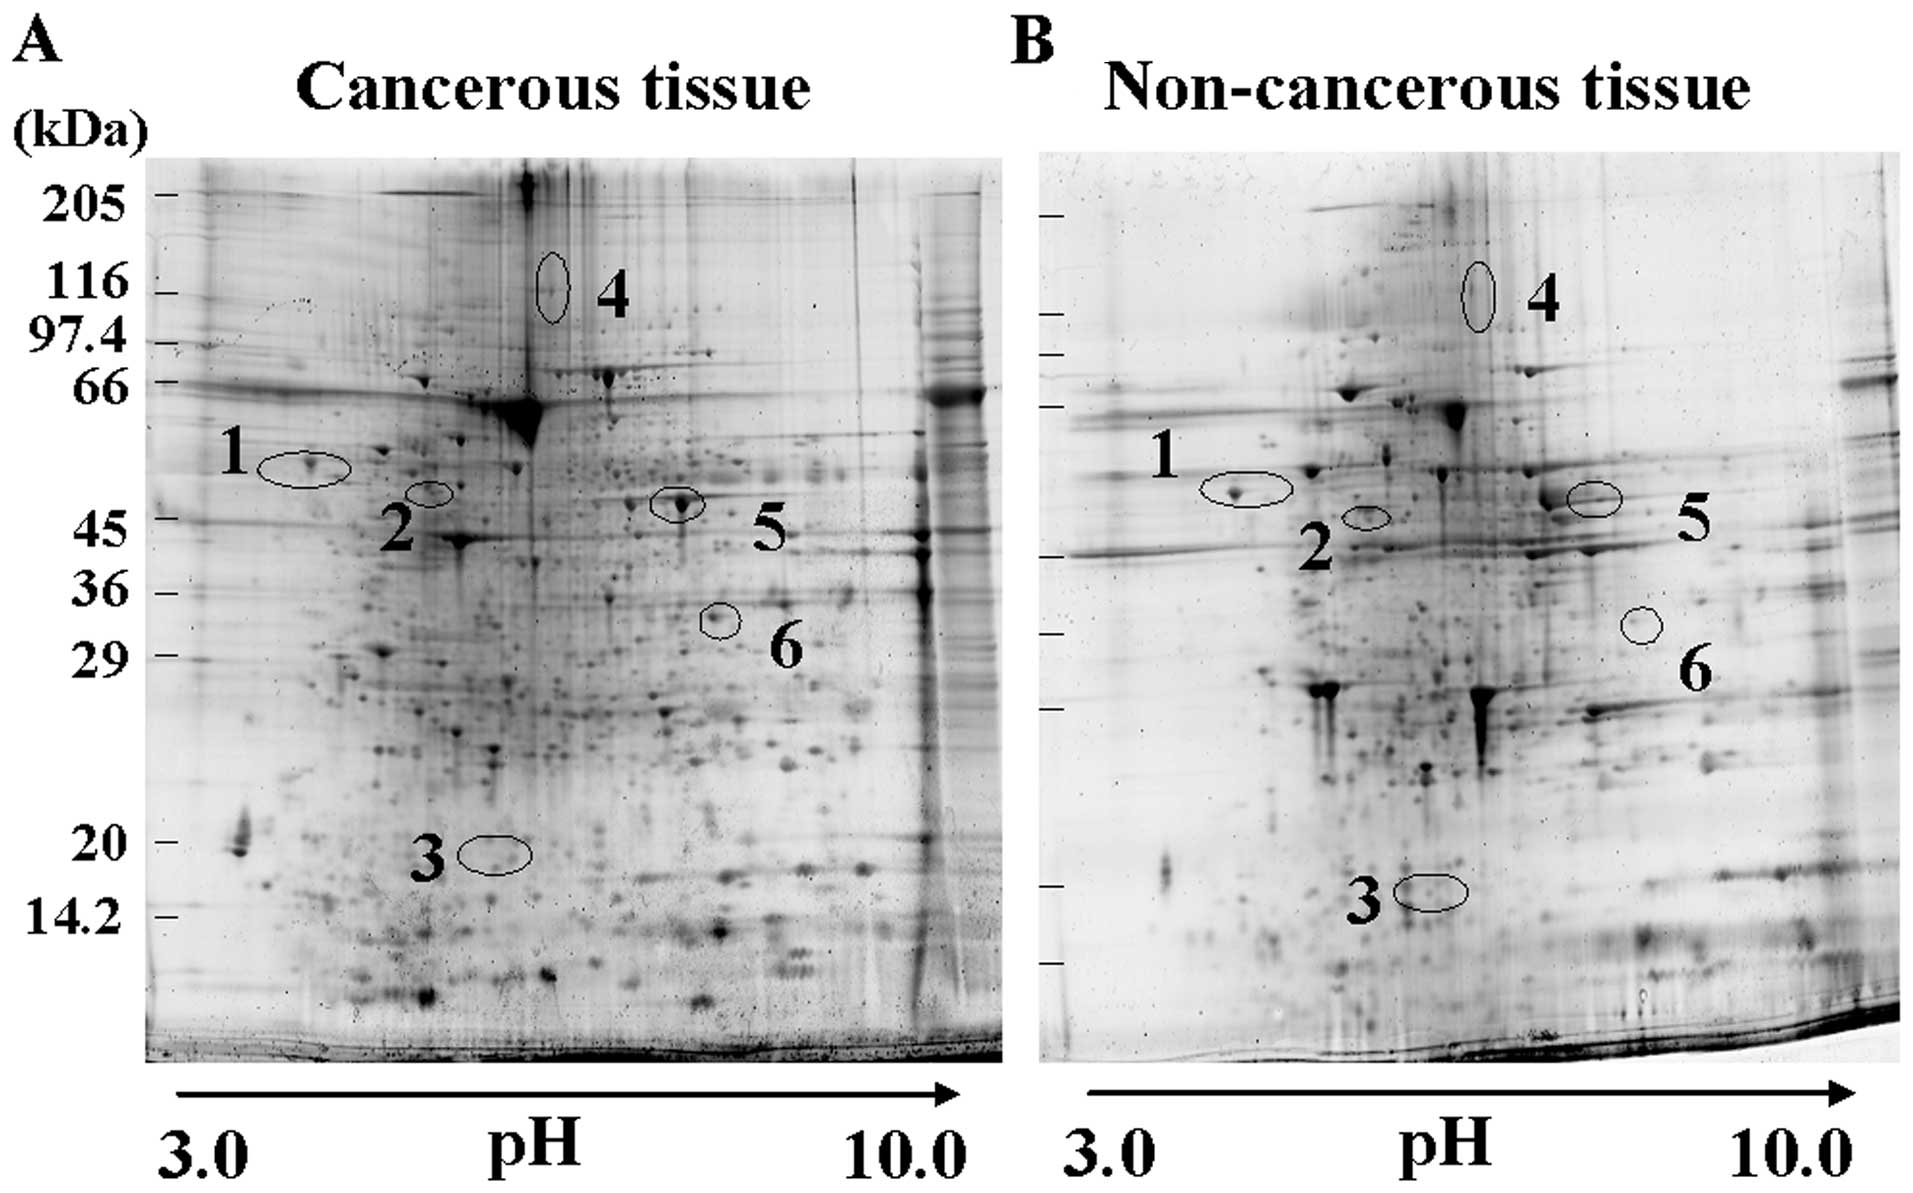
2-DE gels were treated with a fluorescent gel stain,
and then differences in the spot intensities between the tissues
from pancreatic cancer and non-cancerous were analyzed and
quantified by using the Progenesis SameSpots software. The results
are summarized in Table II. At
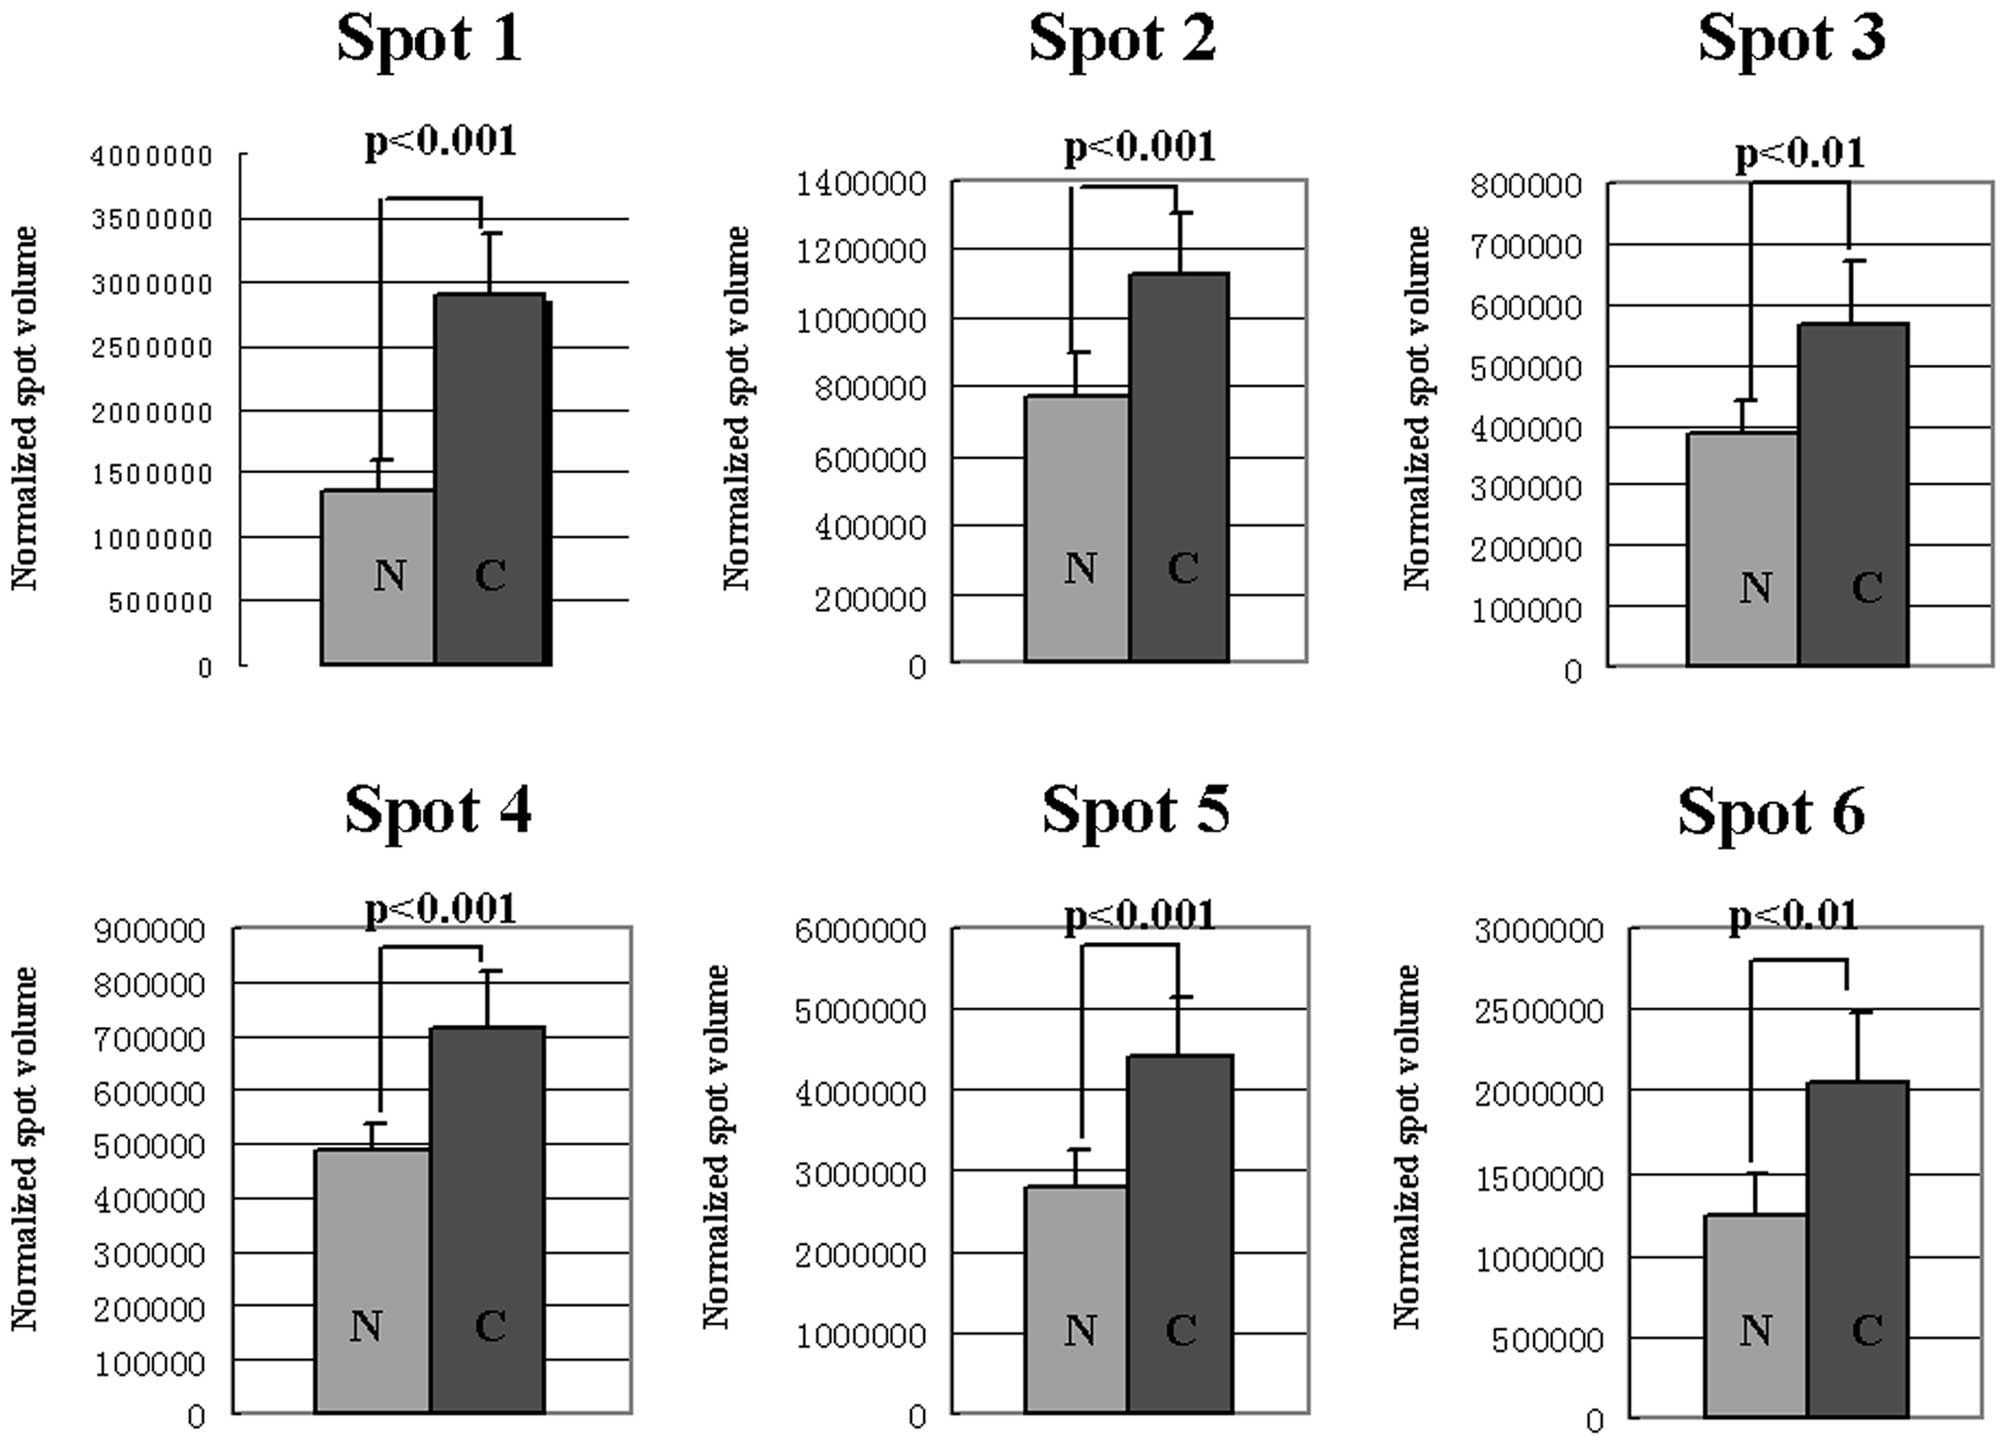
least 260 protein spots were matched on each 2-DE gel. Six
upregulated spots (spots 1–6) were displayed on 2-DE gel with
cancerous tissues at >1.5-fold higher intensity (Fig. 1). The protein expression levels were
elevated significantly (P<0.05) in cancerous tissues when
compared to paired non-cancerous tissues (Fig. 2).
| Table IIUpregulated proteins in pancreatic
cancerous tissues. |
Table II
Upregulated proteins in pancreatic
cancerous tissues.
| Spot | Accession
no.a | pIb | Mr (Da)b | Spot intensity
ratio | Frequency | Protein |
|---|
| 1 | P27797 | 4.29 | 48141.8 | 2.10 | 9/10 | Calreticulin |
| 2 | P48637 | 5.67 | 52385.1 | 1.50 | 7/10 | Glutathione
synthetase |
| 3 | P16949 | 5.76 | 17302.6 | 1.50 | 5/10 | Stathmin |
| 4 | P18206 | 5.50 | 123800.0 | 1.50 | 8/10 | Vinculin |
| 5 | P06733 | 7.01 | 47169.2 | 1.60 | 9/10 | α-enolase |
| 6 | P04406 | 8.57 | 6053.4 | 1.70 | 7/10 | Glyceraldehyde
3-phosphate dehydrogenase |
Identification of proteins by
LC-MS/MS
The samples were digested with trypsin and then
analyzed by using LC-MS/MS system, which identified the six
upregulated protein spots as calreticulin (spot 1), glutathione
synthetase (spot 2), stathmin (spot 3), vinculin (spot 4),
α-enolase (spot 5) and glyceraldehyde-3-phosphate dehydrogenase
(spot 6). The spot numbers are the same as those in Fig. 1. MS/MS data of these proteins are
summarized in Table II.
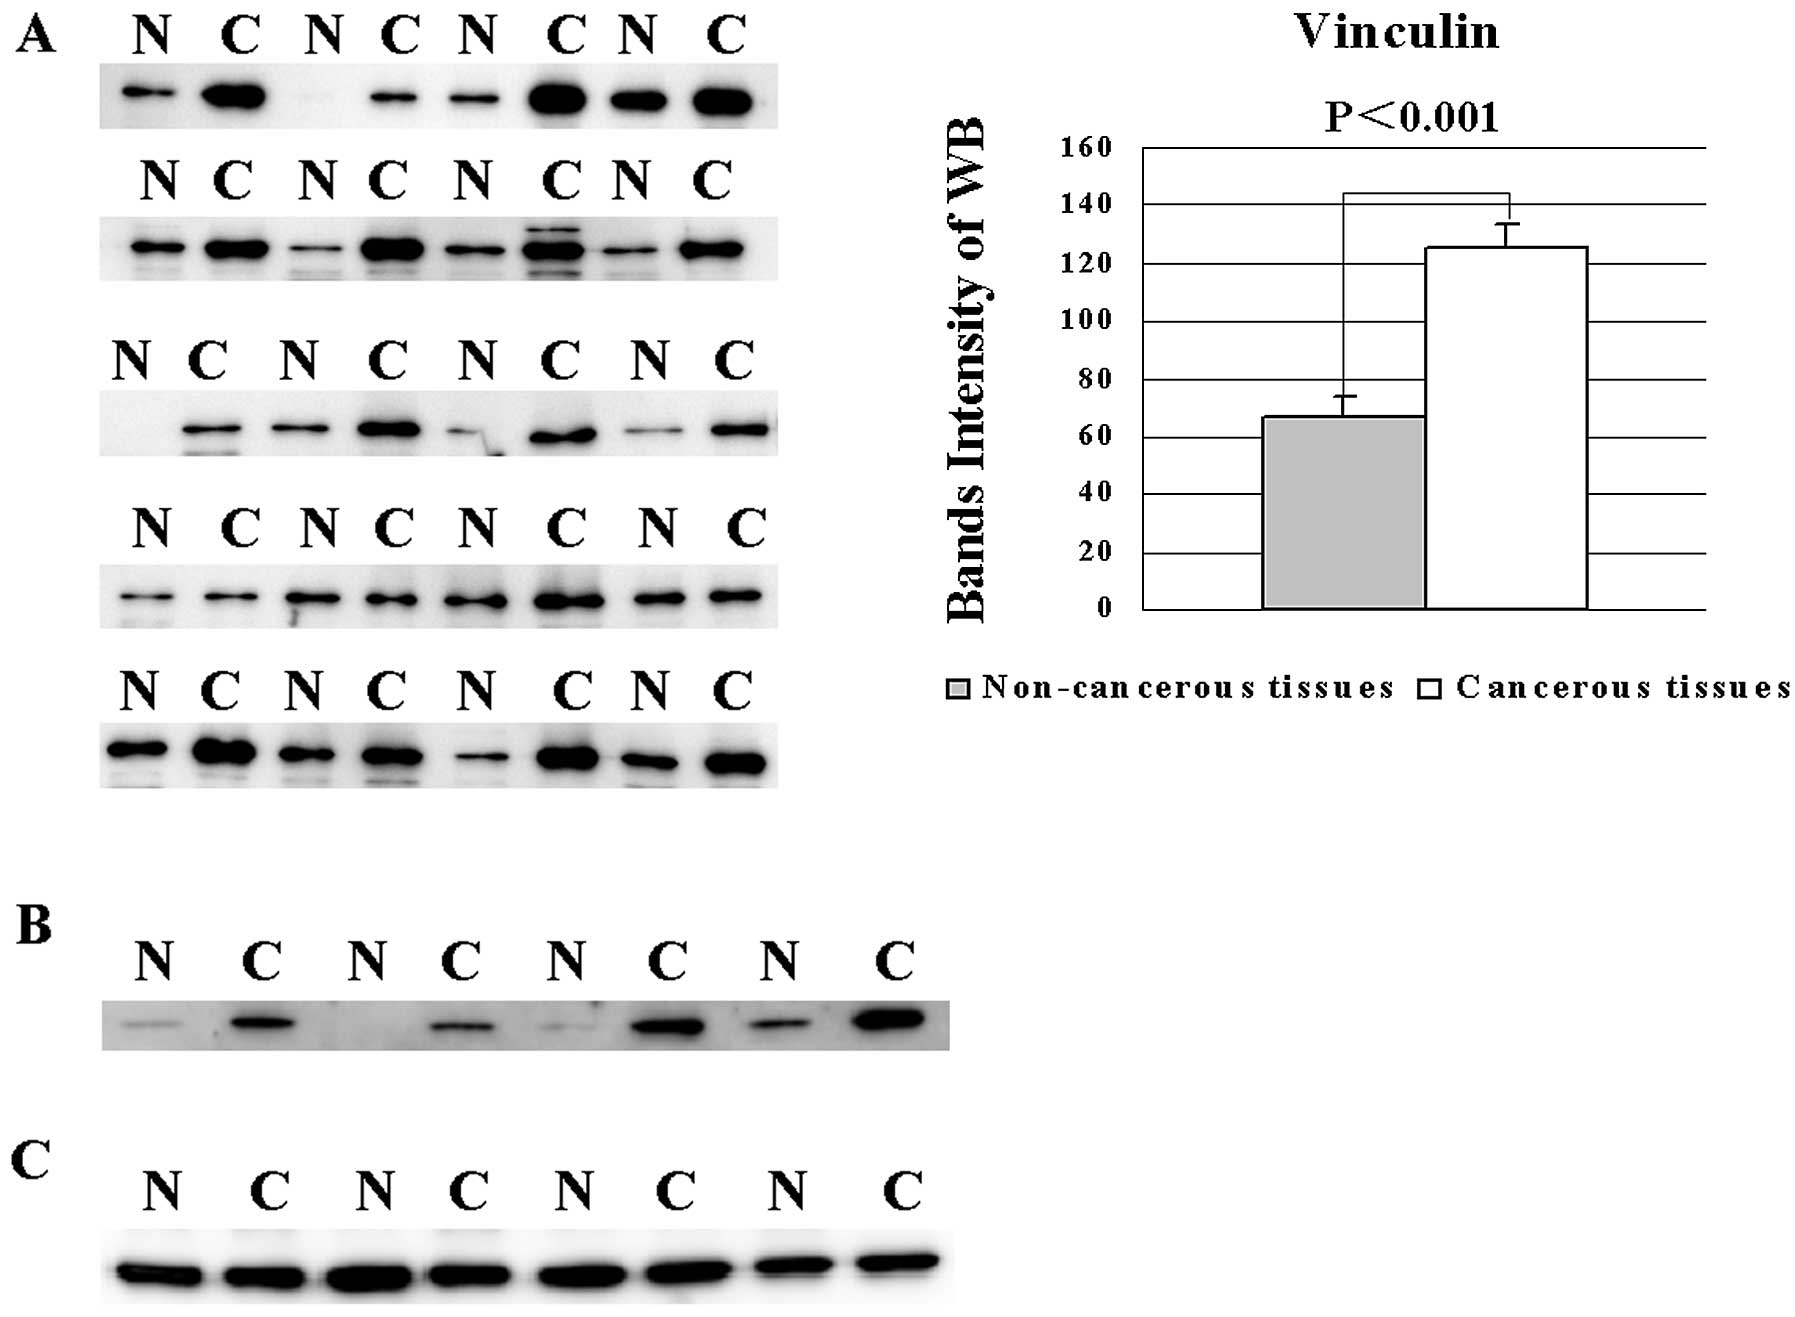
Western blot analysis of vinculin and
α-enolase
There are still no reports regarding overexpression
of vinculin in PC and its importance for cell adhesion and
migration (12,13). Twenty pairs of pancreatic cancerous
and non-cancerous tissues were analyzed by western blotting with
anti-vinculin antibody, and the different intensities of the bands
between cancerous and non-cancerous tissues were analyzed by the
Student’s t-test (Fig. 3A). The
mean intensities of the bands of cancerous and non-cancerous tissue
samples were 125.2 and 66.4, respectively (Fig. 3A). Four pairs of cancerous and
non-cancerous tissues were used for western blotting, to
demonstrate the upregulation of α-enolase (14) as a positive control in cancerous
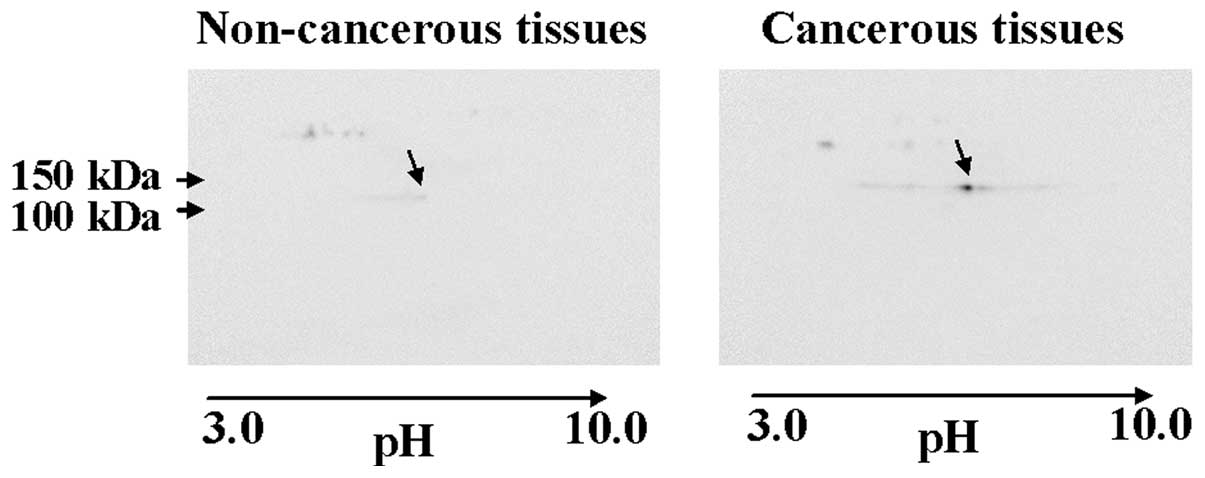
tissues, compared to non-cancerous tissues (Fig. 3B). The appearance of vinculin on the
2-DE gels was located by 2-D western blotting (Fig. 4).
Discussion
We identified six upregulated proteins,
calreticulin, glutathione synthetase, stathmin, vinculin, α-enolase
and glyceraldehyde-3-phosphate dehydrogenase, in pancreatic
cancerous tissues, compared to non-cancerous tissues. In this
study, we reported only on those increased in cancerous tissues
because many of the decreased proteins may have been replaced by
stromal cells. To the best of our knowledge, this is the first
report suggesting that vinculin is a candidate biomarker of PC.
Vinculin is a highly conserved intracellular protein
(~123.8 kDa) with an important role in the regulation of cell
adhesion and migration (12,13).
Bakolitsa et al have explained how vinculin regulates cell
adhesion by their detailed protein structural analysis (15). Highly metastatic cells have been
reported to lack vinculin expression (16,17).
Vinculin inhibits cell metastasis when transfected back into
vinculin-null cells (17). Evidence
reveals that apoptosis is related to cell motility (18,19),
and that vinculin regulates cell apoptosis and motility via
controlling the ERK pathway (18).
Paradoxically, our study demonstrated that vinculin,
which usually behaves as a potent inhibitor to the survival and
motility of cells (16–18), was significantly overexpressed in
pancreatic cancerous tissues. Our findings indicate that vinculin
could be a useful biomarker of PC for its high specificity.
Vinculin is well characterized by its intracellular connecting
component within adhesion complexes (16), but its functions remain unclear. A
new report suggests that vinculin is a main driver gene of the
10q22 amplification in 10q22-amplified prostate carcinomas and that
overexpression of vinculin may play an enhancing role in tumor cell
proliferation during prostate cancer progression (20). This may be explained by the
alternative splicing of vinculin gene, resulting in the alteration
of the vinculin function during prostate carcinogenesis (21). Further studies are required to
clarify whether vinculin overexpression contributes to PC
progression by enhancing tumor cell proliferation, and to elucidate
vinculin’s action in PC. Additional studies must be conducted in
order to identify post-transcriptional modifications of vinculin in
PC. Our data sheds light on a new facet of vinculin; its function
in PC progression.
A previous report demonstrated that vinculin is
related to tumor-suppressing properties (22). However, our findings revealed a
different property of vinculin in PC and suggest that vinculin may
play a significant role in the diagnosis or prognosis of PC.
Acknowledgements
We thank Ms. Yanome for proofreading the manuscript.
This study was supported in part by a Grant-in-Aid from the
Ministry of Health, Labor and Welfare of Japan (no. H20-Bio-005 to
K.N.).
Abbreviations:
|
PC
|
pancreatic cancer
|
|
2-DE
|
two-dimensional gel
electrophoresis
|
|
LC-MS/MS
|
liquid chromatography-tandem mass
spectrometry
|
References
|
1
|
Jemal A, Siegel R, Ward E, Hao Y, Xu J and
Thun MJ: Cancer statistics, 2009. CA Cancer J Clin. 59:225–249.
2009. View Article : Google Scholar
|
|
2
|
Kuramitsu Y, Miyamoto H, Tanaka T, Zhang
X, Fujimoto M, Ueda K, Tanaka T, Hamano K and Nakamura K: Proteomic
differential display analysis identified upregulated astrocytic
phosphoprotein PEA-15 in human malignant pleural mesothelioma cell
lines. Proteomics. 9:5078–5089. 2009. View Article : Google Scholar
|
|
3
|
Luk JM, Lam CT, Siu AF, Lam BY, Ng IO, Hu
MY, Che CM and Fan ST: Proteomic profiling of hepatocellular
carcinoma in Chinese cohort reveals heat-shock proteins (Hsp27,
Hsp70, GRP78) up-regulation and their associated prognostic values.
Proteomics. 6:1049–1057. 2006. View Article : Google Scholar
|
|
4
|
Roth U, Razawi H, Hommer J, Engelmann K,
Schwientek T, Müller S, Baldus SE, Patsos G, Corfield AP, Paraskeva
C and Hanisch FG: Differential expression proteomics of human
colorectal cancer based on a syngeneic cellular model for the
progression of adenoma to carcinoma. Proteomics. 10:194–202. 2010.
View Article : Google Scholar : PubMed/NCBI
|
|
5
|
Kuramitsu Y, Harada T, Takashima M,
Yokoyama Y, Hidaka I, Iizuka N, Toda T, Fujimoto M, Zhang X,
Sakaida I, et al: Increased expression and phosphorylation of liver
glutamine synthetase in well-differentiated hepatocellular
carcinoma tissues from patients infected with hepatitis C virus.
Electrophoresis. 27:1651–1658. 2006. View Article : Google Scholar
|
|
6
|
Tanaka T, Kuramitsu Y, Fujimoto M, Naito
S, Oka M and Nakamura K: Downregulation of two isoforms of
ubiquitin carboxyl-terminal hydrolase isozyme L1 correlates with
high metastatic potentials of human SN12C renal cell carcinoma cell
clones. Electrophoresis. 29:2651–2659. 2008. View Article : Google Scholar : PubMed/NCBI
|
|
7
|
Kuramitsu Y, Hayashi E, Okada F, Tanaka T,
Zhang X, Ueyama Y and Nakamura K: Proteomic analysis for nuclear
proteins related to tumour malignant progression: a comparative
proteomic study between malignant progressive cells and regressive
cells. Anticancer Res. 30:2093–2099. 2010.
|
|
8
|
Kuramitsu Y, Baron B, Yoshino S, Zhang X,
Tanaka T, Yashiro M, Hirakawa K, Oka M and Nakamura K: Proteomic
differential display analysis shows up-regulation of 14–3–3 protein
sigma in human scirrhous-type gastric carcinoma cells. Anticancer
Res. 30:4459–4465. 2010.
|
|
9
|
Kuramitsu Y, Taba K, Ryozawa S, Yoshida K,
Zhang X, Tanaka T, Maehara S, Maehara Y, Sakaida I and Nakamura K:
Identification of up- and down-regulated proteins in
gemcitabine-resistant pancreatic cancer cells using two-dimensional
gel electrophoresis and mass spectrometry. Anticancer Res.
30:3367–3372. 2010.
|
|
10
|
Kuramitsu Y, Hayashi E, Okada F, Zhang X,
Tanaka T, Ueyama Y and Nakamura K: Staining with highly sensitive
Coomassie brilliant blue SeePico™ stain after Flamingo™ fluorescent
gel stain is useful for cancer proteomic analysis by means of
two-dimensional gel electrophoresis. Anticancer Res. 30:4001–4005.
2010.PubMed/NCBI
|
|
11
|
Mori-Iwamoto S, Kuramitsu Y, Ryozawa S,
Mikuria K, Fujimoto M, Maehara S, Maehara Y, Okita K, Nakamura K
and Sakaida I: Proteomics finding heat shock protein 27 as a
biomarker for resistance of pancreatic cancer cells to gemcitabine.
Int J Oncol. 31:1345–1350. 2007.PubMed/NCBI
|
|
12
|
Volberg T, Geiger B, Kam Z, Pankov R,
Simcha I, Sabanay H, Coll JL, Adamson E and Ben-Ze’ev A: Focal
adhesion formation by F9 embryonal carcinoma cells after vinculin
gene disruption. J Cell Sci. 108:2253–2260. 1995.PubMed/NCBI
|
|
13
|
Xu W, Baribault H and Adamson ED: Vinculin
knockout results in heart and brain defects during embryonic
development. Development. 125:327–337. 1998.PubMed/NCBI
|
|
14
|
Mikuriya K, Kuramitsu Y, Ryozawa S,
Fujimoto M, Mori S, Oka M, Hamano K, Okita K, Sakaida I and
Nakamura K: Expression of glycolytic enzymes is increased in
pancreatic cancerous tissues as evidenced by proteomic profiling by
two-dimensional electrophoresis and liquid chromatography-mass
spectrometry/mass spectrometry. Int J Oncol. 30:849–855. 2007.
|
|
15
|
Bakolitsa C, Cohen DM, Bankston LA, Bobkov
AA, Cadwell GW, Jennings L, Critchley DR, Craig SW and Liddington
RC: Structural basis for vinculin activation at sites of cell
adhesion. Nature. 430:583–586. 2004. View Article : Google Scholar : PubMed/NCBI
|
|
16
|
Rüdiger M: Vinculin and alpha-catenin:
shared and unique functions in adherens junctions. Bioessays.
20:733–740. 1998.PubMed/NCBI
|
|
17
|
Rodríguez Fernández JL, Geiger B, Salomon
D, Sabanay I, Zöller M and Ben-Ze’ev A: Suppression of
tumorigenicity in transformed cells after transfection with
vinculin cDNA. J Cell Biol. 119:427–438. 1992.PubMed/NCBI
|
|
18
|
Subauste MC, Pertz O, Adamson ED, Turner
CE, Junger S and Hahn KM: Vinculin modulation of paxillin-FAK
interactions regulates ERK to control survival and motility. J Cell
Biol. 165:371–381. 2004. View Article : Google Scholar : PubMed/NCBI
|
|
19
|
Frisch SM and Francis H: Disruption of
epithelial cell-matrix interactions induces apoptosis. J Cell Biol.
124:619–626. 1994. View Article : Google Scholar : PubMed/NCBI
|
|
20
|
Ruiz C, Holz DR, Oeggerli M, Schneider S,
Gonzales IM, Kiefer JM, Zellweger T, Bachmann A, Koivisto PA, Helin
HJ, et al: Amplification and overexpression of vinculin are
associated with increased tumour cell proliferation and progression
in advanced prostate cancer. J Pathol. 223:543–552. 2011.
View Article : Google Scholar : PubMed/NCBI
|
|
21
|
Thorsen K, Sørensen KD, Brems-Eskildsen
AS, Modin C, Gaustadnes M, Hein AM, Kruhøffer M, Laurberg S, Borre
M, Wang K, et al: Alternative splicing in colon, bladder, and
prostate cancer identified by exon array analysis. Mol Cell
Proteomics. 7:1214–1224. 2008. View Article : Google Scholar : PubMed/NCBI
|
|
22
|
Ziegler WH, Liddington RC and Critchley
DR: The structure and regulation of vinculin. Trends Cell Biol.
16:453–460. 2006. View Article : Google Scholar : PubMed/NCBI
|