Introduction
Pancreatic ductal adenocarcinoma (PDAC) has one of
the poorest prognoses of all cancer diseases. For >90% of all
diagnosed cases, PDAC ends lethally within the first 6 months.
Accordingly, the incidence and mortality of PDAC are almost
identical: according to the American Community Survey, there is an
average of 10/100,000 new cases/year and PDAC is the fourth leading
cause of cancer-related mortality in the Western world (1). Tumor aggressiveness and lack of early
symptoms are causal factors for the observation that ca. 80% of all
patients with PDAC have distant metastases at time of diagnosis,
which renders the tumor inoperable (2). Furthermore, most patients, who undergo
tumor resection, have formed already submicroscopic distant
metastases, which become manifest only in the further course of the
disease (3,4).
Metastasis is a multistep process that is closely
associated with cancer progression. Genetic alterations are crucial
for dissemination, migration and invasion of cancer cells, as well
as for colonization of a distant organ. Several PDAC-related genes
have been identified and characterized as oncogenes or tumor
suppressor genes. Despite the better understanding of pancreatic
cancer development, the treatment and prognosis of pancreatic
cancer have not been substantially improved in the past 30 years.
The identification of undiscovered genes as potential tumor markers
or drug targets is still one of the most promising ways to increase
early diagnosis for this disease and to identify potential novel
therapeutic targets. The DNA microarray technology facilitates the
simultaneous expression analysis of thousands of genes in
relatively short time. However, global gene expression analysis
often results in a huge number of genes, for which a causal
relationship has to be demonstrated subsequently (5–8). To
facilitate this task, we wanted to relate the gene signatures of a
panel of PDAC cells to a prominent metastatic property to obtain a
relatively short list of genes, which are significantly related to
the property chosen.
The impact of new targets can be assessed by suited
preclinical models, which simulate tumor formation and metastasis
at different stages. For mimicking PDAC, a variety of models has
been established. These include xenograft models of human
pancreatic cancer cell lines such as MIA PaCa-2, CFPAC-1, Panc-1,
Capan-1, Capan-2, BxPC-3, SW1990, AsPC-1, Colo 357 and others
(9–6). In addition, rodent cell lines have been used, such as the
AS (invasive, but not metastatic) and ASML (highly metastatic in
vivo, but not invasive) cells, which were derived from the
BSp-73 rat pancreatic cancer cell line (9,17).
Furthermore, genetic models have become available such as the
Mist1-KrasG12D knock-in mouse, which develop mixed differentiation
metastatic exocrine pancreatic carcinoma and hepatocellular
carcinoma (18).
Orthotopic transplanted models have attracted
interest recently. These models are characterized by tumor growth
in the organ, from which they have been derived or into which they
typically form metastases (12,19–21).
Because orthotopic pancreatic cancer models have
rarely been used despite their potential advantages, we wanted to
fill into that gap and establish models, which had to meet the
following criteria: i) the tumor growth should be easily
recordable; ii) the model should mimic liver metastasis, which is
the most often affected organ by PDAC; and iii) by using more than
one model, the variety of PDAC lesions should be better reflected.
Therefore, we transfected human and rat pancreatic cancer cells
with appropriate marker genes and selected those, which grew in the
rat liver after intra-portal inoculation.
Materials and methods
Cell culture
All pancreatic cancer cell lines used for
transplantation into animals are shown in Table I. The cells were maintained under
standard culture conditions at 37°C in humidified air with 5%
CO2. For keeping the cells in logarithmic growth, they
were propagated 1–3 times per week depending of their growth
rate.
 | Table IOverview of pancreatic cancer cell
lines. |
Table I
Overview of pancreatic cancer cell
lines.
| Cell
line/tissue | Origin | Source | Growth
conditionse |
|---|
| A818-4a/ascites | Ascites PDAC | J. Kleeff, Clinic
for Surgery, University of Heidelberg | RPMI-1640 + 10%
FBS |
| Asb,c | Invasive but not
metastatic subclone of the rat pancreatic adenocarcinoma cell line
BSp 73 established in 1983 | M. Zöller, DKFZ,
Heidelberg | RPMI-1640 + 10%
FBS |
| ASMLb,d | In vivo
strong metastatic but hardly invasive subclone of BSp 73 | M. Zöller, DKFZ,
Heidelberg | RPMI-1640 + 10%
FBS |
| AsPC-1a/ascites | Established from
nude mouse xenografts initiated with cells from the PDAC ascites of
a 62-year-old female Caucasian | ATCC®
Number: CRL-1682™ | RPMI-1640 + 10%
FBS |
| BxPC-3a/prim. PDAC | Established from a
primary PDAC of a 61-year-old female patient | ATCC®
Number: CRL-1687™ | RPMI-1640 + 10%
FBS |
| Capan-1a/liver metastasis | Established in 1974
from the PDAC liver metastasis of a 40-year-old male Caucasian | ATCC®
Number: HTB-79™ | Iscove's modified
Dulbecco's medium + 20% FBS |
| CFPAC-1a/liver metastasis | Established from
the PDAC liver metastasis of a 26-year-old male Caucasian with
cystic fibrosis | ATCC®
Number: CRL-1918™ | Iscove's modified
Dulbecco's medium + 10% FBS |
| Colo-357a/lymph node metastasis | Established from a
PDAC lymph node metastasis of a 77-year-old female | J. Kleeff, Clinic
for Surgery, University of Heidelberg | RPMI-1640 + 10%
FBS |
| DAN-Ga/prim. PDAC | Established in 1985
from a primary PDAC | DSMZ no.: ACC
249 | RPMI-1640 + 10%
FBS |
| MIA PaCa-2a/prim. PDAC | Established from an
undifferentiated PDAC of a 65-year-old male Caucasian | ATCC®
Number: CRL-1420 | Dulbecco's modified
Eagle's medium + 10% FBS + 2.5% horse serum |
| Panc-1a/prim. PDAC | Established from
the primary PDAC of a 56-year-old male Caucasian | ATCC®
Number: CRL-1469™ | Dulbecco's modified
Eagle's medium + 10% FBS |
| Panc-89a lymph node metastasis | Established from a
PDAC lymph node metastasis | J. Kleeff, Clinic
for Surgery, University of Heidelberg | RPMI-1640 + 10%
FBS |
| Patu 390a/prim. PDAC | Established from
primary PDAC | J. Kleeff, Clinic
for Surgery, University of Heidelberg | RPMI-1640 + 10%
FBS |
| S2-007a/liver metastasis | Subclone derived
from Suit-2 cells, established from PDAC liver metastasis | K. M. Debatin,
Medical Faculty, University of Ulm | McCoy's medium +
10% FBS |
| S2-013a/liver metastasis | Subclone derived
from Suit-2 cells, established from PDAC liver metastasis | J. Kleeff, Clinic
for Surgery, University of Heidelberg | McCoy's medium +
10% FBS |
| SU86.86a/liver metastasis | Established from a
wedge biopsy of PDAC liver metastasis of a 57-year-old female
Caucasian | ATCC®
Number: CRL-1837™ | RPMI-1640 + 10%
FBS |
Proliferation assay
For determining their proliferation rates,
AsMLGFP-LUC, Suit2-007GFP-LUC and
Suit2-013GFP-LUC cells were seeded at densities of
1×10³, 2×10³, 4×10³,
8×10³, 16×103 cells/ml (100 μl medium/well)
into 96 well-plates (flat bottom, Becton-Dickinson, Heidelberg,
Germany) and grown for periods of 24, 48, 72 and 96 h. After these
periods, 10 μl MTT (3-[4.5-dimethylthiazol-2-yl]-2.5-diphenyl
tetrazolium bromide, Serva Electrophoresis GmbH, Heidelberg,
Germany) solution was added and following an incubation period of 3
h at 37°C, the medium was discarded and the cells were lysed by
adding 200 μl/well acidified 2-propanol (0.04 N HCl). After all
formazan crystals had been carefully dissolved, the absorption was
measured at 540 nm (reference filter of 690 nm) in an automated
microtiter plate spectrophotometer (Anthos Mikrosysteme GmbH,
Krefeld, Germany). The absorption of exposed cells was given in
percent of untreated control cells.
Construction of plasmid and
transfection
For obtaining a plasmid containing both, green
fluorescent protein (GFP) and luciferase genes, the plasmid
pBudCE4.1 was opened with the enzyme BamHI, then blunted and
restricted with HindIII (fragment I). In addition, a plasmid
containing the luciferase gene was restricted by EcoRI,
blunted and restricted again with HindIII (fragment II).
Fragments I and II were ligated to obtain a plasmid, which contains
the eGFP and luciferase genes (pBudCE4.1GFP-LUC).
Subsequently the cell lines ASML, Suit2-013 and S2-007 were
transfected with this plasmid.
Transfection with lipofectamine
The ASML, the Suit2-013 and the S2-007 cells were
transfected with the plasmid pBudCE4.1GFP-LUC by using
Lipofectamine™ Reagent (Invitrogen, Karlsruhe, Germany) as
described below. The cells were grown overnight in culture flasks
(25 cm2, TPP, Trasadingen, Switzerland) to reach 85–90%
confluence for transfection on the following day. Plasmid DNA (4 μg
in 250 μl) and Lipofectamine (50 μl in 250 μl) were diluted in
Opti-MEM® (Invitrogen) serum-free medium. The mixtures
were incubated for 5 min at room temperature. The diluted DNA was
slowly added to the diluted Lipofectamine mix and incubated for 15
min at room temperature to facilitate the formation of
DNA-Lipofectamine (DL) complexes. Corresponding amounts (500
μl/flask) of the DL complexes were added to the cells and incubated
at 37°C in a CO2 incubator for 4 h. After this period,
50% of the medium was replaced by fresh culture medium and the
cells were further incubated at 37°C.
Transfection efficiency
After transfection, cells without the plasmid were
eliminated by adding the antibiotic zeocin (Invitrogen) to the
medium for 72–96 h. Thereafter, green fluorescing cells were
positively selected with a FACS-sorter (FACSVantage DiVa, BD
Biosciences, Heidelberg, Germany). Transfection efficiency was
determined as the number of cells expressing GFP per total number
of cells in a given microscopic field and by flow cytometry.
Animals
Male RNU and Wag/Rij rats were used for all in
vivo experiments. They were obtained from Charles River
(Sulzfeld, Germany) at an age of 5–7 weeks and a corresponding body
weight of 120–160 g. They were kept under specific pathogen free
(SPF) conditions in Macrolon-III-cages of a ventilated rack
(Ventirack, UNO Roestvaststaal B.V., Zevenaar, The Netherlands)
providing a 50-fold exchange of filtered air/h as well as positive
air pressure inside the cages. Constant room temperature (22±1°C),
air humidity (50±10%) and dark-light-rhythm (12 h) were maintained
throughout. The animals had free access to autoclaved water and
standard laboratory diet. An acclimatization period of 7 days was
adhered to before starting any experiments.
Tumor cell transplantation
Logarithmically growing AsMLGFP-LUC,
Suit2-013GFP-LUC and Suit2-007GFP-LUC cells
were trypsinized and suspended (4×10⁶ cells) in 0.25 ml
PBS (phosphate-buffered saline without calcium and magnesium ions)
and 0.15 ml Matrigel (extract of the Engelbreth-Holm-Swarm-mouse
tumor; Biomatrix EHS solution, Serva Electrophoresis GmbH). This
suspension was stored on ice until injection. For tumor cell
transplantation, the rats were anaesthetized with isoflurane at 1.5
Vol% together with 0.5 l/min oxygen and 1 l/min nitrous oxide.
After a median laparotomy, the caecum was
exteriorized onto a compress moistened with sterile physiological
saline and a mesocolic vein was isolated from mesenteric fat. Under
microscopic control the tumor cell suspension was injected into
this vessel with a 28-gauge needle.
Thereafter, the vessel was compressed with two
cotton swabs for a period of 1–2 min to prevent bleeding; the
caecum was moved back into the abdomen; the musculature was sutured
(4-0 vicryl, Ethicon GmbH, Norderstedt, Germany) and the skin
closed with metal clips.
Relaparotomy
During this study, all animals were subjected to
relaparotomy to monitor the tumor growth in comparison with the
bioluminescence imaging (see below). The period until relaparotomy
(1–2 weeks) depended on clinical signs of tumor growth as well as
on information from earlier passages.
In vivo imaging
Live animal bioluminescence imaging was performed
using the IVIS100 imaging system (Xenogen Corp., Alameda, CA, USA).
Prior to imaging, the animals were injected intraperitoneally with
the substrate D-Luciferin (Synchem Corp., Elk Grove Village, IL,
USA) at a dose of 10 mg/animal and anesthetized with
isoflurane/oxygen via the XGI-8 Anesthesia System (Xenogen Corp.),
and subsequently analyzed using the Living Image v2.5 software
provided by Xenogen Corp. To better identify the location of the
signals emitted when imaging live rats, the animals were sacrificed
and the liver was removed. Ex vivo imaging of the excised
liver was carried out immediately. All animal experiments were
performed in accord with the German animal protection law and on
the basis of a permit of the respective authority
(Regierungspräsidium Karlsruhe).
In vitro imaging
To determine the luciferase activity of
AsMLGFP-LUC, Suit2-007GFP-LUC and
Suit2-013GFP-LUC cells, they were plated into 96-well
black plates (Nunc Thermo Electron LED GmbH, Langenselbold,
Germany) at concentrations of 1×10⁶, 1×10⁵,
1×10⁴, 5×10³ and 1×10³ cells/well.
Light emission of these cells was monitored using the IVIS-100
imaging system (Xenogen Corp.). As few as 500 cells could be
detected in vitro, and yielded a bioluminescent signal
ranging from 1×10⁵ photons for 2.5×10³ cells
to 4×10⁶ photons for 1×10⁶ cells.
Animal passages
After the tumor had reached an estimated volume of 1
cm3, the animals were euthanized under anesthesia and
the liver was removed under sterile conditions. Tumor cells, which
had grown in the liver, were isolated and cultured under normal
conditions. After tumor cells had reached confluence, they were
used for further portal implantation into rats.
Proliferation rate
An in vitro growth curve was established to
determine the mean cell doubling time of the parental and
transfected tumor cell lines. The three cell lines showed no
difference in cell proliferation with doubling times of 12 h,
respectively.
RNA isolation and analysis
Total RNA from 13 PDAC cell lines was isolated using
the RNAeasy kit (Qiagen, Hilden, Germany) according to the
manufacturer's instructions. RNA was eluted in water. The quality
of total RNA was checked by gel analysis using the total RNA Nano
chip assay on an Agilent 2100 bioanalyzer (Agilent Technologies
GmbH, Berlin, Germany). Only samples with RNA index values >8.5
were selected for expression profiling. RNA concentrations were
determined using the NanoDrop spectrophotometer (NanoDrop
Technologies, Wilmington, DE).
Probe labeling and illumina sentrix
BeadChip array hybridization
Biotin-labeled cRNA samples for hybridization on
Illumina Human Sentrix-12 BeadChip arrays (Illumina, Inc.) were
prepared according to Illumina's recommended sample labeling
procedure based on the modified Eberwine protocol (22). In brief, 200 ng total RNA was used
for complementary DNA (cDNA) synthesis, followed by an
amplification/labeling step (in vitro transcription) to
synthesize biotin-labeled cRNA according to the
Illumina® Total Prep™ RNA Amplification kit (Life
Technologies). Biotin-16-UTP was purchased from Roche Applied
Science (Penzberg, Germany). The cRNA was column purified according
to the TotalPrep RNA Amplification kit, and eluted in 80 μl of
water. Quality of cRNA was controlled using the RNA Nano Chip Assay
on an Agilent 2100 bioanalyzer and spectrophotometrically
quantified (NanoDrop).
Hybridization was performed at 58°C, in GEX-HCB
buffer (Illumina Inc.) at a concentration of 100 ng cRNA/μl,
unsealed in a wet chamber for 20 h. Spike-in controls for low,
medium and highly abundant RNAs were added, as well as mismatch
control and biotinylation control oligonucleotides. Micro-arrays
were washed once in High-Temp Wash buffer (Illumina Inc.) at 55°C
and then twice in E1BC buffer (Illumina Inc.) at room temperature
for 5 min (and between washed with ethanol at room temperature).
After blocking for 5 min in 4 ml of 1% (wt/vol) Blocker Casein in
phosphate-buffered saline Hammarsten grade (Pierce Biotechnology,
Inc., Rockford, IL), array signals were developed by a 10-min
incubation in 2 ml of 1 μg/ml Cy3-streptavidin (Amersham
Biosciences, Buckinghamshire, UK) solution and 1% blocking
solution. After a final wash in E1BC, the arrays were dried and
scanned.
Scanning and data analysis
Microarray scanning was done using an iScan array
scanner. Data extraction was done for all beads individually, and
outliers were removed when >2.5 MAD (median absolute deviation).
All remaining data points were used for the calculation of the mean
average signal for a given probe, and standard deviation for each
probe was calculated.
Statistical methods
Quantile-normalized Illumina mRNA data were log2
transformed. Differentially expressed transcripts between cell
lines showing growth of tumor cells and those who do not were
identified using the empirical Bayes approach (23) based on moderated t-statistics as
implemented in the Bioconductor package limma (24). Prior to testing unspecific filtering
was applied, selecting transcripts with standard deviation
exceeding 0.15 for further analysis. All P-values were adjusted for
multiple testing using Benjamini-Hochberg correction to control the
false discovery rate. In addition to transcript-wise testing, Kyoto
Encyclopedia of Genes and Genomes (KEGG) pathway gene sets were
tested for regulation between both groups of cell lines using
Goeman's global test approach (25,26).
Pathway P-values were adjusted for multiple testing using
Benjamini-Hochberg correction. All P-values are two-sided. P-values
<0.05 were considered statistically significant. All analyses
were carried out using R (27).
Results
In vivo growth of pancreas carcinoma cell
lines
Altogether 16 pancreatic carcinoma cell lines were
investigated for their potential to form liver metastases (Table II).
| Table IIRat organ (compartment) probed for
tumour growth (passage 1). |
Table II
Rat organ (compartment) probed for
tumour growth (passage 1).
| No. | Cell line | Livera,b | Pancreasa | Peritoneal
cavitya |
|---|
| 1 | A818-4 | 4-0 | 4-0 | |
| 2 | AS | 4-4 | 0 | 0 |
| 3 | ASMLg,h | >10->10 | 0 | 0 |
| 4 | AsPC-1d | 6-3c | 4-4c | 4-4 |
| 5 | BxPC-3e | 6-2c | 2-2c | 4-2 |
| 6 | Capan-1 | 4-0 | 2-0 | 0 |
| 7 | CFPAC-1 | 6-2c | 2-2 | |
| 8 | Colo-357f | 6-2c | 2-2c | 2-2 |
| 9 | DAN-G | 4-0 | 2-0 | 0 |
| 10 | Mia PaCa-2 | 4-0 | 2-0 | 0 |
| 11 | Panc-1 | 4-0 | 2-0 | 0 |
| 12 | Panc-89e | 4-1c | 2-0 | 0 |
| 13 | Patu 390 | 4-0 | 2-0 | 0 |
| 14 |
S2-007g,h | >10->10 | 0 | 0 |
| 15 |
S2-013g,h | >10;~80% | 2-2 | 2-2 |
| 16 | Su86.86 | 4-0 | 0 | 0 |
Our aim was to identify the most metastatic cell
lines. Besides transplantation of tumor cells under the liver
capsule or into a mesocolic vein to initiate tumor growth in the
liver, alternative routes were tested as well. These included
intra-peritoneal, intrasplenic and intra-pancreatic injection of
cells.
We defined a total take rate of ≥50% of injected
rats and stable tumor growth as precondition for further
development. Under these conditions, four cell lines qualified,
which were ASML, AS, Suit2-013 and Suit2-007 (Table II).
The remaining cell lines showed either a moderate to
low take rate, followed by regression of tumor nodules (AsPC-1,
BxPC-3, Colo-357 and Panc-89; Table
II and Fig. 1) or did not grow
in the liver at all (Capan-1, DAN-G, MIA PaCa-2, Panc-1, Patu 390,
SU86.86 and T3M4; Table II).
For further characterization of their potential, the
cells with insufficient take rate (<50%) were implanted into the
rat pancreas with the cell line Suit2-013 as positive control.
Interestingly, only the cell lines, which showed some growth in the
liver, grew also in the rat pancreas. Finally, these cell lines
showed also tumor spread after implantation into the peritoneal
cavity, except for Panc-89 cells.
ASML model
ASML cells are derived from a pancreas
adenocarcinoma growing in BDX rats. Since this strain is not
commercially available, another strain of immuno-competent rats
(Wag/Rij) was used, instead. Wag/Rij rats implanted with
ASMLGFP-LUC cells showed clearly visible tumor growth
after the first week, but complete remission of all tumor masses
after two weeks. Therefore, nude rats (RNU-Strain) were used for
all subsequent experiments. In immuno-compromised rats,
2×10⁷ ASMLGFP-LUC cells caused steady tumor
growth in passages 1–4. Thereafter the tumor cell number was slowly
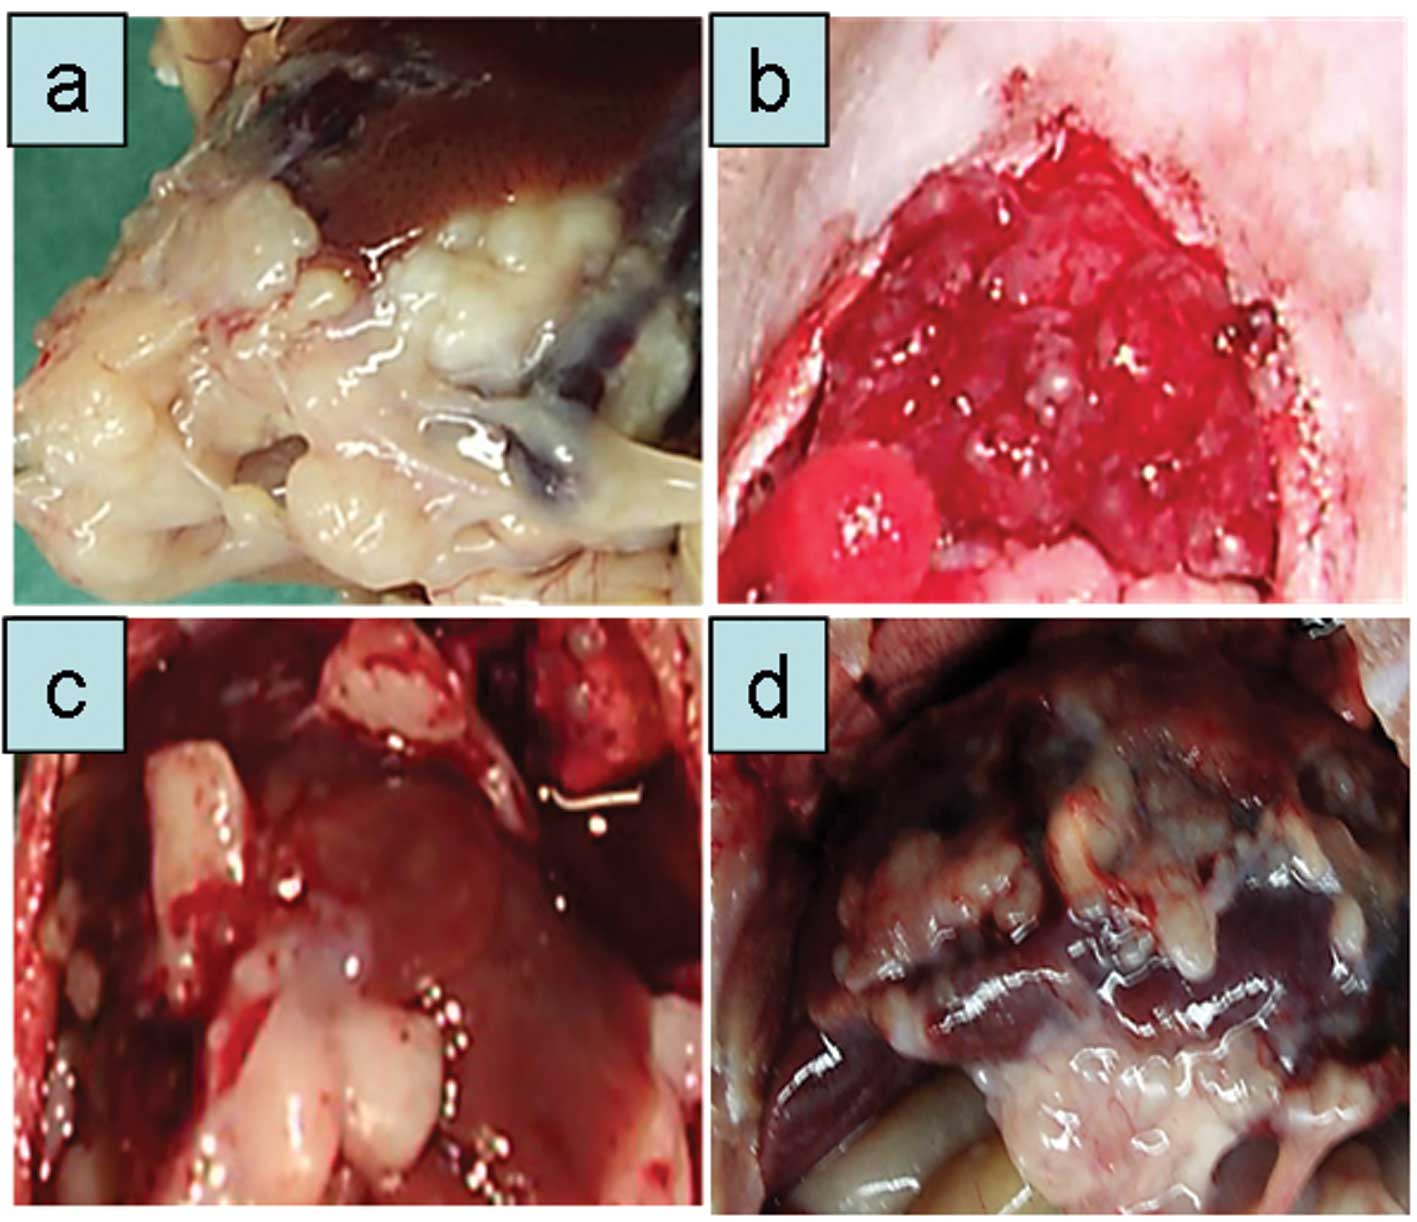
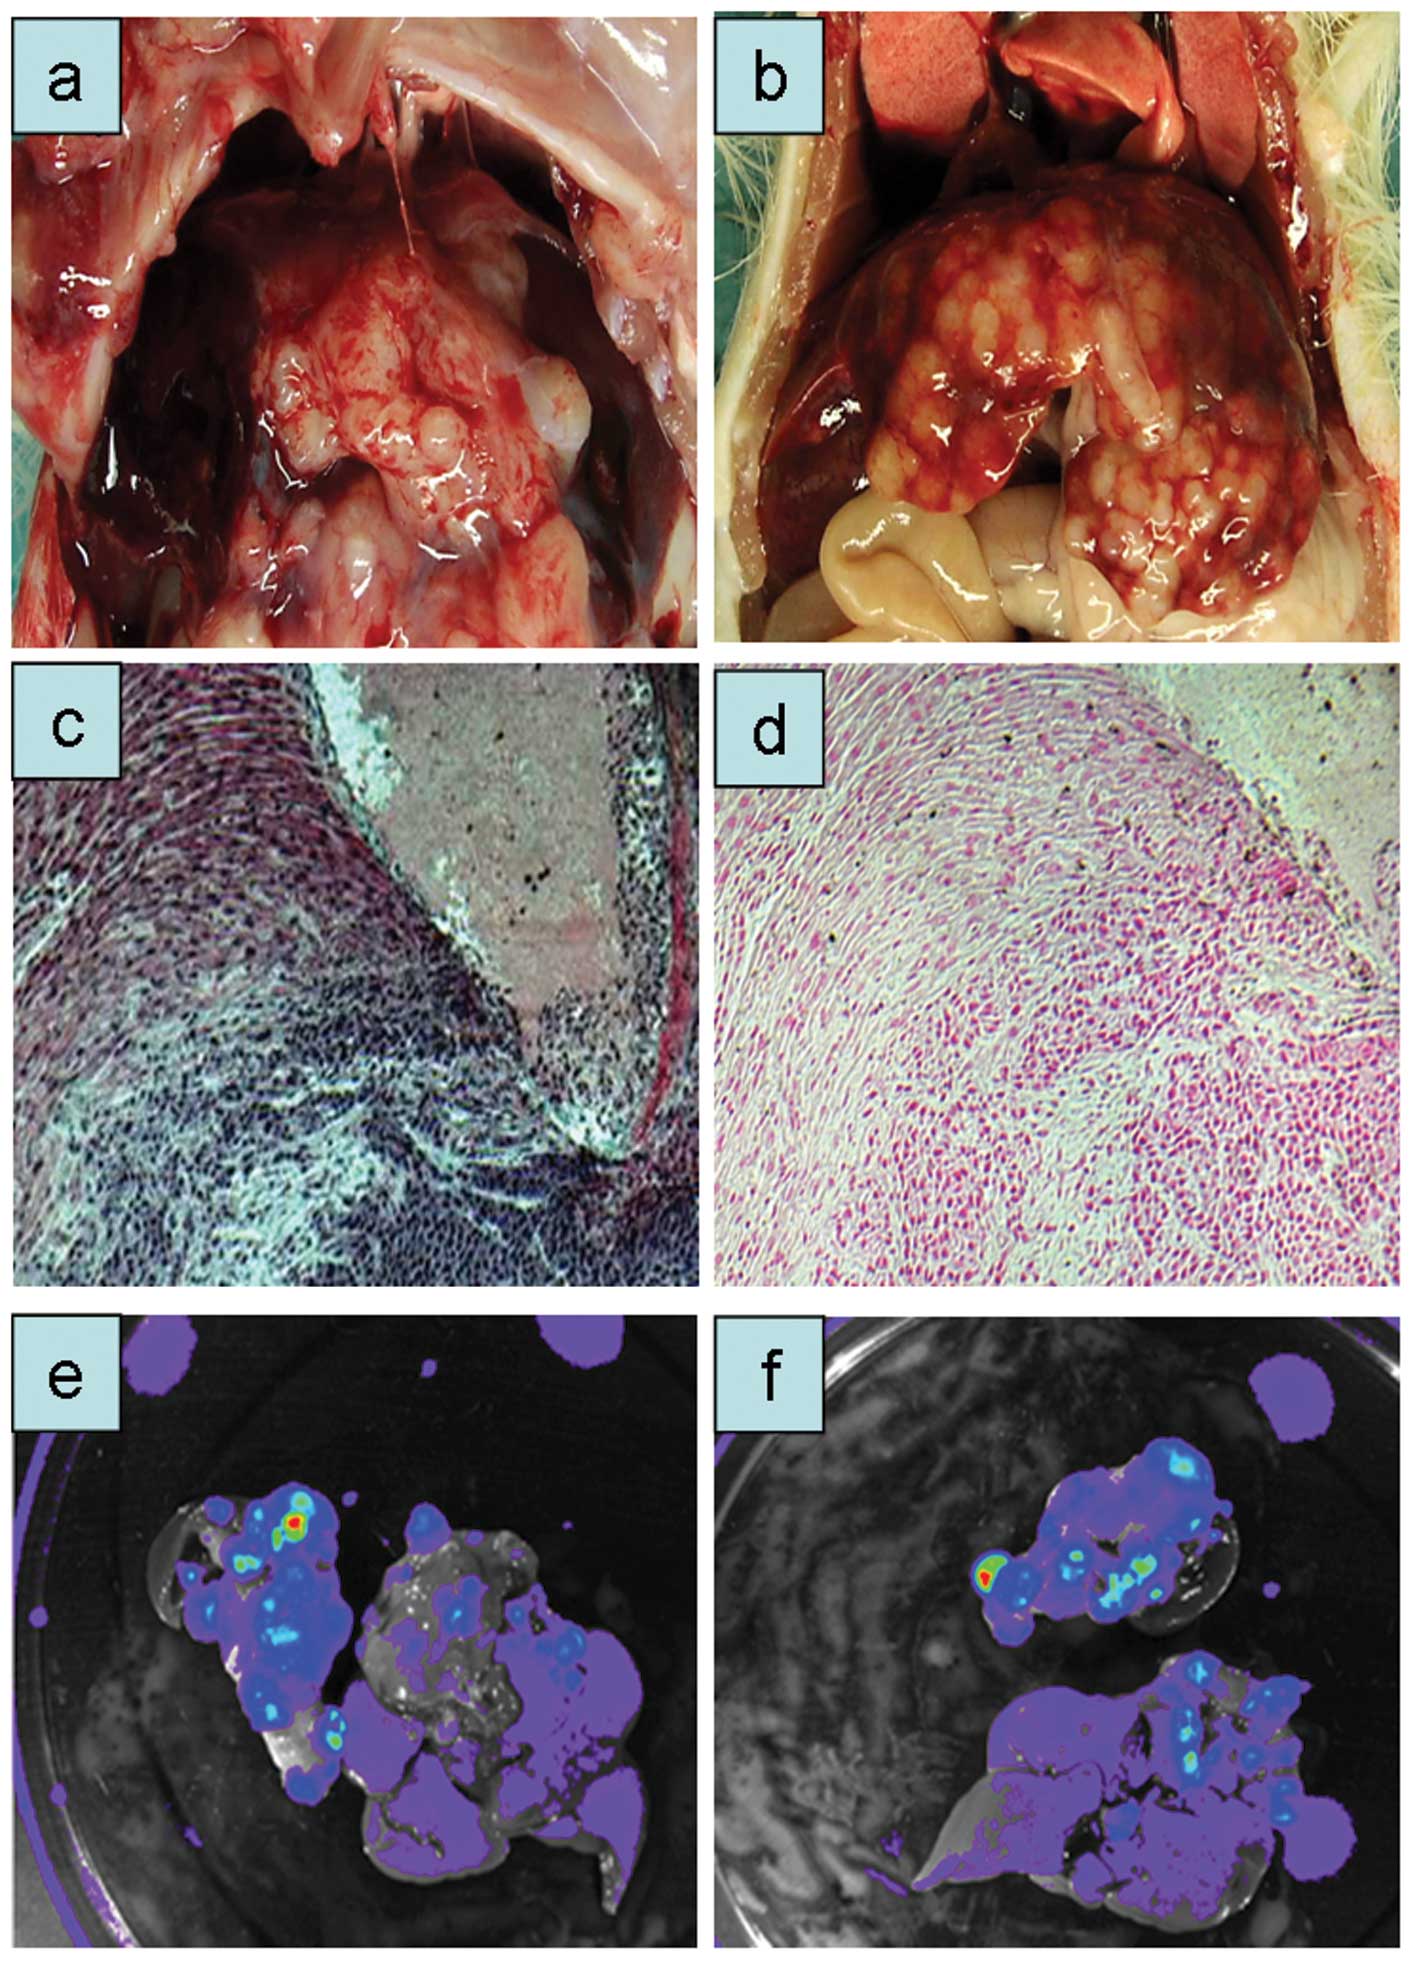
reduced to 5×10⁶ cells in the sixth passage (Fig. 2b-d). With increasing number of tumor
passages a distinct macroscopic picture emerged (Fig. 2b-d). Tumor nodules appeared at the
liver lobe edges, showing a pearl-necklace like growth (Fig. 2d). The corresponding histological
pictures are shown in Fig. 2e and
f. The carcinoma showed nodular growth with large amounts of
fibrous connective tissue. Tumor nodules were clearly separated
from the normal liver tissue.
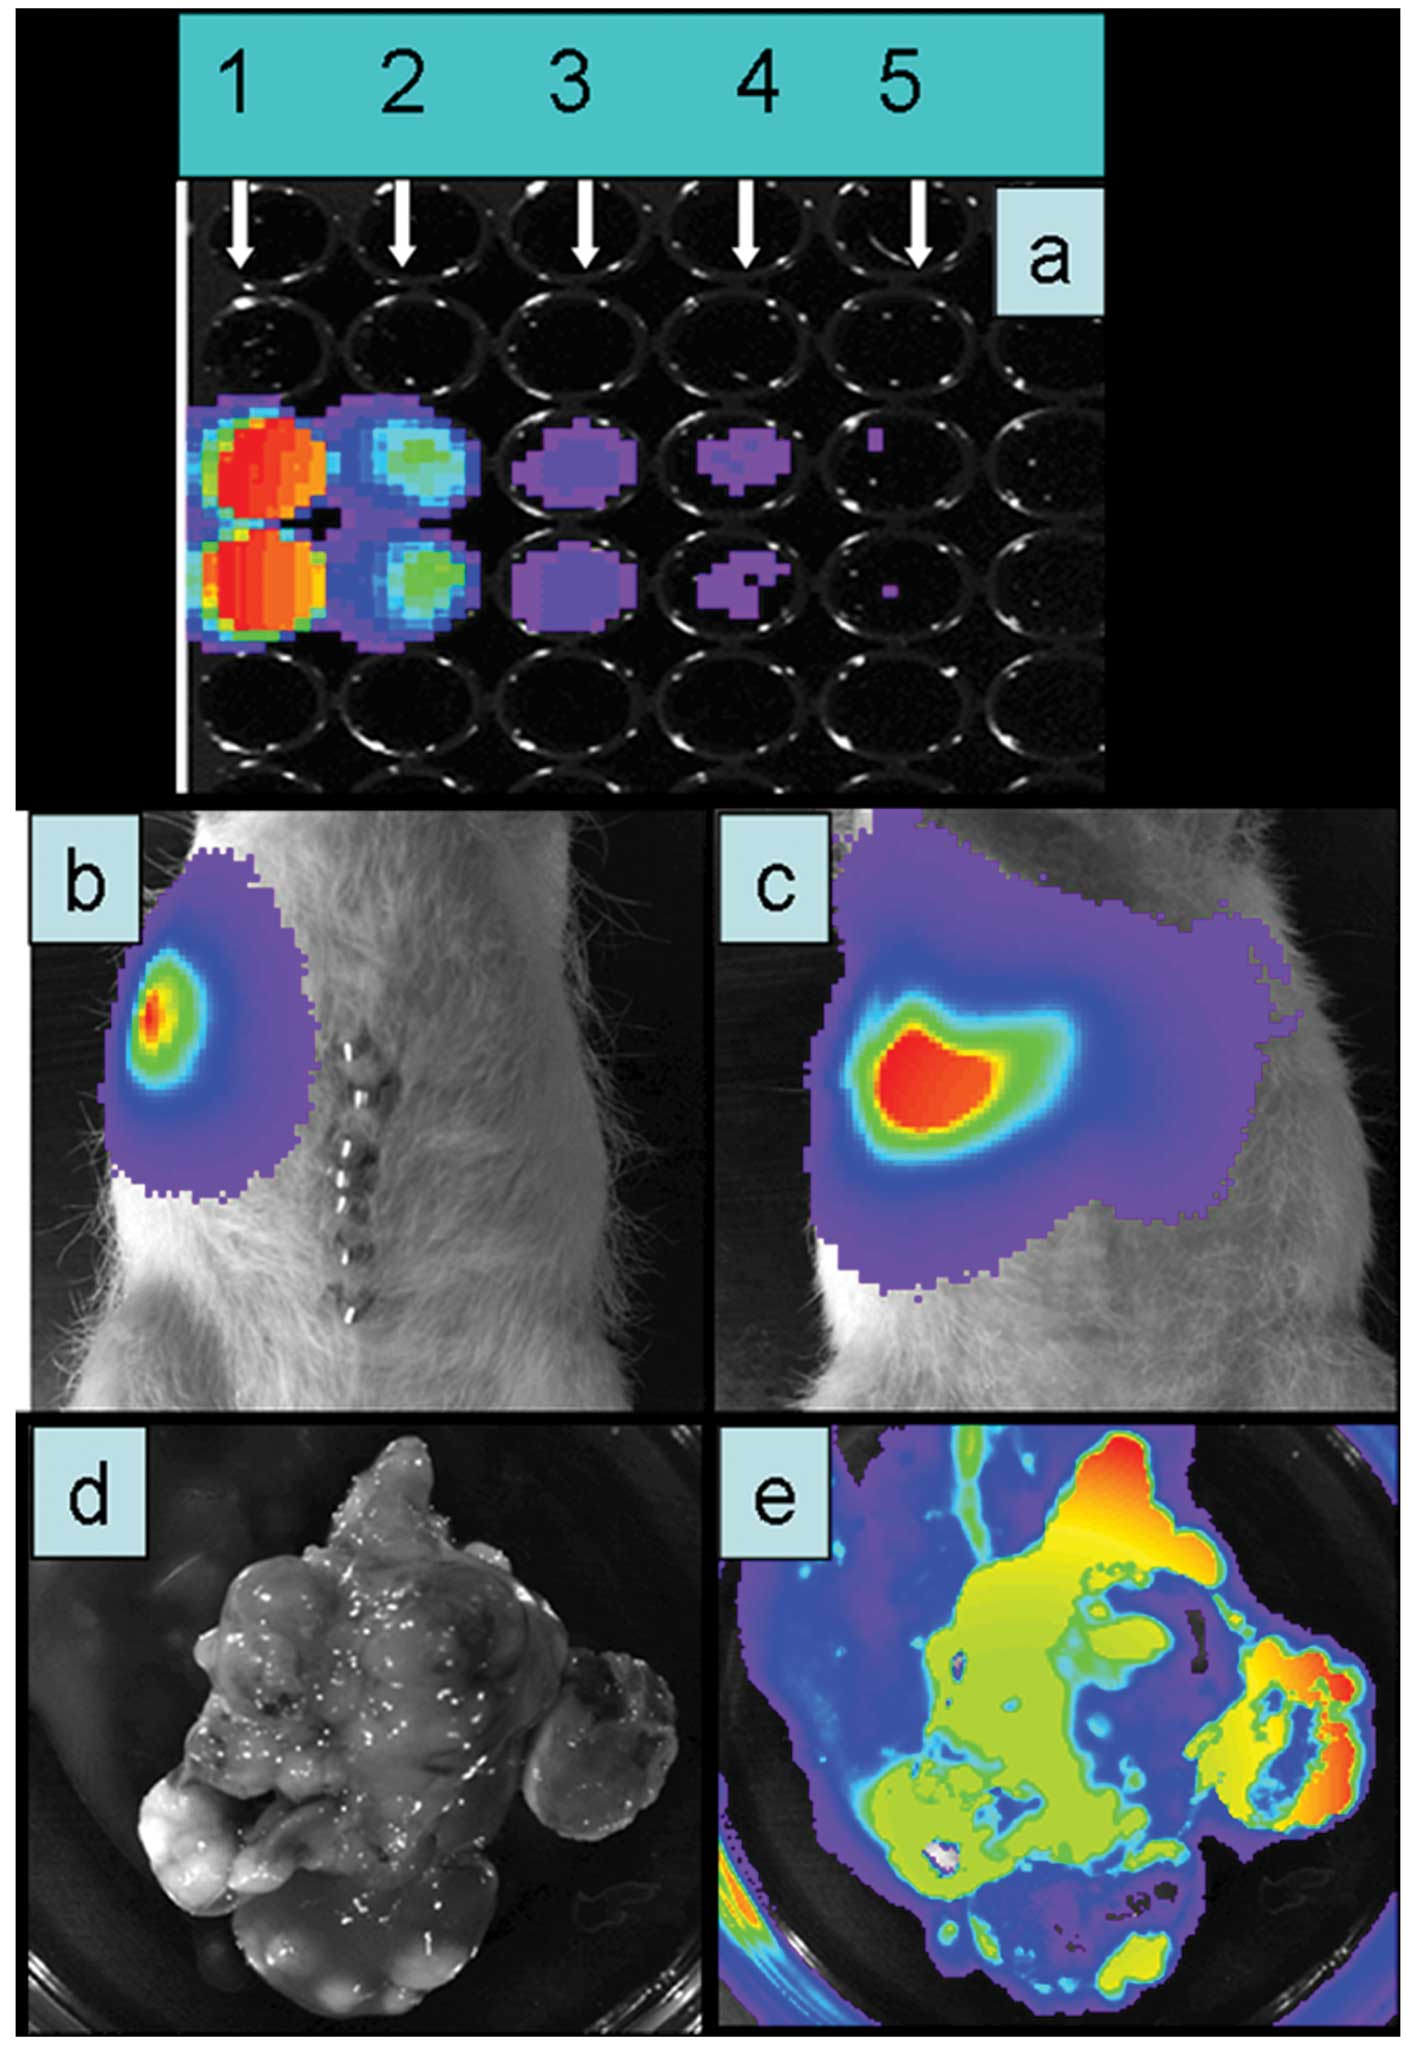
ASML cells from passage 6 were transfected with the
plasmid pBudCE4.1GFP-LUC containing the GFP and
luciferase genes under the control of the promoter CMV. In
vitro, following exposure to luciferin, a light signal was
detectable down to 5×10³ cells (Fig. 3a). Two weeks following
transplantation of ASMLGFP-LUC cells a clear light
signal was obtained after injection of luciferin (10 mg/animal;
Fig. 3b and c). After liver
explanation, it was confirmed that the light emission correlated
very well with the presence of tumor nodules (Fig. 3d and e).
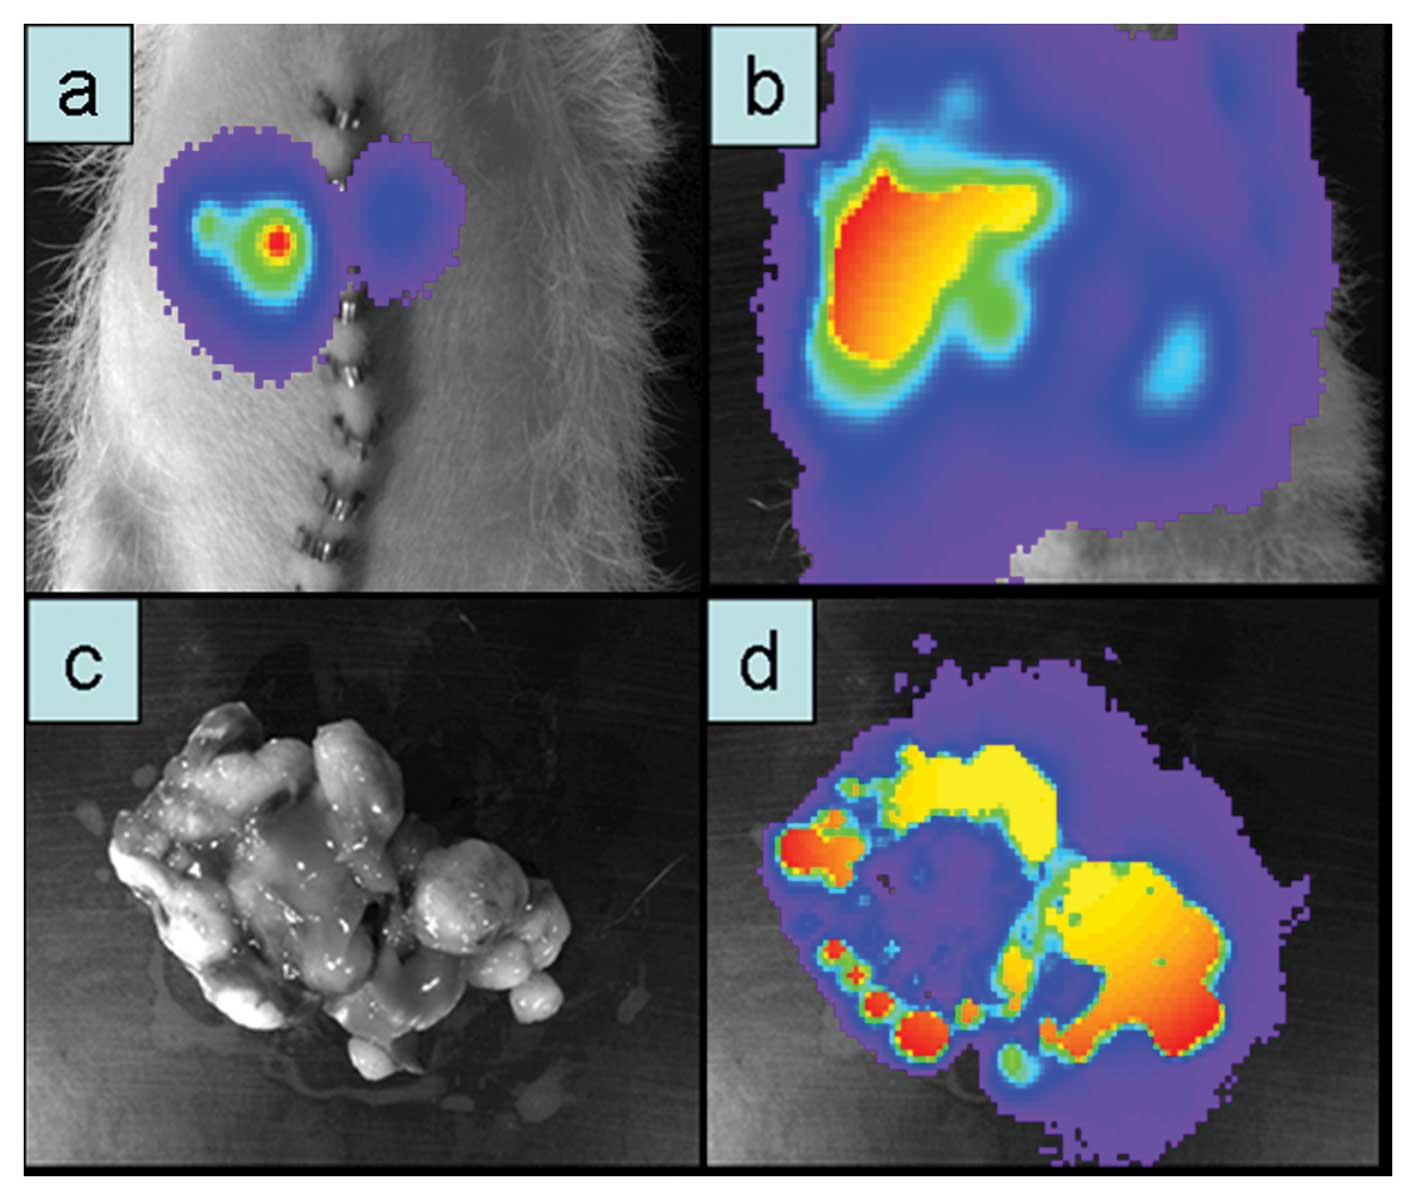
Suit2-007 model
Suit-2 cells were originally isolated from a
73-year-old Japanese man, who had developed a metastatic pancreatic
carcinoma in the liver. From this mother cell line, 28 sub-clones
were originally established by animal passage (28). The S2-007 cell line is a sub-clone
of Suit-2 cells, which was found very aggressive and able to
metastasize into the liver (28,29).
Suit2-007 cells/animal (1×10⁷) were
injected intra-portally into nude rats. Two weeks post-injection
liver tumors could be detected. Tumor cells, which had grown in the
liver were then isolated and cultured for the next animal passage.
This procedure was repeated three times. After the last passage, a
new Suit2-007 sub-clone was established that was consistently able
to form liver metastasis in nude rats, with nodules appearing one
week after implantation. Similar to the ASML cells, this sub-clone
was thereafter stably transfected with the plasmid
pBudCE4.1GFP-LUC (Fig.
4).
S2-013 model
Suit2-013 is another sub-clone of Suit-2, which was
used for establishing a less aggressively growing nude rat model.
After the first intra-portal injection, the cells grew moderately
in the liver and spontaneously regressed in some of the
animals.
Following GFP and luciferase transfection,
2×10⁶ S2-013GFP-LUC cells were implanted
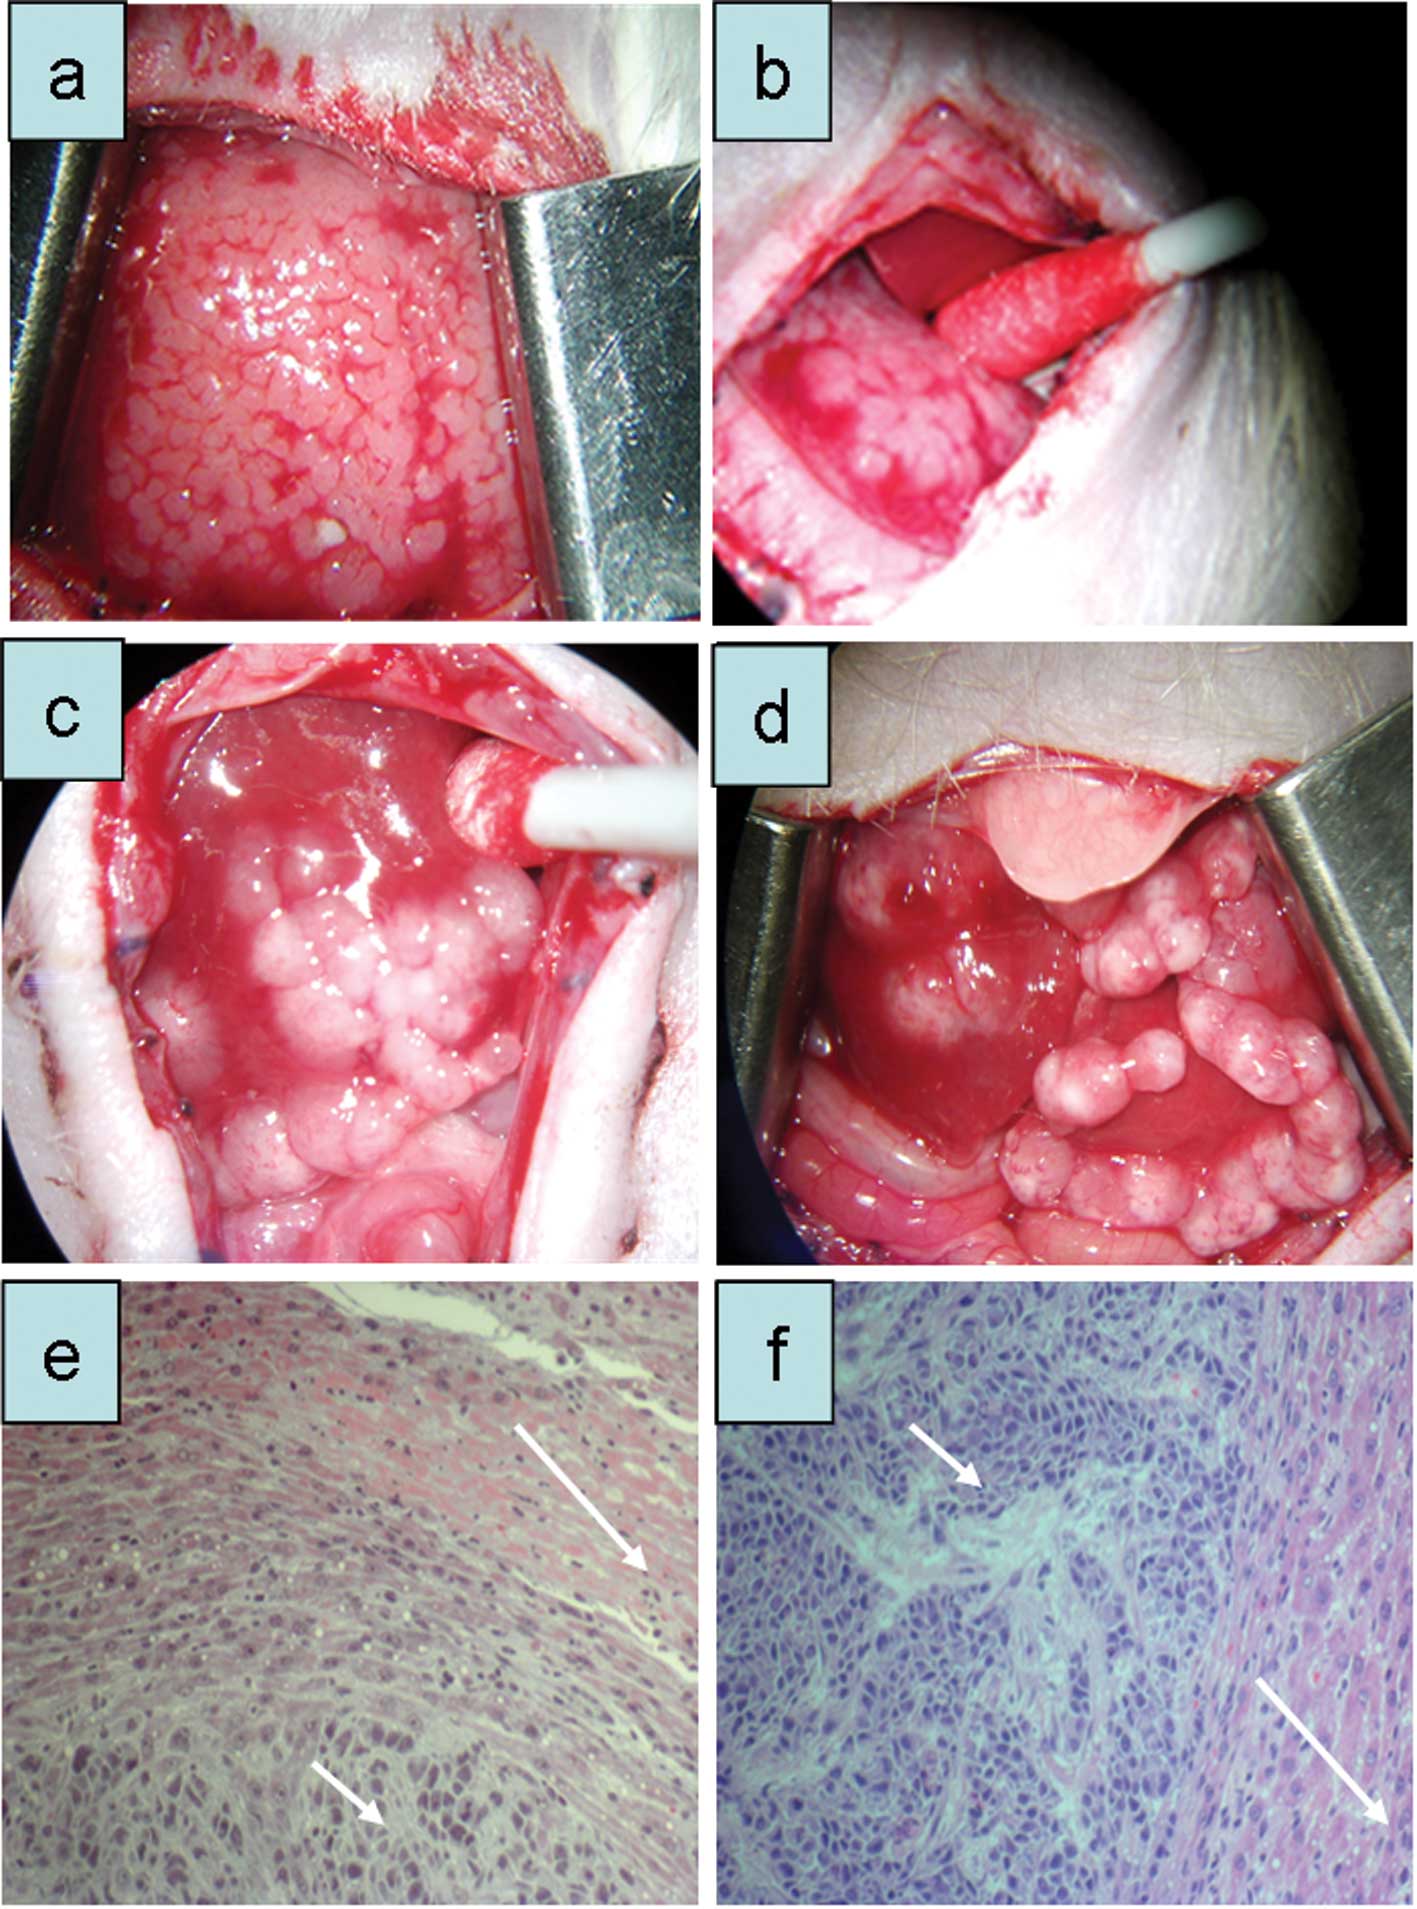
under the capsule of the middle liver lobe of a nude rat. After 24
days, stable tumor growth was observed (passage 1; Fig. 5a). Subsequently, 1×10⁷
cells were injected intra-portally and caused visible tumor growth
in implanted rats after 3–4 weeks (Fig.
5b), which partly showed spontaneous regression.
To facilitate the growth of this cell line, two nude
rats received total body irradiation (5 Gy) three days before tumor
cell implantation. As expected, the period until visible tumor
growth occurred was shorter in these rats (19 days). One of the two
irradiated animals received intra-pancreatic tumor implantation in
addition to the intra-portal implantation. Upon histological
examination, the S2-013GFP-LUC cells showed infiltrating
growth into normal liver tissue and production of fibrous
connective tissue (Fig. 5c and
d).
When pancreas and liver of this animal were excised
at autopsy, both organs were loaded with GFP and luciferase-
positive cells upon ex vivo detection (Fig. 5e and f).
In vivo imaging
One week after tumor cell implantation, animals were
analyzed by non-invasive bioluminescent imaging. After
intra-peritoneal administration of D-luciferin, the rats were
examined for bioluminescent signals originating from tumor cells
growing in the liver. A clear light signal (1×10⁵
photons/sec) could be detected from the liver region of the
respective animals. To confirm this result, the affected organs
were excised and imaged again. Although not all nodules yielded a
luciferase positive signal, the obtained signals were emitted only
from the liver.
mRNA expression profile of 13 human PDAC
cell lines
The mRNA expression profile of 13 human PDAC cell
lines was analyzed by Illumina Human Sentrix-12 BeadChip arrays.
For comparison, the cell lines were grouped according to their
growth behavior, into 4 categories (Table III).
| Table IIIGrouping of human PDAC cell lines
according to their growth behavior in the liver of nude rats. |
Table III
Grouping of human PDAC cell lines
according to their growth behavior in the liver of nude rats.
| Cell lines | Growth in rat
liver/category | G1 | G2 | G3 | G4 | G5 | G6 |
|---|
| Capan-1 | −/C1 | − | − | − | − | NV | − |
| DAN-G | −/C1 | − | − | − | − | NV | − |
| MIA PaCa-2 | −/C1 | − | − | − | − | NV | − |
| Panc-1 | −/C1 | − | − | − | − | NV | − |
| Patu 390 | −/C1 | − | − | − | − | NV | − |
| SU86.86 | −/C1 | − | − | − | − | NV | − |
| CFPAC-1 | +?/C2 | − | − | − | − | NV | +? |
| NG AsPC-1 | +?/C2 | − | + | − | − | NV | +? |
| Panc-89 | +?/C2 | − | + | − | − | NV | +? |
| BxPC-3 | ++/C3 | + | + | − | NV | − | ++ |
| Colo-357 | ++/C3 | + | − | − | NV | − | ++ |
| S2-007 | +++/C4 | + | + | + | + | + | +++ |
| S2-013 | +++/C4 | + | + | + | + | + | +++ |
Category 1 comprised those 6 cell lines, which did
not grow in the liver of nude rats. Category 2 comprised the 3 cell
lines, which grew poorly and regressed within 2 weeks.
Category 3 included the 2 cell lines, which
initially grew distinctly in the liver of nude rats, but
nevertheless regressed thereafter.
Category 4 comprised the 2 cell lines, which grew
consistently in the liver of nude rats.
For a comprehensive analysis, these categories were
grouped in different ways as shown in Table III. For identifying genes, which
are involved in the early growth of PDAC cells in rat liver, we
grouped categories 2, 3 and 4 (group 1), as well as categories 3
and 4 (group 2) and compared them with the remaining cell lines
(Table III). Remarkably, only 2
genes (OPN and UTP14A) showed significantly changed expression
(P>0.05) in growing cell lines, as compared to those, which did
not. Subsequently, for identifying genes, which are crucial for
consistent growth in the liver of nude rats, we compared category 4
vs. all other cell lines (categories 1, 2 and 3, group 3, Table III). In addition, category 4 was
compared with categories 1 and 2 to exclude those cell lines from
the remaining panel, which initially grew distinctly in the liver
of nude rats, but regressed thereafter (group 4). Furthermore,
category 4 was compared with category 3 (group 5). Interestingly,
the number of differentially expressed genes was higher than in the
first approach: 30, 8 and 2 genes showed significantly altered
expression when analyzing groups 3, 4 and 5, respectively (Table IV).
| Table IVOverview of genes with significantly
altered expression. |
Table IV
Overview of genes with significantly
altered expression.
| Gene | G1 | G2 | G3 | G4 | G5 | G6 | Functiona | Relation to
cancera,b |
|---|
| SPP1 (OPN) | + | + | | + | | + | +++++ | +++++ |
| UPK1B | + | + | + | + | | | + | (+) |
| FXYD2 | | | + | + | | | + | − |
| SLC1A1 | | | + | + | | + | ++ | + |
| EDAR | | | + | + | | + | + | (+) |
| IGF2 | | | + | + | | | ++++ | +++ |
| FOXL2 | | | + | | | | +++ | + |
| C3orf72 | | | + | | | | − | − |
| DPEP1 | | | + | | | | + | + |
| HSPA12A | | | + | + | | | + | − |
| VNN2 | | | + | | | | + | − |
| ELA3A | | | + | | | | − | − |
| R3HDML | | | + | | | | − | − |
| MMP-1 | | | + | | | | ++++ | +++ |
| FAM150A | | | + | | | | − | − |
| ARSE | | | + | | | | + | − |
| AGFG2 (HRBL) | | | + | | | | + | − |
| HSD17B2 | | | + | | | | + | + |
| HDHD1A | | | + | | | | (+) | − |
| NCKAP5 | | | + | | | | + | − |
| LOC642342 | | | + | | | | − | − |
| CISD2 | | | + | | | | + | − |
| BCL2L11 | | | + | | | | + | + |
| SLITRK4 | | | + | | | | (+) | (+) |
| UBASH3B | | | + | | | | + | − |
| KITLG | | | + | | | | ++ | + |
| TGFBR3 | | | + | | | | ++ | + |
| LOC642975 | | | + | | | | − | − |
| ADNP2 | | | + | | | | + | − |
| NR5A2 (LRH-1) | | | + | | | | +++ | +++ |
| TMSB15A | | | + | | | | (+) | (+) |
| CA12 | | | | + | | | + | + |
| BASP1 | | | | | + | | + | (+) |
| TM4SF18 | | | | | + | | (+) | (+) |
Finally, all 4 categories were used to search for
incremental differences in mRNA expression (group 6). From this
comparison, 3 genes emerged as being significantly modulated in a
progression dependent way. These genes were OPN, SLC1A1 and EDAR
(Table IV).
Signaling pathways involved in the
metastatic process
Two hundred and thirty signaling pathways (PW)
involved in cellular growth were analyzed in PDAC cell lines for
their relation to the cell line growth in the liver of nude rats.
This analysis indicated that 5 PWs were significantly and 3 more
were likely involved in this process when analyzing groups 3, 4 and
5. There were no signaling PWs significantly involved, when
analyzing the other groups.
Discussion
Research on pancreatic cancer has been aiming to
improve the understanding of the sublying molecular characteristics
and to develop new treatment options for this malignant disease.
However, due to the failure of current antineoplastic drugs,
metastatic PDAC is still one of the most lethal cancers (2,4,30).
In this study, we intended to establish
representative and reproducible in vivo models that mimic
metastasis formation of pancreatic cancer in the liver. In
addition, we wanted to identify those genes, which are instrumental
for the metastatic process. Therefore, we determined whether the
PDAC cell lines would have the property to grow in rat liver.
Subsequently, we used this capability as readout for identifying
genes, which differ in their expression level between PDAC cells
that grew in rat liver and those that did not. Remarkably, this
comparison resulted in a group of only 33 genes, which were
significantly associated with the ability of the cell lines to grow
in rat liver initially and/or consistently.
These genes can be grouped into three subgroups.
First, there were genes, which are well known for their role in
cancer progression such as OPN, MMP-1 and IGF2 (31–35).
Based on the categories of metastatic growth and our inter-group
comparisons, OPN seems to be required for the initial growth of
PDAC cells in rat liver, while MMP-1 and EGF1 are more important
for their permanent growth.
The next group contained 5 genes, which are less
well characterized and reportedly have anti-invasive properties
such as DPEP1, or contribute to cancer progression such as SLC1A1,
C3orf72 and KITLG.
Finally, the largest group of 25 genes has not (yet)
been associated with cancer.
To detect functional relationships, the affiliation
of these genes to known signaling pathways was analyzed.
Surprisingly, the significantly altered genes were firmly
associated to only 2% (5 of 230) of all pathways. Two of these
associated signaling pathways are the PPAR and the bladder cancer
signaling pathways, which have been implicated in a variety of
neoplastic processes, such as breast, bladder and colon cancer
(36–38). Another related pathway is the
‘Maturity Onset Diabetes’ pathway. A possible link between diabetes
and PDAC has emerged recently. A meta-analysis of a total of 36
studies (17 case-control and 19 cohort or nested case-control
studies) demonstrated that patients with diabetes type 2 have a 1.8
higher risk to develop PDAC than people without diabetes (40).
The remaining two pathways ‘Proximal tubule
bicarbonate reclamation’ and ‘Aldosterone-regulated sodium
reabsorption’ pathways have not yet been found to be implicated in
neoplastic processes.
The detected low number of genes affiliated to
growth of PDAC cell lines in rat liver is astonishing and might be
due to various reasons. Our approach to select the expression of
the whole genome of 13 cell lines resulted in a large number of
comparisons, which in turn allowed detecting only those genes with
most significantly altered expression. Therefore, a relatively
large number of falsely negative genes cannot be excluded. Also,
using the in vitro signature of PDAC cell expression might
be responsible for missing another category of genes. These are
genes, which differ in expression between in vitro and in
vivo conditions. Recently, examples have been described for
genes, which show a strong modulation of their expression upon
transplantation into rat liver (40–42).
It is hoped that a future analysis of these gene
functions and their respective signaling cascades will contribute
to better understand why only two human cancer cell lines were able
to grow consistently in the liver of nude rats. In the absence of
such an analysis, the established tumor models will allow
investigating the course of metastasis formation in pancreatic
cancer and can be used for examining new therapeutics.
The models were based on transplanting PDAC cells
into the liver via the intra-portal route, as previously described
(43). This type of injection
mimics to a certain extent the natural way of pancreatic cancer
cell dissemination into the liver and can be used to investigate
the efficacy of new antineoplastic drugs against PDAC cells
invading and colonizing the liver.
In general, metastasis formation follows two
principles. According to the mechanical principle, which was
described by Ewing, the tumor cells are caught in the blood
capillaries of their target organs (44,45).
Alternatively, the seed and soil principle of Paget describes the
growth of tumor cells in organs, which offer appropriate growth
conditions (46).
The investigation of genes identified in this study
by targeted knock down may help to learn/discriminate, which of the
two principles has greater influence on PDAC cell colonization of
rat liver.
Recording of tumor growth inside experimental
animals requires appropriate methods for detection. Therefore, we
stably transfected the tumor cells with luciferase and GFP as
markers, respectively. One problem with the transfection of genetic
markers is, that a sub-clone may express new proteins, which can be
recognized by the immune system. Then, transfected cells can lose
their metastatic ability or change their growth behavior in
vivo, as reported after transfection with EGFP and Lac Z-
markers, respectively (43,47). Indeed, this phenomenon was
recognized in Suit2-013GFP-LUC and partially in
Suit2-007GFP-LUC cells. After transfection of Suit2-013
cells with GFP and luciferase, the generated
Suit2-013GFP-LUC cells grew slowly and had a take rate
of less than 50%. Only after pre-irradiation of the animals, these
cells grew more efficiently.
In summary, 3 of 16 PDAC cell lines were able to
grow consistently in the liver of male RNU rats and served as basis
for three newly established orthotopic PDAC liver metastasis
xenograft models in male RNU rats. Based on the ability of 13 human
PDAC cell lines to grow initially and consistently in the liver of
nude rats, and the genetic signature of these cell lines as
determined by microarray analysis, 33 genes were identified to be
significantly altered as compared to the expression signature of
cells without this capability. Only a minority of these genes (OPN,
MMP-1 and IGF2) has been investigated thoroughly and shown to be
involved in cancer progression. The vast majority of these genes
have not yet been sufficiently evaluated and their function in
cancer progression is unclear. However, further studies should
clarify their function in and relationship to cancer.
References
|
1
|
Jemal A, Tiwari RC, Murray T, et al:
Cancer statistics, 2004. CA Cancer J Clin. 54:8–29. 2004.
View Article : Google Scholar
|
|
2
|
Ghaneh P, Kawesha A, Howes N, Jones L and
Neoptolemos JP: Adjuvant therapy for pancreatic cancer. World J
Surg. 23:937–945. 1999. View Article : Google Scholar
|
|
3
|
Alanen KA and Joensuu H: Long-term
survival after pancreatic adenocarcinoma - often a misdiagnosis? Br
J Cancer. 68:1004–1005. 1993. View Article : Google Scholar : PubMed/NCBI
|
|
4
|
Li D, Xie K, Wolff R and Abbruzzese JL:
Pancreatic cancer. Lancet. 363:1049–1057. 2004. View Article : Google Scholar
|
|
5
|
Friess H, Ding J, Kleeff J, et al:
Microarray-based identification of differentially expressed growth-
and metastasis-associated genes in pancreatic cancer. Cell Mol Life
Sci. 60:1180–1199. 2003.PubMed/NCBI
|
|
6
|
Kayed H, Kleeff J, Keleg S, et al: Indian
hedgehog signaling pathway: expression and regulation in pancreatic
cancer. Int J Cancer. 110:668–676. 2004. View Article : Google Scholar : PubMed/NCBI
|
|
7
|
Bardeesy N and DePinho RA: Pancreatic
cancer biology and genetics. Nat Rev Cancer. 2:897–909. 2002.
View Article : Google Scholar
|
|
8
|
Hansel DE, Kern SE and Hruban RH:
Molecular pathogenesis of pancreatic cancer. Annu Rev Genomics Hum
Genet. 4:237–256. 2003. View Article : Google Scholar : PubMed/NCBI
|
|
9
|
Matzku S, Komitowski D, Mildenberger M and
Zoller M: Characterization of BSp73, a spontaneous rat tumor and
its in vivo selected variants showing different metastasizing
capacities. Invasion Metastasis. 3:109–123. 1983.PubMed/NCBI
|
|
10
|
Katz MH, Takimoto S, Spivack D, Moossa AR,
Hoffman RM and Bouvet M: A novel red fluorescent protein orthotopic
pancreatic cancer model for the preclinical evaluation of
chemotherapeutics. J Surg Res. 113:151–160. 2003. View Article : Google Scholar : PubMed/NCBI
|
|
11
|
Sun FX, Tohgo A, Bouvet M, Yagi S,
Nassirpour R, Moossa AR and Hoffman RM: Efficacy of camptothecin
analog DX-8951f (Exatecan Mesylate) on human pancreatic cancer in
an orthotopic metastatic model. Cancer Res. 63:80–85.
2003.PubMed/NCBI
|
|
12
|
Marincola FM, Drucker BJ, Siao DY, Hough
KL and Holder WD Jr: The nude mouse as a model for the study of
human pancreatic cancer. J Surg Res. 47:520–529. 1989. View Article : Google Scholar : PubMed/NCBI
|
|
13
|
Jimenez RE, Hartwig W, Antoniu BA, Compton
CC, Warshaw AL and Fernandez-Del CC: Effect of matrix
metalloproteinase inhibition on pancreatic cancer invasion and
metastasis: an additive strategy for cancer control. Ann Surg.
231:644–654. 2000. View Article : Google Scholar : PubMed/NCBI
|
|
14
|
Tzanakakis GN, Margioris AN, Tsatsakis AM
and Vezeridis MP: The metastatic potential of human pancreatic cell
lines in the liver of nude mice correlates well with cathepsin B
activity. Int J Gastrointest Cancer. 34:27–38. 2003. View Article : Google Scholar : PubMed/NCBI
|
|
15
|
Vernejoul F, Faure P, Benali N, et al:
Antitumor effect of in vivo somatostatin receptor subtype 2 gene
transfer in primary and metastatic pancreatic cancer models. Cancer
Res. 62:6124–6131. 2002.PubMed/NCBI
|
|
16
|
Samnick S, Romeike BF, Kubuschok B, et al:
p-[123I]iodo-L-phenylalanine for detection of pancreatic cancer:
basic investigations of the uptake characteristics in primary human
pancreatic tumour cells and evaluation in in vivo models of human
pancreatic adenocarcinoma. Eur J Nucl Med Mol Imaging. 31:532–541.
2004.
|
|
17
|
Raz A, Zoller M and Ben Z: Cell
configuration and adhesive properties of metastasizing and
non-metastasizing BSp73 rat adenocarcinoma cells. Exp Cell Res.
162:127–141. 1986. View Article : Google Scholar : PubMed/NCBI
|
|
18
|
Tuveson DA, Zhu L, Gopinathan A, et al:
Mist1-KrasG12D knock-in mice develop mixed differentiation
metastatic exocrine pancreatic carcinoma and hepatocellular
carcinoma. Cancer Res. 66:242–247. 2006. View Article : Google Scholar
|
|
19
|
Kokkinakis DM, Ahmed MM, Chendil D,
Moschel RC and Pegg AE: Sensitization of pancreatic tumor
xenografts to carmustine and temozolomide by inactivation of their
O6-Methylguanine-DNA methyltransferase with O6-benzylguanine or
O6-benzyl-2′-deoxyguanosine. Clin Cancer Res. 9:3801–3807.
2003.
|
|
20
|
Ito D, Fujimoto K, Mori T, et al: In vivo
antitumor effect of the mTOR inhibitor CCI-779 and gemcitabine in
xenograft models of human pancreatic cancer. Int J Cancer.
118:2337–2343. 2006. View Article : Google Scholar : PubMed/NCBI
|
|
21
|
Sausville EA and Burger AM: Contributions
of human tumor xenografts to anticancer drug development. Cancer
Res. 66:3351–3354. 2006. View Article : Google Scholar : PubMed/NCBI
|
|
22
|
Eberwine J, Yeh H, Miyashiro K, et al:
Analysis of gene expression in single live neurons. Proc Natl Acad
Sci USA. 89:3010–3014. 1992. View Article : Google Scholar : PubMed/NCBI
|
|
23
|
Smyth GK: Linear models and empirical
bayes methods for assessing differential expression in microarray
experiments. Stat Appl Genet Mol Biol. 3:Article 32004.
|
|
24
|
Smyth GK: Limma: linear models for
microarray data. Bioinformatics and Computational Biology Solutions
Using R and Bioconductor. Gentleman R, Carey V, Dudoit S, Irizarry
R and Huber W: Springer; New York: pp. 397–420. 2005, View Article : Google Scholar
|
|
25
|
Goeman JJ, van de Geer SA, de KF and van
Houwelingen HC: A global test for groups of genes: testing
association with a clinical outcome. Bioinformatics. 20:93–99.
2004. View Article : Google Scholar : PubMed/NCBI
|
|
26
|
Goeman JJ, Oosting J, Cleton-Jansen AM,
Anninga JK and van Houwelingen HC: Testing association of a pathway
with survival using gene expression data. Bioinformatics.
21:1950–1957. 2005. View Article : Google Scholar : PubMed/NCBI
|
|
27
|
R Development Core Team. A language and
environment for statistical computing. R Foundation for Statistical
Computing; Vienna: 2011
|
|
28
|
Iwamura T, Katsuki T and Ide K:
Establishment and characterization of a human pancreatic cancer
cell line (SUIT-2) producing carcinoembryonic antigen and
carbohydrate antigen 19-9. Jpn J Cancer Res. 78:54–62.
1987.PubMed/NCBI
|
|
29
|
Taniguchi S, Iwamura T and Katsuki T:
Correlation between spontaneous metastatic potential and type I
collagenolytic activity in a human pancreatic cancer cell line
(SUIT-2) and sublines. Clin Exp Metastasis. 10:259–266. 1992.
View Article : Google Scholar : PubMed/NCBI
|
|
30
|
Friess H, Buchler M, Kruger M and Beger
HG: Treatment of duct carcinoma of the pancreas with the LH-RH
analogue buserelin. Pancreas. 7:516–521. 1992. View Article : Google Scholar : PubMed/NCBI
|
|
31
|
Fedarko NS, Jain A, Karadag A, Van Eman MR
and Fisher LW: Elevated serum bone sialoprotein and osteopontin in
colon, breast, prostate, and lung cancer. Clin Cancer Res.
7:4060–4066. 2001.PubMed/NCBI
|
|
32
|
Kolb A, Kleeff J, Guweidhi A, et al:
Osteopontin influences the invasiveness of pancreatic cancer cells
and is increased in neoplastic and inflammatory conditions. Cancer
Biol Ther. 4:740–746. 2005. View Article : Google Scholar : PubMed/NCBI
|
|
33
|
Wong JC, Chan SK, Schaeffer DF, et al:
Absence of MMP2 expression correlates with poor clinical outcomes
in rectal cancer, and is distinct from MMP1-related outcomes in
colon cancer. Clin Cancer Res. 17:4167–4176. 2011. View Article : Google Scholar : PubMed/NCBI
|
|
34
|
Hart K, Landvik NE, Lind H, Skaug V,
Haugen A and Zienolddiny S: A combination of functional
polymorphisms in the CASP8, MMP1, IL10 and SEPS1 genes affects risk
of non-small cell lung cancer. Lung Cancer. 71:123–129. 2011.
View Article : Google Scholar : PubMed/NCBI
|
|
35
|
Hoyo C, Murphy SK, Schildkraut JM, et al:
IGF2R genetic variants, circulating IGF2 concentrations and colon
cancer risk in African Americans and Whites. Dis Markers.
32:133–141. 2012. View Article : Google Scholar : PubMed/NCBI
|
|
36
|
Yee LD, Sabourin CL, Liu L, Li HM, Smith
PJ, Seewaldt V and Kniss DA: Peroxisome proliferator-activated
receptor gamma activation in human breast cancer. Int J Oncol.
15:967–973. 1999.PubMed/NCBI
|
|
37
|
Guan YF, Zhang YH, Breyer RM, Davis L and
Breyer MD: Expression of peroxisome proliferator-activated receptor
gamma (PPARgamma) in human transitional bladder cancer and its role
in inducing cell death. Neoplasia. 1:330–339. 1999. View Article : Google Scholar
|
|
38
|
Gupta RA, Brockman JA, Sarraf P, Willson
TM and DuBois RN: Target genes of peroxisome proliferator-activated
receptor gamma in colorectal cancer cells. J Biol Chem.
276:29681–29687. 2001. View Article : Google Scholar : PubMed/NCBI
|
|
39
|
Huxley R, Ansary-Moghaddam A, Berrington
de GA, Barzi F and Woodward M: Type-II diabetes and pancreatic
cancer: a meta-analysis of 36 studies. Br J Cancer. 92:2076–2083.
2005. View Article : Google Scholar : PubMed/NCBI
|
|
40
|
Uhlmann ME, Georges RB, Boleij A, Eyol E,
Kubarenko A, Adwan H and Berger MR: Influence of osteopontin
expression on the metastatic growth of CC531 rat colorectal
carcinoma cells in rat liver. Cancer Gene Ther. 18:795–805. 2011.
View Article : Google Scholar : PubMed/NCBI
|
|
41
|
Georges RB, Adwan H, Hamdi H, Hielscher T,
Linnemann U and Berger MR: The insulin-like growth factor binding
proteins 3 and 7 are associated with colorectal cancer and liver
metastasis. Cancer Biol Ther. 12:69–79. 2011. View Article : Google Scholar : PubMed/NCBI
|
|
42
|
Georges R, Bergmann F, Hamdi H, et al:
Sequential biphasic changes in claudin1 and claudin4 expression are
correlated to colorectal cancer progression and liver metastasis. J
Cell Mol Med. 16:260–272. 2012. View Article : Google Scholar : PubMed/NCBI
|
|
43
|
Wittmer A, Khazaie K and Berger MR:
Quantitative detection of lac-Z-transfected CC531 colon carcinoma
cells in an orthotopic rat liver metastasis model. Clin Exp
Metastasis. 17:369–376. 1999. View Article : Google Scholar : PubMed/NCBI
|
|
44
|
Ewing J: The Problems of melanoma. Br Med
J. 2:852–856. 1930. View Article : Google Scholar
|
|
45
|
Ewing J: Neoplastic diseases.
Saunders-Verlag; Philadelphia: pp. 125–129. 1928
|
|
46
|
Paget S: The distribution of secondary
growths in cancer of the breast. 1889. Cancer Metastasis Rev.
8:98–101. 1989.PubMed/NCBI
|
|
47
|
Chishima T, Miyagi Y, Wang X, Yamaoka H,
Shimada H, Moossa AR and Hoffman RM: Cancer invasion and
micrometastasis visualized in live tissue by green fluorescent
protein expression. Cancer Res. 57:2042–2047. 1997.PubMed/NCBI
|