Introduction
Ovarian cancer is the fifth leading cause of death
from cancer and the most common cause of death from gynecologic
neoplasia in women, due to its detection at advanced stages.
Despite significant refinement in treatment options and surgical
techniques, the 5-year survival for advanced ovarian cancer still
remains low (1,2). In order to improve the outcome of
these patients, reliable and accurate diagnostic means are
therefore essential. It is well established that the cancerous
microenvironment exerts substantial stresses on both cancer and
non-cancer cells and often results in a shift in cellular energy
production and utilization (3–5).
Hence, it seems plausible that investigating the biochemical
intermediates and end products within cancerous tissue samples
would refine our knowledge of cancer biology.
Magnetic resonance spectroscopy (MRS) is a
non-invasive analytical technique which can assess both molecular
structural and chemical composition of non-homogeneous biological
specimens. This method has provided considerable information on
energetic status and cellular metabolism in various tissues and
organs particularly in cancer cell cultures and tumorigenic tissues
(6,7). In our previous study we applied
31P-MRS to in vitro studies of various breast
cancer cells grown in culture and observed the effects of drugs on
these cells (8). To date, only a
few MRS studies have been published on human ovarian pathologies,
generally limited to the analysis of fluids aspirated from ovarian
cysts (9,10). In the current study, we sought to
determine the metabolic profiles of cells obtained from patients
with malignant ovarian tumors and to compare them with
non-cancerous cells obtained from patients with benign ovarian
cysts using the 1H-MRS method. In addition, we aimed to
evaluate the metabolic effects of different anti-mitotic drugs on
cells obtained from peritoneal effusions of patients with advanced
ovarian cancer using 31P-MRS.
Materials and methods
Patients
Forty-three patients were recruited to this study.
Twenty patients had newly diagnosed, histopathologically proven
ovarian cancer (study group) and 15 patients had benign ovarian
cysts (control group). Characteristics of patients from the study
and control groups are presented in Table I. Patient age was not significantly
different between the study and control groups (63.2±7.1 vs.
61.3±4.7 years, respectively); however, tumor size was
significantly larger in the study group (11.4±3.2 vs. 7.4±2.1 cm,
p=0.0001). Most patients in the study group had serous
cystadenocarcinoma (80%), either moderately to poorly
differentiated (55%) or poorly differentiated (40%) (Table I). Most patients in this group were
diagnosed at stage 3 (55%) or 4 (20%). Thirty-five percent of
patients had neo-adjuvant chemotherapy prior to surgery. Patients
in the control group had either serous (9 patients) or mucinous (4
patients) cystadenoma, or cystadenofibroma (2 patients). All
patients underwent explorative laparotomy for tumor resection or
debulking in our institution. Tumor size and stage were recorded
for all patients during surgery. Tissue samples from ovarian tumor
and intra-abdominal metastases (which were present in 15 patients
with stage 3–4 disease) or from benign ovarian cysts (in the
control group) were excised by the operating physician to an
average size of 1 cm3 and were frozen immediately in
liquid nitrogen in a sterile plastic tube. Samples were kept under
deep freeze (−80°C) until analysis. Parallel tissue samples
underwent a histopathologic evaluation by a certified pathologist.
Another 8 patients (mean age, 62±5 years) with advanced ovarian
cancer and cytologically proven cancerous peritoneal effusion were
recruited to this study. All patients had received at least one
platin- and/or paclitaxel-based treatment cycle (median, 3; range,
1–5) and all underwent a palliative drainage of their peritoneal
effusion in our institution. Two hundred milliliters of peritoneal
effusion were obtained from each patient for MRS analysis. All
subjects signed an informed consent approved by the Institutional
Review Board Committee for Human Subjects.
 | Table IPatient characteristics. |
Table I
Patient characteristics.
| Malignant tumor
(n=20) | Benign tumor
(n=15) |
|---|
| Mean age
(years) | 63.2±7.1
(n=20) | 61.3±4.7
(n=15) |
| Tumor size
(cm) | 11.4±3.2 | 7.4±2.1 |
| Tumor type |
| Serous | 16 (80%) | 9 (60%) |
| Mucinous | 2 (10%) | 4 (26.7%) |
| Clear cell | 1 (5%) | 0 (0%) |
|
Undifferentiated | 1 (5%) | 0 (0%) |
| Other | 0 (0%) | 2 (13.3%)
(cystadenofibroma) |
| Degree of
differentiation |
| Well | 0 (0%) | N/A |
| Moderate to
poor | 11 (55%) | |
| Poor | 8 (40%) | |
|
Undifferentiated | 1 (5%) | |
| Clinical stage |
| 1 | 2 (10%) | N/A |
| 2 | 3 (15%) | |
| 3 | 11 (55%) | |
| 4 | 4 (20%) | |
| Primary | 20 (100%) | 15 (100%) |
| Recurrent | 0 (0%) | 0 (0%) |
| Previous
neo-adjuvant chemotherapy | 7 (35%) | N/A |
Preparation of samples for MRS
analysis
MRS analysis was conducted on both tissue samples
and cells obtained from peritoneal effusion. While tissue samples
universally required cell extraction before analysis, cells
obtained from peritoneal effusions allowed MRS evaluation either in
cell extracts or in viable cells embedded in Matrigel (CEM) (see
below). The latter option facilitated continuous monitoring of
magnetic resonance (MR) spectra following incubation with various
anti-mitotic drugs. Cells obtained from peritoneal effusions
initially presented a mixture of different cell types. We,
therefore, performed several clone separations and sub-cloning in
order to create homogenous cultures before MRS analysis.
Subsequently, cell cultures were grown in DMEM supplemented with
FCS (10%), sodium pyruvate solution 100 mM (1%), L-glutamine
solution (200 mM) (1%), MEM vitamin solution (1%), MEM
non-essential amino acid solution (1%) and penicillin-streptomycin
solution (1%) (Biological Industries, Israel). Cell cultures were
grown either in 92×17 mm dishes for further culturing or in 144×21
mm dishes (Nunclon) when larger amounts of cells were required.
Cultures were regularly fed every 3–4 days and subcultured by a
1:30 to 1:40 split ratio by detaching cells after one
phosphate-buffered saline (PBS) wash with Trypsin (0.05%) EDTA
(0.02%) solution (Biological Industries). All cultures were
incubated at 37°C with 10% CO2.
Preparation of cell extracts from cell
cultures and tissue samples
Cells were detached using Trypsin-EDTA solution and
collected in a 50-ml tube for centrifugation for 5 min at 1,000
rpm. The supernatant was removed and 1 ml of 0.5 M HClO4
5 M was added to the tube which was kept over ice during the entire
procedure. Incubation in the perchloric acid (PCA) lasted 5 min and
the solution was occasionally mixed by vortexing. Frozen tissue
samples were washed in liquid nitrogen to assure maximal freezing.
Tissues were then crushed into powder and transferred to a 50-ml
plastic tube, with PCA (1 M). Tissues were incubated in the acid
for 15 min and mixed occasionally. The acid was neutralized to a pH
of 7.0 using KOH (5 and 0.5 M). The whole mixture was then
centrifuged at 13,000 rpm for 20 min in 4°C. The supernatant was
transferred to a 20-ml plastic bottle and mixed with 0.2–0.4 g
Chelex 100 (Bio-Rad, USA) for 1 h at 4°C, in order to chelate all
metals within the solution. The solution was then filtered through
a GF/B (1.0-μM pore size) 2.5-cm diameter Glass Microfiber filter
(Whatman, UK) into a 150-ml glass flask, and the filtrate was
frozen in liquid nitrogen and lyophilized overnight until dried.
The dry sample was kept sealed in the flask at −80°C until MRS
analysis.
Preparation of cell extracts before the
MRS analysis
The dry extracts were dissolved in 700 μl cold
D2O, mixed and moved to a 1.5 ml Eppendorf tube for 10
min of centrifugation at 10,000 rpm. D2O enables the
lock signal on the MR spectrometer to be used. The solutions were
then transferred to a 5-mm MRS tube and kept at 4°C until analysis.
Before MRS analysis for 1H- and
31P-containing compounds, 70 μl of EDTA solution (0.2 M)
was added to the MRS tube to remove paramagnetic ions. Samples were
constantly kept on ice.
3-Dimensional Matrigel construct
In order to follow changes occurring in living
ovarian cancer cells using MRS, the cells were packed in the MRS
tube in Matrigel (BD Matrigel™ matrix; BD Biosciences, USA), a
solubilized basement membrane preparation extracted from EHS mouse
sarcoma (a tumor rich in ECM proteins) whose major components are
laminin (56%), followed by collagen IV (31%), heparan sulfate
proteoglycans and entactin (8%). Prior to the procedure, Matrigel
was thawed at 4°C in icy water, a flask was filled with 60 ml of
fresh medium either with or without drug and a 60-cm long Teflon
tube of 0.5 mm i.d. was attached to a sterile 23G needle on a 10 ml
syringe. The tube was washed twice with 70% ethanol and the whole
apparatus was kept in ethanol until it was used. For each
experiment 3 dishes of 144×21 mm were cultured to full confluency.
Cells were detached using trypsin and centrifuged for 5 min at
1,000 rpm. The medium was removed and the tube containing the cells
was set on ice in a box, which was earlier disinfected with 70%
ethanol. Cold (4°C) Matrigel (1.5 ml) was added to the cells using
a cold sterile pipette. The cells and the Matrigel were gently
mixed to a homogenous suspension. Matrigel threads were then
prepared one after the other as quickly as possible in order to
return the cells to the medium rapidly. The suspension was gently
drawn into the teflon tube and was left in the tube at room
temperature for 30–120 sec until it polymerized. After the whole
suspension was transformed into semi-solid threads, the cells were
left to incubate in the medium for ~30–33 h in the incubator at
37°C, in 5% CO2.
MRS analysis
1H-MRS and 1H-decoupled
31P-MRS spectra were acquired at 10°C on a Varian Inova
500 machine which detects 1H nuclei at 500 megaHertz
(MHz) and 31P nuclei at 202 MHz. Prior to each series of
experiments, the values of T1 and the required 90° pulse width were
determined and then used for the analysis. MRS experiments of all
extracts were carried out using the ‘5BB’ probe at 10°C and
analyzed in 3 ways: First a proton (1H) spectrum was
acquired at a spectrometer frequency of 499.791 MHz with a 90°
pulse, transmitter power of 63 dB and pulse width of 9.1 μsec. The
relaxation delay was set to 2.00 sec and the acquisition time
lasted 1.892 sec. Sixty-four scans were accumulated to produce the
final spectrum. The spectrum from this experiment was then loaded,
and the water-suppressed 1H spectrum was detected. The
water signal (at 4.65 ppm) from the first detection was chosen and
the pre-saturation sequence was activated. Detection parameters
included: saturation power of 8 and saturation delay of 3.00 sec.
One hundred and twenty-eight scans were accumulated. The
spectrometer frequency was then set at 202.319 MHz for the
31P detection. Parameters were set at: transmitter power
of 56 dB, pulse width of 7.0 μsec and flip angle of 66.3°.
Broad-band decoupling was activated to suppress the proton
detection with a decoupler power of 40 dB without nuclear
overhouser enhancement (NOE). Three thousand scans were accumulated
to produce the final spectrum. Spectra were manually integrated by
marking the beginning and ending of each signal of interest. The
first signal marked was automatically set as 1 and was used as a
reference. In 1H analysis the signal of adenosine
triphosphate (ATP) at 8.25 ppm and in the 31P analysis
the signal of β-ATP at -21 ppm were set as references,
respectively. All signal integrals were set in tables in MS Excel
2007 sheets. Figures were created using MS Excel 2007.
Anti-mitotic drugs
Three anti-mitotic drugs were used: paclitaxel
(Taxol; BMS, USA), cisplatin (Cisplatin; Merck, Vianex, Greece) and
carboplatin (Paraplatin; BMS, Italy). Stock concentrations of the
drugs were paclitaxel (6 mg/ml), cisplatin (1 mg/ml) and
carboplatin (10 mg/ml). Paclitaxel was further diluted in DMSO, and
the platinum compounds were diluted in distilled water. In order to
determine the effective concentrations of the drugs to be used with
the cell cultures, a series of experiments was conducted to
determine LC50. The following procedure was performed at
least twice with each cell line. Cells were seeded in a 12-well
plate (6 duplicates) at 10,000 cells/ml, 2 ml/well. Approximately
24 h after seeding, the drug was added to 5 of the 6 duplicates in
increasing concentrations. Two wells were left untouched, as
controls. The middle concentration was close to the estimated
LC50; 2 duplicates had higher concentrations and 2 had
lower. The volume of the drug solution, which was added to the
well, was never higher than 1% of the total volume. After 48 h of
incubation with the drugs, the wells were washed with PBS in order
to wash away dead cells and the adherent cells were detached using
trypsin. Cells were transferred to a cuvette and diluted in PBS to
a total volume of 20 ml. They were counted in a Coulter counter,
which was calibrated to the proper size of particles after a sample
manual counting. Each cuvette was counted 4 times and all counts
were compared to the control count of the clean PBS. Counting
results were analyzed using MS Excel 2007 and the derived
LC50 parameters were used in the chemotherapeutic
experiments. Cells were incubated with the drugs at LC50
for 48 h before MRS analysis.
Statistical analysis
Data are expressed as means ± SD. Statistical
significance was assessed by the Student's 2-tailed t-test and
analysis of variance as indicated. A P-value <0.05 was
considered statistically significant for all comparisons, unless
indicated otherwise.
Results
1H-MR spectra of tissue samples
Fig. 1A shows the
water-suppressed 1H-MR spectra of a cell extract
obtained from an ovarian tumor, using pre-saturation of the water
signal. In this study, we chose to concentrate on the signals of
the metabolites appearing in the aliphatic region of the spectrum,
between 0–5 ppm (Fig. 1B). In order
to compare between the different samples in a quantitative manner,
a common integration method was used. The integral of ATP at 8.25
ppm was assigned the value of one and all other integrals were
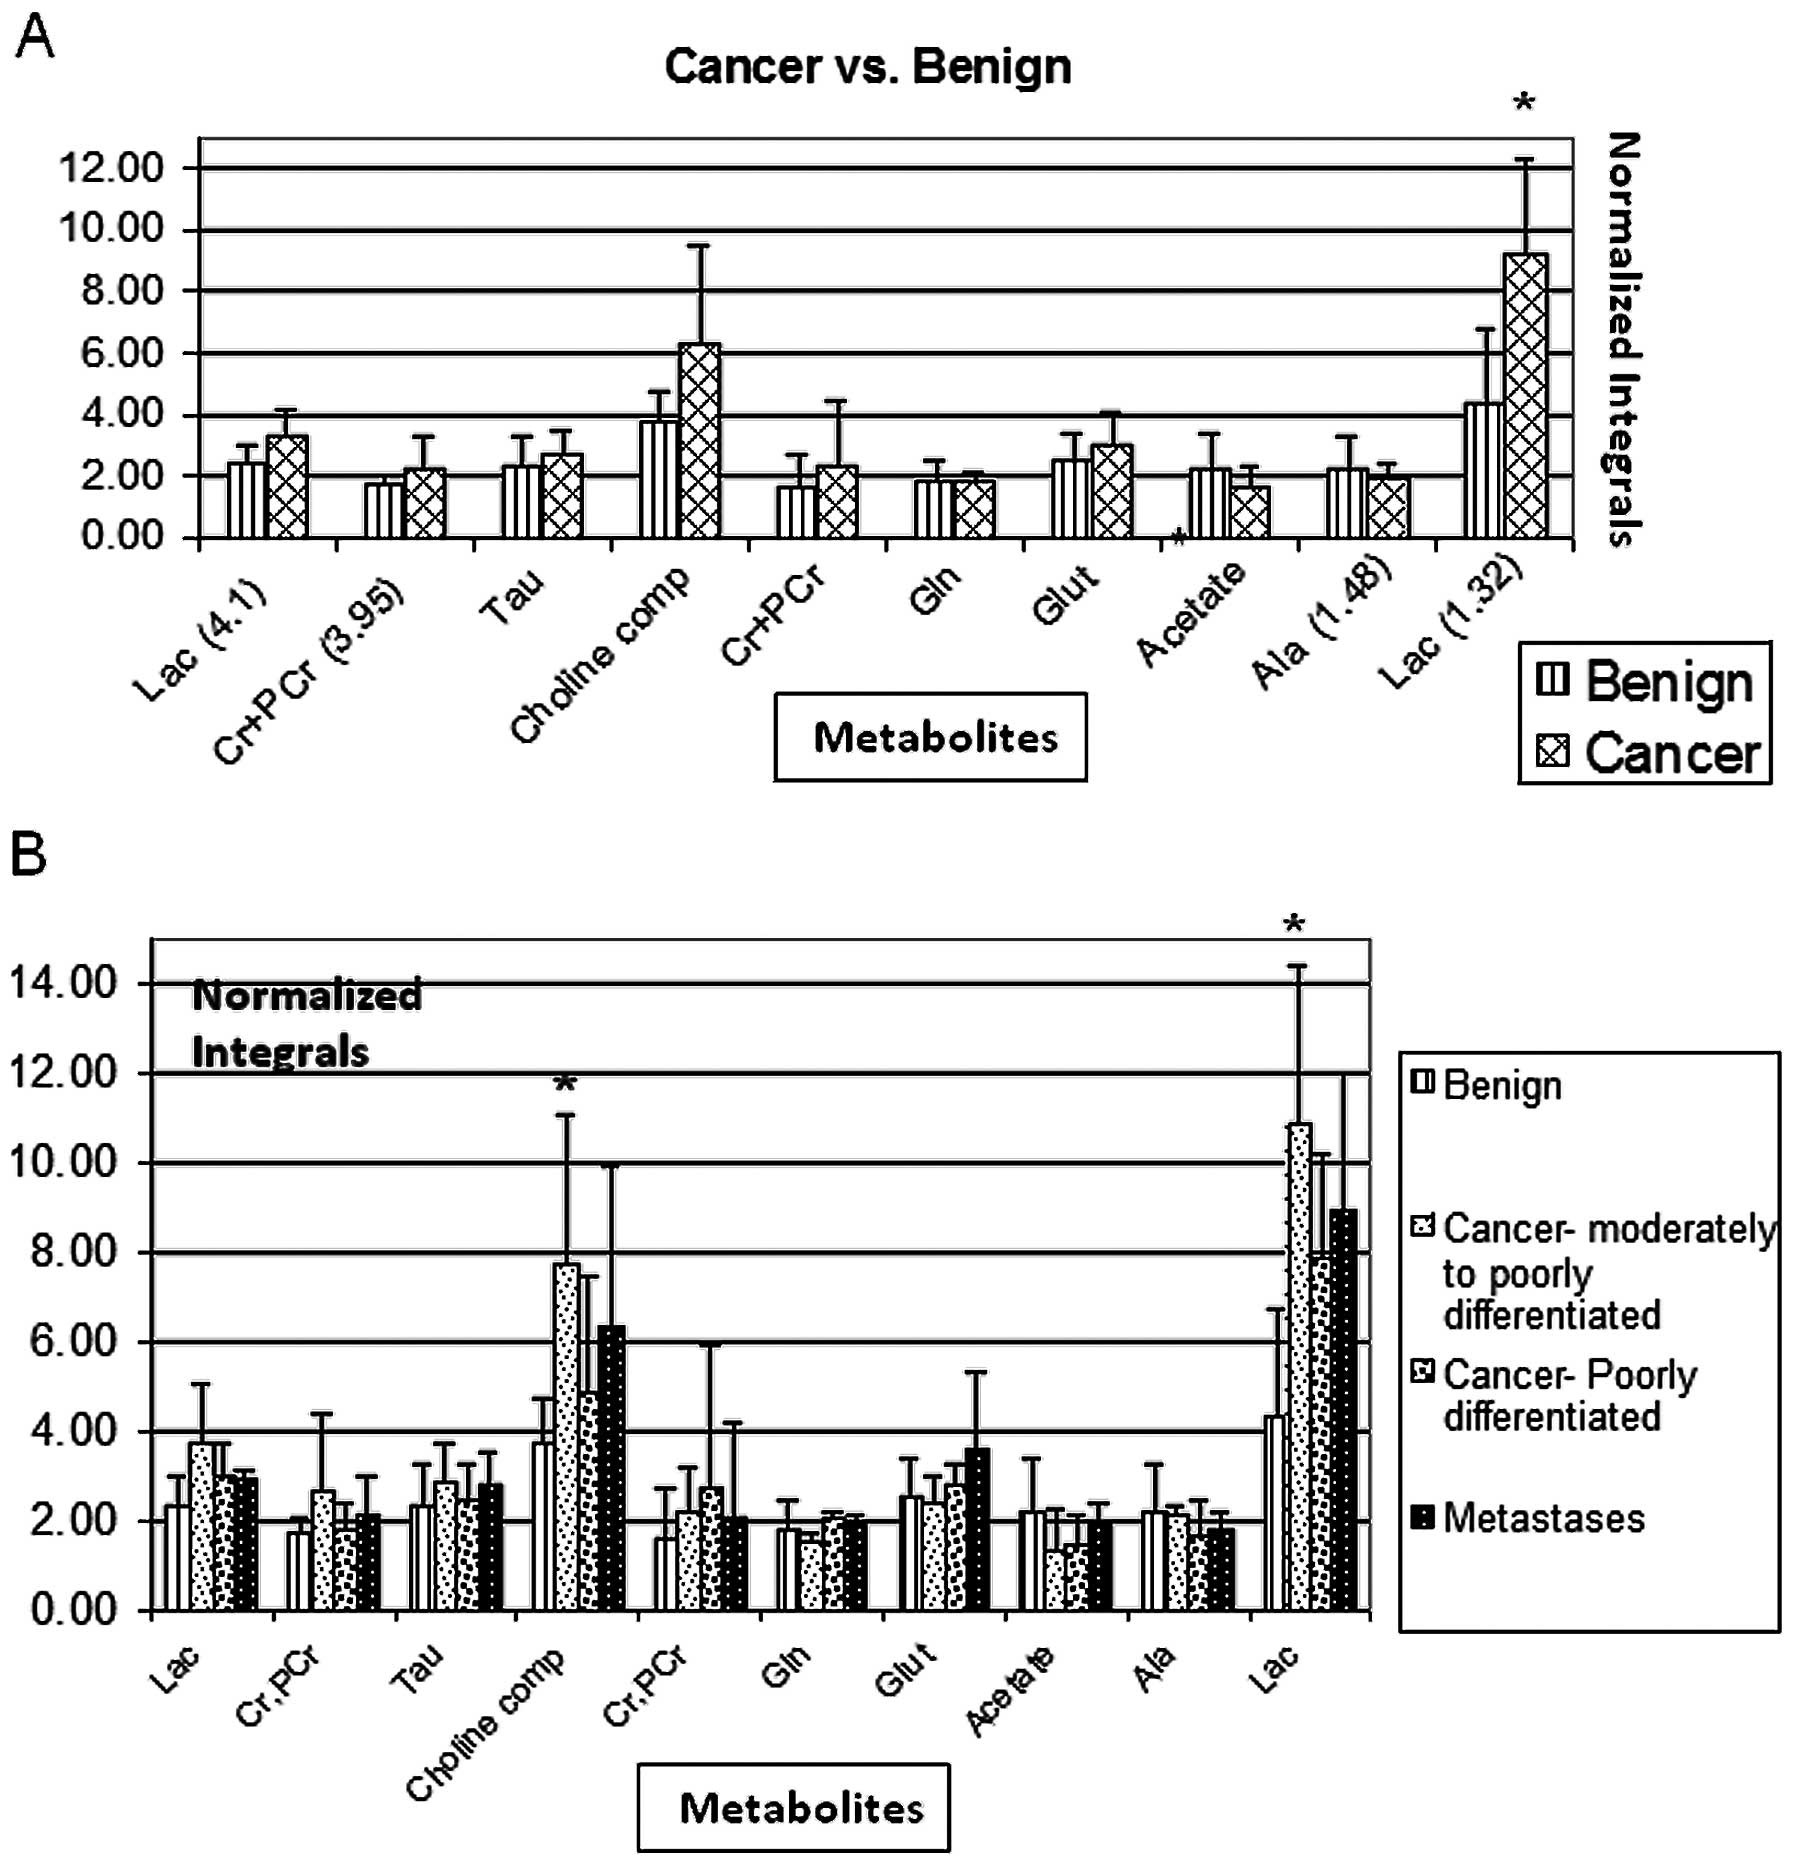
calculated relative to it. 1H-MRS revealed a
significantly higher intracellular lactate signal at 1.32 ppm (but
not at 4.1 ppm) in cells obtained from ovarian tumors as compared
to cells obtained from benign ovarian cysts (P=0.005) (Fig. 2A). The total choline compound signal
was higher in ovarian cancer cells, however, this difference did
not reach statistical significance (P=0.06). No significant
differences in 1H-MR spectra between benign and
malignant samples were noted in other intracellular compounds
(Fig. 2A). After histologic
stratification by the degree of differentiation and by primary
tumor vs. metastasis, the most prominent MR spectral differences in
both lactate (P=0.001) and total choline compounds (P=0.02) between
malignant and benign ovarian tumors were noted in the moderately to
poorly differentiated histologic subtype (Fig. 2B).
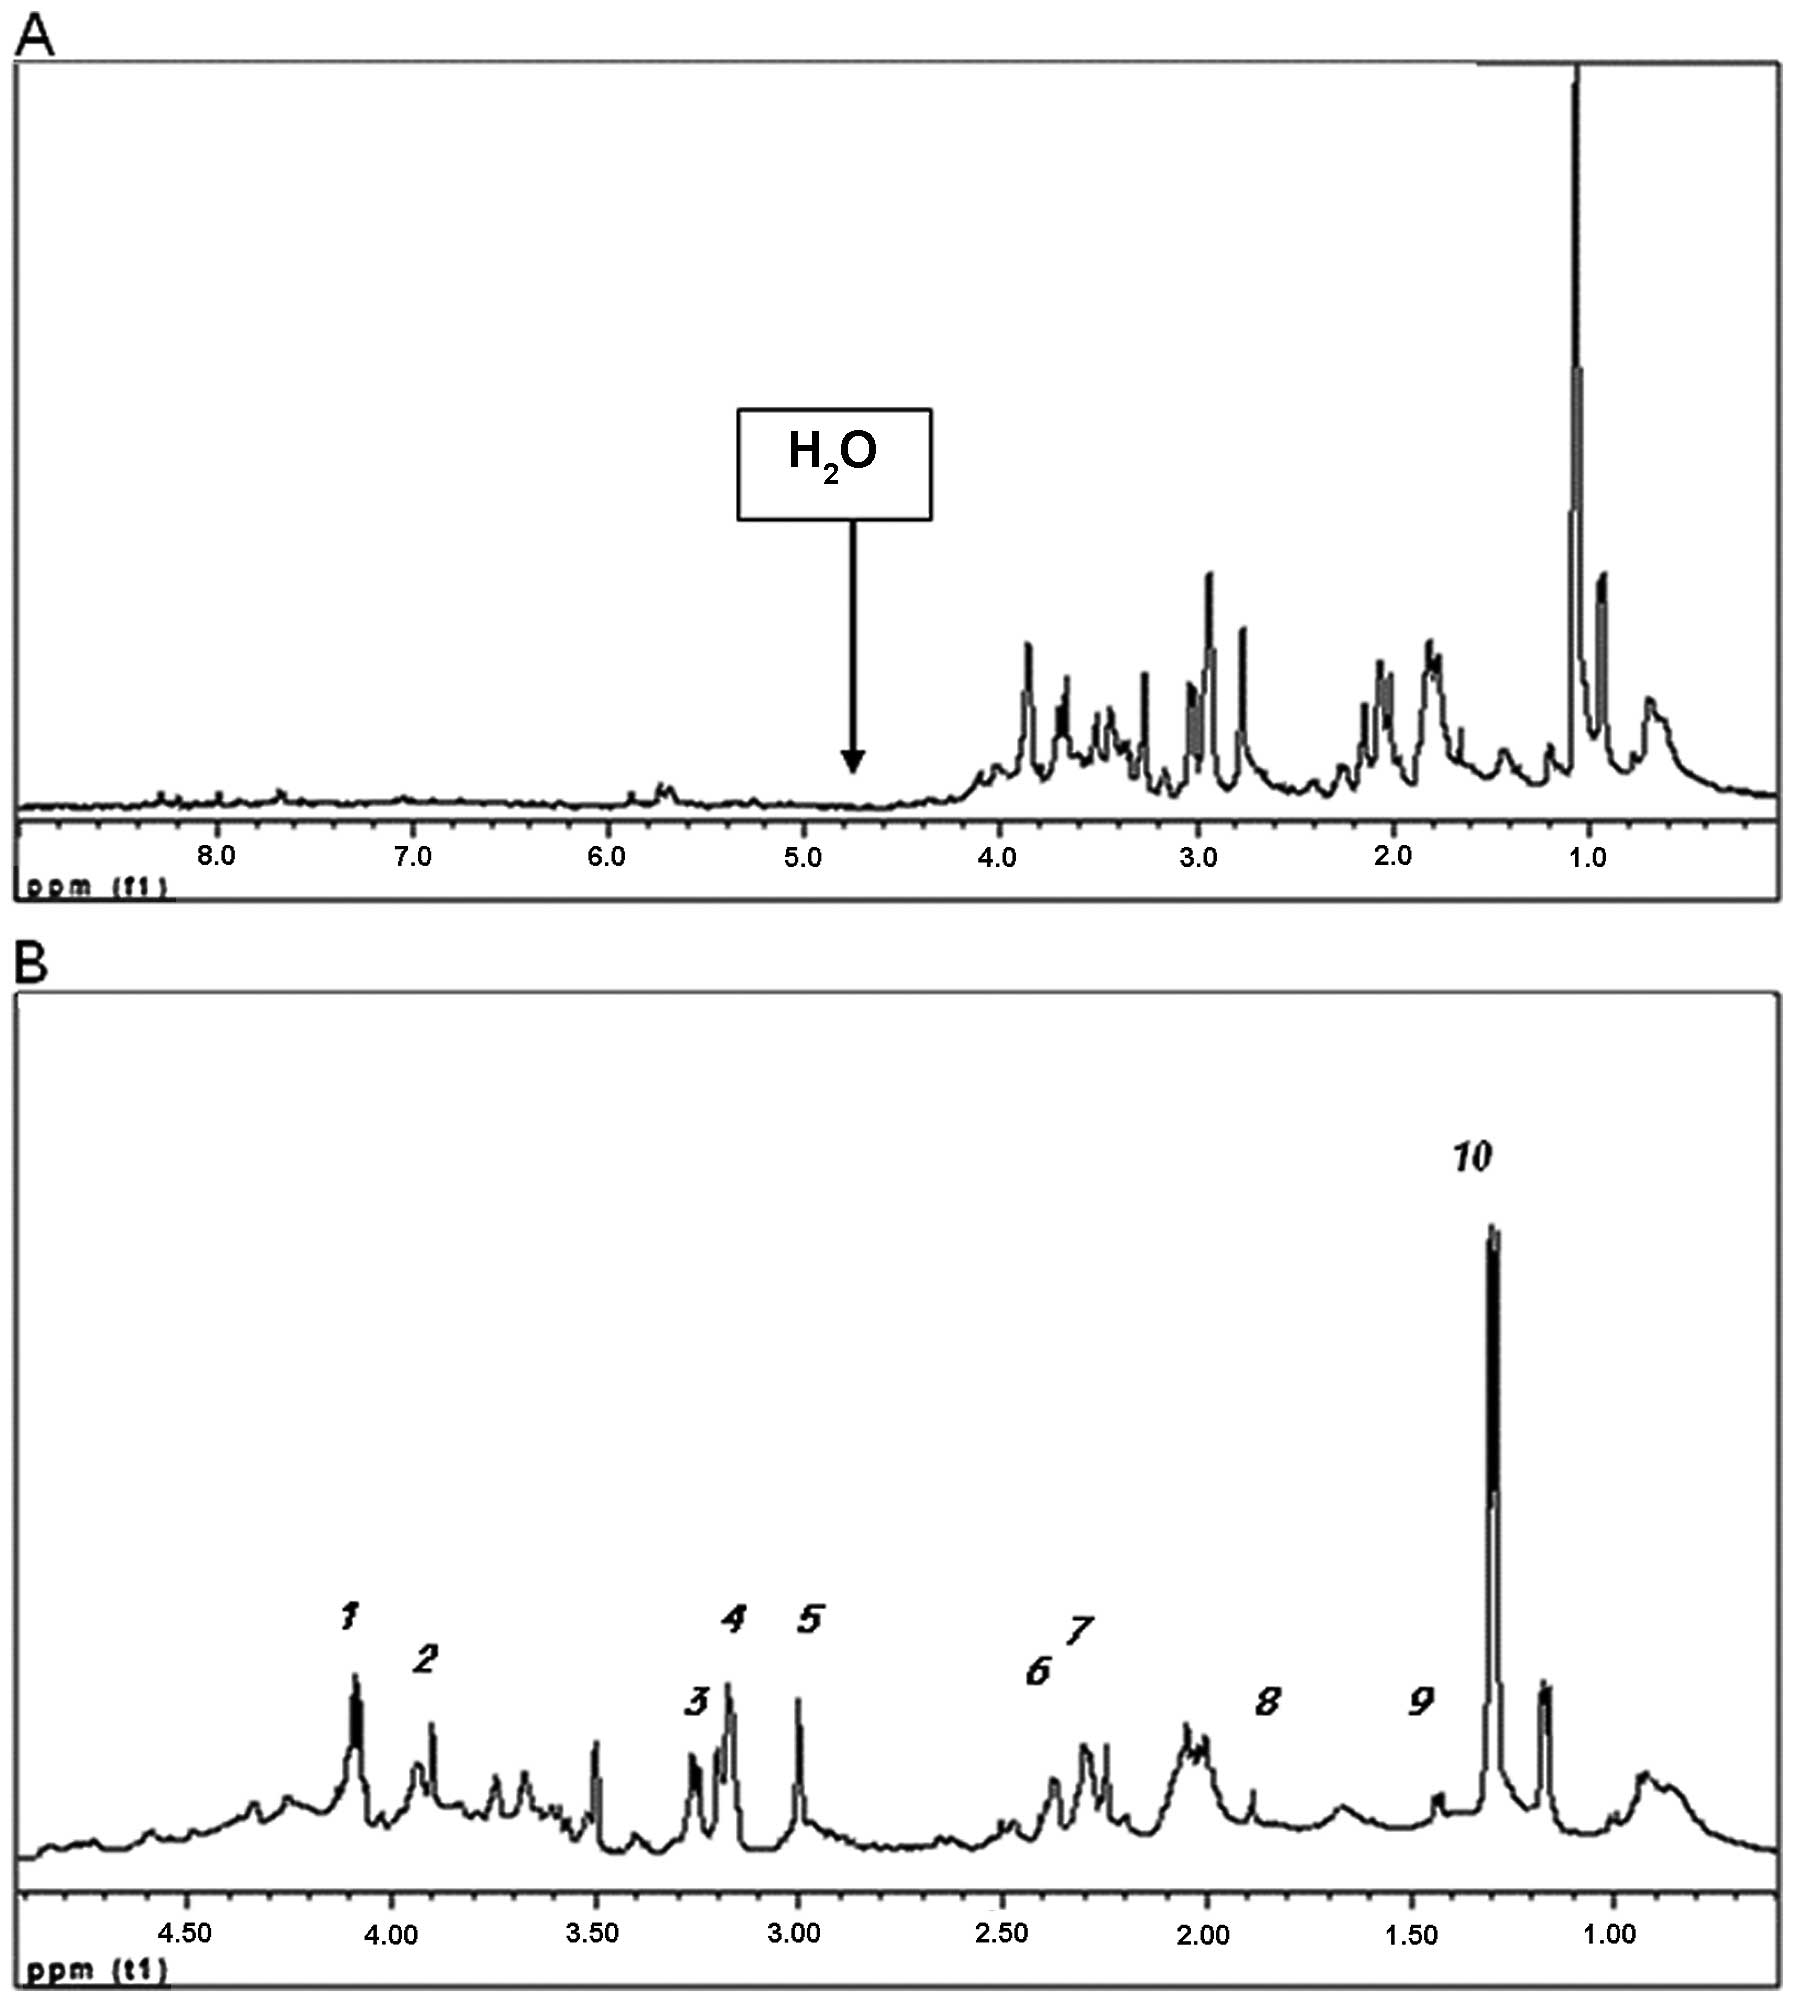 | Figure 1(A) Water-suppressed
1H-NMR spectra of cell extracts from an ovarian tumor.
The water signal was suppressed and the smaller signals were
consequently more observable. (B) Aliphatic region of the
water-suppressed 1H-NMR spectra of tissue sample no.
OCR-14-2. Assignments are: 1, lactate CH2 at 4.12 ppm;
2, creatine + phosphocreatine CH2 at 3.93–3.95 ppm; 3,
taurine N-CH2 at 3.27 ppm; 4, choline compounds (Chol,
PChol, GPC) CH3 at 3.21–3.24 ppm; 5, creatine +
phosphocreatine CH3 at 3.04–3.05 ppm; 6, glutamine
CH2 at 2.45 ppm; 7, glutamate CH2 at 2.34
ppm; 8, acetate CH3 at 1.92 ppm; 9, alanine
CH3 at 1.48 ppm; 10, lactate CH3 at 1.32
ppm. |
Changes in metabolite levels following
chemotherapy
Cells obtained from peritoneal effusions initially
presented a mixture of different type of cells. We, therefore,
performed several clone separations and subcloning in order to
create homogenous cultures adequate for MRS analysis. We eventually
isolated 3 purified clones (designated SC1-SC3) which were either
grown in monolayer cultures or embedded in Matrigel threads. Cell
cultures were incubated with various anti-mitotic drugs at
LC50 (Table II) and
31P-MRS analysis was performed on either cell extracts
[for cells grown in monolayers (CGM)] or on viable cells (for
CEM).
| Table IILC50 of the anti-mitotic
drugs in the cells from peritoneal effusions. |
Table II
LC50 of the anti-mitotic
drugs in the cells from peritoneal effusions.
| Cell line | Paclitaxel | Cisplatin | Carboplatin |
|---|
| SC1 |
| Extracted | 5.6×10⁻⁸
M | 5.2×10⁻⁶
M | 2.5×10⁻⁶
M |
| In Matrigel | 6.1×10⁻⁷
M | 5.1×10⁻⁵
M | 2.4×10⁻⁵
M |
| SC3 |
| Extracted | 2.1×10⁻⁷
M | 2.3×10⁻⁶
M | 1.1×10⁻⁵
M |
| In Matrigel |
2.2×10⁻⁶ | M
2.2×10⁻⁵ M | 1.2×10⁻⁴
M |
The concentration that causes death of 50% of the
cells, LC50, was calculated for either CGM or CEM
(Table II). The LC50
for CEM was higher by one order of magnitude compared to that of
cell extracts. After the cultures were incubated with the drugs at
the LC50 for 48 h, they underwent MRS analysis. In
contrast to CGM, CEM allowed continuous monitoring of the changes
in 31P-MRS spectra following incubation with cytotoxic
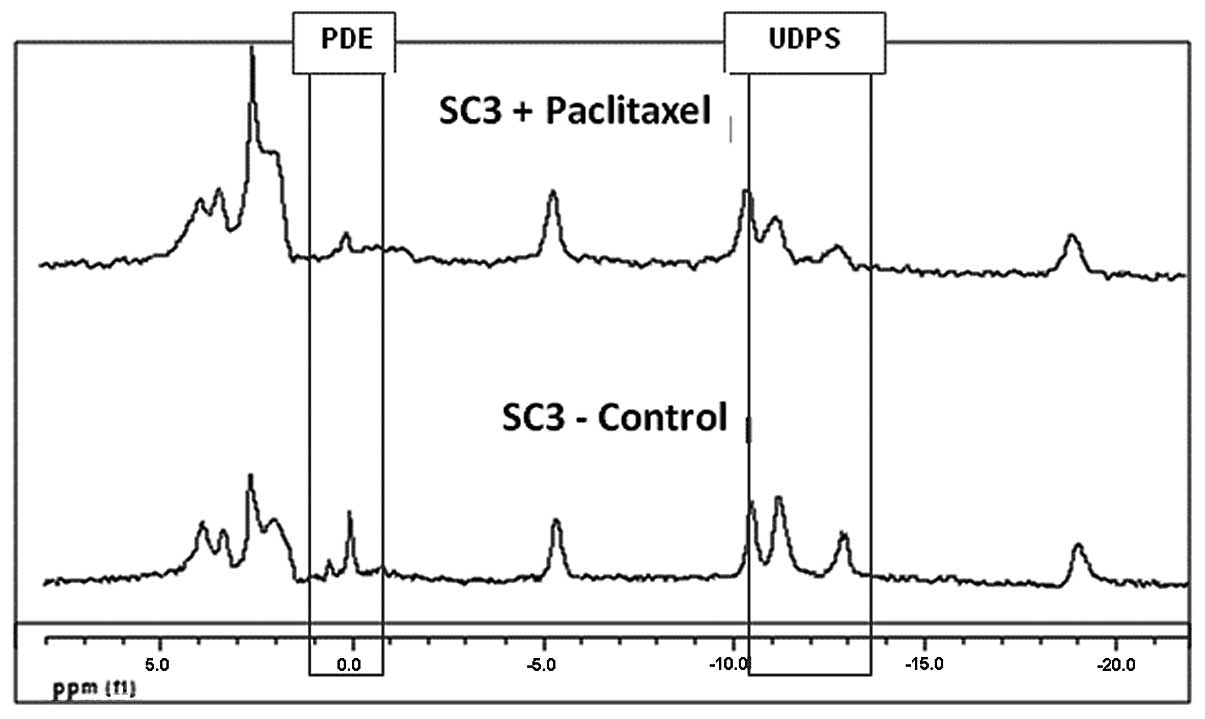
drugs. Fig. 3 demonstrates changes
in MR spectra of viable SC3 CEM following 48 h of incubation with
paclitaxel exhibiting a significant decrease in both
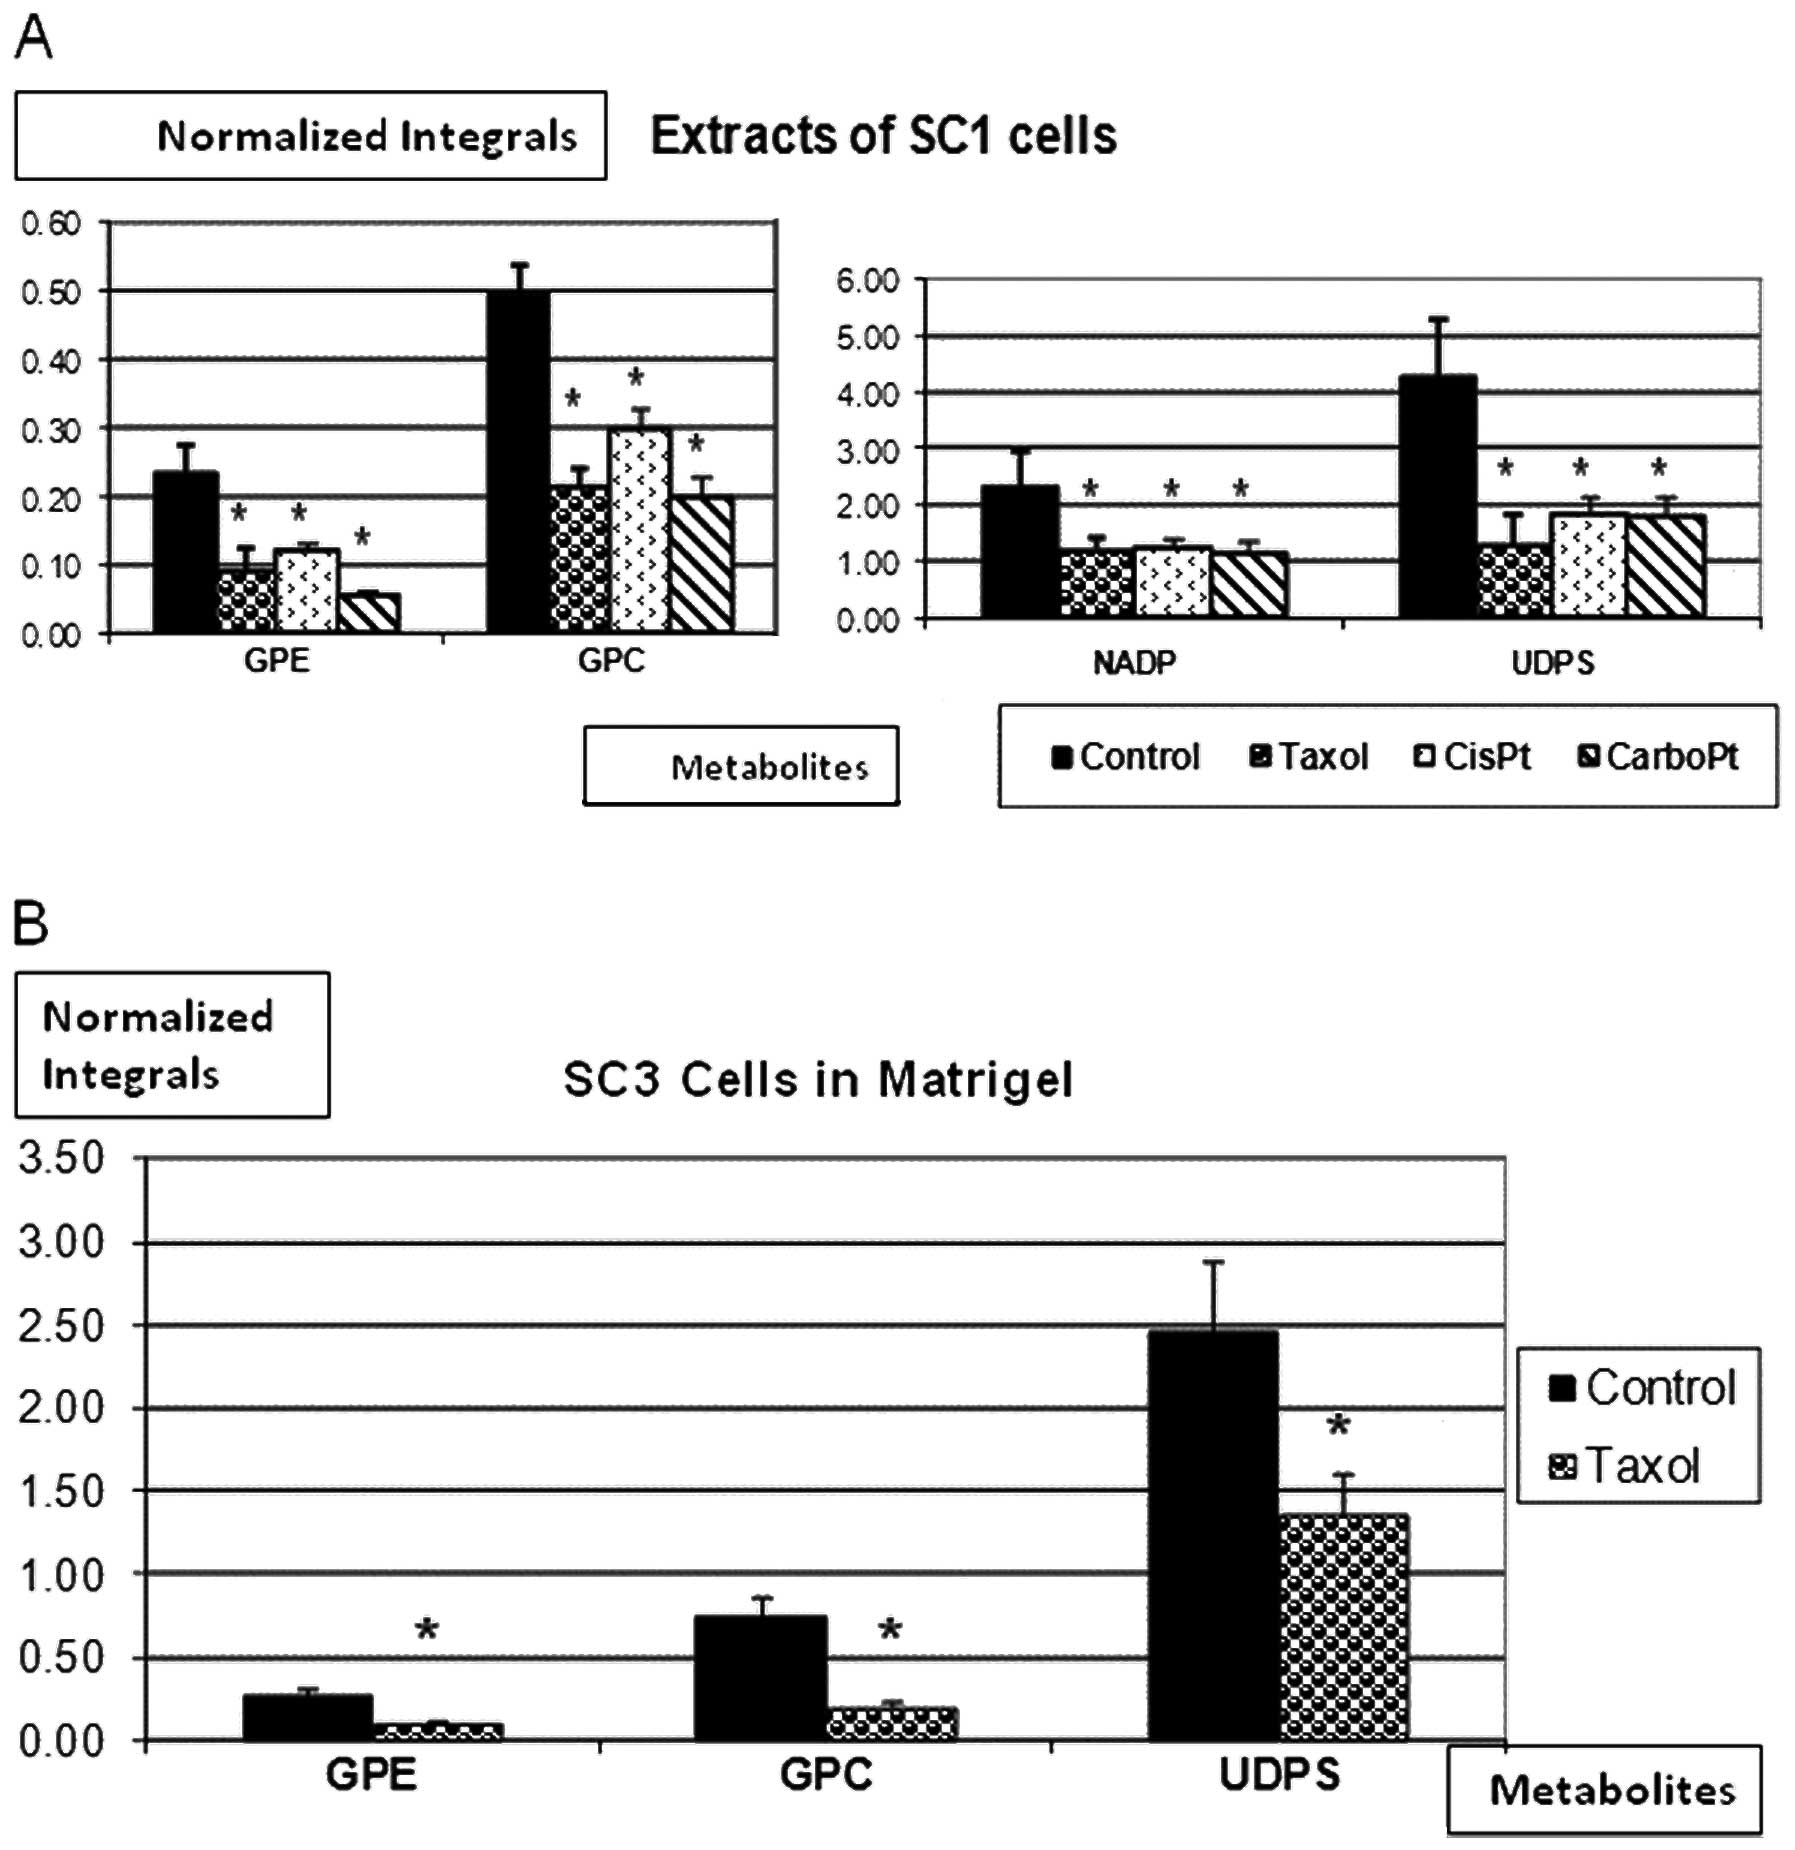
phosphodiesters (PDE) and UDPS signals. Fig. 4A exhibits integrated 31P
spectra of SC1 cell extracts before and after incubation with
either paclitaxel, cisplatin or carboplatin. A significant decrease
in GPE, GPC, nicotine adenine diphosphate (NADP) and UDPS was noted
in response to all 3 anti-mitotic drugs. Fig. 4B shows 31P-MR spectra of
SC3 CEM following incubation with paclitaxel, again exhibiting a
significant decrease in GPE, GPC and UDPS signals.
Discussion
In vivo and ex vivo MRS is extensively
used in biomedical research, particularly for molecular evaluations
regarding diagnosis, treatment and prognosis of human malignancies
(11–13). The clinical application of MRS to
the assessment of breast, brain and prostate cancers has been
investigated for several years (14). In contrast, the study of ovarian
cancer by MRS has been scant and performed mainly by
1H-MRS. One study managed to discriminate malignant
ovarian tumors from normal and benign tissues, based on variations
in cellular lipid, lysine/polyamines and creatine/phosphocreatine
(PCr) ratios (15). In another
study, 1H-MRS of ex vivo specimens was utilized
to distinguish between normal and malignant ovarian tissues
(16). Another study showed that
urinary metabolic profiling using MRS managed to detect early-stage
breast and ovarian cancers (17).
In accordance with these data, the study presented herein, found
that ex vivo1H-MRS can identify significant
metabolic differences between cells obtained from ovarian tumors as
compared to those originating in benign ovarian cysts.
Increased intracellular concentrations of total
Chol-containing compounds have been reported previously in several
types of cancer and were suggested to serve as biomarkers for
cancer both in vivo and ex vivo(18,19).
Significantly altered proton MRS spectra have been detected in the
3.20 to 3.24 ppm region, typical of trimethylammonium head groups
of phosphatidylcholine (PtdChol) precursors and catabolites, such
as GPC, free Chol and PC, in malignant transformation of human
breast (20–22) and prostate epithelial cells
(23). Currently, choline
phospholipid metabolism in ovarian tumors has not yet been studied
extensively, despite preliminary indications of accumulation of
PChol and total Chol in human ovarian tumors and cancer cell lines
(16,24–27).
In accordance with these data, in the current study, we found
higher total choline compound levels in moderately to poorly
differentiated (but not in poorly differentiated or metastatic)
ovarian tumors as compared to benign ovarian cysts. It should be
noted, however, that our 1H-MRS analysis included total
Chol levels only and not individual GPC, phosphocholine (PC) or
free Chol levels.
Abnormal levels of other tissue metabolites, such as
lactate, have also been associated with malignant transformation
(28,29). Increased lactate concentrations may
be attributed to hypoxia, a common characteristic of solid tumors
where lack of oxygen results in glucose being catabolized to
lactate. Using in vitro1H-NMR technique for
analysis of fluids aspirated from ovarian cysts, Massuger et
al(9) showed that the amounts
of compounds such as lactate, 3-hydroxybutylic acid, pyruvic acid
and methionine, were over 6 times higher in malignant as compared
to benign cysts. Indeed, in the study presented herein,
1H-MRS revealed significantly higher intracellular
lactate levels in malignant vs. benign ovarian tumors. Increased
intracellular lactate concentration has been suggested to serve as
a biomarker for tumor aggressiveness since high lactate
concentration has been correlated with increased risk of radiation
resistance, high incidence of distant metastasis and recurrence and
low survival rates in several types of cancer (30,31).
In our study, lactate levels were most prominently elevated in the
moderately to poorly differentiated tumors, a finding which may be
attributed to the higher metabolic rate and energy consumption in
these cells.
In the current study, we found 31P-MRS to
be a useful means for detecting and monitoring metabolic changes in
ovarian cancer cells incubated with anti-mitotic drugs. The
standard cytotoxic drugs investigated were paclitaxel, an
anti-microtubule agent, as well as cisplatin and carboplatin - both
alkylating agents. Following incubation with these drugs, a
decrease in GPE, GPC, NADP and UDPS levels was observed in the SC1
cell line, obtained from cancerous peritoneal effusions.
Furthermore, following incubation with paclitaxel, similar
metabolic changes were observed in another (SC3) cell line. These
findings are in accordance with a previous study which reported
that drug-induced apoptosis causes a decrease in PDE (i.e., GPC and
GPE) levels in cancer cells (32),
however, they are in contrast with our previous findings in breast
cancer cells where a profound elevation in intracellular GPC levels
was observed following exposure to antimicrotubule drugs (8). A possible explanation for these
contradictive findings is that microtubule dynamics may affect the
phospholipid balance differently in different cell types.
Alterations in microtubule stability in response to anti-mitotic
drugs may change local membrane composition and the interaction of
membrane proteins with their lipid environment.
Microtubule-disturbing drugs affect the affinity of agonists to
their membranal receptors (33),
the transmembranal diffusion of phospholipids (34) and PtdChol synthesis (35). GPE and GPC are two of the numerous
cytosolic phospholipid metabolites which reflect the condition of
the cellular phospholipid system and hence may reflect cytoskeletal
stability and dynamics. Both metabolites were found to act as
competitive inhibitors of lysophospholipase activity, thus reducing
lysophospholipid hydrolysis and downregulating the rate of membrane
phospholipid degradation (36).
Acknowledgements
This study was funded by the Zaltzberg Research
Fund, Hadassah Medical Organization, Israel.
Abbreviations:
|
31P
|
phosphorus-31
|
|
ADP
|
adenosine diphosphate
|
|
ATP
|
adenosine triphosphate
|
|
CEM
|
cells embedded in Matrigel
|
|
CGM
|
cells grown in monolayers
|
|
Chol
|
choline
|
|
GPC
|
glycerophosphocholine
|
|
GPE
|
glycerophosphoethanolamine
|
|
MHz
|
megaHertz
|
|
MR
|
magnetic resonance
|
|
MRS
|
magnetic resonance spectroscopy
|
|
NADP
|
nicotine adenine diphosphate
|
|
PBS
|
phosphate-buffered saline
|
|
PCr
|
phosphocreatine
|
|
PC
|
phosphocholine
|
|
PCA
|
perchloric acid
|
|
PDE
|
phosphodiesters
|
|
Pi
|
inorganic phosphate
|
|
PME
|
phosphomonoesters
|
|
PtdChol
|
phosphatidylcholine
|
|
PtdE
|
phosphatidylethanolamine
|
|
PtdI
|
phosphatidylinositol
|
|
PtdS
|
phosphatidylserine
|
|
SPM
|
sphingomyelin
|
|
UDPS
|
uridine diphospho-sugar
|
References
|
1
|
National Cancer Institute. http://www.cancer.gov.
|
|
2
|
Jemal A, Siegel R, Ward E, Hao Y, Xu J and
Thun MJ: Cancer statistics 2009. CA Cancer J Clin. 59:225–249.
2009. View Article : Google Scholar
|
|
3
|
Tennant DA, Durán RV, Boulahbel H and
Gottlieb E: Metabolic transformation in cancer. Carcinogenesis.
30:1269–1280. 2009. View Article : Google Scholar : PubMed/NCBI
|
|
4
|
Vander Heiden MG, Cantley LC and Thompson
CB: Understanding the Warburg effect: the metabolic requirements of
cell proliferation. Science. 324:1029–1033. 2009.PubMed/NCBI
|
|
5
|
Wise DR, DeBerardinis RJ, Mancuso A, et
al: Myc regulates a transcriptional program that stimulates
mitochondrial glutaminolysis and leads to glutamine addiction. Proc
Natl Acad Sci USA. 105:18782–18787. 2008. View Article : Google Scholar : PubMed/NCBI
|
|
6
|
Zupke C and Foy B: Nuclear magnetic
resonance analysis of cell metabolism. Curr Opin Biotechnol.
6:192–197. 1995. View Article : Google Scholar : PubMed/NCBI
|
|
7
|
Bel JD and Bhakoo KK: Metabolic changes
underlying 31P MR spectral alterations in human hepatic
tumours. NMR Biomed. 11:354–359. 1998.
|
|
8
|
Sterin M, Cohen JS, Mardor Y, Berman E and
Ringel I: Levels of phospholipid metabolites in breast cancer cells
treated with antimitotic drugs: a 31P-magnetic resonance
spectroscopy study. Cancer Res. 61:7536–7543. 2001.PubMed/NCBI
|
|
9
|
Massuger LF, van Vierzen PBJ, Engelke U,
Heerschap A and Wevers RA: 1H-magnetic resonance
spectroscopy: a new technique to discriminate benign from malignant
ovarian tumors. Cancer. 82:1726–1730. 1998. View Article : Google Scholar : PubMed/NCBI
|
|
10
|
Boss EA, Moolenaar SH, Massuger LFAG,
Boonstra H, Engelke UFH, de Jong JGN and Wevers RA: High-resolution
proton nuclear magnetic resonance spectroscopy of ovarian cyst
fluid. NMR Biomed. 13:297–305. 2000. View Article : Google Scholar : PubMed/NCBI
|
|
11
|
Podo F: Tumour phospholipid metabolism.
NMR Biomed. 12:413–439. 1999. View Article : Google Scholar : PubMed/NCBI
|
|
12
|
Tosi R and Tugnoli V: Nuclear Magnetic
Resonance Spectroscopy in the Study of Neoplastic Tissue. Nova
Science Publishers Inc.; New York, NY: pp. 1–444. 2005
|
|
13
|
Gillies RJ and Morse DL: In vivo magnetic
resonance spectroscopy in cancer. Annu Rev Biomed Eng. 7:287–326.
2005. View Article : Google Scholar : PubMed/NCBI
|
|
14
|
Kwock L, Smith JK, Castillo M, et al:
Clinical role of proton magnetic resonance spectroscopy in
oncology: brain, breast, and prostate cancer. Lancet Oncol.
7:859–868. 2006. View Article : Google Scholar : PubMed/NCBI
|
|
15
|
Mackinnon WB, Russell P, May GL and
Mountford CE: Characterization of human ovarian epithelial tumors
(ex vivo) by proton magnetic resonance spectroscopy. Int J Gynecol
Cancer. 5:211–221. 1995. View Article : Google Scholar : PubMed/NCBI
|
|
16
|
Wallace JC, Raaphorst GP, Somorjai RL, et
al: Classification of 1H MR spectra of biopsies from
untreated and recurrent ovarian cancer using linear discriminant
analysis. Magn Reson Med. 38:569–576. 1997.
|
|
17
|
Slupsky CM, Steed H, Wells TH, et al:
Urine metabolite analysis offers potential early diagnosis of
ovarian and breast cancers. Clin Cancer Res. 16:5835–5841. 2010.
View Article : Google Scholar : PubMed/NCBI
|
|
18
|
Podo F, Canevari S, Canese R, Pisanu ME,
Ricci A and Iorio E: MR evaluation of response to targeted
treatment in cancer cells. NMR Biomed. 24:648–672. 2011.PubMed/NCBI
|
|
19
|
Katz-Brull R, Lavin PT and Lenkinski RE:
Clinical utility of proton magnetic resonance spectroscopy in
characterizing breast lesions. J Natl Cancer Inst. 94:1197–1203.
2002. View Article : Google Scholar : PubMed/NCBI
|
|
20
|
Aboagye EO and Bhujwalla ZM: Malignant
transformation alters membrane choline phospholipid metabolism of
human mammary epithelial cells. Cancer Res. 59:80–84. 1999.
|
|
21
|
Glunde K, Jie C and Bhujwalla M: Molecular
causes of the aberrant choline phospholipid metabolism in breast
cancer. Cancer Res. 64:4270–4276. 2004. View Article : Google Scholar : PubMed/NCBI
|
|
22
|
Glunde K, Ackerstaff E, Natarajan K,
Artemov D and Bhujwalla ZM: Real-time changes in 1H and
31P NMR spectra of malignant human mammary epithelial
cells during treatment with the anti-inflammatory agent
indomethacin. Magn Reson Med. 48:819–825. 2002.
|
|
23
|
Ackerstaff E, Pflug BR, Nelson JB and
Bhujwalla ZM: Detection of increased choline compounds with proton
nuclear magnetic resonance spectroscopy subsequent to malignant
transformation of human prostatic epithelial cells. Cancer Res.
61:3599–3603. 2001.
|
|
24
|
Iorio E, Mezzanzanica D, Alberti P, et al:
Alterations of choline phospholipid metabolism in ovarian tumor
progression. Cancer Res. 65:9369–9376. 2005. View Article : Google Scholar : PubMed/NCBI
|
|
25
|
Canese R, PIsanu ME, Mezzanzanica D, et
al: Characterisation of in vivo ovarian cancer models by
quantitative 1H magnetic resonance spectroscopy and
diffusion-weighted imaging. NMR Biomed. 25:632–642. 2012.PubMed/NCBI
|
|
26
|
Esseridou A, Di Leo G, Sconfienza LM, et
al: In vivo detection of choline in ovarian tumors using 3D
magnetic resonance spectroscopy. Invest Radiol. 46:377–382. 2011.
View Article : Google Scholar : PubMed/NCBI
|
|
27
|
Iorio E, Ricci A, Bagnoli M, Pisanu ME, et
al: Activation of phosphtidylcholine cycle enzymes in human
epithelial ovarian cancer cells. Cancer Res. 70:2126–2135. 2010.
View Article : Google Scholar : PubMed/NCBI
|
|
28
|
Cheng LL, Chang IW, Smith BL and Gonzalez
RG: Evaluating human breast ductal carcinomas with high-resolution
magic-angle spinning proton magnetic resonance spectroscopy. J Magn
Reson. 135:194–202. 1998. View Article : Google Scholar
|
|
29
|
Tessem MB, Swanson MG, Keshari KR, et al:
Evaluation of lactate and alanine as metabolic biomarkers of
prostate cancer using 1H HR-MAS spectroscopy of biopsy
tissues. Magn Reson Med. 60:510–516. 2008. View Article : Google Scholar : PubMed/NCBI
|
|
30
|
Brizel DM, Schroeder T, Scher RL, Walenta
S, Clough RW, Dewhirst MW and Mueller-Klieser W: Elevated tumor
lactate concentrations predict for an increased risk of metastases
in head-and-neck cancer. Int J Radiat Oncol Biol Phys. 51:349–353.
2001. View Article : Google Scholar : PubMed/NCBI
|
|
31
|
Walenta S, Wetterling M, Lehrke M,
Schwickert G, Sundfor K, Rofstad EK and Mueller-Klieser W: High
lactate levels predict likelihood of metastases, tumor recurrence,
and restricted patient survival in human cervical cancers. Cancer
Res. 60:916–921. 2000.
|
|
32
|
Huang Z, Tong Y, Wang J and Huang Y: NMR
studies of the relationship between the changes of membrane lipids
and the cisplatin resistance of A549/DDP cells. Cancer Cell Int.
3:52003. View Article : Google Scholar : PubMed/NCBI
|
|
33
|
Hanauske AR, Depenbrock H, Shirvani D and
Rastetter J: Effects of the microtubule-disturbing agents docetaxel
(Taxotere), vinblastine and vincristine on epidermal growth
factor-receptor binding of human breast cancer cell lines in vitro.
Eur J Cancer. 30A:1688–1694. 1994. View Article : Google Scholar
|
|
34
|
Chahine JMEH, Cribier S and Devaux PF:
Phospholipid transmembrane domains and lateral diffusion in
fibroblasts. Proc Natl Acad Sci USA. 90:447–451. 1993. View Article : Google Scholar : PubMed/NCBI
|
|
35
|
Pike MC, Kredich NM and Snyderman R:
Influence of cytoskeletal assembly on phosphatidylcholine synthesis
in intact phagocytic cells. Cell. 20:373–379. 1980. View Article : Google Scholar : PubMed/NCBI
|
|
36
|
Fallbrook A, Turenne SD, Mamalias N, Kish
SJ and Ross BM: Phosphatidylcholine and phosphatidylethanolamine
metabolites may regulate brain phospholipid catabolism via
inhibition of lysophospholipase activity. Brain Res. 834:207–210.
1999. View Article : Google Scholar
|