Introduction
Biochemical failure and local recurrences of
prostate cancer after radiotherapy could be reduced by escalation
of the radiation dose to the prostate (1,2). As
local recurrences frequently originate at the site of the
macroscopic tumor, the focus for further dose escalation has to be
on focal tumor areas most in need of aggressive treatment (3–5).
Based on recent studies, we know that
hypoxia-inducible factor (HIF) may be related to prostate cancer
outcome, as higher HIF expression was found to be associated with
increased risk of biochemical failure and with reduced survival
(6–8). Because of this relationship, tumor
areas with high HIF expression may be candidates for focal
boost.
HIF is a transcription factor which can be regulated
by hypoxia-dependent and hypoxia-independent mechanisms. The
hypoxia-dependent mechanism has been the most investigated; levels
of HIFα subunits in the cell increase under hypoxic conditions
resulting from an imbalance between oxygen demand and oxygen
delivery to the tissue. In this pathway, HIF transcription factors
act as key regulators of the cellular response to hypoxia and
modulate the expression of genes involved in processes such as cell
metabolism, proliferation and angiogenesis. The hypoxia-independent
pathway of HIF-regulation is the induction of HIFα expression by
increased oncogenic signaling in cancer cells (9). Most studies have focused on the
presence of HIF-1α. However, HIF-2α may play an additional and
important role in prostate cancer (8,9). The
role of HIF-2α in prostate cancer is still underexposed and its
distribution in whole-mount prostate histology not yet described.
This is the first study describing the distribution of HIF-2α
expression in whole-mount prostate histology.
For the non-invasive detection of prostate tumor
areas, dynamic contrast-enhanced magnetic resonance imaging
(DCE-MRI) is one of the tools currently used in clinical practice
(10). The aim of the present study
was to investigate the relation of the DCE-MRI parameters
Ktrans and kep with the immunohistochemical
expression of HIF-1α and HIF-2α in whole-mount prostate
histology.
Materials and methods
Patients
The study was approved by the Institutional Review
Board of the University Medical Center Utrecht, and informed
consent was obtained from all patients. Twenty patients were
enrolled in the study. All patients had biopsy-confirmed prostate
cancer and were scheduled for a robotic-assisted laparoscopic
prostatectomy (RALP). None of the patients was treated with
androgen deprivation therapy. Five patients were excluded from
analysis, due to the unavailability of pathological material in 2
patients, considerable motion during MR image acquisition in 1
patient, and in 2 patients the prostate specimen was severely
deformed which hampered accurate registration. Clinical
characteristics of the 15 eligible patients are shown in Table I.
 | Table IPatient characteristics. |
Table I
Patient characteristics.
| Characteristics | Value |
|---|
| Patient no. | 15 |
| Patient age
(years)a | 63 (48–74) |
| PSA level
(ng/ml)a | 12 (5–29) |
| Pathological tumor
stageb |
| T2a | 2 |
| T2c | 5 |
| T3a | 8 |
| Gleason scoreb |
| 3+3=6 | 2 |
| 3+4=7 | 10 |
| 3+5=8 | 3 |
| Tumor no. | 34 |
| <0.22
cm3 | 14 |
| >0.22
cm3 | 20 |
| Tumor volumea | 0.73 (0.01–9.36) |
| <0.22
cm3 | 0.17 (0.01–0.21) |
| >0.22
cm3 | 1.59 (0.42–9.36) |
MR imaging
Multi-parametric imaging was performed on a 3T
MRI-scanner (Philips Achieva, Best, The Netherlands), including a
T2w sequence and DCE-MRI. No endorectal coil was used. T2w images
were acquired with a fast spin-echo sequence, TR/TE=8396/120 msec,
echo train length 13, acquisition matrix 256×256, field of view
(FOV)=20 cm, slice thickness 3 mm, slice gap 1 mm. The DCE-MRI
protocol consisted of a 3D spoiled gradient echo sequence (20
transverse slices, 2.5-mm slice thickness, TR/TE=4.0/1.7 msec, flip
angle 8°, FOV=40 cm, acquisition matrix 160×128). Scans were
repeated 120 times at 2.5-sec intervals. A concentration of 0.1
ml/kg of gadobutrol (1.0 M) (Gadovist®, Schering AG,
Berlin, Germany) contrast was injected at 2 ml/sec, followed by a
saline flush. The tracer kinetics data were analyzed with the Tofts
model, as previously described (11). This yielded 3D absolute
Ktrans and kep parameter maps. A generic
arterial input function (AIF) was used for all patients, due to
measurement errors on the patient-specific input functions. To
account for patient-specific differences in AIF, DCE-MRI parameters
were normalized to the median value in normal PZ for correlation
analyses (12).
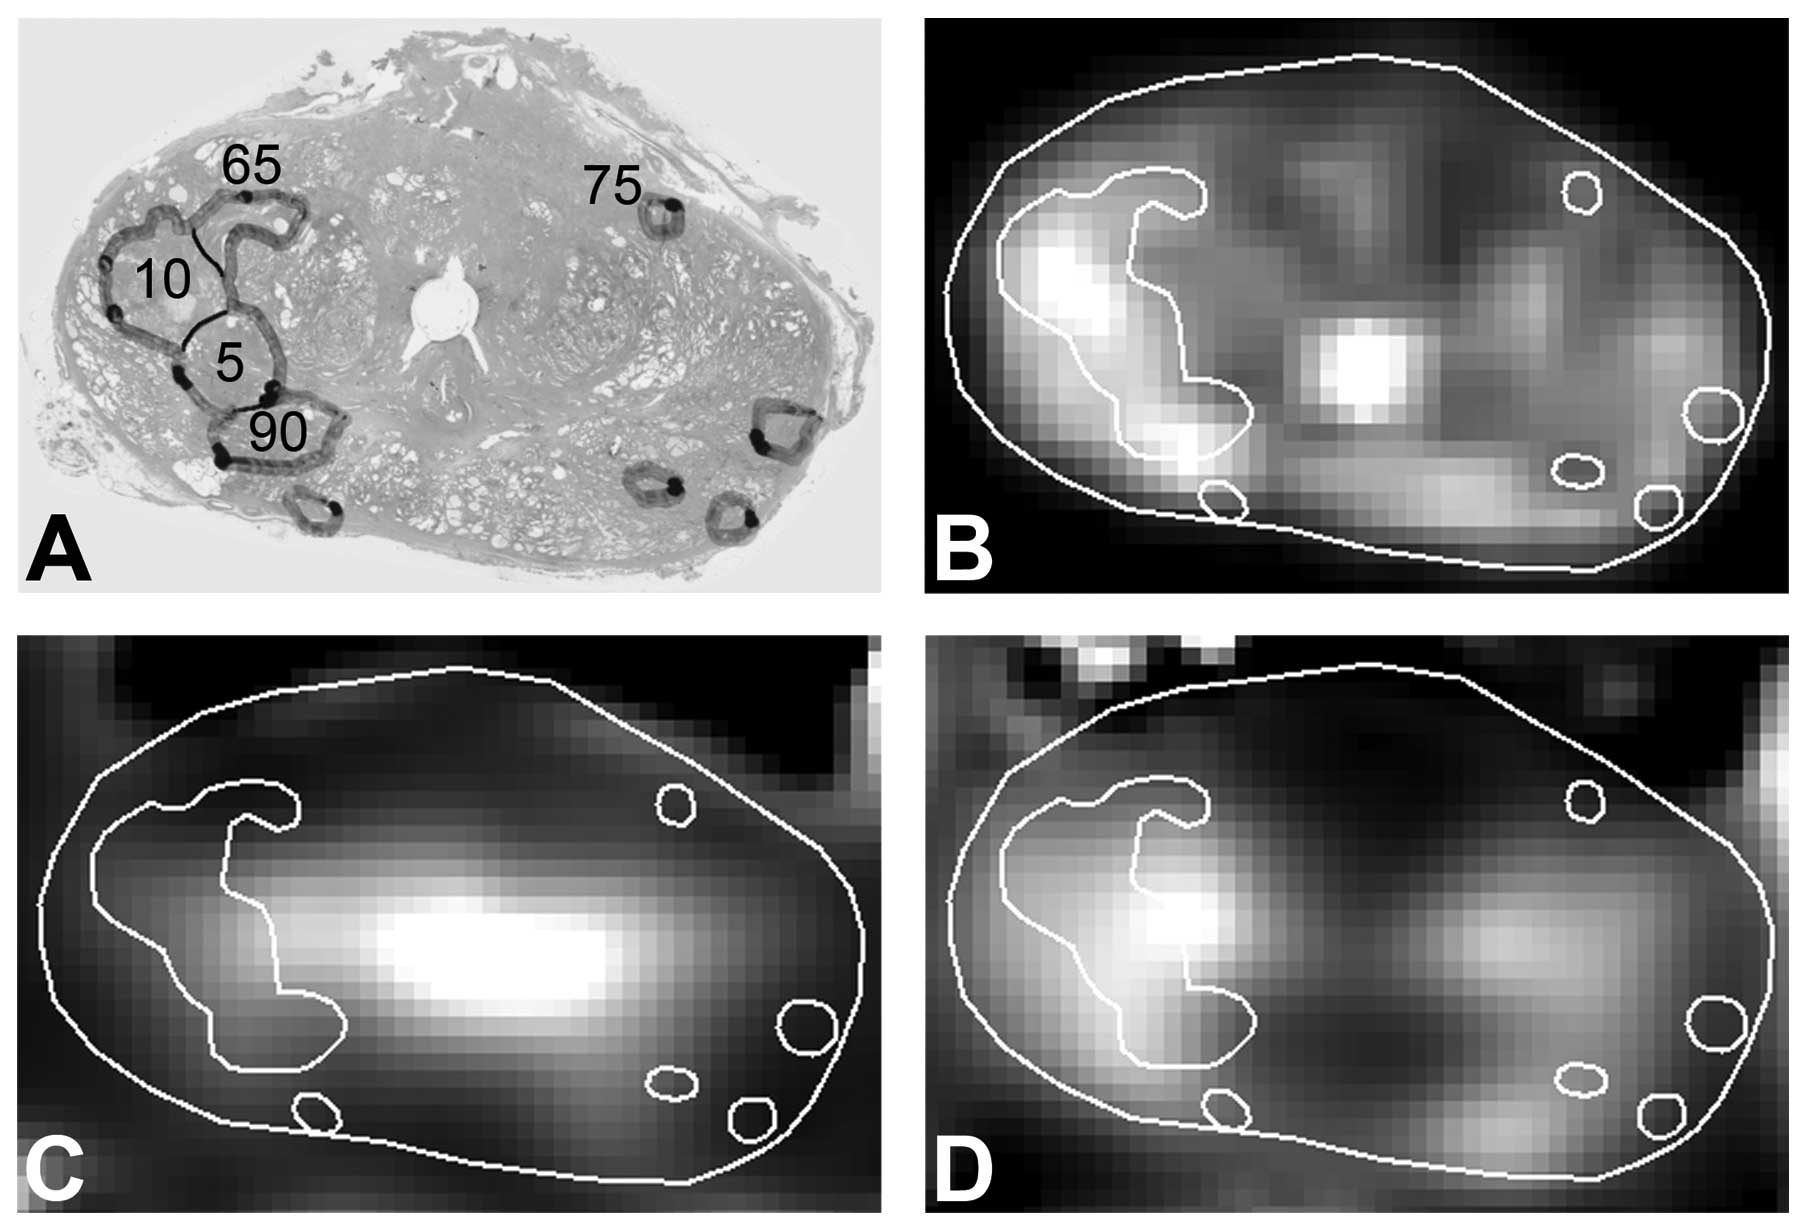
MRI-pathology registration
After prostatectomy, the prostate specimens were
processed and registered as previously described (12). In short, the prostate was cut into
3-mm thick slices, and whole-mount microscopic slices stained with
hematoxylin and eosin (H&E) were created. Tumor areas were
delineated by a pathologist and assigned with a Gleason score. The
registration process was performed in three steps: i)
reconstruction of the prostate from 3-mm macroscopic slices, ii)
registration of microscopic slices to the reconstructed prostate,
and iii) registration between the reconstructed prostate and the
T2w MR images. On average, the registration error between MR images
and histopathological data was approximately one voxel
(reconstructed voxel size 2.5×2.5×2.5 mm3) (12).
Immunohistochemistry
After deparaffination and rehydration, endogenous
peroxidase was blocked and antigen retrieval was performed. For
microvessel density analysis, slides were incubated for 1 h at room
temperature with a monoclonal mouse anti-human CD31 antibody (1:50)
(Leica Microsystems, Wetzlar, Germany). For HIF-1α and HIF-2α,
slides were incubated overnight at 4°C using a monoclonal mouse
anti-human HIF-1α antibody (1:50) (BD Transduction Laboratories,
Lexington, KY, USA) and a polyclonal rabbit anti-human HIF-2α
antibody (1:700) (Novus Biologicals, Littleton, CO, USA),
respectively. Subsequently, slides were incubated with a secondary
antibody (CD31 and HIF-1α: Novolink Polymer Detection System; Leica
Microsystems and HIF-2α: BrightVision; Immunologic, Duiven, The
Netherlands). All slides were developed with diaminobenzidine
followed by hematoxylin counterstaining.
Tissue evaluation
Three whole-mount microscopic slides per patient
containing normal tissue, the index tumor and probable secondary
tumors, were chosen for further analysis. CD31-stained slides were
digitized at microscopic resolution and analyzed in ImageScope
v10.0 using the Microvessel Analysis Algorithm v1 (Aperio
Technologies, Vista, CA, USA) to assess the microvessel density
(MVD). To compensate for variation in staining intensity, the
settings of the algorithm were evaluated qualitatively and
optimized for every batch by adjusting on test regions.
Scoring of HIF-1α and HIF-2α was performed by
consensus of two observers. The percentage of positively stained
nuclei in whole tumor regions was estimated per slide, ignoring
diffuse cytoplasmic staining.
Regions of interest (ROIs) were defined based on the
HIF-expression pattern. Areas within a tumor with a distinct
HIF-expression pattern were investigated as separate regions, which
could result in more regions of interest within a single tumor.
This was carried out separately for HIF-1α and HIF-2α.
Statistical analysis
Median Ktrans, kep and MVD
were calculated for each ROI. For analysis of Ktrans,
kep and MVD, ROIs were selected within tumors with a
volume >0.22 cm3 (diameter >3 voxels = 7.5 mm), as
partial volume effects and registration errors have a large
influence on smaller tumors. Normalized DCE-MRI parameters were
used for statistical analysis to account for interpatient
variability. Differences between ROIs were assessed with the
Mann-Whitney U and Kruskal-Wallis test, and Spearman’s correlation
coefficients were calculated (SPSS v20, SPSS Inc., Chicago, IL,
USA). P-values ≤0.05 were considered to indicate statistically
significant differences.
Results
Of the 15 patients, most showed HIF-1α and
HIF-2α-positive tumor areas (Table
II). The distribution of HIF expression was highly
heterogeneous: i) negative and positive tumors were found within
patients, ii) negative and positive areas were found within tumors,
and iii) within a single tumor the range in HIF-positivity could be
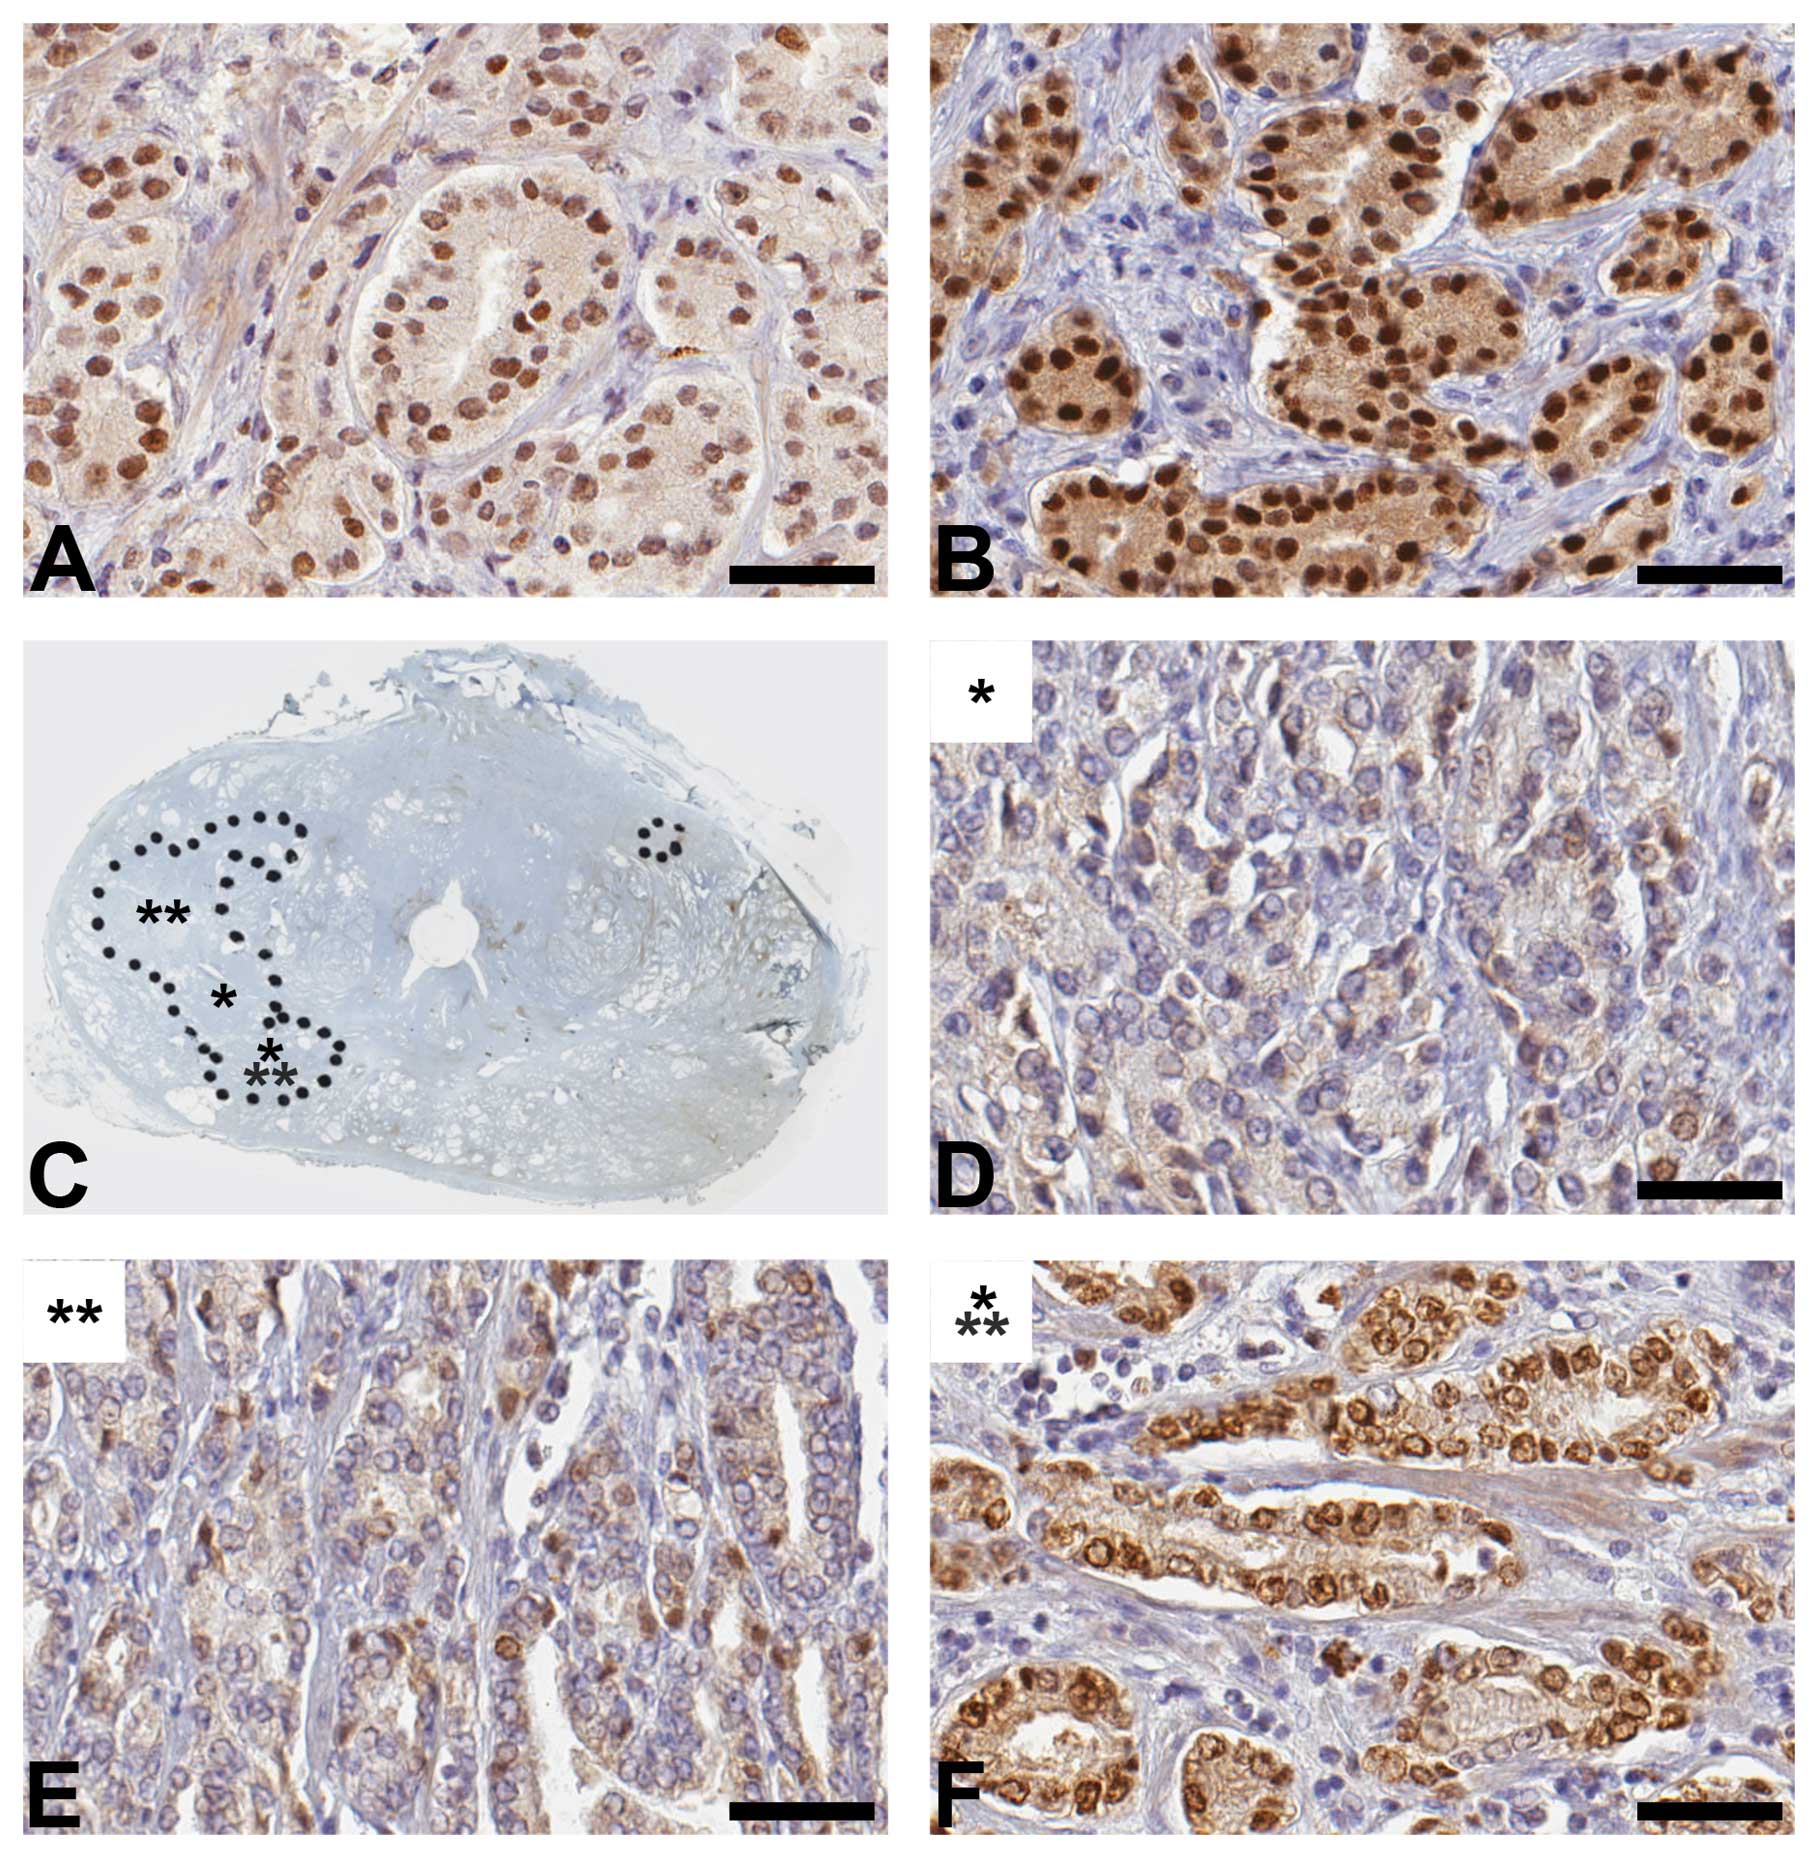
large with 5–35% for HIF-1α and 2–90% for HIF-2α. In Fig. 1, this heterogeneous distribution is
illustrated for HIF-2α. Tumor areas showing HIF expression, could
either be very small or comprise the entire tumor. There was a
marked difference in the distribution of HIF-1α and HIF-2α. HIF-1α
expression was often present focally in small regions within
tumors, while HIF-2α frequently was expressed in whole tumor
regions. Furthermore, the maximum HIF-1α expression was 50%,
whereas HIF-2α ranged to 90%. HIF expression was sometimes found in
normal tissue, but was not taken into account.
| Table IIDistribution of HIF-1α and HIF-2α in
patients and tumors. |
Table II
Distribution of HIF-1α and HIF-2α in
patients and tumors.
| | HIF-1α [n/total
(%)] | HIF-2α [n/total
(%)] |
|---|
| Patients | HIF-positive | 12/15 (80) | 14/15 (93) |
| Tumors |
| Total | HIF-positive | 20/34 (59) | 28/34 (82) |
| <0.22
cm3 | HIF-positive | 7/14 (50) | 9/14 (64) |
| Maximum
HIF-expressiona | 20% | 35% |
| >0.22
cm3 | HIF-positive | 13/20 (65) | 19/20 (95) |
| Maximum
HIF-expressiona | 50% | 90% |
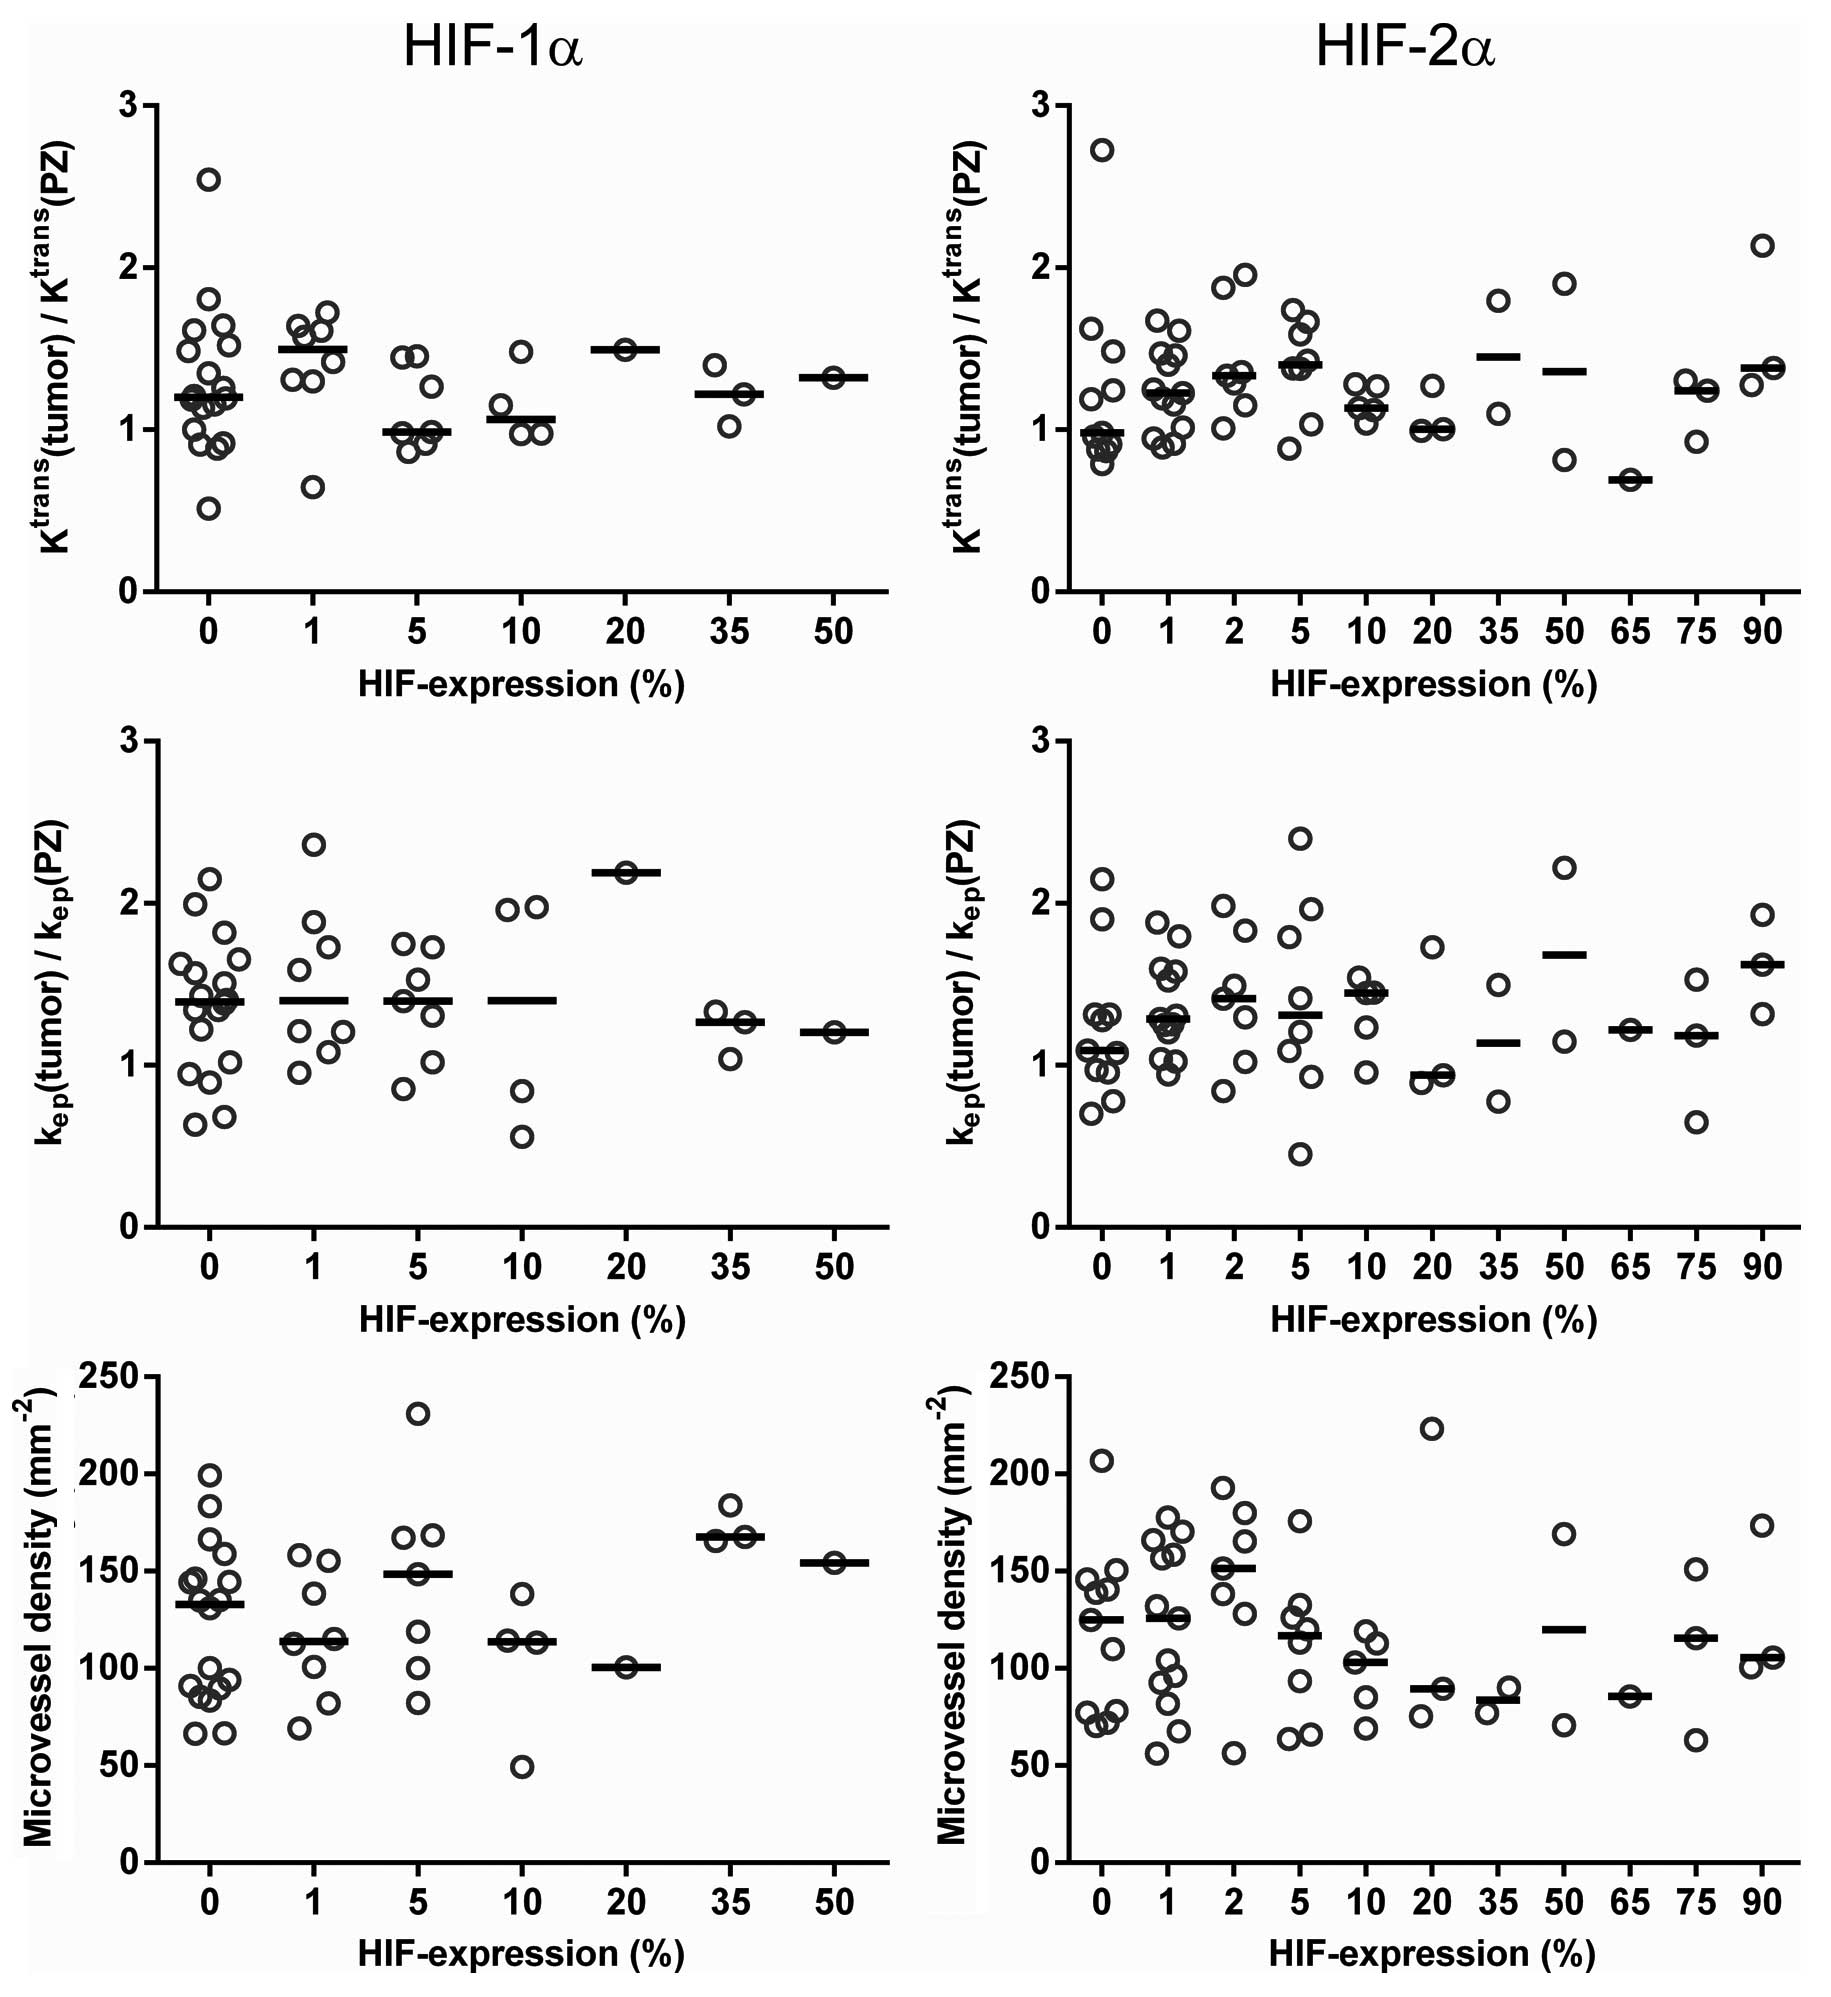
For all HIF-1α ROIs, median values (range) were:
Ktrans 0.241 min−1 (0.108–0.599),
kep 0.356 min−1 (0.049–0.581) and MVD
135/mm2(50–230). For HIF-2α these values were:
Ktrans 0.256 min−1 (0.109–0.609),
kep 0.362 (0.051–0.888) and MVD
115/mm2(55–225). No differences in median
Ktrans, kep and MVD were observed between
different HIF-expression levels (Fig.
2). In addition, classification into groups according to
different HIF-expression levels (e.g. HIF-positive vs. HIF-negative
and 0–1% vs. >1%) did not show any significant differences. As
shown in Fig. 3, the perfusion
parameters and MVD in HIF-negative tumor regions (with 0% HIF
expression) overlapped with those in all other HIF-positive
ROIs.
Furthermore, ROIs were classified into groups with
high/low Ktrans and high/low kep, using
median normalized Ktrans and kep values as
threshold. No differences in HIF expression were present between
the groups (P>0.16).
Percentages of HIF-1α and HIF-2α expression were not
correlated with median Ktrans, kep and MVD
(P>0.2). HIF-2α expression was correlated with the
Ktrans 5th percentile (r=0.30, P=0.02) and with the MVD
95th percentile (r=−0.39, P=0.002). HIF-1α and HIF-2α were not
correlated with each other (P=0.49) and both did not correlate with
Gleason score (P>0.77).
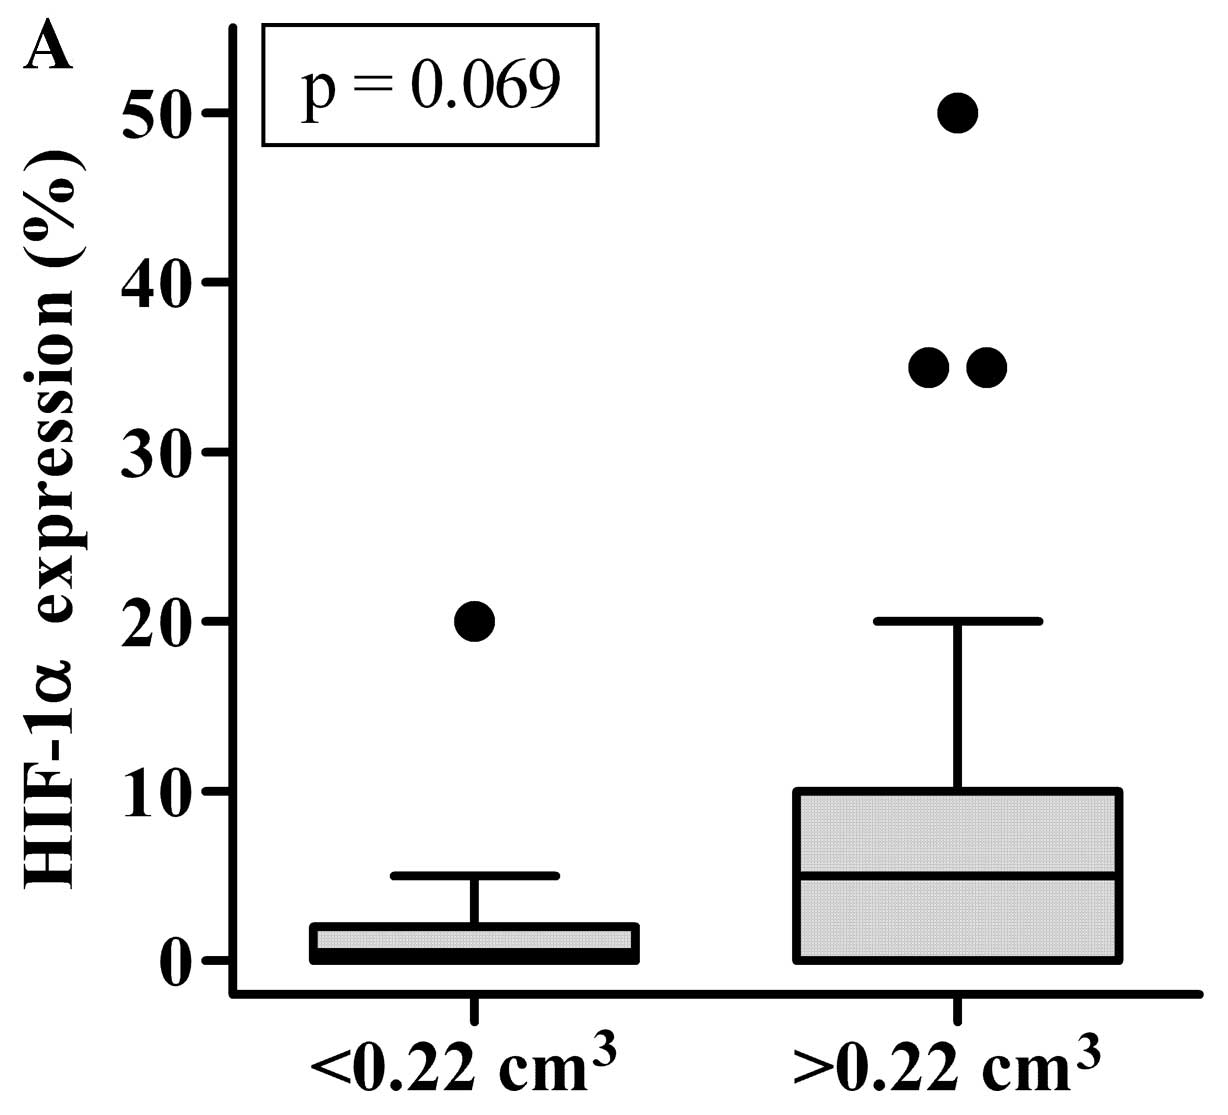
Larger tumors (>0.22 cm3) were more
often HIF-2α-positive (P=0.023) than smaller tumors and showed
higher levels of HIF-2α expression (P=0.041). This association of
HIF expression with tumor volume was less clear for HIF-1α
(Fig. 4). In addition, larger
tumors showed more frequent presence of Gleason grade 4 (P=0.005),
but for Gleason grade 5 no difference between smaller and larger
tumors was observed (P=0.955).
Discussion
This is the first study describing the distribution
of HIF-2α expression in whole-mount prostate histology. We
described the distribution of nuclear HIF-1α and HIF-2α expression
in prostate cancer and investigated the relationship with DCE-MRI
parameters and MVD. HIF distribution was highly heterogeneous, with
pronounced expression of HIF-2α, while HIF-1α was more limited.
To date, the presence of HIF-2α in primary prostate
cancer has been described in regards to data of tissue microarrays
only (8,13). Boddy et al(13) suggested that HIF-2α may be the most
important isoform in prostate cancer, as they showed that HIF-2α
expression was negatively correlated with the presence of prolyl
hydroxylase enzyme PHD2. Under hypoxic conditions, this enzyme
becomes inactive, with subsequent higher levels of HIF-2α. In the
present study, we underscore this suggestion, as we found that the
expression of HIF-2α was more pronounced and reached higher levels
compared with HIF-1α.
In addition, we observed higher HIF-2α expression
levels in larger tumors. In light of the prognostic relevance of
HIF expression, this suggests that larger tumors are most
clinically relevant. These larger tumors have a higher chance to be
detected with MRI compared with smaller tumors (14). However, we found that high HIF
expression was present as well in small tumor regions.
Unfortunately, these small tumors may not be detected with MRI.
Furthermore, we observed a weak positive correlation
between HIF-2α and the Ktrans 5th percentile, which
indicates that the minimum Ktrans is higher in tumors
with higher HIF-2α expression. This may facilitate tumor detection,
as higher Ktrans increases the conspicuity of tumor
voxels (12).
Despite these encouraging results, we did not
observe any differences and correlations between HIF expression and
median DCE-MRI parameters or MVD. The question is whether HIF
expression in prostate cancer is regulated in an hypoxia-dependent
or hypoxia-independent manner. If hypoxia-dependent, HIF induces
angiogenesis by upregulation of vascular endothelial growth factor.
Therefore, we would expect high MVD and high Ktrans in
regions with high HIF expression. However, HIF expression may be
induced by several non-hypoxia-related factors (15). In a recent study, Garcia-Parra et
al(16) put a critical note on
the association between HIF-1α expression and hypoxia. While they
found variable HIF-1α staining, they were not able to show hypoxia
in prostate cancer with 18F-FAZA PET/CT or with
immunohistochemical staining of CAIX which is a downstream target
of HIF-1α. Based on these findings, they suggest that the
expression of HIF-1α may be independent of tissue hypoxia.
Hypoxia-independence of HIF expression may clarify
why we did not observe a correlation between HIF expression and
DCE-MRI parameters and MVD.
For both HIF-1α and HIF-2α, a number of studies have
shown an inverse relationship between HIF expression and
biochemical recurrence (6–8). This prognostic value of HIF expression
appears to be independent of the Gleason score. Similar to other
reports, we did not find a correlation between expression of HIF-1α
or HIF-2α and Gleason score (6,13,16).
Therefore, HIF expression in prostate tumor biopsies may be used as
input for individual boost dose prescription, to achieve
personalized radiotherapy (17).
This study has some limitations. First, the number
of patients was relatively small. Definitive conclusions on the
relationship between HIF expression and DCE-MRI must be verified in
larger studies. Nevertheless, as in this study the P-values found
with correlation analyses were far from significance, clinical
relevant correlations might be absent as well in larger cohorts.
Second, although we used a robust registration method, a
registration error existed between DCE-MRI data and pathology.
In conclusion, in the present study we demonstrated
that expression of HIF-1α and HIF-2α is not correlated with DCE-MRI
parameters. Larger tumors showed frequently high HIF-2α expression,
which suggests that larger tumors are most clinically relevant
tumors. Given the pronounced expression of HIF-2α and independence
of Gleason score, HIF expression may function as a biomarker to
guide boost dose prescription.
References
|
1
|
Peeters ST, Heemsbergen WD, Koper PC, et
al: Dose-response in radiotherapy for localized prostate cancer:
results of the Dutch multicenter randomized phase III trial
comparing 68 Gy of radiotherapy with 78 Gy. J Clin Oncol.
24:1990–1996. 2006. View Article : Google Scholar : PubMed/NCBI
|
|
2
|
Zelefsky MJ, Pei X, Chou JF, et al: Dose
escalation for prostate cancer radiotherapy: predictors of
long-term biochemical tumor control and distant metastases-free
survival outcomes. Eur Urol. 60:1133–1139. 2011. View Article : Google Scholar : PubMed/NCBI
|
|
3
|
Cellini N, Morganti AG, Mattiucci GC, et
al: Analysis of intraprostatic failures in patients treated with
hormonal therapy and radiotherapy: implications for conformal
therapy planning. Int J Radiat Oncol Biol Phys. 53:595–599. 2002.
View Article : Google Scholar
|
|
4
|
Pucar D, Hricak H, Shukla-Dave A, et al:
Clinically significant prostate cancer local recurrence after
radiation therapy occurs at the site of primary tumor: magnetic
resonance imaging and step-section pathology evidence. Int J Radiat
Oncol Biol Phys. 69:62–69. 2007. View Article : Google Scholar
|
|
5
|
Lips IM, van der Heide UA, Haustermans K,
et al: Single blind randomized Phase III trial to investigate the
benefit of a focal lesion ablative microboost in prostate cancer
(FLAME-trial): study protocol for a randomized controlled trial.
Trials. 12:2552011. View Article : Google Scholar
|
|
6
|
Vergis R, Corbishley CM, Norman AR, et al:
Intrinsic markers of tumour hypoxia and angiogenesis in localised
prostate cancer and outcome of radical treatment: a retrospective
analysis of two randomised radiotherapy trials and one surgical
cohort study. Lancet Oncol. 9:342–351. 2008. View Article : Google Scholar
|
|
7
|
Gravdal K, Halvorsen OJ, Haukaas SA, et
al: Proliferation of immature tumor vessels is a novel marker of
clinical progression in prostate cancer. Cancer Res. 69:4708–4715.
2009. View Article : Google Scholar : PubMed/NCBI
|
|
8
|
Nanni S, Benvenuti V, Grasselli A, et al:
Endothelial NOS, estrogen receptor beta, and HIFs cooperate in the
activation of a prognostic transcriptional pattern in aggressive
human prostate cancer. J Clin Invest. 119:1093–1108. 2009.
View Article : Google Scholar : PubMed/NCBI
|
|
9
|
Keith B, Johnson RS and Simon MC: HIF1α
and HIF2α: sibling rivalry in hypoxic tumour growth and
progression. Nat Rev Cancer. 12:9–22. 2011.
|
|
10
|
Futterer JJ, Heijmink SW, Scheenen TW, et
al: Prostate cancer localization with dynamic contrast-enhanced MR
imaging and proton MR spectroscopic imaging. Radiology.
241:449–458. 2006. View Article : Google Scholar : PubMed/NCBI
|
|
11
|
Groenendaal G, Moman MR, Korporaal JG, et
al: Validation of functional imaging with pathology for tumor
delineation in the prostate. Radiother Oncol. 94:145–150. 2010.
View Article : Google Scholar : PubMed/NCBI
|
|
12
|
Groenendaal G, Borren A, Moman MR, et al:
Pathologic validation of a model based on diffusion-weighted
imaging and dynamic contrast-enhanced magnetic resonance imaging
for tumor delineation in the prostate peripheral zone. Int J Radiat
Oncol Biol Phys. 82:e537–e544. 2012. View Article : Google Scholar
|
|
13
|
Boddy JL, Fox SB, Han C, et al: The
androgen receptor is significantly associated with vascular
endothelial growth factor and hypoxia sensing via hypoxia-inducible
factors HIF-1a, HIF-2a, and the prolyl hydroxylases in human
prostate cancer. Clin Cancer Res. 11:7658–7663. 2005. View Article : Google Scholar
|
|
14
|
Roethke MC, Lichy MP, Jurgschat L, et al:
Tumorsize dependent detection rate of endorectal MRI of prostate
cancer, a histopathologic correlation with whole-mount sections in
70 patients with prostate cancer. Eur J Radiol. 79:189–195. 2011.
View Article : Google Scholar : PubMed/NCBI
|
|
15
|
Banham AH, Boddy J, Launchbury R, et al:
Expression of the forkhead transcription factor FOXP1 is associated
both with hypoxia inducible factors (HIFs) and the androgen
receptor in prostate cancer but is not directly regulated by
androgens or hypoxia. Prostate. 67:1091–1098. 2007. View Article : Google Scholar
|
|
16
|
Garcia-Parra R, Wood D, Shah RB, et al:
Investigation on tumor hypoxia in resectable primary prostate
cancer as demonstrated by 18F-FAZA PET/CT utilizing
multimodality fusion techniques. Eur J Nucl Med Mol Imaging.
38:1816–1823. 2011. View Article : Google Scholar : PubMed/NCBI
|
|
17
|
Bentzen SM and Gregoire V: Molecular
imaging-based dose painting: a novel paradigm for radiation therapy
prescription. Semin Radiat Oncol. 21:101–110. 2011. View Article : Google Scholar : PubMed/NCBI
|