Introduction
Hepatocellular carcinoma (HCC) is one of the most
common malignant tumors worldwide (1). Its incidence is increasing due to a
high prevalence of chronic liver diseases. Emerging lines of
evidence indicate that aberrant activation of several signaling
cascades, including the Janus kinase/signal transducer and
activator of transcription (Jak/STAT), epidermal growth factor
receptor (EGFR), Ras/extracellular signal-regulated kinase (ERK),
and phosphoinositol 3-kinase (PI3K)/mammalian target of rapamycin
(mTOR) pathways, contributes to the pathogenesis of HCC (2). In addition, other factors, such as
hepatocyte growth factor (HGF), mesenchymal-epithelial transition
(MET) factors of Wnt, and Hedgehog, and apoptotic signaling,
regulate the development and progression of HCC (2). However, how these signaling events
regulate the development and progression of HCC are not fully
understood. Hence, further clarification of individual signaling
events in the development and progression of HCC will be of great
significance.
The signal transducer and activator of transcription
1 (STAT1) functions as an important upstream regulator of
interferon (IFN) signaling (3,4). In
many circumstances, STAT1 has both pro-apoptotic and
anti-proliferative activities in tumor cells (5). STAT1-deficient mice are more prone to
tumor development than animals with wild-type (6,7).
Indeed, chronic ethanol exposure induces oxidative stress and
hepatocyte damage by inhibiting IFN-γ-mediated STAT1 activation
(8). In addition, STAT1 is crucial
for the control of hepatitis C virus (HCV) replication although the
HCV core protein can selectively degrade STAT1, and subsequently
subvert Jak-STAT kinase (9). It is
possible that STAT1 may negatively regulate the growth of HCC
(10,11). However, how STAT1 regulates the
growth of HCC has not been clarified.
In the present study, we compared the levels of
STAT1 expression in 36 HCC and 12 non-HCC liver tissues as well as
HCC cell lines, and analyzed their clinical relevance in HCC
patients. Furthermore, we tested the impact of induction or
knockdown of STAT1 expression on the proliferation and apoptosis of
HepG2 cells and on the levels of p53, cyclin E, and STAT1
phosphorylation in HepG2 cells in vitro. Our data suggest
that STAT1 may be a negative regulator of the development and
progression of human HCC by regulating p53-related cell cycling and
apoptosis.
Materials and methods
Patients and specimens
A total of 36 patients with HCC were recruited at
the First Affiliated Hospital of Jilin University from April 2009
to April 2012. There were 21 male patients and 15 females with a
median age of 50 and ranging from 34 to 73 years. Individual
patients with HCC were diagnosed by radiological imaging and
histological evidence of liver biopsy, and they underwent surgical
removal of HCC. In addition, 12 gender and age-matched non-HCC
patients were recruited for surgical resection of hepatic
hemangioma, focal nodular hyperplasia, hepatic angiomyolipoma, or
angioleiomyoma, and their non-HCC liver specimens were sampled. No
patient received any chemotherapy or radiotherapy before sample
collection. Individuals with acute inflammatory liver diseases were
excluded. Written informed consent was obtained from each patient,
and the experimental protocols were approved by the Ethics
Committee of the First Affiliated Hospital of Jilin University.
Laboratory tests
Individual HCC tissue sections were stained with
hematoxylin and eosin. The pathological degrees of HCC were graded
into high, moderate or poor differentiation in a blinded manner.
The concentrations of serum α-fetoprotein (AFP), hepatitis B
surface antigen (HBsAg), and anti-hepatitis C virus (anti-HCV) were
measured by routine methods.
Immunohistochemical analysis
The levels of STAT1 expression in the specimens were
determined by immunohistochemistry. Briefly, individual
paraffin-embedded tissue sections (4-μm) were deparaffinized and
rehydrated. The sections were treated with 3%
H2O2, blocked with 5% fat-free milk, and
incubated overnight with rabbit anti-STAT1 (1:500 dilution)
(Bioworld Technology Inc., St. Louis Park, MN, USA). After being
washed, the bound antibodies were detected with biotinylated
goat-anti-rabbit IgG and visualized with horseradish peroxidase
(HRP)-conjugated streptavidin and 3,3-diaminobenzidine (DAB; Sigma,
St. Louis, MO, USA).
The number of positive anti-STAT1-staining
hepatocytes in five areas selected randomly from a single specimen
was counted, and the intensity of anti-STAT1 staining was scored by
two pathologists in a blinded manner using a semi-quantitative and
subjective grading system. The level of STAT1 expression was scored
according to the percentage of positively stained tumor cells: 0,
<5% positively stained tumor cells; 1, 6–10% positively stained
tumor cells; 2, 11–25% positively stained tumor cells; and 3,
>40% positively stained tumor cells. The intensity of anti-STAT1
staining was scored as 0, no staining; 1, weak staining; 2,
moderate staining; and 3, strong staining. The staining index for
each section was calculated as the score of the staining intensity
multiplied by the score of the STAT1 expression levels. Cases with
discrepant results were re-evaluated jointly and discussed to reach
an agreement.
Cell culture
Human HCC HepG2 cells were purchased from the
American Type Culture Collection (ATCC, Rockville, MD, USA). The
cells were maintained in Dulbecco’s modified Eagle’s medium (DMEM)
containing 10% fetal calf serum (FCS), 100 U/ml of penicillin, and
100 μg/ml of streptomycin at 37°C in a 5% CO2-humidified
incubator.
Cell transfection
The sense and antisense sequences of the
STAT1-specific and control siRNAs were synthesized by Shanghai
GenePharma, Shanghai, China and are presented in Table I. HepG2 cells
(1×10⁶/well) were cultured in 6-well plates overnight
and transfected in duplicate with 1.3 μg control or each type of
STAT1-specific siRNA using X-tremeGENE siRNA transfection reagent,
according to the manufacturer’s instructions (Roche, Mannheim,
Germany). The plasmids of pcDNA3.1 (EV) and pcDNA3.1-STAT1 were
obtained from GenePharma. HepG2 cells (1×10⁶/well) were
transfected in duplicate with 2 μg pcDNA3.1 (EV) and pcDNA3.1-STAT1
using X-tremeGENE DNA transfection reagents. Forty-eight hours
after transfection, the cells were harvested and used for the
following experiments.
 | Table ISequences of siRNAs. |
Table I
Sequences of siRNAs.
| Gene | Sequences |
|---|
|
siRNA1:STAT1_homo-575 | Sense
5′-GCUGGAUGAUCAAUAUAGUTT-3′ |
|
Antisense:5′-ACUAUAUUGAUCAUCCAGCTT-3′ |
|
siRNA2:STAT1_homo-647 |
Sense:5′-GCGUAAUCUUCAGGAUAAUTT-3′ |
|
Antisense:5′-AUUAUCCUGAAGAUUACGCTT-3′ |
|
siRNA3:STAT1_homo-1601 |
Sense:5′-GCACCUGCAAUUGAAAGAATT-3′ |
|
Antisense:5′-UUCUUUCAAUUGCAGGUGCTT-3′ |
| siRNA negative
control |
Sense:5′-UUCUCCGAACGUGUCACGUTT-3′ |
|
Antisense:5′-ACGUGACACGUUCGGAGAATT-3′ |
Quantitative real-time reverse
transcription-polymerase chain reaction (qRT-PCR)
Total RNA was extracted from each cell group using
an RNA extraction kit (RNAiso Plus), according to the
manufacturer’s instructions (Takara, Tokyo, Japan). The purified
RNA was reversely transcribed into cDNA. The relative levels of
target gene mRNA transcripts to the control GAPDH were determined
by qRT-PCR on an ABI PRISM 7300 system (ABI, USA) using the
SYBR® Premix Ex Taq™ II (Takara) and specific primers.
The sequences of primers were forward, 5′-GCAGGTTCACCAGCTTTATGA-3′
and reverse, 5′-TGAAGATTACGCTTGCTTTTCCT-3′ for STAT1 (225 bp);
forward, 5′-GTTATAAGGGAGACGGG GAG-3′ and reverse,
5′-TGCTCTGCTTCTTACCGCTC-3′ for cyclin E (205 bp); forward,
5′-CAGATCCCTTAGTTTTG GGTGC-3′ and reverse, 5′-GCCTGGAGAGACCTAGAC
CA-3′ for p53 (132 bp); forward, 5′-TCACTGCCACCCAGA AGACT-3′ and
reverse 5′-AAGGCCATGCCAGTGAGC-3′ for GAPDH (157 bp). The
amplifications were performed at 95°C for 30 sec and subjected to
40 cycles of 95°C for 5 sec, and 56°C for 35 sec, followed by a
cycle of 95°C for 15 sec, 60°C for 1 min and 95°C for 15 sec. The
relative expression level of each gene in individual samples was
calculated using the 2-ΔΔCT method.
Western blotting
Each type of cell was lysed using RIPA lysis buffer
[50 mM Tris-HCl (pH 7.4), 150 mM NaCl, 1% NP-40, 0.1% SDS]. After
quantification of the protein concentration using the Bradford
assay, cell lysates (20 μg/lane) were separated by 10% sodium
dodecyl sulfate-polyacrylamide gel electrophoresis (SDS-PAGE), and
transferred to polyvinylidene difluoride (PVDF) membranes
(Millipore, Billerica, MA, USA). The membranes were blocked with 5%
non-fat dry milk in Tris-buffered saline plus Tween-20 (TBS-T; 0.1%
Tween-20) and probed at 4°C overnight with anti-STAT1 (1:2,000
dilution) (Bioworld Technology), anti-p-STAT1 (1:2,000 dilution;
Bioworld Technology), anti-p53 (1:400 dilution), anti-cyclin E
(1:400 dilution) (Beijing Biosynthesis Biotechnology Co., Ltd.,
Beijing, China), and anti-β-actin or control IgG (1:2,000 dilution)
(Wuhan Amyjet Scientific Co., Ltd., Wuhan, China). After being
washed with TBS-T, the bound antibodies were detected with
HRP-conjugated specific secondary antibodies for 1 h at room
temperature and visualized using the enhanced chemiluminescent
(ECL) kit (Haigene, Harbin, China). The relative levels of each
target protein to the control β-actin were determined using a UVP
bioimaging system and LabWorks 4.6 software (UVP, Upland, CA,
USA).
MTT assay
The impact of STAT1 on HCC cell proliferation was
evaluated by MTT
(3-(4,5-dimethylthiazol-2-yl)-2,5-diphenyltetrazolium bromide)
assay. HCC cells (2×10⁴/well) were cultured on 96-well
plates overnight and were transfected in triplicate with 0.1
μg/well plasmid vectors or siRNAs for 48 h. Subsequently, the cells
were exposed to 100 μl of MTT solution (R&D Systems,
Minneapolis, MN, USA) and continually cultured for 4 h. The formed
formazan was dissolved with MTT solubilization buffer and measured
for the absorbance at 570 nm on an ELISA plate reader.
Flow cytometric analysis
After transfection for 48 h, the cells were
harvested and stained with FITC-Annexin V and propidium iodide (PI)
(Invitrogen, Grand Island, NY, USA) in the dark for 20 min and
washed with staining buffer. The percentage of apoptotic cells was
determined by flow cytometric analysis on a FACSAria (BD
Biosciences, San Jose, CA, USA).
Statistical analysis
All results are expressed as the means ± SEM or real
case number. The difference between groups was analyzed by one-way
ANOVA or the Chi-squared test, and the non-parametric data between
groups were analyzed by the Mann-Whitney U test using SPSS version
17.0 software. A P-value of <0.05 was considered to indicate a
statistically significant result.
Results
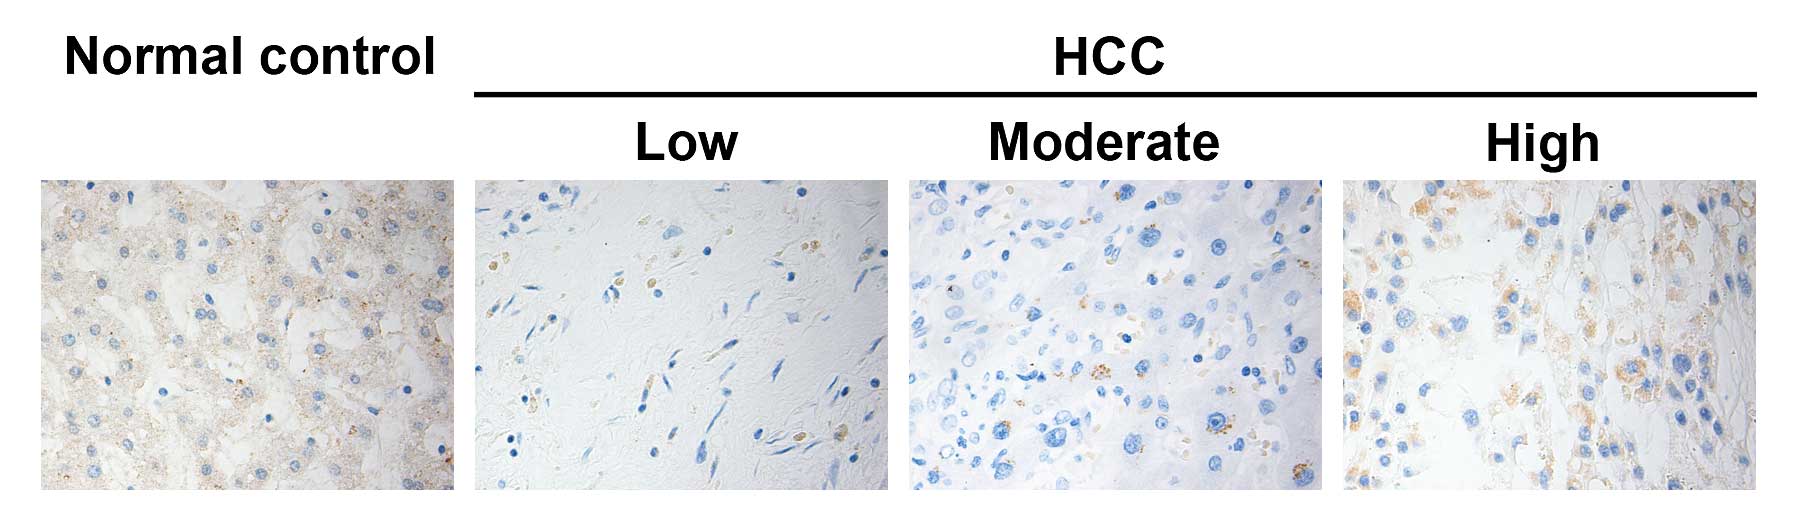
Clinical relevance of STAT1 in the
development and progression of HCC
To determine the clinical relevance of STAT1
expression in the development and progression of HCC, a total of 36
HCC patients and 12 non-HCC patients were recruited, and their HCC
and non-HCC liver tissue sections were subjected to
immunohistochemical analysis (Fig.
1). As shown in Table II, the
percentage of STAT1-expressing non-HCC tissues (11/12) was
significantly higher than the percentage in HCC tissues (17/36,
P<0.05). Quantitative analysis of STAT1 expression indicated
that there was a significant difference in the relative levels of
STAT1 expression between HCC and non-HCC tissues in this population
(P<0.05). Stratification analysis revealed that the level of
STAT1 expression in the HCC tissues was positively associated with
the degree of HCC differentiation (P<0.05), but was negatively
correlated with serum HBsAg, anti-HCV and α-AFP positivity (all
P<0.05, Table III). However,
the level of STAT1 expression in the HCC tissues was not associated
with age, gender and tumor size in this population. These data
suggest that STAT1 may be a negative regulator of the development
and progression of HCC in humans.
| Table IISTAT1 expression in non-HCC liver and
HCC tissues. |
Table II
STAT1 expression in non-HCC liver and
HCC tissues.
| | STAT1 expression | |
|---|
| |
| |
|---|
| N | 0 | 1 | 2 | 3 | 4 | P-value |
|---|
| Non-HCC liver
tissues | 12 | 1 | 1 | 1 | 2 | 7 | <0.05 |
| HCC tissues | 36 | 19 | 4 | 5 | 5 | 3 | |
| Table IIIStratification analysis of the
potential association between the levels of STAT1 expression and
demographic and clinical characteristics of the HCC patients. |
Table III
Stratification analysis of the
potential association between the levels of STAT1 expression and
demographic and clinical characteristics of the HCC patients.
| | Levels of STAT1
expression | |
|---|
| |
| |
|---|
| Factors | N | 0 | 1 | 2 | 3 | 4 | P-value |
|---|
| Age (years) |
| <50 | 14 | 8 | 2 | 2 | 1 | 1 | >0.05 |
| ≥50 | 22 | 11 | 4 | 2 | 3 | 2 | |
| Gender |
| Male | 21 | 11 | 3 | 3 | 2 | 2 | >0.05 |
| Female | 15 | 8 | 3 | 1 | 2 | 1 | |
| Tumor diameter
(cm) |
| <5 | 13 | 7 | 1 | 1 | 3 | 1 | >0.05 |
| ≥5 | 23 | 12 | 5 | 3 | 1 | 2 | |
|
Differentiation |
| High | 12 | 5 | 1 | 2 | 2 | 2 | <0.05 |
| Moderate | 12 | 6 | 2 | 1 | 2 | 1 | <0.05 |
| Low | 12 | 8 | 3 | 1 | 0 | 0 | |
| HBsAg |
| Positive | 22 | 13 | 4 | 3 | 1 | 1 | <0.05 |
| Negative | 14 | 6 | 2 | 1 | 3 | 2 | |
| Anti-HCV |
| Positive | 10 | 5 | 3 | 1 | 0 | 1 | <0.05 |
| Negative | 26 | 14 | 3 | 3 | 4 | 2 | |
| Serum AFP |
| Positive | 27 | 14 | 5 | 3 | 4 | 1 | <0.05 |
| Negative | 9 | 5 | 1 | 1 | 0 | 2 | |
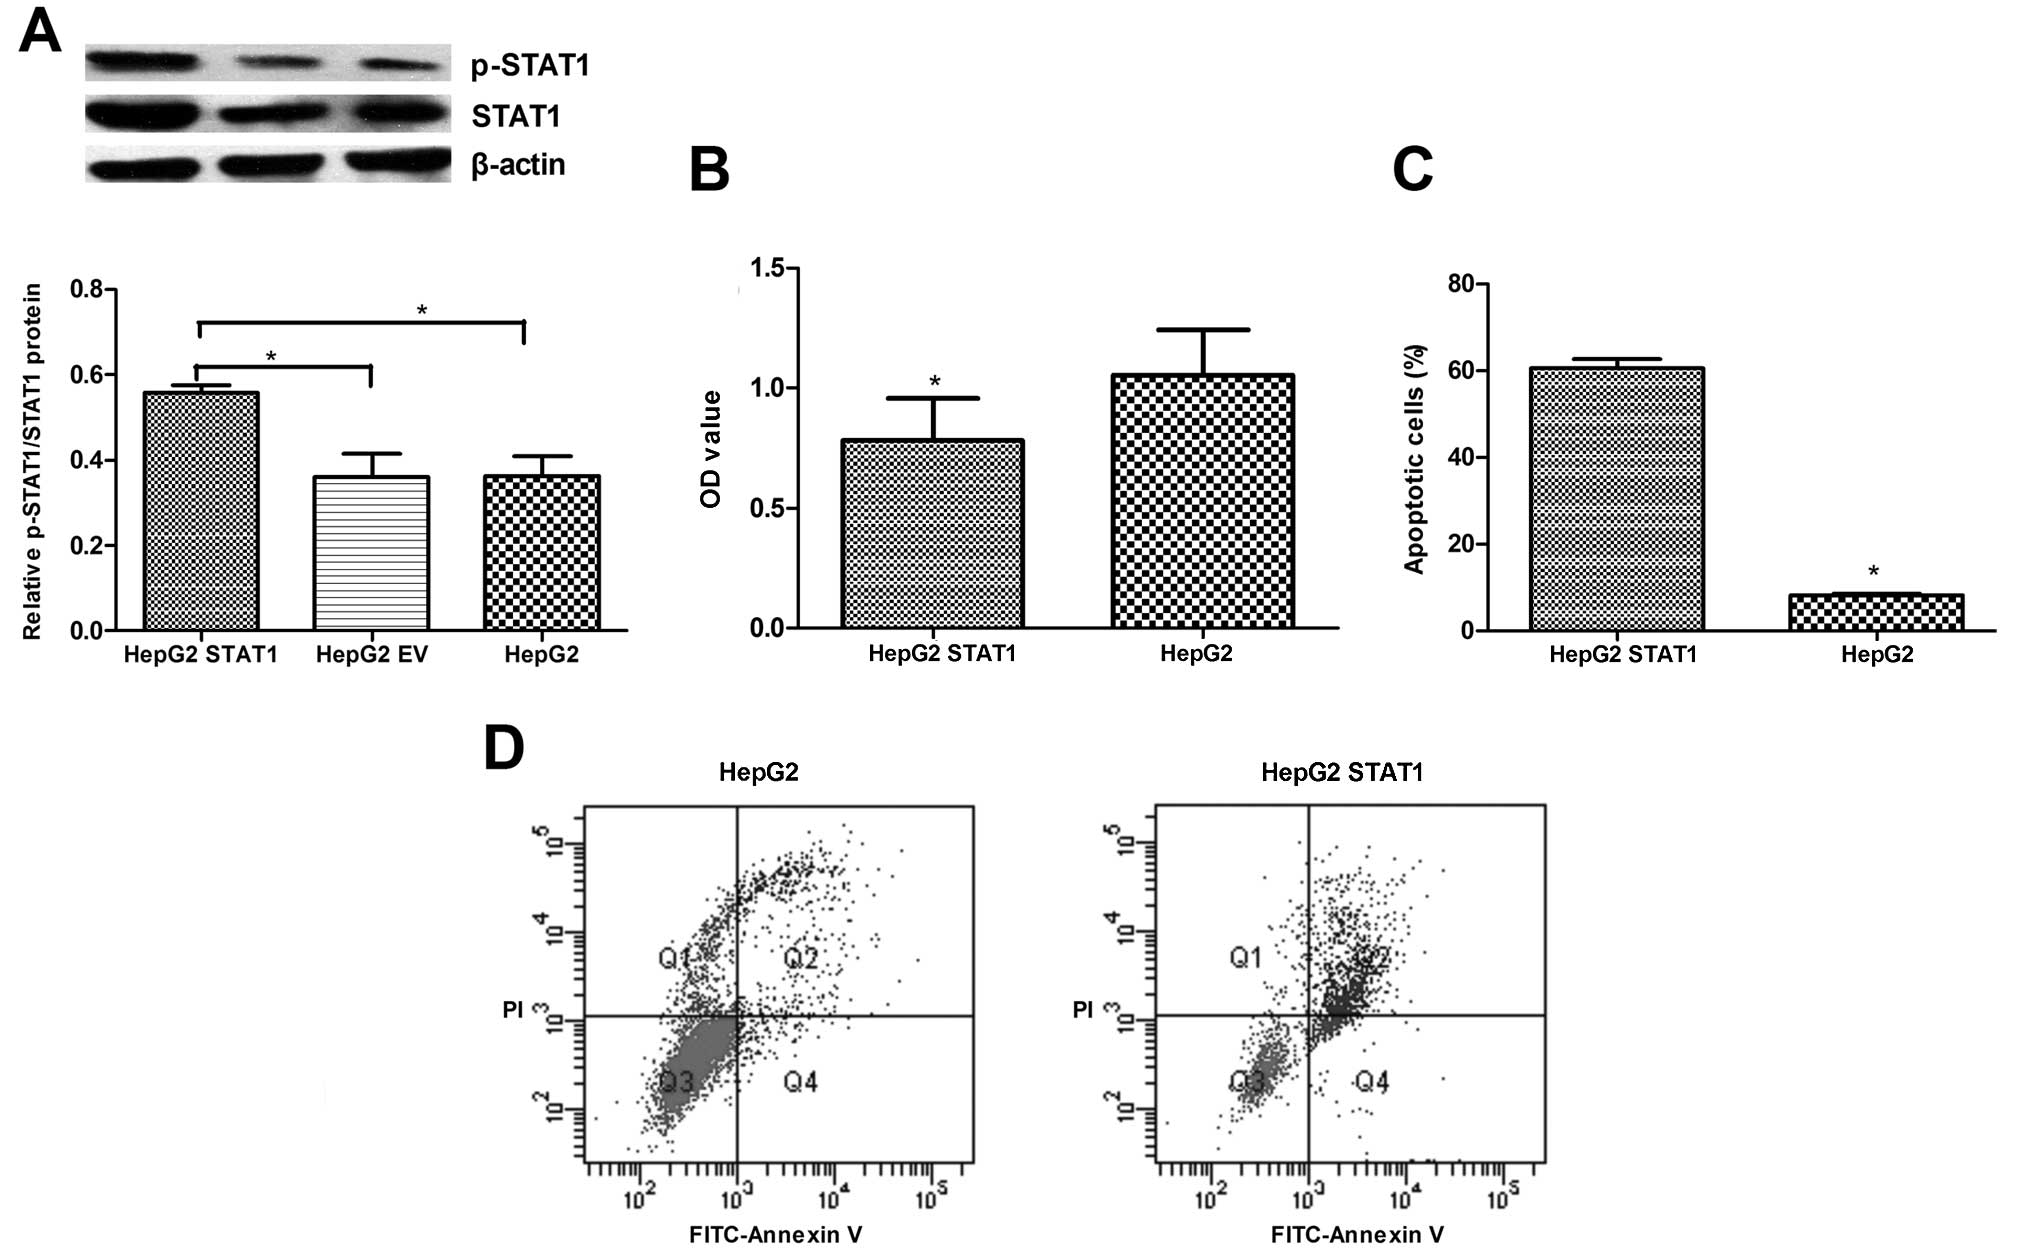
Induction of STAT1 overexpression
inhibits HepG2 cell proliferation and induces HepG2 cell apoptosis
in vitro
To further illustrate the functional role of STAT1
in the development of HCC, we examined the effects of STAT1
overexpression by transient transfection with a recombinant plasmid
encoding the STAT1 sequence (pcDNA3.1-STAT1) or control empty
vector (EV) pcDNA3.1 on the proliferation and apoptosis of HepG2
cells. Forty-eight hours after transfection, the levels of STAT1
expression were determined by RT-PCR and western blot assays. The
relative level of STAT1 mRNA transcripts in the
pcDNA3.1-STAT1-transfected HepG2 cells was significantly higher
than levels in the EV and unmanipulated HepG2 cells (data not
shown). Similarly, the level of STAT1 protein in the
pcDNA3.1-STAT1-transfected HepG2 cells was significantly higher
than levels in the EV and unmanipulated HepG2 cells (Fig. 2A), but there was no significant
difference in the levels of STAT1 expression between the EV and
unmanipulated HepG2 cells. A similar pattern for phosphorylated
STAT1 was detected in these groups of cells, suggesting that
induction of STAT1 overexpression increased the levels of
phosphorylated STAT1. Furthermore, proliferation of the
pcDNA3.1-STAT1-transfected HepG2 cells was significantly reduced
when compared with that of the EV-transfected HepG2 cells (Fig. 2B), but the percentage of apoptotic
pcDNA3.1-STAT1-transfected HepG2 cells was significantly higher
(60.6 vs. 8.06%) when compared with that of the EV-transfected
HepG2 cells (Fig. 2C and D).
Collectively, induction of STAT1 overexpression inhibited
proliferation and promoted apoptosis in the HepG2 cells in
vitro.
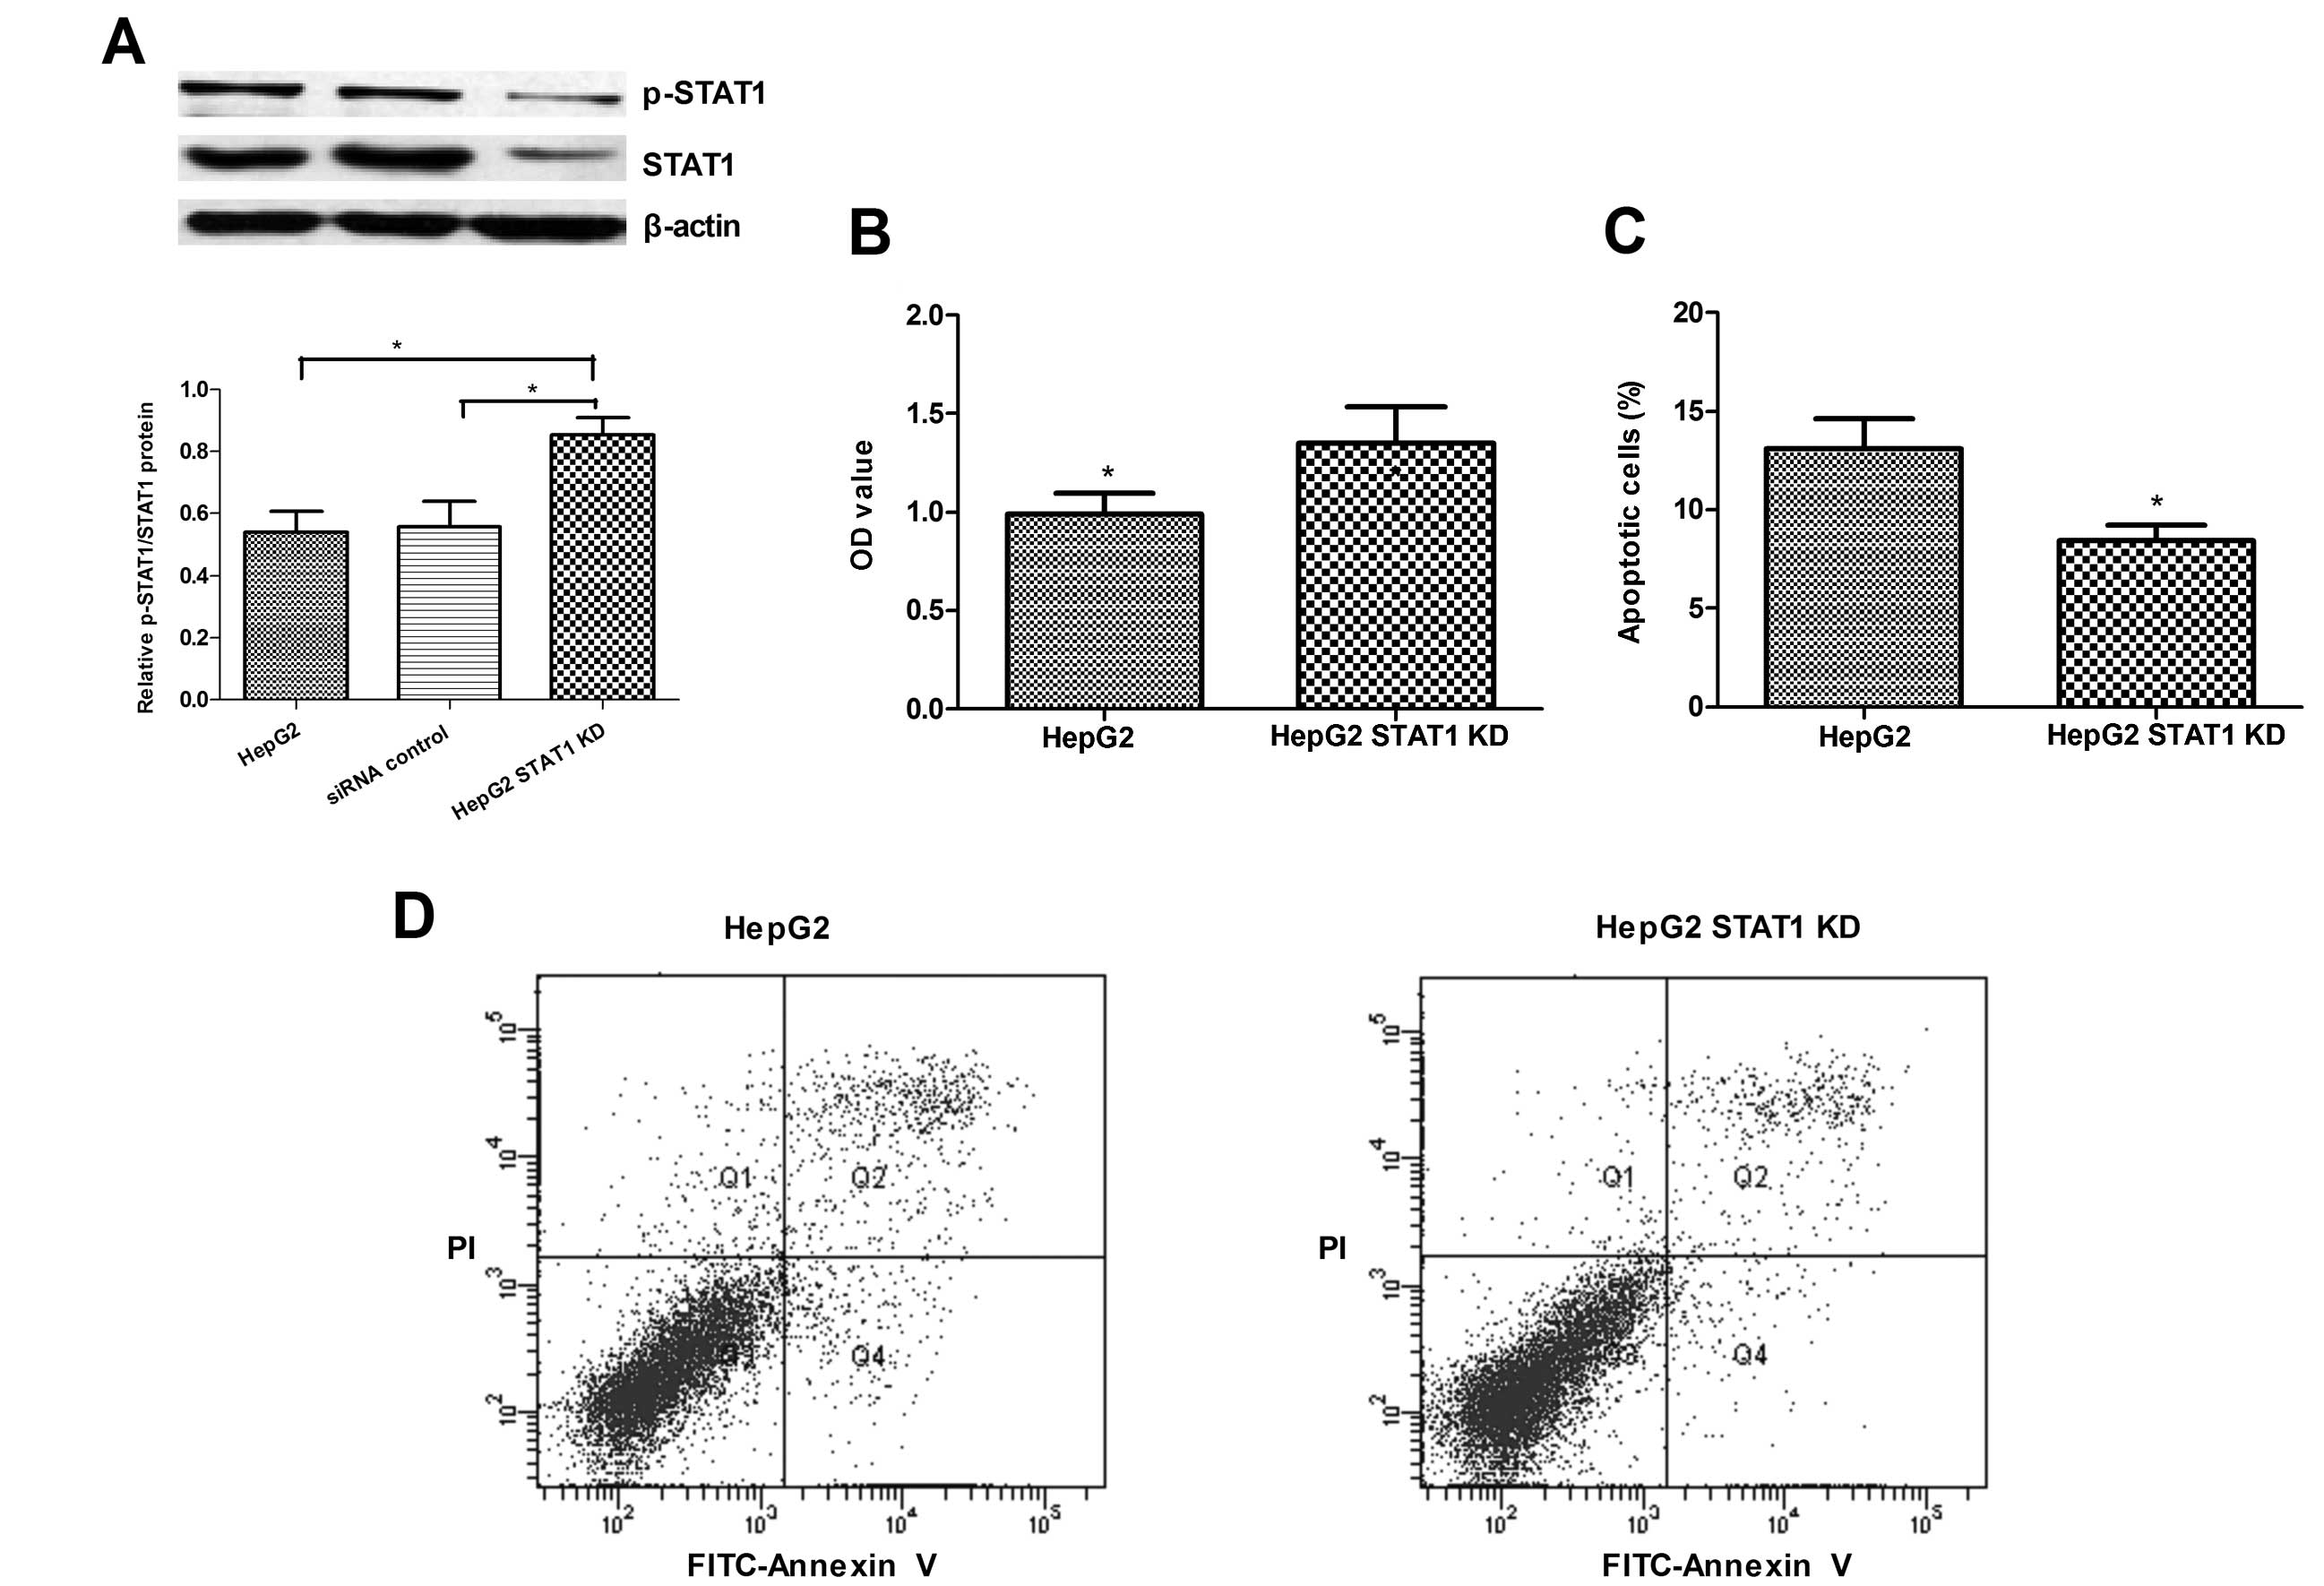
Knockdown of STAT1 expression promotes
proliferation and inhibits apoptosis of HepG2 cells
In parallel, we tested the impact of STAT1 silencing
by transfection with STAT1-specific siRNA on the levels of STAT1
phosphorylation, proliferation and apoptosis in HepG2 cells. We
designed and synthesized three pairs of STAT1-specific siRNAs.
Following transfection, we found that all of the tested siRNAs
effectively reduced the levels of STAT1 expression, and
transfection with siRNA3 resulted in inhibition of STAT1 expression
by ~65% (Fig. 3A). Notably, the
relative level of phosphorylated STAT1 to total STAT1 in the
STAT1-knockdown (KD) HepG2 cells was higher than those levels in
the EV-transfected and unmanipulated HepG2 cells. While the
proliferation of STAT1-KD HepG2 cells was significantly increased
when compared with that of the unmanipulated HepG2 cells (Fig. 3B), the percentage of apoptotic
STAT1-KD HepG2 cells was significantly less than that of the
unmanipulated HepG2 cells (8.43 vs. 13.1%, Fig. 3C and D). Therefore, knockdown of
STAT1 expression promoted proliferation and inhibited apoptosis in
the HepG2 cells in vitro.
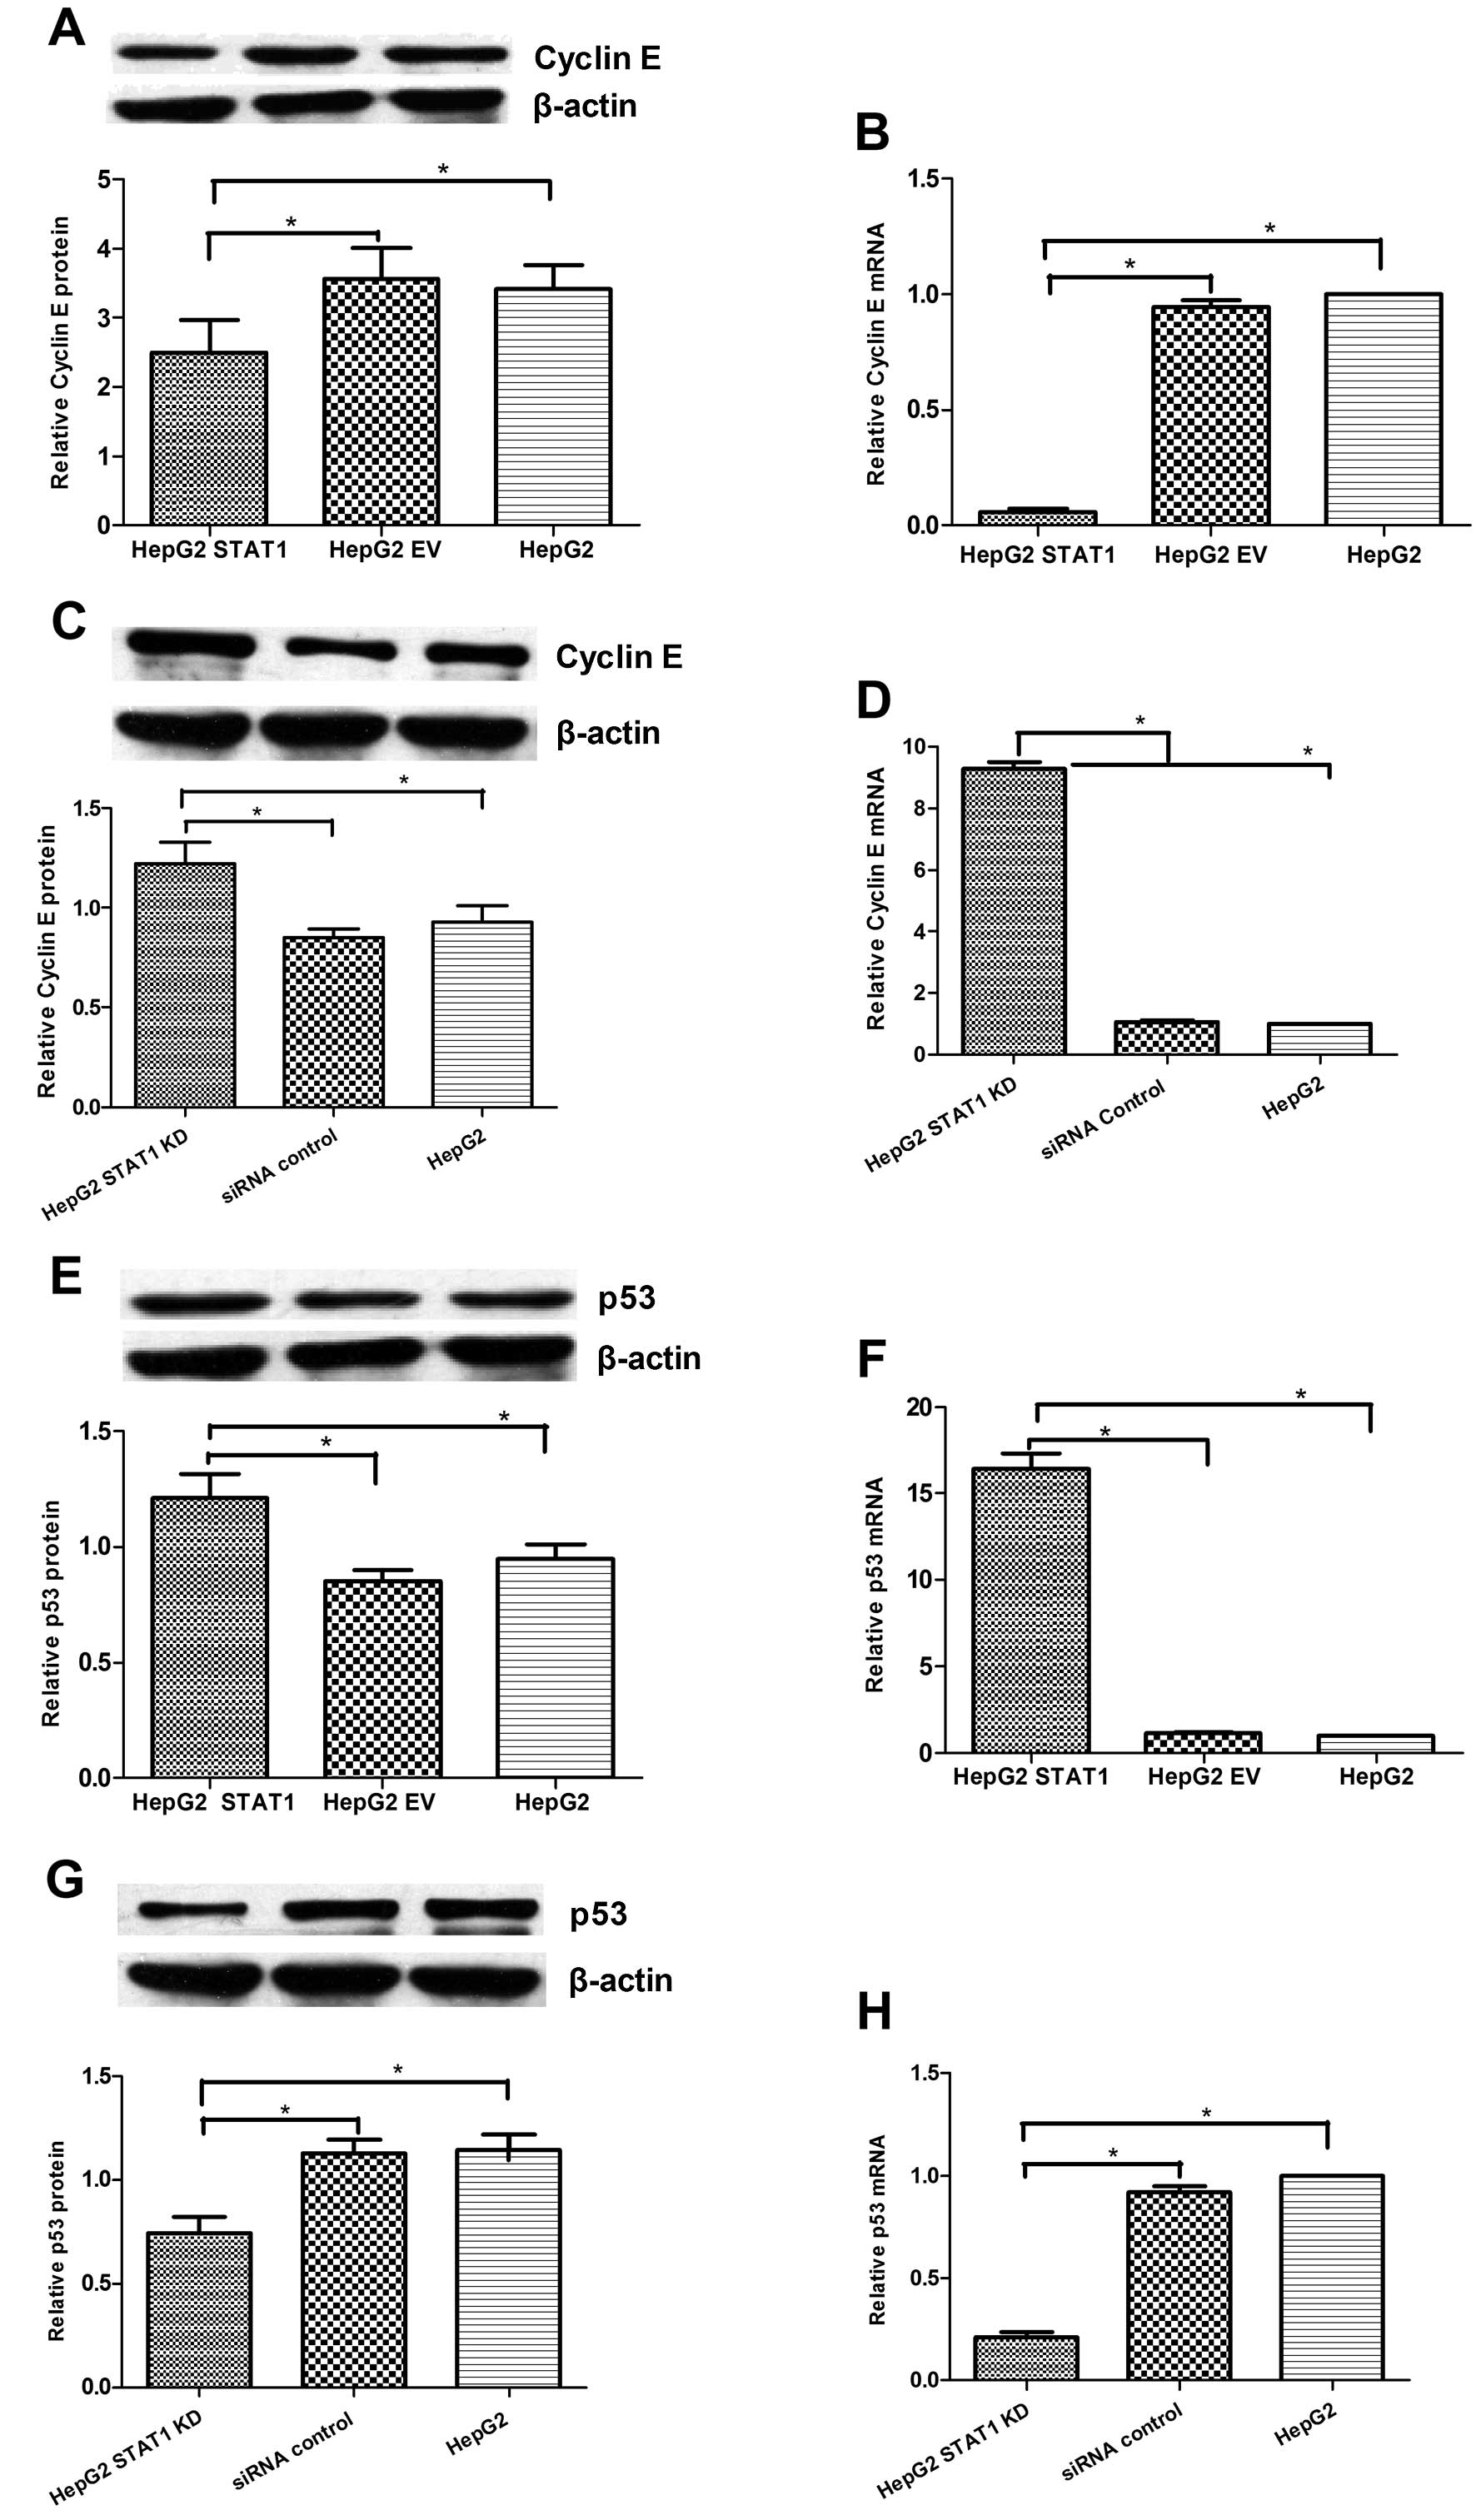
Modulation of STAT1 expression alters the
levels of cyclin E and p53 expression in HepG2 cells
Cyclin E and p53 are crucial regulators of cell
proliferation and apoptosis. To understand the mechanisms
underlying the action of STAT1, we examined the relative levels of
cyclin E and p53 expression in the different groups of HepG2 cells.
The relative level of cyclin E expression in the
pcDNA3.1-STAT1-transfected HepG2 cells was significantly lower than
levels in the EV-transfected and unmanipulated HepG2 cells
(Fig. 4A and B). In contrast, the
relative level of cyclin E expression in the STAT1-KD HepG2 cells
was significantly higher than levels in the control
siRNA-transfected and unmanipulated HepG2 cells (Fig. 3C and D). In addition, the relative
level of p53 expression in the pcDNA3.1-STAT1-transfected HepG2
cells was significantly higher than those in the EV-transfected and
unmanipulated HepG2 cells, while the relative level of p53
expression in the STAT1-KD HepG2 cells was significantly lower than
levels in the control siRNA-transfected and unmanipulated HepG2
cells (Fig. 3E-H). Thus, induction
of STAT1 overexpression downregulated cyclin E expression, but
upregulated p53 expression in HepG2 cells. In contrast, knockdown
of STAT1 expression increased the level of cyclin E, but decreased
the level of p53 expression in HepG2 cells.
Discussion
The STAT family members were originally identified
as cytokine-related signal events and have emerged as promising
molecular targets for cancer therapy (11). Among these proteins, STAT1 plays a
critical role in IFN-γ-dependent signaling in the regulation of
diverse biological actions, including antiviral defense (12,13),
induction of cell death and growth arrest (14,15).
In the present study, we found significantly lower
levels of STAT1 expression in HCC tissues, consistent with a
previous study that demonstrated significantly lower levels of
STAT1 expression in squamous cell carcinoma (16). Furthermore, we found that the level
of STAT1 expression in HCC tissues was positively correlated with
the degree of differentiation of HCC and was associated negatively
with serum HBsAg, anti-HCV and α-AFP positivity in HCC patients. It
is well known that HBV or HCV infection is a risk factor for the
development of HCC and α-AFP positivity occurs at a high frequency
in HCC patients, contributing to the progression of HCC. Hence, our
novel data suggest that STAT1 may be a negative regulator of the
development and progression of HCC. Given that the histological
degree of HCC is associated with the prognosis of HCC, further
investigation to determine whether the level of STAT1 expression in
HCC tissues could serve as a biomarker for evaluating the prognosis
of HCC in Chinese patients is warranted. However, it is notable
that ubiquitous activation of Ras and Jak/Stat pathways is detected
in human HCC tissues (17). Such a
discrepancy may be due to the different genetic backgrounds and
variable pathologic factors that contribute to the development of
HCC. While chronic viral hepatitis is the major factor for the
development of HCC in the Chinese population,
hyperlipidemia-related and alcoholic liver diseases are crucial for
the development of HCC in Western countries. Indeed, the levels of
STAT1 expression vary in different types of cancers, and even in
the same type of cancer with different genetic backgrounds and in
patients from different geographic regions (16). We are interested in further
investigating how these factors modulate the STAT1 expression and
activation, contributing to the development and progression of
HCC.
To understand the role of STAT1 in the development
and progression of HCC, we evaluated the impact of altered levels
of STAT1 expression on the proliferation and apoptosis of HepG2
cells. Our results support the notion that STAT1 may be a tumor
suppressor. We found that induction of STAT1 overexpression
inhibited proliferation, but enhanced apoptosis of HepG2 cells.
Similarly, knockdown of STAT1 expression enhanced proliferation,
but inhibited apoptosis of HepG2 cells. These two independent lines
of evidence clearly indicate that STAT1 acts as a suppressor of HCC
cell proliferation, which is consistent with a previous study of
human head and neck squamous cell carcinoma (16).
Several molecules have been implicated in
STAT1-regulated cell survival, proliferation and apoptosis. These
include caspase-2, -3 and -7, Bcl-2, IRF1 and p21/Waf1 (18–20).
Cyclin E is associated with CDK2 and is crucial for regulating the
G1/S phase transition of the cell cycle (21). It has been reported that IFN-γ
induces G0/G1 phase arrest in human melanoma cells by
downregulating cyclin E and cyclin-dependent kinase expression
(22). We found that induction of
STAT1 overexpression in HepG2 cells significantly reduced the
levels of cyclin E expression, while knockdown of STAT1 expression
dramatically upregulated the levels of cyclin E expression in HepG2
cells. These data suggest that STAT1 inhibits cyclin E expression
and induces cell cycle arrest in HCC cells. In addition, a previous
study indicated that loss of p53 expression or the presence of
abnormal forms of the protein is frequently detected in HCC cell
lines, suggesting that alterations in p53 expression may be an
important event in the transformation of hepatocytes to the
malignant phenotype (23). In the
present study, we found that induction of STAT1 overexpression
increased the levels of p53 expression, while knockdown of STAT1
expression decreased the levels of p53 expression in HepG2 cells.
Indeed, a previous study demonstrated that p53 is an important
negative regulator of the cell cycle in HCC cells (24). It is possible that STAT1 may
regulate the p53 expression and in turn inhibit cyclin E
expression, leading to cell cycle arrest, growth inhibition, and
apoptosis of HCC cells.
In summary, our data revealed a significantly lower
level of STAT1 expression in HCC tissues, which was correlated
positively with the degree of differentiation of HCC, but was
negatively associated with the positivity of HBV, HCV infection,
and AFP in Chinese HCC patients. Furthermore, our data also suggest
that STAT1 may function as a suppressor of HCC cell proliferation
and a regulator of HCC cell apoptosis, which is modulated by an
increased level of p53 expression and a decreased level of cyclin E
expression in HepG2 cells. Hence, our findings highlight the
importance of STAT1 in regulating the development and progression
of HCC. Conceivably, our findings may provide a basis for the
design of new therapies for the intervention of HCC in the clinic.
We recognize that our study had limitations due to its small sample
size and the lack of longitudinal studies. Therefore, further
longitudinal investigation in a larger population is warranted.
Acknowledgements
We thank all members of the Laboratory of the
General Surgery Department (The First Hospital of Jilin University)
and Haihe Wang (Harbin Medical University) for their insights and
technical support. We thank Medjaden Bioscience Limited for
assisting in the preparation of this manuscript.
References
|
1
|
Farazi PA and DePinho RA: Hepatocellular
carcinoma pathogenesis: from genes to environment. Nat Rev Cancer.
6:674–687. 2006. View
Article : Google Scholar : PubMed/NCBI
|
|
2
|
Llovet JM and Bruix J: Molecular targeted
therapies in hepatocellular carcinoma. Hepatology. 48:1312–1327.
2008. View Article : Google Scholar : PubMed/NCBI
|
|
3
|
Lodige I, Marg A, Wiesner B, Malecova B,
Oelgeschlager T and Vinkemeier U: Nuclear export determines the
cytokine sensitivity of STAT transcription factors. J Biol Chem.
280:43087–43099. 2005. View Article : Google Scholar : PubMed/NCBI
|
|
4
|
Mowen K and David M: Regulation of STAT1
nuclear export by Jak1. Mol Cell Biol. 20:7273–7281. 2000.
View Article : Google Scholar : PubMed/NCBI
|
|
5
|
Khodarev NN, Minn AJ, Efimova EV, et al:
Signal transducer and activator of transcription 1 regulates both
cytotoxic and prosurvival functions in tumor cells. Cancer Res.
67:9214–9220. 2007. View Article : Google Scholar : PubMed/NCBI
|
|
6
|
Bromberg JF, Horvath CM, Wen Z, Schreiber
RD and Darnell JE Jr: Transcriptionally active Stat1 is required
for the antiproliferative effects of both interferon α and
interferon γ. Proc Natl Acad Sci USA. 93:7673–7678. 1996.PubMed/NCBI
|
|
7
|
Shankaran V, Ikeda H, Bruce AT, White JM,
Swanson PE, Old LJ and Schreiber RD: IFNγ and lymphocytes prevent
primary tumour development and shape tumour immunogenicity. Nature.
410:1107–1111. 2001.
|
|
8
|
Osna NA, Clemens DL and Donohue TM Jr:
Ethanol metabolism alters interferon gamma signaling in recombinant
HepG2 cells. Hepatology. 42:1109–1117. 2005. View Article : Google Scholar : PubMed/NCBI
|
|
9
|
Lin W, Choe WH, Hiasa Y, Kamegaya Y,
Blackard JT, Schmidt EV and Chung RT: Hepatitis C virus expression
suppresses interferon signaling by degrading STAT1.
Gastroenterology. 128:1034–1041. 2005. View Article : Google Scholar : PubMed/NCBI
|
|
10
|
Bromberg J and Darnell JE Jr: The role of
STATs in transcriptional control and their impact on cellular
function. Oncogene. 19:2468–2473. 2000. View Article : Google Scholar : PubMed/NCBI
|
|
11
|
Yu H and Jove R: The STATs of cancer - new
molecular targets come of age. Nat Rev Cancer. 4:97–105. 2004.
View Article : Google Scholar : PubMed/NCBI
|
|
12
|
Levy DE and Darnell JE Jr: Stats:
transcriptional control and biological impact. Nat Rev Mol Cell
Biol. 3:651–662. 2002. View
Article : Google Scholar : PubMed/NCBI
|
|
13
|
Samuel CE: Antiviral actions of
interferons. Clin Microbiol Rev. 14:778–809. 2001. View Article : Google Scholar : PubMed/NCBI
|
|
14
|
Balasubramanian A, Ganju RK and Groopman
JE: Signal transducer and activator of transcription factor 1
mediates apoptosis induced by hepatitis C virus and HIV envelope
proteins in hepatocytes. J Infect Dis. 194:670–681. 2006.
View Article : Google Scholar : PubMed/NCBI
|
|
15
|
Chawla-Sarkar M, Lindner DJ, Liu YF,
Williams BR, Sen GC, Silverman RH and Borden EC: Apoptosis and
interferons: role of interferon-stimulated genes as mediators of
apoptosis. Apoptosis. 8:237–249. 2003. View Article : Google Scholar : PubMed/NCBI
|
|
16
|
Xi S, Dyer KF, Kimak M, et al: Decreased
STAT1 expression by promoter methylation in squamous cell
carcinogenesis. J Natl Cancer Inst. 98:181–189. 2006. View Article : Google Scholar : PubMed/NCBI
|
|
17
|
Calvisi DF, Ladu S, Gorden A, et al:
Ubiquitous activation of Ras and Jak/Stat pathways in human HCC.
Gastroenterology. 130:1117–1128. 2006. View Article : Google Scholar : PubMed/NCBI
|
|
18
|
Lee CK, Smith E, Gimeno R, Gertner R and
Levy DE: STAT1 affects lymphocyte survival and proliferation
partially independent of its role downstream of IFN-γ. J Immunol.
164:1286–1292. 2000.PubMed/NCBI
|
|
19
|
Nguyen H, Lin R and Hiscott J: Activation
of multiple growth regulatory genes following inducible expression
of IRF-1 or IRF/RelA fusion proteins. Oncogene. 15:1425–1435. 1997.
View Article : Google Scholar : PubMed/NCBI
|
|
20
|
Sironi JJ and Ouchi T: STAT1-induced
apoptosis is mediated by caspases 2, 3, and 7. J Biol Chem.
279:4066–4074. 2004. View Article : Google Scholar : PubMed/NCBI
|
|
21
|
Knoblich JA, Sauer K, Jones L, Richardson
H, Saint R and Lehner CF: Cyclin E controls S phase progression and
its down-regulation during Drosophila embryogenesis is
required for the arrest of cell proliferation. Cell. 77:107–120.
1994. View Article : Google Scholar : PubMed/NCBI
|
|
22
|
Kortylewski M, Komyod W, Kauffmann ME,
Bosserhoff A, Heinrich PC and Behrmann I: Interferon-γ-mediated
growth regulation of melanoma cells: involvement of STAT1-dependent
and STAT1-independent signals. J Invest Dermatol. 122:414–422.
2004.
|
|
23
|
Bressac B, Galvin KM, Liang TJ,
Isselbacher KJ, Wands JR and Ozturk M: Abnormal structure and
expression of p53 gene in human hepatocellular carcinoma. Proc Natl
Acad Sci USA. 87:1973–1977. 1990. View Article : Google Scholar : PubMed/NCBI
|
|
24
|
Sheahan S, Bellamy CO, Dunbar DR, Harrison
DJ and Prost S: Deficiency of G1 regulators P53, P21Cip1
and/or pRb decreases hepatocyte sensitivity to TGFβ cell cycle
arrest. BMC Cancer. 7:2152007.PubMed/NCBI
|