Introduction
Pancreatic ductal adenocarcinoma (PDAC) ranks among
the most lethal types of human cancer, with a 5-year survival rate
of lower than 5% and a median survival time of less than 6 months
(1,2). Although several non-invasive imaging
techniques such as magnetic resonance imaging have been used to
detect PDAC, early diagnosis of this disease is still clinically
challenging as these methods do not reliably detect pancreatic
tumors smaller than 1 cm in size (3). Consequently, in most cases, PDAC is
not detected until at an advanced stage when potentially curative
therapies are not available.
The identification of serum biomarkers has raised
the possibility of developing an easy-to-perform and non-invasive
approach to tumor diagnosis. Serum carbohydrate antigen 19-9 (CA
19-9) is the most well-established biomarker of pancreatic cancer,
with a median sensitivity of 79% (range 70–90%) and median
specificity of 82% (range 68–91%) (4). However, this marker has several major
limitations, including lack of production in patients carrying the
Lewis-negative genotype (5),
frequent elevation in other malignancies and benign conditions, and
ineffectiveness in detecting early stage cancers (6). Some alternative serum biomarkers such
as tissue polypeptide antigen, macrophage inhibitory cytokine-1 and
osteopontin have been explored (7).
However, none of these potential biomarkers satisfy the
requirements needed for the reliable diagnosis of PDACs.
Recent evidence indicates the potential value of
serum microRNAs (miRNAs) in distinguishing malignant from benign
lesions (8,9). miRNAs are a large family of
non-coding, single-stranded RNAs of ~22 nucleotides, which
negatively regulate gene expression by binding to the
3′-untranslated region (UTR) of target mRNAs, leading to
accelerated mRNA turnover and/or translational repression (9). miRNAs are implicated in a wide range
of biological processes including cell differentiation,
proliferation, apoptosis and tumorigenesis (10). Microarray experiments revealed
frequent and marked overexpression of miR-10a, miR-92 and miR-17-5p
in pancreatic cancer cell lines (11). PDACs exhibit higher expression of
miR-21, miR-221, miR-155, miR-100 and miR-181b than that in benign
pancreatic lesions (12). miRNAs
are highly stable in serum, plasma and other body fluids. This
property, combined with altered expression in malignant diseases,
makes circulating miRNAs potential non-invasive biomarkers for
cancer detection.
The diagnostic value of circulating miRNAs has been
described for pancreatic cancer. A panel of 7 miRNAs (i.e.,
miR-20a, miR-21, miR-24, miR-25, miR-99a, miR-185 and miR-191) was
found to have high sensitivity and specificity for distinguishing
pancreatic cancer from cancer-free controls and from chronic
pancreatitis (13). Profiling the
expression of miR-21, miR-210, miR-155 and miR-196a in plasma can
differentiate pancreatic adenocarcinoma patients from healthy
controls (14). To extend the list
of circulating miRNA candidates for PDAC diagnosis, in the present
study, we employed microarray techniques to profile and compare the
expression of miRNAs in PDAC and normal pancreatic tissues.
Additionally, the biological functions of representative miRNAs
with markedly altered expression levels in PDAC were assessed, in
order to provide a better understanding of their diagnostic
relevance.
Materials and methods
Ethics
All procedures involving human subjects were
approved by the Ethics Committee of the Secondary Military Medical
University, Shanghai, China (no. CTcp008) in accordance with the
Helsinki Declaration, and written informed consent was obtained
from each patient enrolled. All animal experiments were undertaken
in accordance with the National Institutes of Health Guide for the
Care and Use of Laboratory Animals, with the approval of the
Scientific Investigation Board of the Second Military Medical
University (no. Lacp0010).
Patients and samples
We enrolled 80 consecutive PDAC patients (48 men and
32 women, aged 36–81 years) who underwent surgical resection during
the period from January 2008 to June 2010 at the Department of
Pancreatic Surgery of Changhai Hospital (Shanghai, China). All PDAC
patients were pathologically diagnosed by biopsy, and the patients
with prior anticancer treatments were excluded from this study.
Resected tumor specimens and adjacent normal pancreatic tissues
from 10 of this cohort of patients were collected for miRNA
profiling analysis using microarray technology. Serum samples
harvested from the remaining 70 PDAC patients, 17 age-matched
duodenal adenocarcinoma patients, and 40 age-matched healthy
controls were examined for expression of the miRNAs of interest
using quantitative real-time polymerase chain reaction
(qRT-PCR).
Pancreatic cancer cell lines and
culture
Pancreatic cancer cell lines (sw1990, BxPC-3, MIA
Paca-2, PANC-1, Capan-1, and AsPC-1) were purchased from the
Institute of Cellular Research, Chinese Academy of Science,
Shanghai, China. Cells were cultured in Dulbecco’s minimum
essential medium (Invitrogen Life Technologies, Grand Island, NY,
USA) with 10% heat-inactivated fetal bovine serum (FBS), 100,000
U/l penicillin and 100 mg/l streptomycin at 37°C in a 5%
CO2 incubator.
miRNA microarray analysis
miRNA expression profile analysis was performed
using an Agilent miRNA microarray platform (Agilent Technologies
Inc., Santa Clara, CA, USA) that consists of 713 probes and can
simultaneously measure 713 miRNAs, as describe previously (15). Total RNA was extracted from human
PDACs and adjacent normal pancreatic tissues using a mirVana™ PARIS
kit (AM1561; Ambion, Austin, TX, USA) according to the
manufacturer’s instructions. The quality of the total RNA isolated
was checked with a microcapillary electrophoresis system (Agilent
2100 Bioanlyzer). Cy3 labeling of RNA was performed using an miRNA
labeling reagent and hybridization kit (Agilent 519408; both from
Agilent Technologies Inc., Palo Alto, CA, USA). The sample
pre-treatment and probe hybridization were carried out according to
the standard Agilent microarray protocol. A microarray scanner and
Feature Extraction software (both from Agilent) were employed for
microarray data collection and analysis. The raw microarray data
were normalized using the variance stabilization and normalization
method. Each sample had at least three duplicates on the
microarray. A two-sample t-test was used for the statistical
analysis, and a p-value <0.05 was considered to indicate a
statistically significant result. In each group, the proportion of
samples with a detection value of 1 was required to be higher than
60%.
Locked nucleic acid-based in situ
hybridization (LNA-ISH)
LNA-ISH was performed using LNA™ probes against
miR-192 (Exiqon, Vedbaek, Denmark) on 5 frozen human PDAC samples
according to the manufacturer’s protocol, as described previously
(16). Briefly, after
prehybridization for 6–8 h, the prepared slides were incubated with
a hybridization buffer containing a digoxigenin (DIG)-labeled LNA™
probe in a hybridization oven overnight at 53°C. A negative
parallel set was hybridized with non-miRNA probes as a measure of
the probe specificity. After several washes, the slides were
incubated with an anti-DIG Fab fragment (1:2,000) overnight in a
humidified chamber at 4°C. A colorimetric detection reaction was
performed using NBT/BCIP ReadyMix (Roche, Mannheim, Germany) for 48
h at 4°C, followed by counterstaining using methyl green (Trevigen
Inc., Gaithersburg, MD, USA).
miRNA expression detected by qRT-PCR
Total RNA was extracted as described above, and the
reverse transcription reaction was carried out using a TaqMan
microRNA reverse transcription kit (Applied Biosystems, Foster
City, CA, USA). Quantitative PCR was performed using a StepOnePlus™
RT-PCR kit (Applied Biosystems). Cycle threshold (Ct) values were
calculated using SDS 1.4 software (Applied Biosystems). The
relative expression of miRNAs was calculated with the
2-ΔΔCt method and normalized against U6 snRNA (17).
Gene transfection and establishment of
stable cell clones
The miR-192 expression construct was constructed by
the cloning of annealed oligonucleotides of mature miR-192 into the
pGC-LV expression vector (GeneChem, Shanghai, China). A scrambled
sequence without significant homology to rat, mouse or human gene
sequences was used as a control. The miR-192 expression constructs
were transfected into the PANC-1 cell line using Lipofectamine 2000
(Invitrogen Life Technologies, Carlsbad, CA, USA) according to the
manufacturer’s instructions. Real-time PCR was used to confirm the
overexpression of miR-192.
For stable expression of miR-192 in cells, a
lentivirus-based expression system was employed. The
oligonucleotides for pre-miR-192 expression were synthesized and
inserted into the lentiviral expression vector carrying an enhanced
green fluorescent protein (EGFP) tag (Clontech Laboratories,
Mountain View, CA, USA). The miR-192-expressing plasmid or EGFP
control plasmid was transfected into HEK 293T packaging cells using
the Lentiphos™ HT packaging system. The recombinant lentiviral
particles were generated and purified following the manufacturer’s
instructions. PANC-1 cells were grown to 70–80% confluence in
6-well plates and infected with recombinant lentivirus for 2 h.
After 48 h, the infected cells were selected with fresh medium
containing 5 μg/ml puromycin for 4–5 passages. Positively infected
cells with EGFP expression were sorted by flow cytometry and
cultured until implantation.
Cell proliferation and colony
formation
Cell proliferation analysis and colony formation
assay were performed as described previously (18). Transfected PANC-1 cells were plated
in sextuplicate in 96-well microplates at a density of
1.5×10³ cells/well. Cells were counted daily over a
7-day period by the
3-(4,5-dimethylthiazol-2-yl)-2,5-diphenyltetrazolium bromide (MTT)
assay using the CellTiter 96 Non-Radioactive Cell Proliferation
Assay (Promega Corporation, Madison, WI, USA). The dark-blue
crystals of MTT-formazan were dissolved by shaking the plates at
room temperature for 10 min, and the absorbance was then measured
on a Bio-Rad microplate reader at a test wavelength of 490 nm and a
reference wavelength of 630 nm. Each growth curve showed the means
and standard deviation (SD) of at least three independent
experiments.
The colony formation assay was carried out as
described previously (18).
Briefly, transfected PANC-1 cells were plated in 6-well plates at a
density of 1,000 cells/well. After 10 days, cells were washed with
PBS, fixed in 10% methanol for 15 min, and stained in Giemsa for 20
min. Colonies consisting of >50 cells were scored. Each
experiment was repeated three times.
Cell cycle and apoptosis analysis
Cellular DNA content was analyzed by flow cytometry
as described previously (18).
Briefly, PANC-1 transfectants in a logarithmic growth phase were
harvested, fixed in ethanol, and incubated with 0.5 mg/ml of
propidium iodide (PI) along with 0.1 mg/ml of RNase A (200 KU;
Calbiochem, San Diego, CA, USA), prior to cell cycle analysis.
Apoptosis was measured with an Annexin V/FITC kit (LHK601-100;
Bender Medsystems, Austria) according to the manufacturer’s
protocol. Each assay was repeated three times.
In vitro wound healing assay
Cell migration determined by the scratch assay was
performed as described previously (19). Briefly, an open area or ‘scratch’
was produced in 90% PANC-1 cell monolayers using a 200-ml pipette
tip. The cell cultures were washed for several times to remove the
displaced cells in the open area, and then maintained in McCoy’s 5A
culture medium for 48 h. The extent of wound closure was examined
by phase-contrast microscopy.
Tumorigenicity in nude mice
The tumorigenicity assay was performed as previously
described (18). Nude mice were
purchased from the Experimental Animal Center of Shanghai
(Shanghai, China) and randomly divided into 2 groups (n=4). To
establish orthotopic pancreatic tumors, animals were anesthetized
and the pancreas was exposed via an abdominal incision. The mice
were injected into the pancreas at a single site with
2×10⁶ miR-192-overexpressing or empty vector-transduced
PANC-1 cells. After tumor cell implantation, the pancreas was
carefully returned to the peritoneal cavity and the abdomen was
closed. All animals were monitored for 30 days for tumor formation
and then sacrificed. The mean tumor volume was calculated.
Protein extraction and western blot
analysis
In the present study, we used primary antibodies
against S-phase kinase-associated protein 2 (SKP-2; ab68455;
1:100), P27 (ab7961; 1:100), cyclin D1 (ab6152; 1:100), cyclin D2
(ab3087; 1:100), P130 (ab80628; 1:500), P107 (ab2451; 1:500), CDC2
(ab18; 1:500), cyclin-dependent kinase 4 (CDK4; ab7955; 1:500),
smad interacting protein 1 (SIP1; ab25837; 1:2,000), collagen I
(ab34710; 1:5,000) (all from Abcam, Cambridge, UK), and P21
(sc-6246; 1:50), retinoblastoma protein (RB1; sc-73598; 1:500), and
β-actin; (1:2,000) (all from Santa Cruz Biotechnology, Inc., Santa
Cruz, CA, USA). Protein isolation and western blotting were carried
out as previously described (18).
Briefly, tissues were lysed in a 10 mM Tris-buffer (pH 7.4)
containing 1% sodium dodecyl sulfate (SDS) and complete protease
inhibitors (Roche). Samples of the lysates (50 μg) were separated
by SDS-polyacrylamide gel electrophoresis (12% polyacrylamide gel),
transferred to polyvinylidene fluoride membranes (Millipore,
Bedford, MA, USA), and probed with the primary antibodies. After
incubation with the horseradish peroxidase-conjugated secondary
antibody (Santa Cruz Biotechnology), the blots were visualized with
enhanced chemiluminescence detection reagents (sc-2048, Santa Cruz
Biotechnologies). The intensity of each band was measured using a
Fluor-S MultiImager and Quantity-One software (Bio-Rad, Hercules,
CA, USA).
Statistical analysis
Data are presented as means ± SD. All statistical
calculations were carried out using SPSS.11 software (SPSS,
Chicago, IL, USA). Significant differences between two groups were
determined using the Student’s t-test. The difference among the
means of multiple groups was analyzed by one-way analysis of
variance followed by the Tukey’s test. Receiver operating
characteristic (ROC) curves were established to evaluate the
diagnostic potential of miR-192. The relationship between miR-192
expression and clinicopathological features was analyzed using the
Chi-square test. A difference was defined as significant at
p<0.05.
Results
Distinct miRNA expression profiles in
PDAC and normal pancreatic tissues
The differentially expressed miRNAs in pooled tissue
extracts of 10 PDACs and adjacent normal controls were identified.
Eight miRNAs (miR-194*, miR-192*, miR-602,
miR-801, miR-194, miR-192, miR-212 and miR-34a*) showed
upregulated expression and 8 (miR-923, miR-139-3p, miR-513a-5p,
miR-630, miR-30c-1*, miR-887, miR-508-5p, and
miR-516a-5p) showed downregulated expression in PDAC pools, with a
cut-off value of a 1.15-fold change (Table I). Since miR-192 is linked to
pancreatic cancer progression (10)
and its function has been studied to a lesser extent in this
malignancy, in this study we focused on its expression, biological
role, and diagnostic potential in PDAC.
 | Table IDifferentially expressed miRNAs in
PDAC and normal pancreatic tissues. |
Table I
Differentially expressed miRNAs in
PDAC and normal pancreatic tissues.
| miRNA | Mean CA | Mean N | Fold (CA/N) | P-value |
|---|
|
hsa-miR-194* | 2.037867 | 0.854847 | 2.383897 | 0.016501 |
|
hsa-miR-192* | 4.006635 | 2.186735 | 1.832245 | 0.021953 |
| hsa-miR-602 | 3.635497 | 2.793224 | 1.301542 | 0.019506 |
| hsa-miR-801 | 6.470025 | 5.068935 | 1.276407 | 0.03212 |
| hsa-miR-194 | 9.243658 | 7.474524 | 1.236689 | 0.010702 |
| hsa-miR-192 | 9.850274 | 8.345187 | 1.180354 | 0.024704 |
| hsa-miR-212 | 5.119245 | 4.390118 | 1.166084 | 0.009916 |
|
hsa-miR-34a* | 3.098899 | 2.69141 | 1.151404 | 0.022457 |
| hsa-miR-923 | 13.0211 | 14.90239 | 0.873759 | 0.00042 |
| hsa-miR-139-3p | 3.817374 | 4.661482 | 0.818918 | 0.030804 |
|
hsa-miR-513a-5p | 4.087004 | 5.163924 | 0.791453 | 0.025165 |
| hsa-miR-630 | 6.331195 | 8.517886 | 0.743282 | 0.024383 |
|
hsa-miR-30c-1* | 1.7912 | 2.42261 | 0.739368 | 0.044192 |
| hsa-miR-887 | 2.955096 | 4.281118 | 0.690263 | 0.04656 |
| hsa-miR-508-5p | −0.07768 | 1.467253 | 0.681546 | 0.001305 |
|
hsa-miR-516a-5p | 1.397406 | 3.67883 | 0.379851 | 0.015698 |
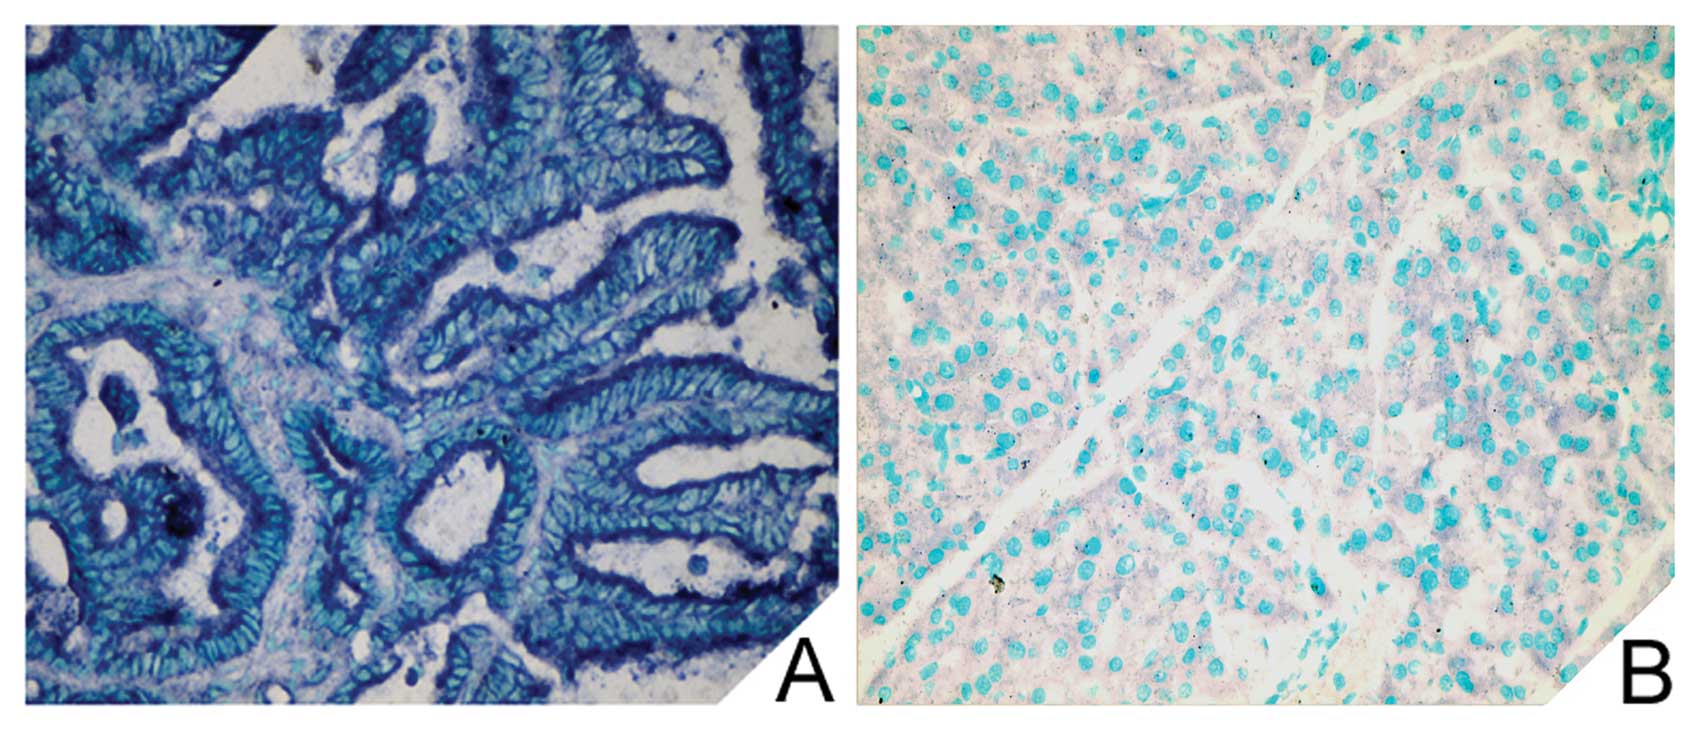
To confirm the microarray results, tissue miR-192
expression was examined by LNA-ISH. Positive cytoplasmic staining
for miR-192 was evident in tumor cells but was rarely noted in the
stromal cells of the PDAC specimens (Fig. 1A). However, no miR-192 positivity
was found in the adjacent normal pancreatic tissues (Fig. 1B).
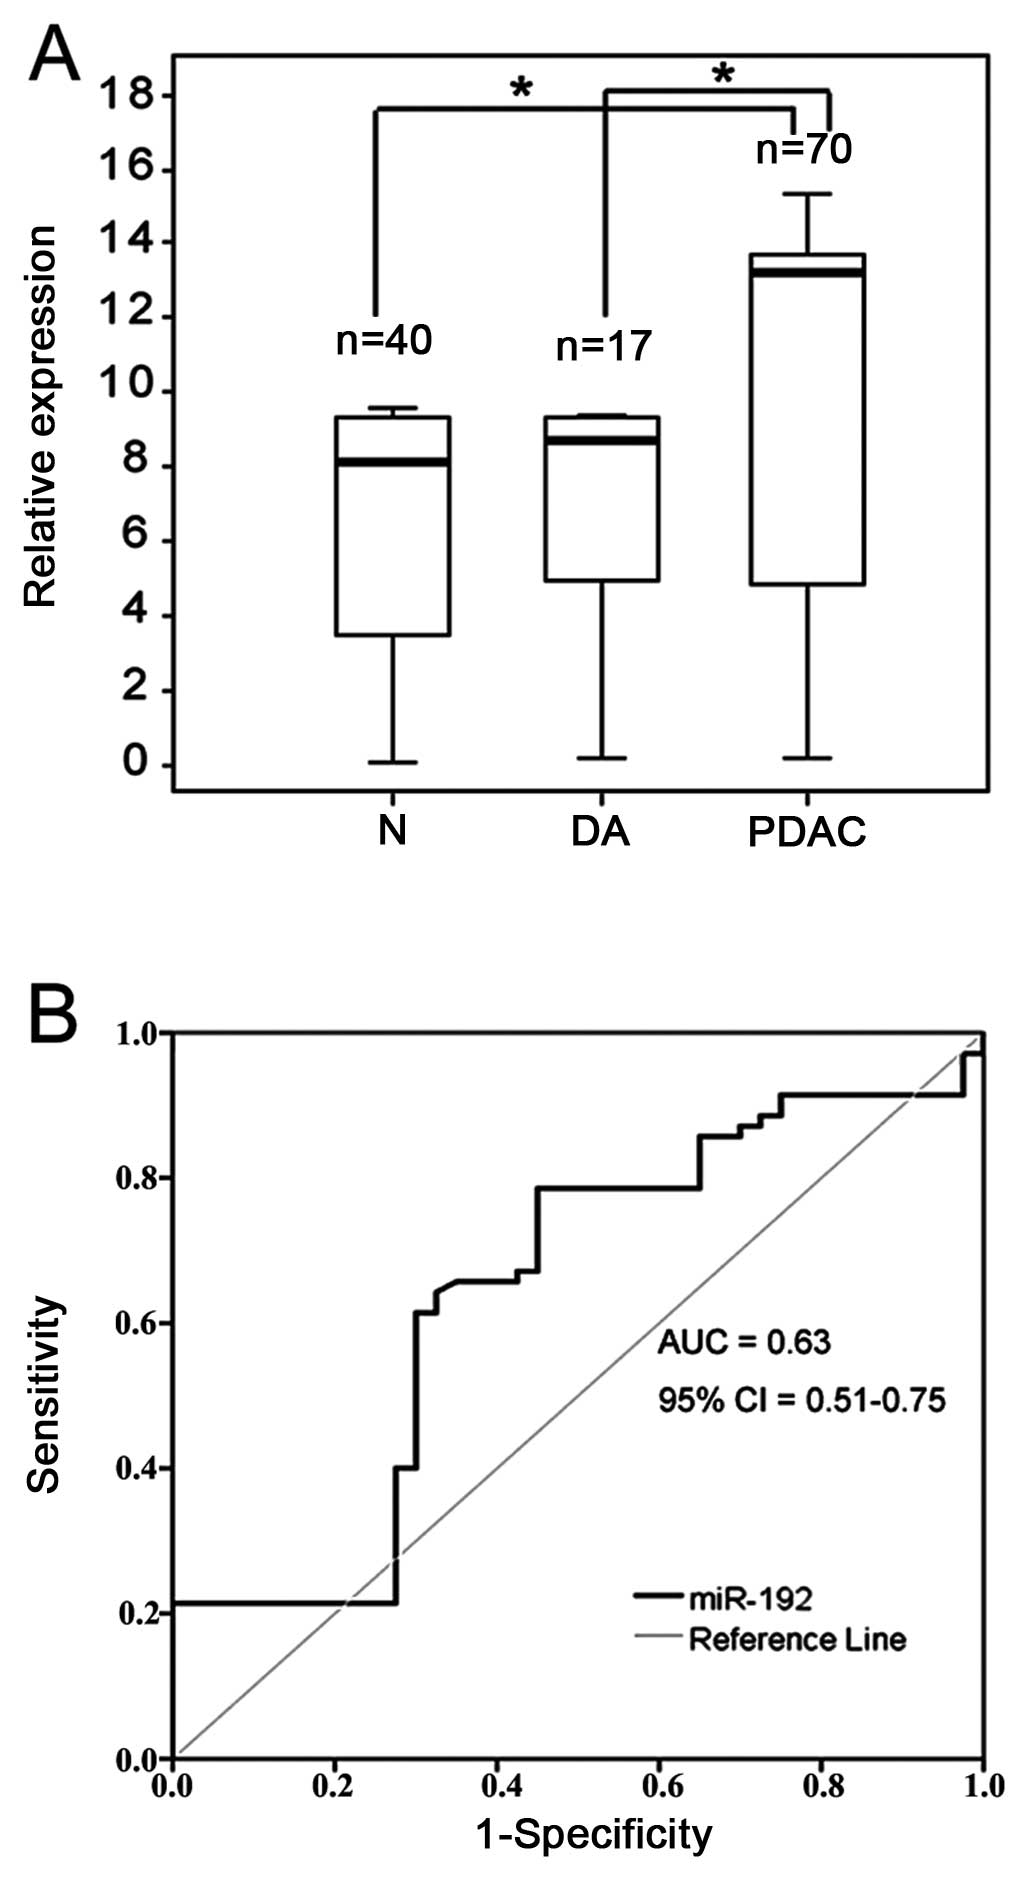
Clinical significance of circulating
miR-192 in PDAC
Notably, PDAC patients had >5-fold greater
concentrations of serum miR-192 than duodenal adenocarcinoma
patients or healthy controls (p<0.05 for each comparison)
(Fig. 2A). However, no significant
difference in the serum miR-192 level was observed between duodenal
adenocarcinoma patients and healthy controls.
To further assess the diagnostic significance of
serum miR-192 levels in differentiating between PDAC patients and
healthy individuals, ROC curves were constructed (Fig. 2B). The area under the curve (AUC)
was 0.63 (95% CI, 0.51–0.75). Using an optimal cut-off point, the
sensitivity was 76% and the specificity was 55%. Table II shows the association of the
serum level of miR-192 and the clinicopathological factors of the
70 PDAC patients. No correlation was found between the serum
miR-192 level and any variable tested, including gender, age, tumor
size, or pathological type (p>0.05).
| Table IICorrelation of serum miRNA-192 levels
with clinicopathological parameters of the PDAC patients. |
Table II
Correlation of serum miRNA-192 levels
with clinicopathological parameters of the PDAC patients.
| | miR-192 |
|---|
| |
|
|---|
| Characteristic | N | Value | P-value |
|---|
| Gender |
| Male | 42 | 0.19±0.22 | 0.838 |
| Female | 28 | 0.20±0.18 | |
| Age (years) |
| ≤60 | 32 | 0.19±0.22 | 0.975 |
| >60 | 38 | 0.19±0.18 | |
| Location of
tumora |
| Head | 40 | 0.20±0.19 | 0.858 |
| Body/Tail | 26 | 0.19±0.22 | |
| Size of tumor
(cm)a |
| ≤2.0 | 8 | 0.19±0.24 | 0.945 |
| >2.0 | 58 | 0.20±0.20 | |
| Histological
gradea |
| G1 | 2 | 0.14±0.11 | 0.325 |
| G2 | 50 | 0.18±0.23 | |
| G3 | 14 | 0.29±0.18 | |
| PTa |
| T1 | | | 0.075 |
| T2 | 26 | 0.16±0.19 | |
| T3 | 26 | 0.18±0.20 | |
| T4 | 14 | 0.40±0.27 | |
| PNa |
| Absent | 39 | 0.17±0.22 | 0.952 |
| Present | 27 | 0.19±0.18 | |
| PTNMa |
| I | 15 | 0.14±0.21 | 0.195 |
| II | 21 | 0.26±0.19 | |
| III | 27 | 0.20±0.20 | |
| IV | 3 | 0.30±0.48 | |
| CA19-9a |
| ≤37 | 18 | 0.15±0.20 | 0.116 |
| >37 | 48 | 0.22±0.2 | |
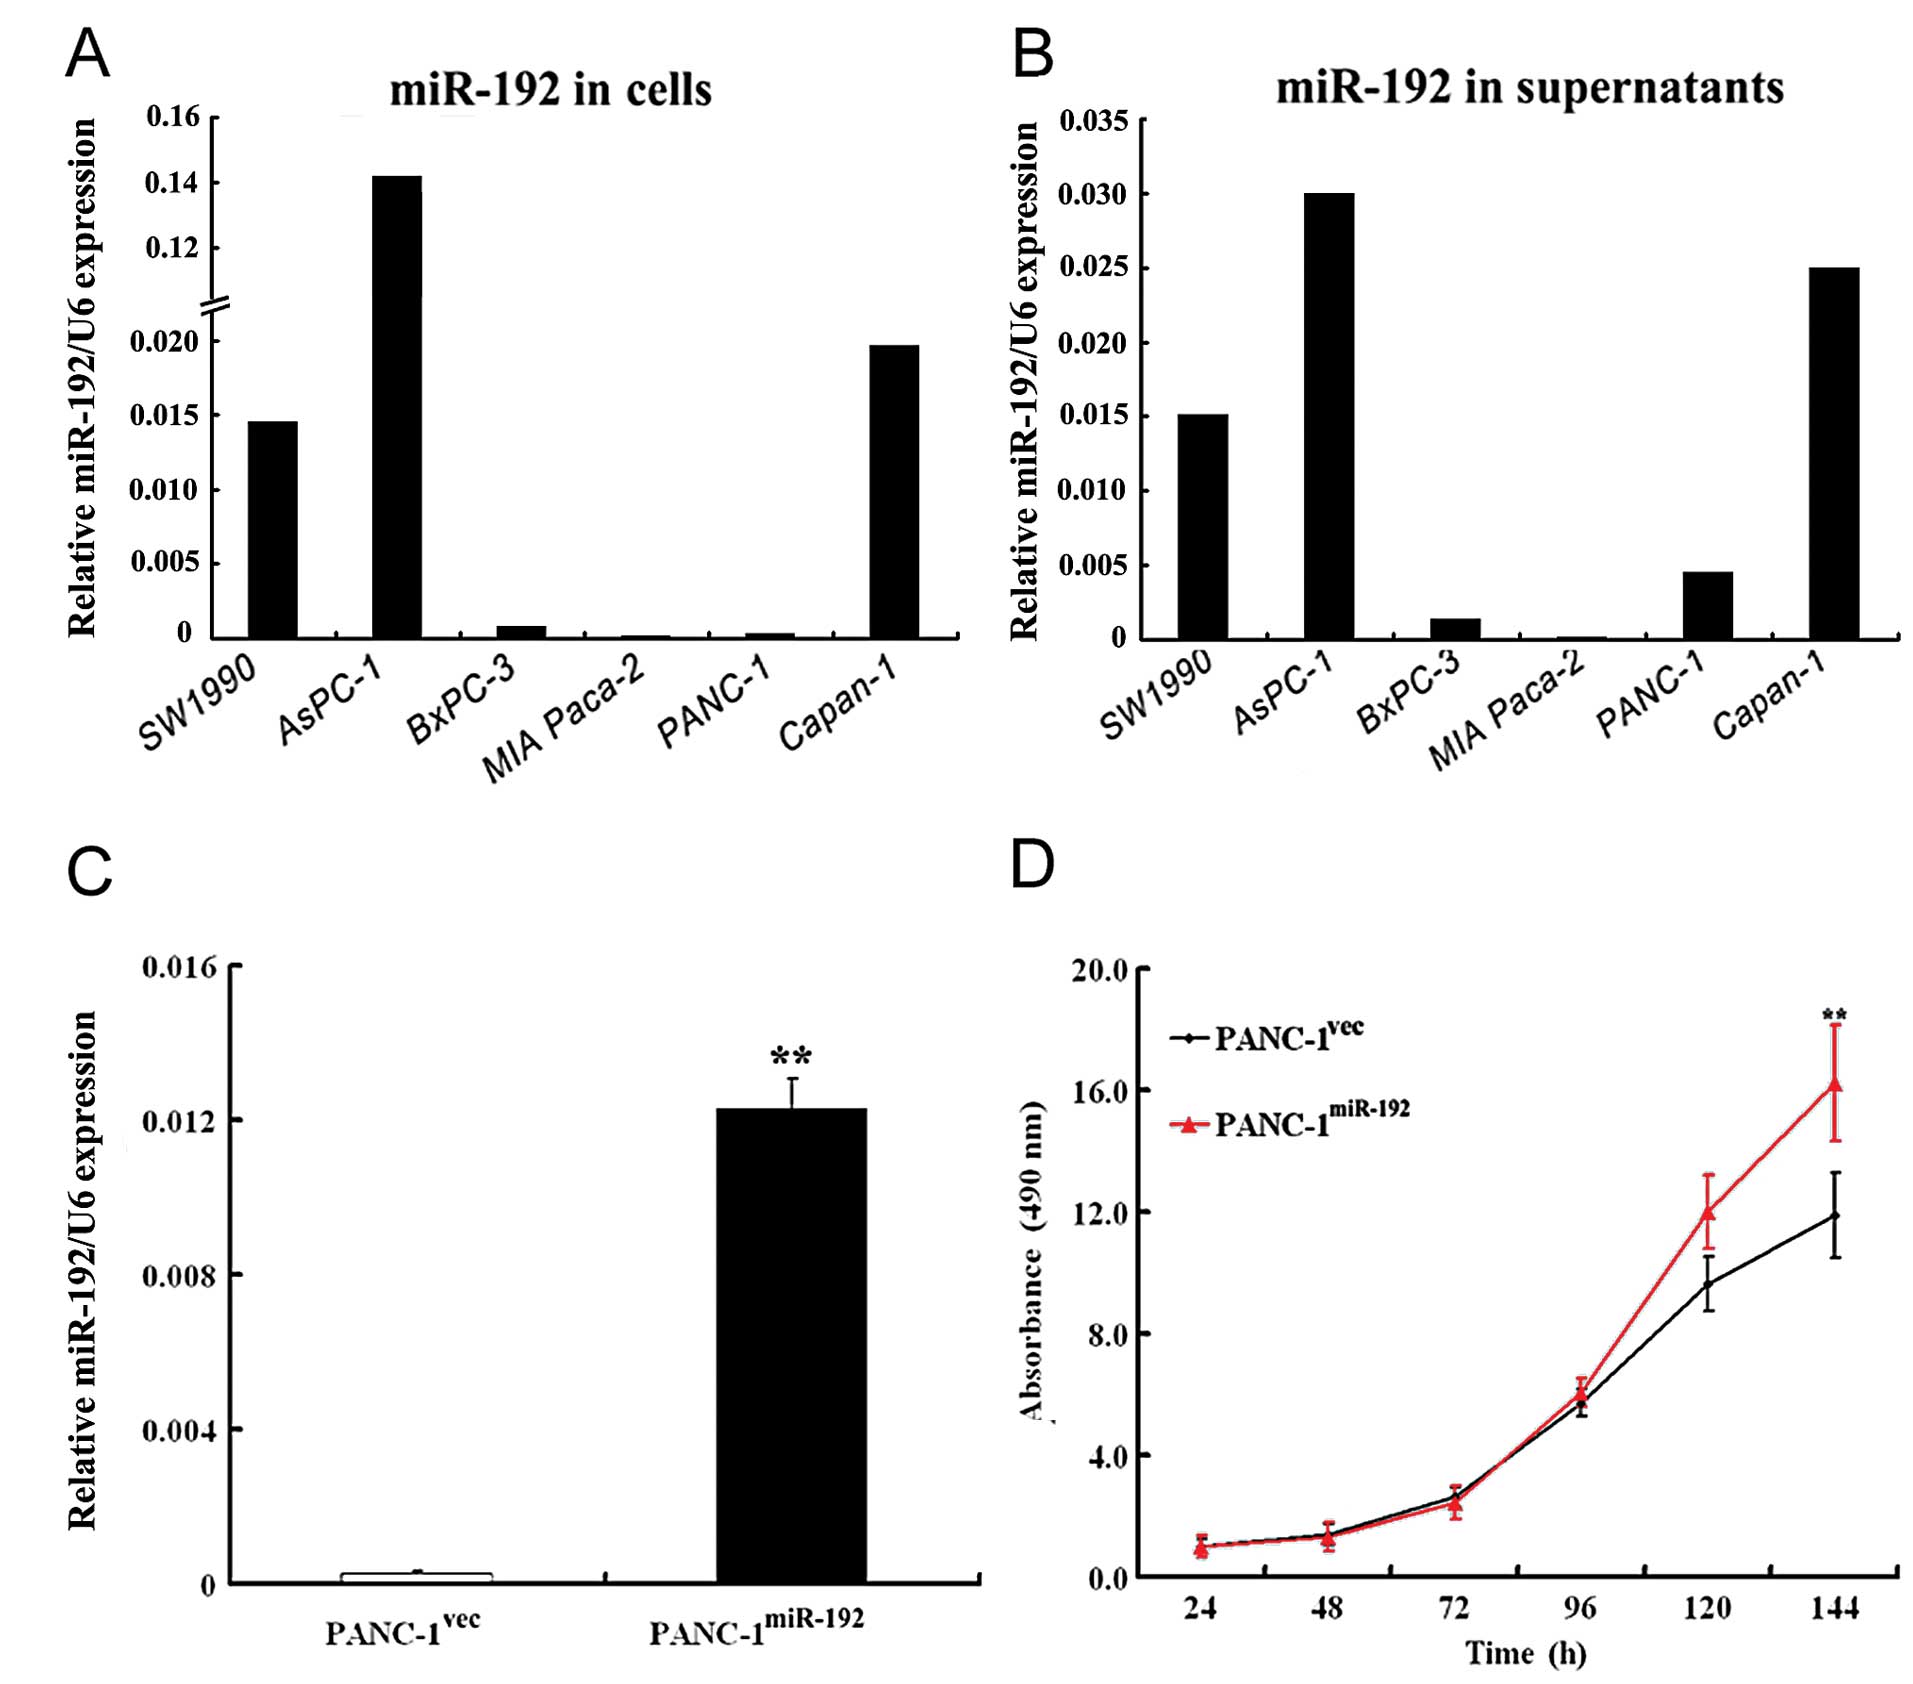
Effects of miR-192 overexpression on cell
growth, survival, and migration of pancreatic cancer cells
miR-192 was the most abundant in AsPC-1 cells,
followed by Capan-1, SW1990, BxPC-3, PANC-1 and MIA Paca-2 cells
(Fig. 3A). Similar findings were
noted in their culture supernatants (Fig. 3B). The delivery of
miR-192-expressing constructs (pGC-LV-miR-192) resulted in a
significant elevation in miR-192 expression, as compared to the
control cells transfected with the pGC-LV empty vector (p<0.01;
Fig. 3C).
The MTT assay revealed that miR-192 overexpression
significantly promoted cell proliferation in PANC-1 cells in
comparison with that in the empty vector-transfected cells
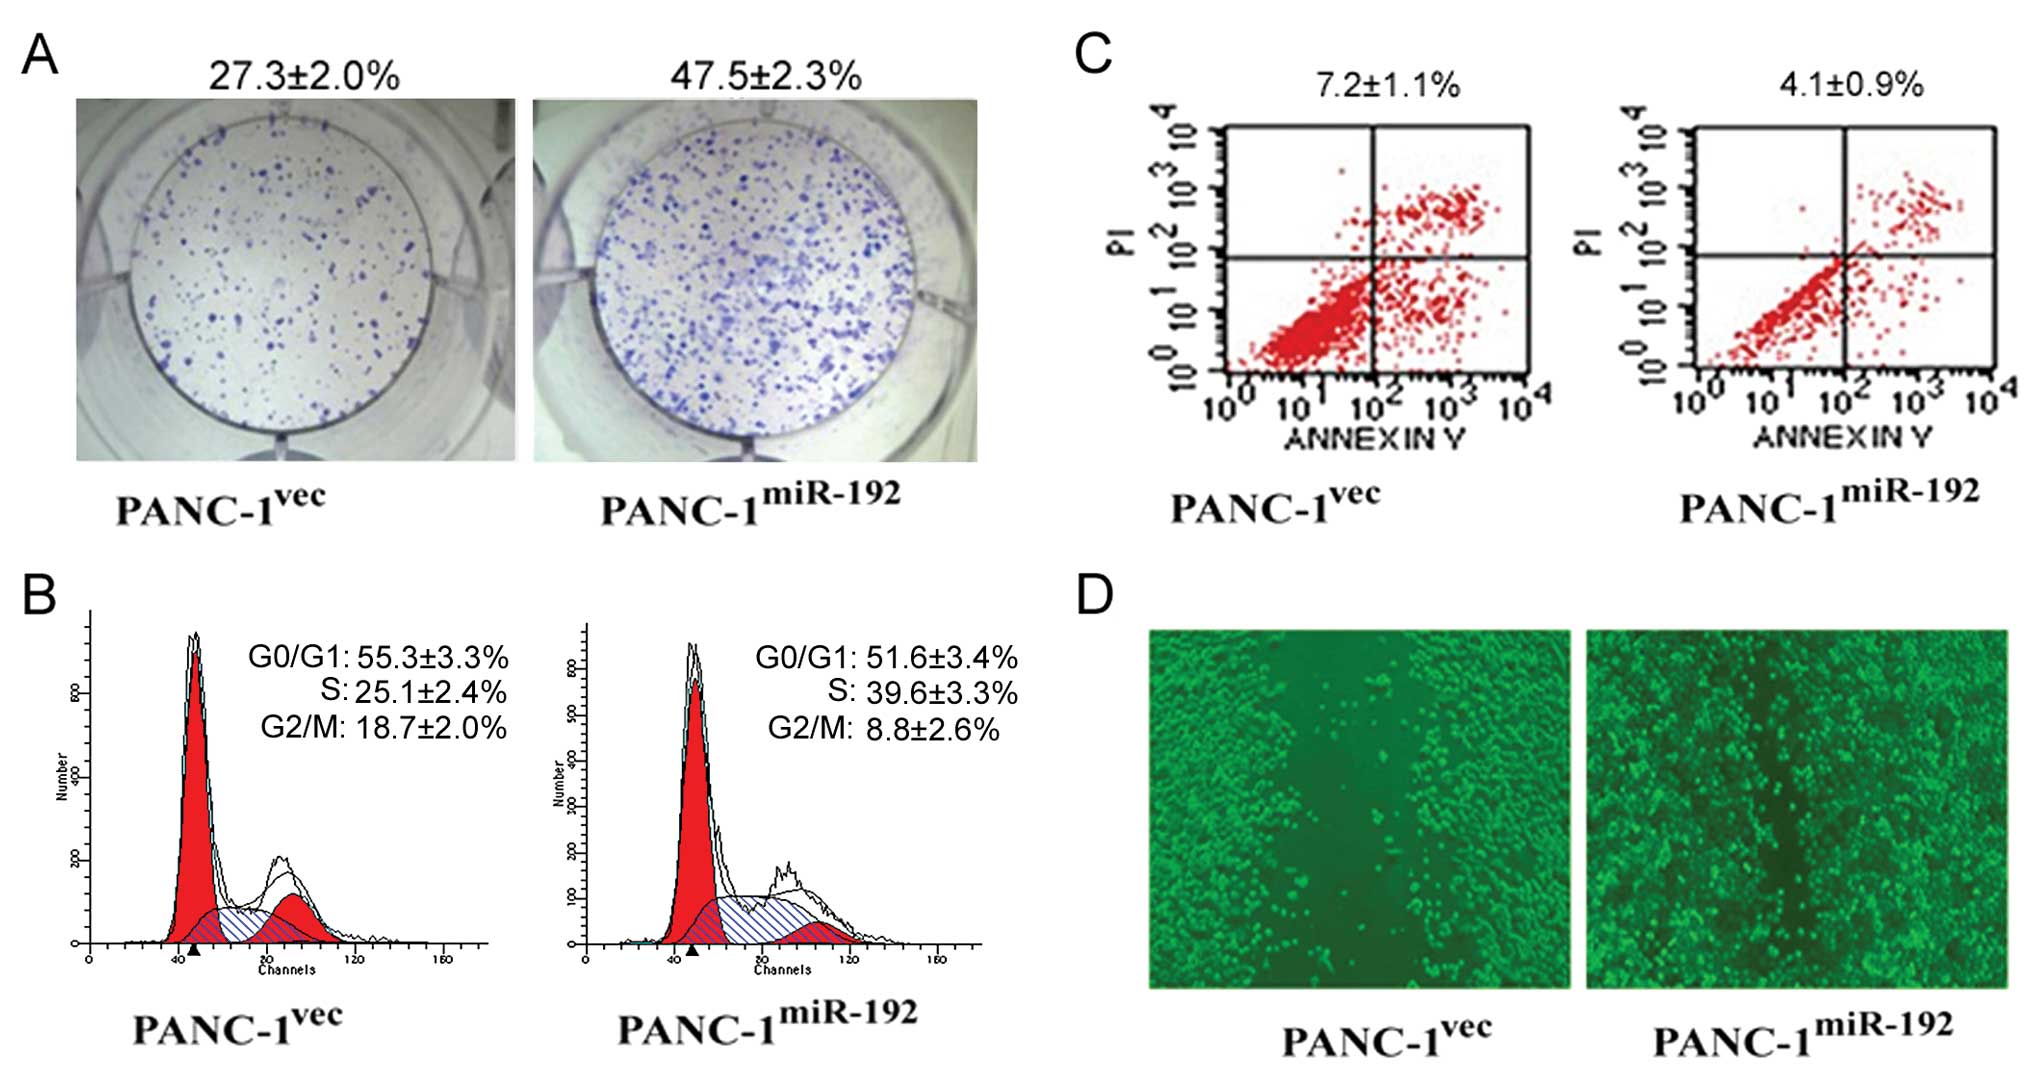
(p<0.01; Fig. 3D). The colony
formation assay showed that miR-192-overexpressing PANC-1 cells had
a significantly higher colony formation rate than the empty vector
transfectants (47.5±2.3 vs. 27.3±2.0%) (Fig. 4A). Overexpression of miR-192
increased the percentage of cells in the S phase and decreased the
proportion of cells in the G0/G1 and G2/M phases (Fig. 4B). Moreover, there was a
significantly lower apoptotic index in the miR-192-overexpressing
cells than that in the control transfectants (4.1±0.9 vs. 7.2±1.1%)
(p<0.01; Fig. 4C). In
vitro wound healing assay further showed that enforced miR-192
expression potentiated the migration of PANC-1 cells, as evidenced
by acceleration of wound closure (Fig.
4D).
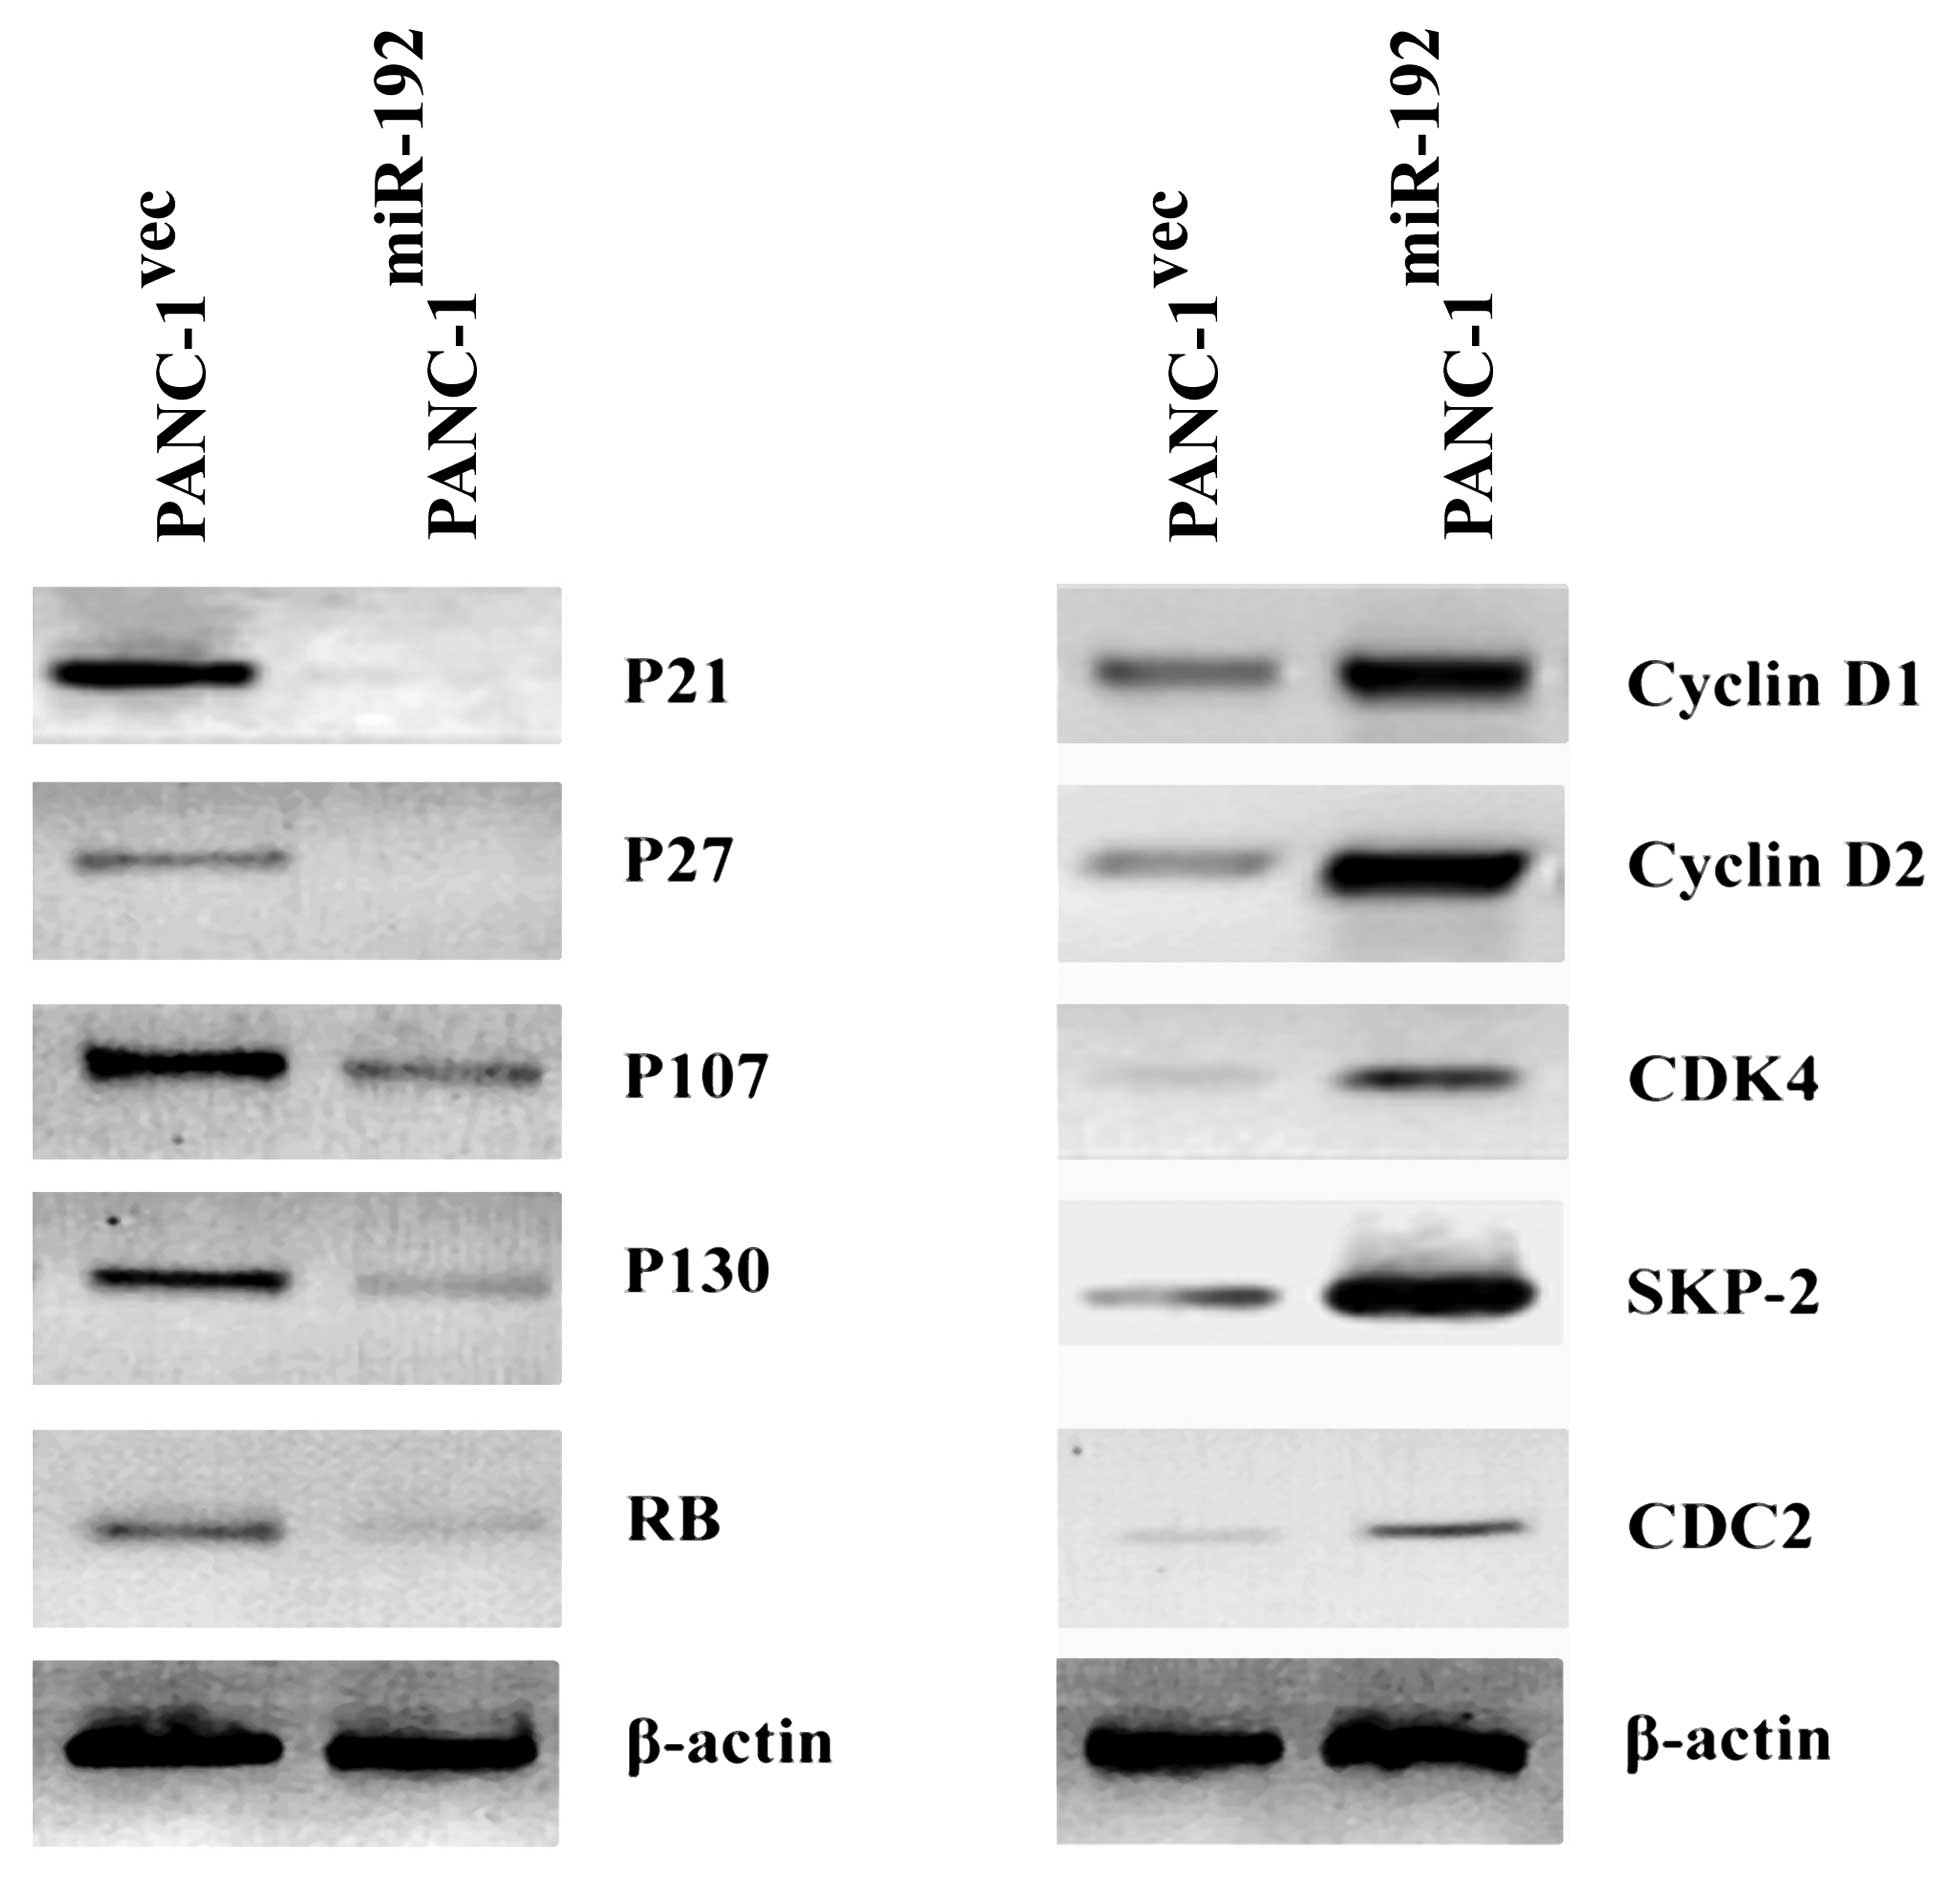
Alteration of cell cycle-related genes by
miR-192 overexpression
Western blot analysis revealed that the expression
levels of P21, P27, P107, P130 and RB were lower in
miR-192-overexpressing PANC-1 cells than that in the empty
vector-transfected counterparts (Fig.
5). In contrast, there were increased protein levels of cyclin
D1, cyclin D2, CDK4, SKP-2 and CDC2 in the miR-192-overexpressing
PANC-1 cells relative to the control transfectants (Fig. 5).
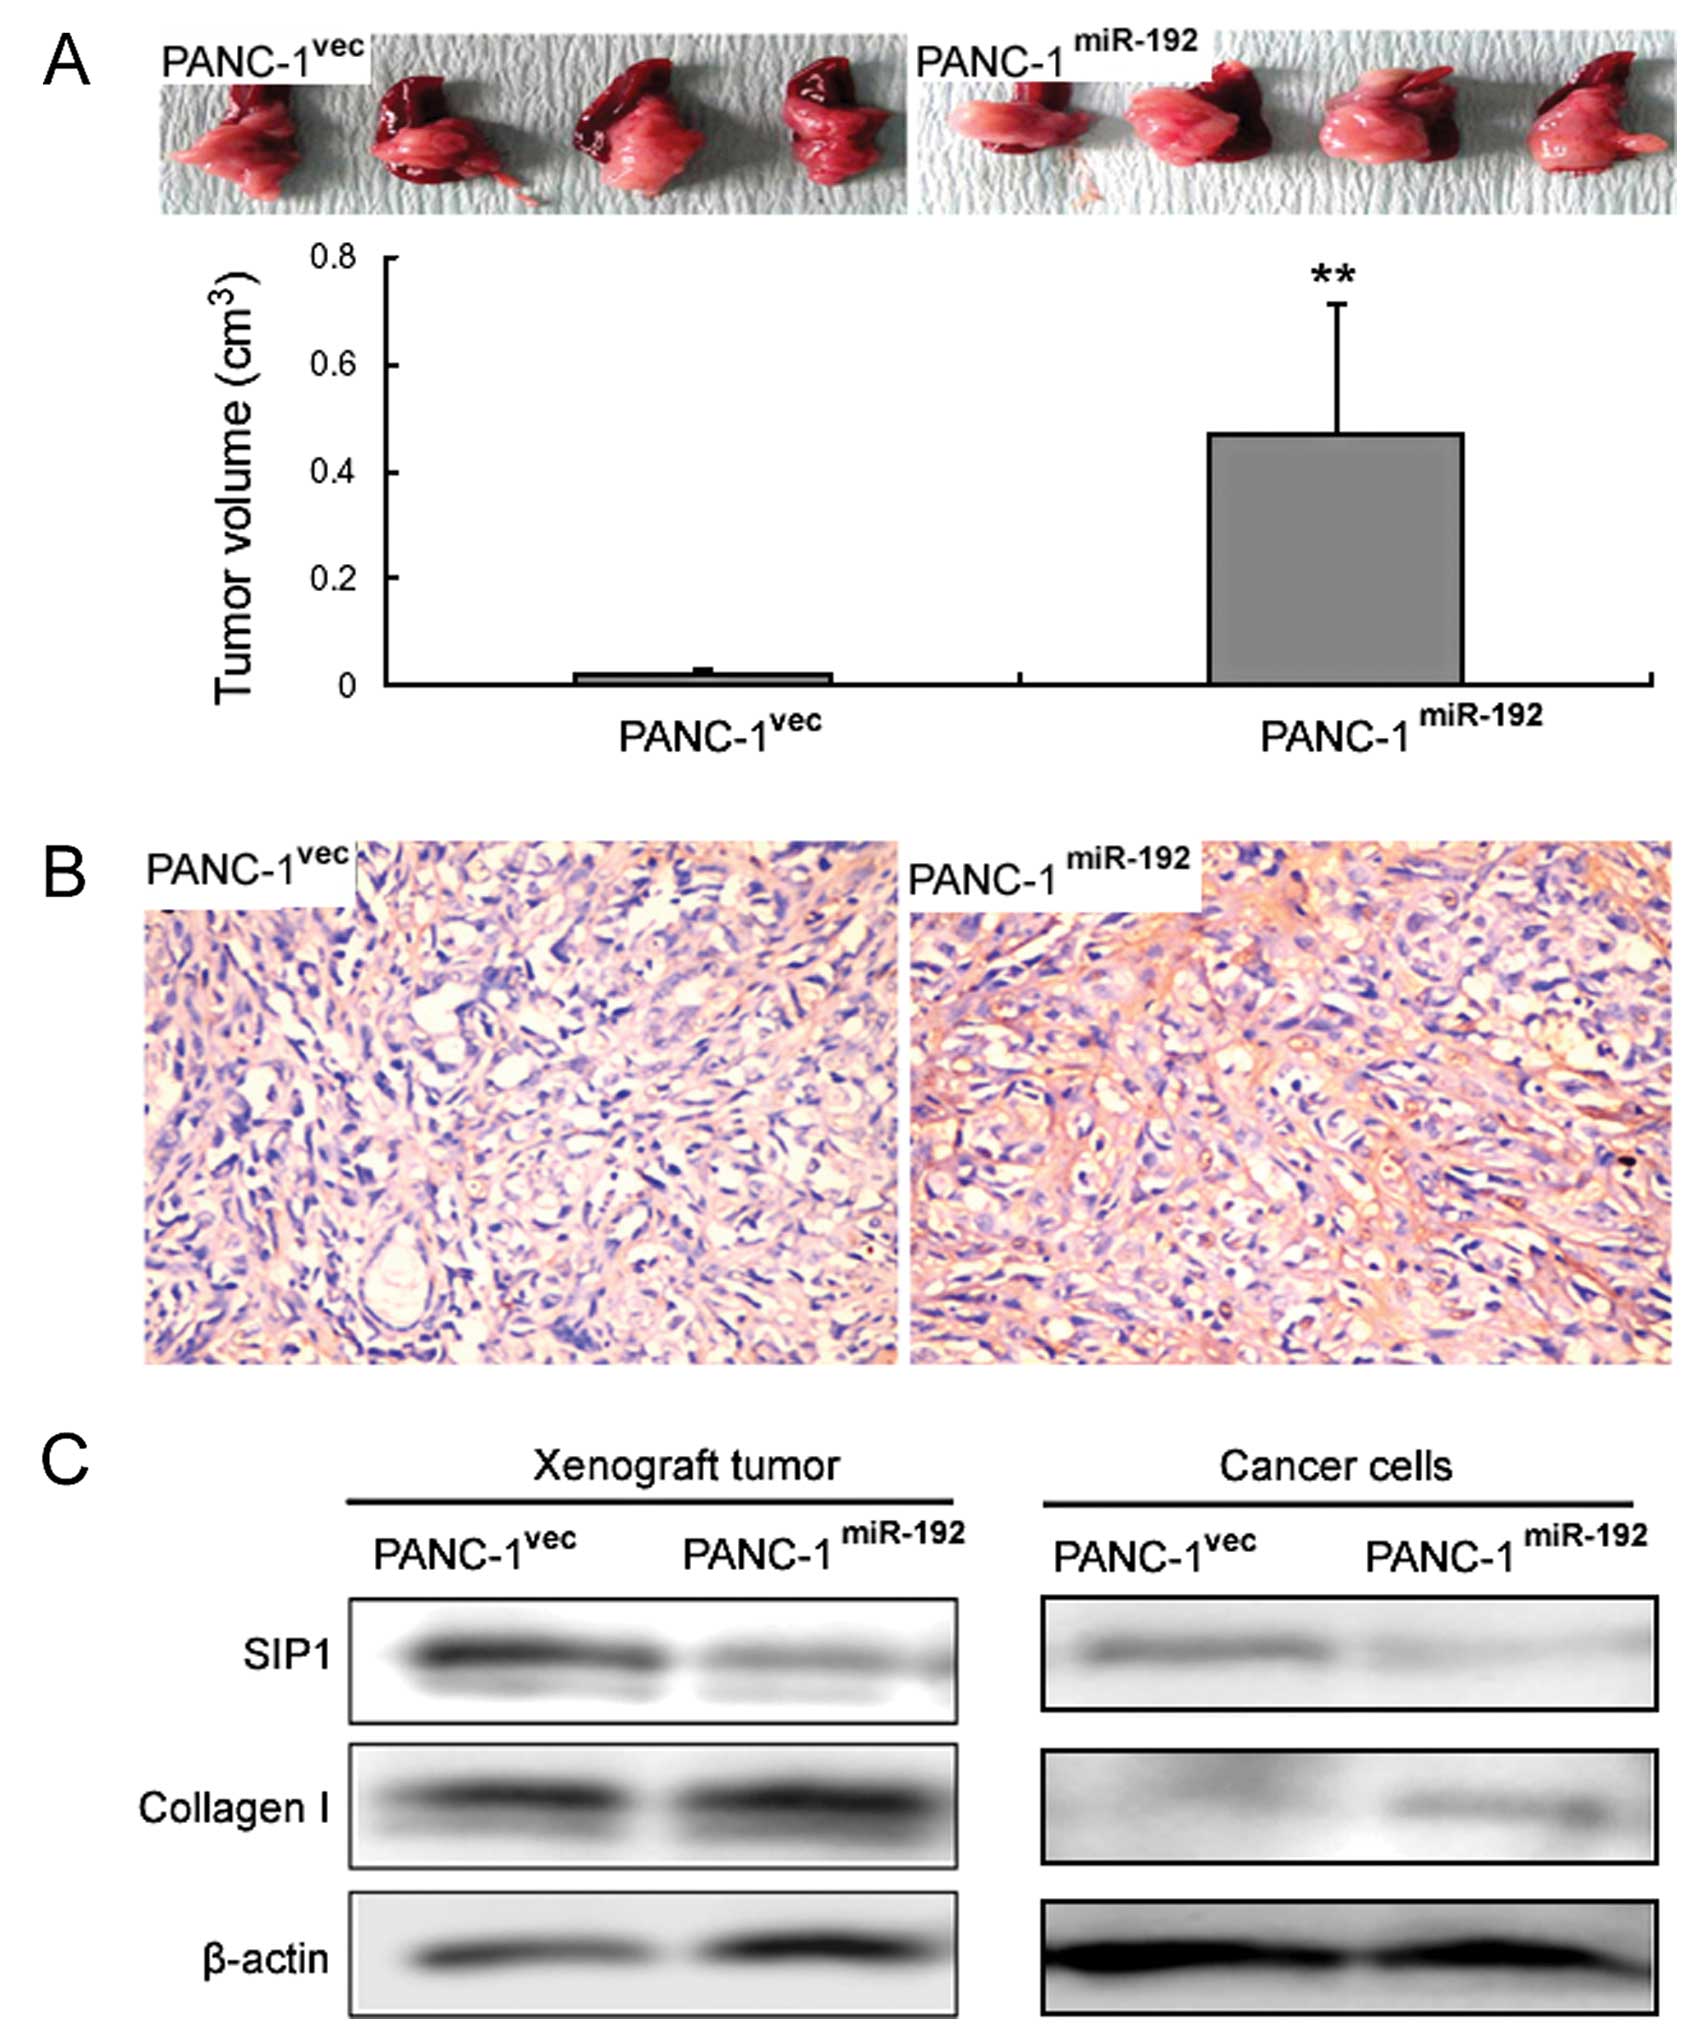
Effects of miR-192 overexpression on
tumor growth in a PANC-1 xenograft model
miR-192-overexpressing PANC-1 cells formed
significantly larger tumors in nude mice when compared with those
in the control transfectants (0.47±0.24 vs. 0.02±0.01
cm3, p<0.01) (Fig.
6A). Immunohistochemistry revealed that miR-192 xenograft
tumors displayed stronger immunoreactivity for collagen I when
compared with that in the control xenograft tumors (Fig. 6B). Western blot analysis further
confirmed the immunohistochemical results (Fig. 6C). In contrast, the SIP1 protein
level was profoundly reduced in the miR-192 xenograft tumors when
compared to that in the control tumors (Fig. 6C). Additionally,
miR-192-overexpressing PANC-1 cells showed reduced SIP1 protein
levels and elevated collagen I protein levels (Fig. 6C).
Discussion
Serum miRNA profiles change during tumor development
(11). Serum levels of miR-141 (an
miRNA abundant in prostate cancer) can distinguish prostate cancer
patients from healthy controls (12). Using the miRNA microarray
technology, we identified a set of differentially expressed miRNAs,
including miR-194 and miR-192, between human PDAC and adjacent
normal pancreatic tissues. It has been shown that upregulation of
miR-194 correlates with reduced expression of tumor-suppressor
EP300 in metastatic PDAC cells (13), suggesting a favorable role of
miR-194 in PDAC progression. In the present study, we focused on
the less studied miR-192, attempting to determine its diagnostic
and functional significance in PDAC. Our present data revealed that
serum miR-192 concentrations were significantly higher in PDAC
patients than these concentrations in duodenal adenocarcinoma
patients and healthy controls. ROC curve analysis revealed that
serum miR-192 levels were able to differentiate between PDAC
patients and healthy individuals, with a sensitivity and
specificity of 76 and 55%, respectively. Although the
discriminating power of miR-192 alone indicated by the AUC value
(0.627) was relatively lower than the expectations of clinical
utility, its combination with other miRNAs or protein biomarkers
would improve predictive accuracy and robustness. Indeed, the
combination of the four miRNAs (miR-21, miR-210, miR-155 and
miR-196a) increased the AUC value from 0.62 to 0.69 ranging up to
0.82 for pancreatic cancer detection (14).
Cellular miRNAs can be encapsulated in exosome-like
vesicles and released into the extracellular environment (15,16).
In support of this view, our data revealed that miR-192 was present
in the culture supernatants of a panel of pancreatic cancer cell
lines. The mechanism of miRNA release is still not completely
understood. However, recent studies suggest that miRNA release may
be mediated through a ceramide-dependent secretory machinery
(17). Our data indicated an
upregulation of miR-192 in PDAC specimens compared to adjacent
normal tissues. Moreover, serum miR-192 levels were elevated in
PDAC patients relative to duodenal adenocarcinoma patients and
healthy controls. These findings suggest that PDAC cells rather
than non-malignant pancreatic cells abundantly express and release
miR-192, which provide a rationale for the evaluation of
circulating miR-192 as a potential biomarker for PDAC
diagnosis.
Extensive studies indicate that miRNAs play critical
roles in cancer development and progression. miR-192 can function
as an effector and regulator of p53 and induce cell cycle arrest in
tumor cells (18). Song et
al(18) also found that miR-192
overexpression suppresses cell proliferation in colon cancer cell
lines through induction of p53-dependent cell cycle arrest at both
the G1 and G2 phases. In lung cancer cells, miR-192 was found to
inhibit cell proliferation through targeting RB1 (19). Our results are highly inconsistent
with these previous studies. We found that ectopic expression of
miR-192 promoted cell proliferation and facilitated cell cycle
progression through the G1 to S phase in pancreatic cancer cell
lines. Western blot analysis further revealed the deregulation of
numerous cell cycle-related molecules. Cyclins and CDKs are
important positive regulators with a central role in cell cycle
progression. In contrast, a class of molecules called CDK
inhibitors including P21 and P27 negatively regulates the cell
cycle (20). The RB family members
(RB, p107 and p130) are another group of negative regulators of the
cell cycle and each of them can elicit G1-S growth arrest through
interfering with E2F-dependent transcription (21). SKP-2, through its F-box domain,
forms the SCF complex with SKP-1 and Cullin-1 to constitute an E3
ligase for ubiquitylation. SKP-2 has been found to promote S-phase
progression by degrading negative cell cycle regulators including
P21, P27, P57 and P130 (22).
Interestingly, we found that miR-192 overexpression diminished the
expression of P21, P27, P107, P130 and RB and increased the
expression of cyclin D1, cyclin D2, CDK4, CDC2 and SKP-2. These
results provide an explanation at the molecular level for the
promotion of PDAC cell proliferation by miR-192. The
growth-promoting effects of miR-192 overexpression were also
observed in the in vitro colony formation assay and in
vivo xenograft tumor model. This inconsistency with previous
reports (18,19,23)
may reflect the effects on the functional consequences of
manipulating miRNA. Similar to miR-192, miR-17-5p is able to act as
both an oncogene and a tumor suppressor in different types of
cancer cells (24). In addition to
promotion of cell growth, we noted that enforced expression of
miR-192 attenuated cell apoptosis and stimulated cell migration in
pancreatic cancer cells. These findings collectively suggest that
miR-192 acts as an oncogene in pancreatic cancer, thus representing
a potential therapy target for this disease.
A single miRNA can coordinate a large number of
target genes (25). Several miR-192
targets have been identified in different cells and organs.
Microarray experiments have shown that 62 genes are downregulated
following miR-192 overexpression, 8 of which have been validated as
targets of miR-192 involved in cell cycle control (26). RB1 was found to be a target of
miR-192, which mediates an effect on cell apoptosis through the
caspase pathway (19). miR-192
inhibits nucleotide excision repair by targeting ERCC3 and ERCC4 in
HepG2.2.15 cells (27). Our present
data suggest SIP1 as a potential target of miR-192, as
overexpression of miR-192 led to a marked repression of SIP1
protein expression in PANC-1 cells. In agreement with our data, a
previous study demonstrated that miR-192 decreased endogenous SIP1
expression as well as reporter activity of an SIP1 3′
UTR-containing luciferase construct in mouse mesangial cells
(28). SIP1 was found to induce G1
phase cell cycle arrest in squamous carcinoma cells by repressing
cyclin D1 transcription (29). In
human RT112 bladder carcinoma cells, SIP1 also profoundly repressed
the G1 to S phase transition (30).
It remains to be determined, however, whether, and to what extent,
downregulation of SIP1 mediates the growth-promoting effects of
miR-192 in PDAC. In contrary to SIP1, we found an upregulation of
collagen I protein by miR-192 overexpression. It has been
documented that elevated collagen I synthesis facilitates
pancreatic cancer spread by increasing cell proliferation,
resistance to apoptosis, and migratory activity (31,32).
Imamichi et al(33) reported
that collagen I promotes downregulation of E-cadherin expression in
PANC-1 cells, which correlates with enhanced cell migration and
invasiveness. The induction of collagen I expression may partially
explain the favorable effects of miR-192 overexpression on PDAC
cell survival and migration.
However, the various limitations of this study
should be noted. The sample size was relatively small. Moreover,
there was no information concerning the discriminating capacity of
serum miR-192 in PDACs at different stages. The exact molecular
mechanisms underlying the effects of miR-192 on pancreatic cancer
cells await further elucidation. Identification of the direct, bona
fide target gene of miR-192 will be the key to address this issue.
Additionally, loss-of-function studies are needed to complement the
results of gain-of-function studies and to further confirm the
oncogenic role of miR-192 in PDAC.
In summary, our results demonstrate the potential of
serum miR-192 in differentiating between PDAC patients and healthy
controls. Enforced expression of miR-192 enhances proliferation and
migration and reduces apoptosis in PDAC, which may be associated
with alteration of cell cycle regulatory genes, downregulation of
SIP1, as well as upregulation of collagen I. These findings propose
miR-192 as a promising diagnostic and therapeutic target for
PDAC.
Acknowledgements
This study was supported by the National Key Project
of Scientific and Technical Supporting Programs of China (no.
2006BAI02A14) and National Natural Science Foundation of China (no.
30770996 and no. 81172310) to Minghua Zhu.
References
|
1
|
Jemal A, Siegel R, Xu J and Ward E: Cancer
statistics, 2010. CA Cancer J Clin. 60:277–300. 2010. View Article : Google Scholar
|
|
2
|
Li D, Xie K, Wolff R and Abbruzzese JL:
Pancreatic cancer. Lancet. 363:1049–1057. 2004. View Article : Google Scholar
|
|
3
|
Brand RE and Matamoros A: Imaging
techniques in the evaluation of adenocarcinoma of the pancreas. Dig
Dis. 16:242–252. 1998. View Article : Google Scholar : PubMed/NCBI
|
|
4
|
Goonetilleke KS and Siriwardena AK:
Systematic review of carbohydrate antigen (CA 19–9) as a
biochemical marker in the diagnosis of pancreatic cancer. Eur J
Surg Oncol. 33:266–270. 2007.PubMed/NCBI
|
|
5
|
Kawai S, Suzuki K, Nishio K, et al:
Smoking and serum CA19–9 levels according to Lewis and secretor
genotypes. Int J Cancer. 123:2880–2884. 2008.
|
|
6
|
Koopmann J, Rosenzweig CN, Zhang Z, et al:
Serum markers in patients with resectable pancreatic
adenocarcinoma: macrophage inhibitory cytokine 1 versus CA19–9.
Clin Cancer Res. 12:442–446. 2006.PubMed/NCBI
|
|
7
|
Bünger S, Laubert T, Roblick UJ and
Habermann JK: Serum biomarkers for improved diagnostic of
pancreatic cancer: a current overview. J Cancer Res Clin Oncol.
137:375–389. 2011.PubMed/NCBI
|
|
8
|
Cortez MA, Welsh JW and Calin GA:
Circulating microRNAs as noninvasive biomarkers in breast cancer.
Recent Results Cancer Res. 195:151–161. 2012. View Article : Google Scholar : PubMed/NCBI
|
|
9
|
Redova M, Poprach A, Nekvindova J, et al:
Circulating miR-378 and miR-451 in serum are potential biomarkers
for renal cell carcinoma. J Transl Med. 10:552012. View Article : Google Scholar : PubMed/NCBI
|
|
10
|
Jung DE, Wen J, Oh T and Song SY:
Differentially expressed microRNAs in pancreatic cancer stem cells.
Pancreas. 40:1180–1187. 2011. View Article : Google Scholar : PubMed/NCBI
|
|
11
|
Keller A, Leidinger P, Gislefoss R, et al:
Stable serum miRNA profiles as potential tool for non-invasive lung
cancer diagnosis. RNA Biol. 8:506–516. 2011. View Article : Google Scholar : PubMed/NCBI
|
|
12
|
Mitchell PS, Parkin RK, Kroh EM, et al:
Circulating microRNAs as stable blood-based markers for cancer
detection. Proc Natl Acad Sci USA. 105:10513–10518. 2008.
View Article : Google Scholar : PubMed/NCBI
|
|
13
|
Mees ST, Mardin WA, Wendel C, et al: EP300
- a miRNA-regulated metastasis suppressor gene in ductal
adenocarcinomas of the pancreas. Int J Cancer. 126:114–124. 2010.
View Article : Google Scholar : PubMed/NCBI
|
|
14
|
Wang J, Chen J, Chang P, et al: MicroRNAs
in plasma of pancreatic ductal adenocarcinoma patients as novel
blood-based biomarkers of disease. Cancer Prev Res. 2:807–813.
2009. View Article : Google Scholar : PubMed/NCBI
|
|
15
|
Valadi H, Ekström K, Bossios A, Sjöstrand
M, Lee JJ and Lötvall JO: Exosome-mediated transfer of mRNAs and
microRNAs is a novel mechanism of genetic exchange between cells.
Nat Cell Biol. 9:654–659. 2007. View
Article : Google Scholar : PubMed/NCBI
|
|
16
|
Rabinowits G, Gercel-Taylor C, Day JM,
Taylor DD and Kloecker GH: Exosomal microRNA: a diagnostic marker
for lung cancer. Clin Lung Cancer. 10:42–46. 2009. View Article : Google Scholar : PubMed/NCBI
|
|
17
|
Kosaka N, Iguchi H, Yoshioka Y, Takeshita
F, Matsuki Y and Ochiya T: Secretory mechanisms and intercellular
transfer of microRNAs in living cells. J Biol Chem.
285:17442–17452. 2010. View Article : Google Scholar : PubMed/NCBI
|
|
18
|
Song B, Wang Y, Kudo K, Gavin EJ, Xi Y and
Ju J: miR-192 regulates dihydrofolate reductase and cellular
proliferation through the p53-microRNA circuit. Clin Cancer Res.
14:8080–8086. 2008. View Article : Google Scholar : PubMed/NCBI
|
|
19
|
Feng S, Cong S, Zhang X, et al:
MicroRNA-192 targeting retinoblastoma 1 inhibits cell proliferation
and induces cell apoptosis in lung cancer cells. Nucleic Acids Res.
39:6669–6678. 2011. View Article : Google Scholar : PubMed/NCBI
|
|
20
|
Vermeulen K, Van Bockstaele DR and
Berneman ZN: The cell cycle: a review of regulation, deregulation
and therapeutic targets in cancer. Cell Prolif. 36:131–149. 2003.
View Article : Google Scholar : PubMed/NCBI
|
|
21
|
Classon M, Salama S, Gorka C, Mulloy R,
Braun P and Harlow E: Combinatorial roles for pRB, p107, and p130
in E2F-mediated cell cycle control. Proc Natl Acad Sci USA.
97:10820–10825. 2000. View Article : Google Scholar : PubMed/NCBI
|
|
22
|
Frescas D and Pagano M: Deregulated
proteolysis by the F-box proteins SKP2 and beta-TrCP: tipping the
scales of cancer. Nat Rev Cancer. 8:438–449. 2008. View Article : Google Scholar : PubMed/NCBI
|
|
23
|
Braun CJ, Zhang X, Savelyeva I, et al:
p53-Responsive microRNAs 192 and 215 are capable of inducing cell
cycle arrest. Cancer Res. 68:10094–10104. 2008. View Article : Google Scholar : PubMed/NCBI
|
|
24
|
Cloonan N, Brown MK, Steptoe AL, et al:
The miR-17–5p microRNA is a key regulator of the G1/S phase cell
cycle transition. Genome Biol. 9:R1272008.
|
|
25
|
Lim LP, Lau NC, Garrett-Engele P, et al:
Microarray analysis shows that some microRNAs downregulate large
numbers of target mRNAs. Nature. 433:769–773. 2005. View Article : Google Scholar : PubMed/NCBI
|
|
26
|
Georges SA, Biery MC, Kim SY, et al:
Coordinated regulation of cell cycle transcripts by p53-inducible
microRNAs, miR-192 and miR-215. Cancer Res. 68:10105–10112. 2008.
View Article : Google Scholar : PubMed/NCBI
|
|
27
|
Zhang S, Hao J, Xie F, et al:
Downregulation of miR-132 by promoter methylation contributes to
pancreatic cancer development. Carcinogenesis. 32:1183–1189. 2011.
View Article : Google Scholar : PubMed/NCBI
|
|
28
|
Katoh M and Katoh M: Integrative genomic
analyses of ZEB2: Transcriptional regulation of ZEB2 based on
SMADs, ETS1, HIF1α, POU/OCT, and NF-κB. Int J Oncol. 34:1737–1742.
2009.PubMed/NCBI
|
|
29
|
Mejlvang J, Kriajevska M, Vandewalle C, et
al: Direct repression of cyclin D1 by SIP1 attenuates cell cycle
progression in cells undergoing an epithelial mesenchymal
transition. Mol Biol Cell. 18:4615–4624. 2007. View Article : Google Scholar : PubMed/NCBI
|
|
30
|
Sayan AE, Griffiths TR, Pal R, et al: SIP1
protein protects cells from DNA damage-induced apoptosis and has
independent prognostic value in bladder cancer. Proc Natl Acad Sci
USA. 106:14884–14889. 2009. View Article : Google Scholar : PubMed/NCBI
|
|
31
|
Grzesiak JJ and Bouvet M: The alpha2beta1
integrin mediates the malignant phenotype on type I collagen in
pancreatic cancer cell lines. Br J Cancer. 94:1311–1319. 2006.
View Article : Google Scholar : PubMed/NCBI
|
|
32
|
Menke A, Philippi C, Vogelmann R, et al:
Down-regulation of E-cadherin gene expression by collagen type I
and type III in pancreatic cancer cell lines. Cancer Res.
61:3508–3517. 2001.PubMed/NCBI
|
|
33
|
Imamichi Y, König A, Gress T and Menke A:
Collagen type I-induced Smad-interacting protein 1 expression
downregulates E-cadherin in pancreatic cancer. Oncogene.
26:2381–2385. 2007. View Article : Google Scholar : PubMed/NCBI
|