Introduction
Narrow-band imaging (NBI) of surface microvessels of
colorectal lesions is useful for differentiating neoplasms from
non-neoplasms and for predicting histopathological diagnosis
(1–8). We have reported that analysis of
vascular patterns by magnifying NBI is useful for characterization
of colorectal lesions (9–11). Currently, pit pattern diagnosis by
magnifying chromoendoscopy is the gold standard for differentiating
neoplasms from non-neoplasms and for estimating invasive depth of
colorectal cancer. Type VN (non-structure) pit pattern
is an index of massively invasive lesions in the submucosal layer
(12–14). More recently, it was reported that
evaluation of the microstructure and microvessels of the
superficial layer, which can be recognised using NBI, was useful
for diagnosing invasion depth of colorectal tumours (15,16).
In Japan, surface microstructure observation by magnifying NBI is
called ‘surface pattern’ (17–20).
Some reports have highlighted differences between pit structure
observed by chromoendoscopy and surface pattern observed by
magnifying NBI (2,20–22).
In terms of macroscopic type, when we divided the morphology of
superficial colorectal lesions into protruded, flat elevated and
depressed, there were differences between typical pit patterns of
depressed lesions and the others (13,23,24).
We hypothesised that the surface pattern could be different between
these macroscopic morphologies but there are very few reports on
this in the literature. The wavelength range used in NBI does not
permit visualization of severely irregular pit structure but it
does emphasise haemoglobin-containing microvessels of the surface
mucosa. These vessels appear brown, while the surface structure
appears as a white zone because of the lack of microvessels in the
marginal crypt epithelium. Therefore, we believe that the
visibility of the surface pattern observed using magnifying NBI can
be useful for diagnosis of invasion depth.
The aim of the present study was to investigate if
surface pattern could be used to predict invasion depth in
colorectal cancer, and compare the accuracy of surface pattern
diagnosis in each macroscopic type.
Materials and methods
Patient selection
The present study took place at the Digestive
Disease Center, Showa University, Northern Yokohama Hospital,
between January 2010 and March 2011 and informed consent was
obtained from all participating patients. In the present study, a
series of 357 consecutive patients with 378 early colorectal
cancers were observed by NBI magnification. During this period
2,120 adenomas, 132 hyperplastic polyps and 219 T2–T4 cancers were
treated in our center.
Colonoscopic procedure
Bowel preparation consisted of administration of 2–3
l of polyethylene glycol solution in the morning before the
procedure. Colonoscopy was performed using a video endoscopic
system (EVIS, Lucera Spectrum; Olympus Co., Tokyo, Japan) with a
CF-H260AZI optical magnification colonoscope with maximum ×80
magnification (Olympus). The Olympus video image processor has 2
adjustable image processing features called structure enhancement
and colour enhancement. Structure enhancement has 18 preset
patterns, from ‘A0’ to ‘A8’ and from ‘B0’ to ‘B8’. Enhanced
microstructure imaging is seen at higher preset numbers. Colour
enhancement has 3 preset modes: ‘1’ is used for the upper
gastrointestinal tract, ‘3’ is used for the lower gastrointestinal
tract and ‘2’ is intermediate between ‘1’ and ‘3’. The setting of
structure enhancement was ‘A8’ and colour enhancement was set at
‘3’. When a lesion was detected by conventional colonoscopy, water
was used to wash away mucus, and then the endoscopist took
magnifying NBI images. The original image was transmitted using the
standard protocol to the server that hosted the database, where it
was converted into a compressed format developed by Solemio ENDO
(Olympus). The image could be downloaded from the server in the
JPEG format with no further loss in quality. The file size of the
downloaded image was about 100 kB, with a pixel array of 640 × 480
and 24 bit colour. Stored images were randomly allocated to 2
readers (Y.W. and M.M.) for classifying the lesion according to the
classification system given below. The 2 readers were blind to
histopathology and separately evaluated all images. When they did
not agree, we discussed and determined the surface pattern. In a
substudy, inter- and intra-observer agreements of surface pattern
were calculated for the 2 readers (M.M. and Y.W.). For this
purpose, 40 images of magnifying NBI views were randomly selected
from among all the target lesions by an endoscopist who was not
involved in the assessment of the surface pattern. Four weeks after
the initial assessment, the same images were randomly allocated to
the readers for re-assessment. Inter-observer agreement was
calculated from the results of the first reading and intra-observer
agreement was determined by comparing the first and the second
assessments. After magnifying NBI, indigo carmine or crystal violet
dye staining of the lesion was used to determine morphological
type. Endoscopic or surgical resection was performed, and the
specimens were diagnosed by an experienced gastrointestinal
histopathologist. Inclusion criteria included: i) early colorectal
cancer [intramucosal cancer (M) which is classified as categories
4.2 or 4.4, and submucosal invasive cancer (SM) which is classified
as category 5 in the revised Vienna classification] (25); ii) lesions observed by magnifying
NBI; and ii) over 20 years of age. Exclusion criteria included: i)
low- or high-grade adenoma (categories 3 or 4.1 in the revised
Vienna classification); ii) advanced colorectal cancer (T2 or
more); and iii) non-neoplastic lesions.
Surface pattern classification and
macroscopic type
When observing colorectal lesions with magnifying
NBI, regular pit pattern demarcated by the appearance of meshed
brown capillary vessels can be seen without the application of any
dye solution (1,4,26,27).
In the case of a severely irregular pit pattern or non-structure
(type VI high-grade or type VN pit pattern),
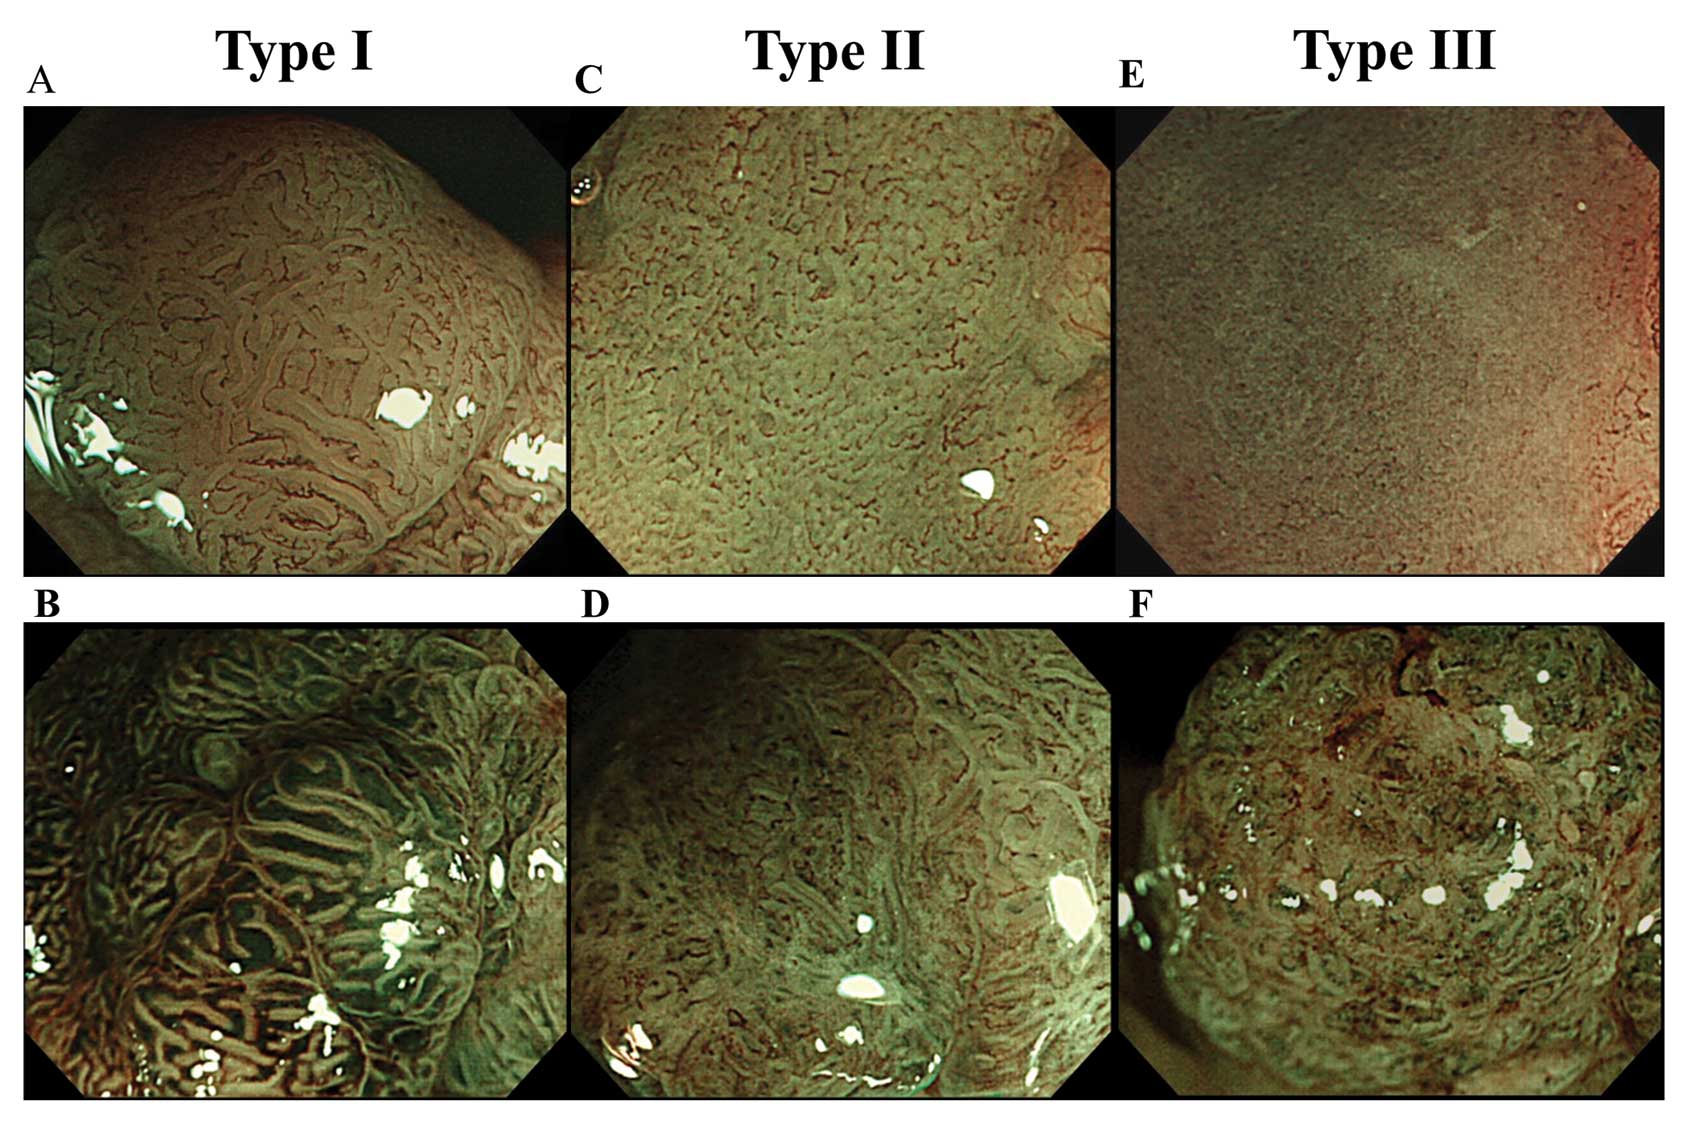
the pit cannot be identified by magnifying NBI (26). In the present study, we grouped the
surface patterns observed by magnifying NBI into 3 types: type I,
surface microstructure of the lesion was clearly recognised as a
white band with uniform arrangement and form; type II,
microstructure was obscured, or arrangement and form was
heterogeneous; and type III, microstructure was completely
invisible (Fig. 1). When 2 or more
surface patterns were recognised in a lesion, we adopted the most
advanced pattern as representative of the lesion. The surface
pattern was considered as more advanced in a descending order of
III, II and I.
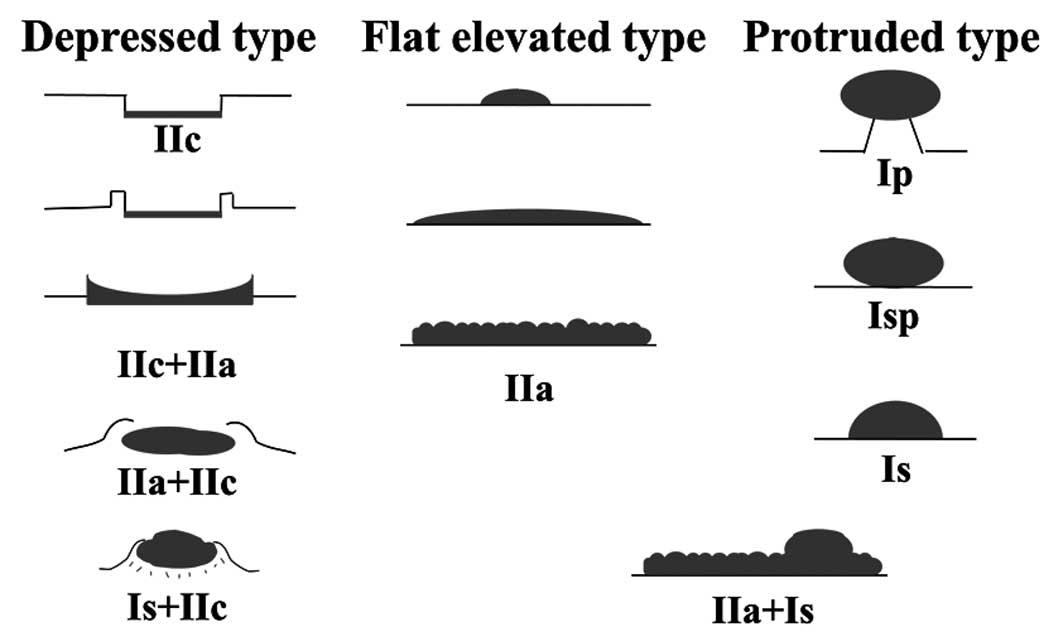
We classified the macroscopic type into 3
categories: depressed, protruded and flat elevated according to
configuration (Fig. 2) (14,28).
The so-called laterally spreading tumours (LSTs) can be divided
into subgroups and are expressed as type IIa, IIc + IIa, or IIa +
Is, according to the categories of the Paris classification
(29). In the present study, we
included type IIc + IIa LSTs in the depressed group, and the other
subtypes of LSTs are included in the protruded or flat elevated
group.
Histological examination
All resected specimens were retrieved and
immediately fixed in 10% buffered formalin solution and examined
histologically using haematoxylin-eosin staining. Pathological
examinations were performed on haematoxylin and eosin stained
sections. Histological diagnosis was made by a single pathologist
who was blind to the endoscopic results, based on the revised
Vienna classification (25). When
correct diagnosis was difficult, the opinion of a second
pathologist was sought to arrive at a final diagnosis. We used the
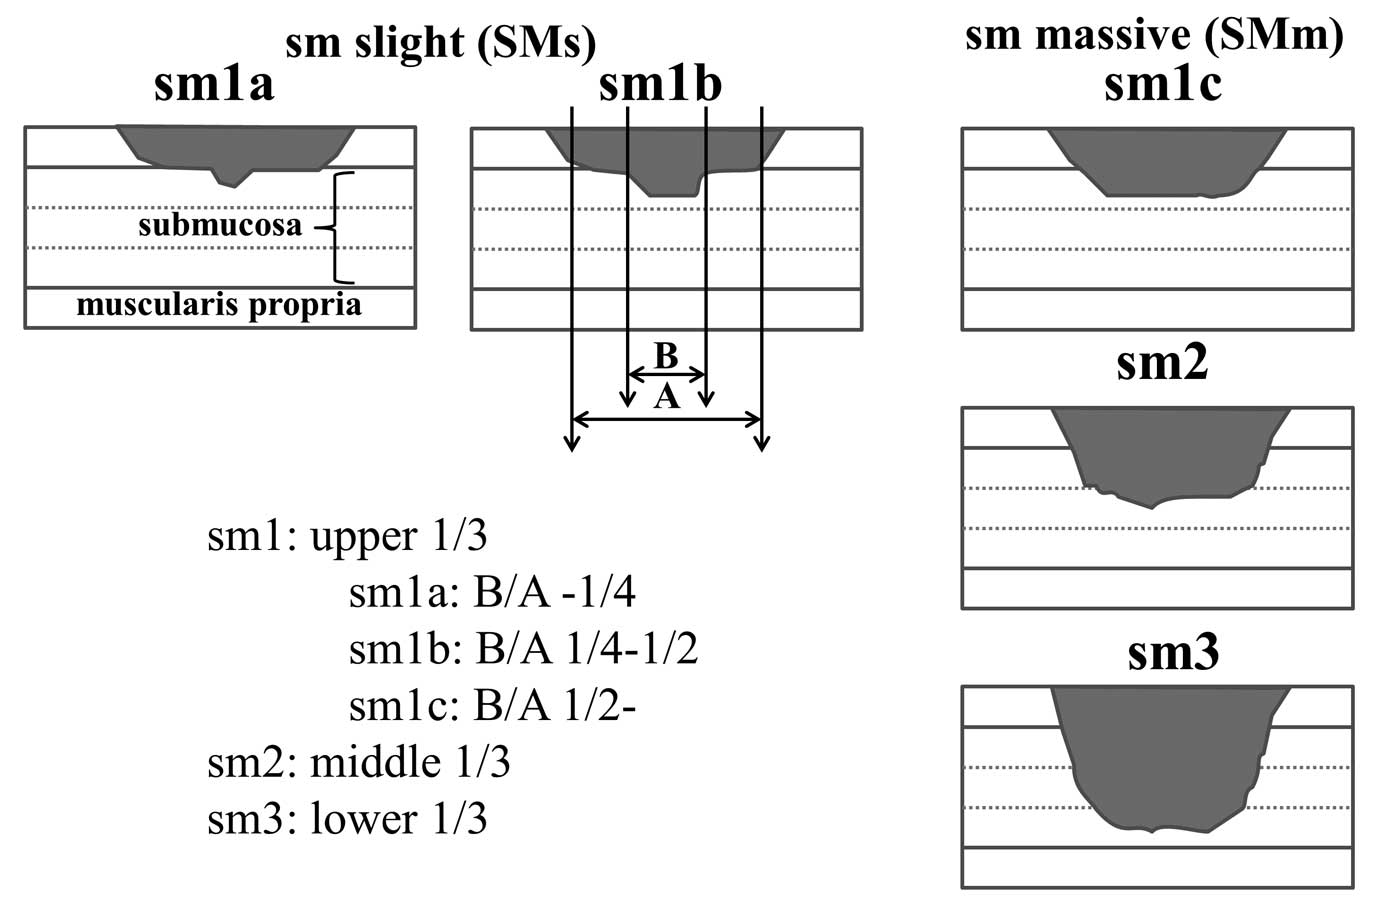
Kudo classification for the degree of submucosal invasion and
classified cancers accordingly (30,31).
Sm1a or 1b cancer without vessel permeation does not metastasise.
In contrast, sm1c, sm2 and sm3 lesions show a substantial
proportion (~10%) of nodal metastasis (32). We defined the former lesions as
slightly invasive submucosal cancers (SMs) and the latter lesions
as massively invasive submucosal cancers (SMm)(Fig. 3).
Statistical analyses
Data were collected with predesigned forms and were
entered into a statistical software program (R version 2.13.1,
http://www.r-project.org/) for analysis. For the
assessment, Student’s t-test was used for age and mean size of the
lesions. The Chi-square test and Fisher’s exact test were used for
gender ratio, location of the lesions and diagnostic efficacy of
surface pattern. A cross tabulation could be created to display the
numbers of lesions as follows: SMm and type III, SMm and type I or
II, M-SMs and type III and M-SMs and type I or II. Based on this
cross tabulation, we used Chi-square test or Fisher’s exact test
for diagnostic accuracy. Pairwise Chi-square tests or Fisher’s
exact tests followed by Bonferroni correction were used for the
comparison of sensitivity, specificity and accuracy in each
macroscopic type. Therefore, in the present study, we needed the
statistical test 3 times, but this increased the type I error.
However, the Bonferroni correction used here avoided the problem of
a type I error caused by sequential application of a statistical
test. Kappa statistics were used to calculate inter- and
intraobserver agreement. P-values <0.05 were considered
significant. Kappa 0 was considered as ‘poor’ agreement; 0.00–0.20,
‘slight’ agreement; 0.21–0.40, ‘fair’ agreement; 0.41–0.60,
‘moderate’ agreement; 0.61–0.80, ‘substantial’ agreement; and
0.80–1.00, ‘almost perfect’ agreement. The sensitivity, specificity
and accuracy were calculated based on following definitions:
surface pattern III plus SMm were true positive, surface pattern I
or II plus SMm were false positive, surface pattern I or II and
M-SMs were true negative and surface pattern III and M-SMs were
false positive. The upper and lower 95% confidence interval (CI)
limits were calculated using a binomial distribution, with limits
at a distance from the estimate equal to the product of 1.96 times
the standard error. The present study was approved by the Ethics
Committee of the Showa University Northern Yokohama Hospital
(1207-01), and was registered with UMIN Clinical Trials,
UMIN000007709.
Results
Patients and lesions
The clinicopathological features of patients and
lesions of the present study are shown in Table I. There were no significant
differences in gender ratio, age, size of the lesions and
location.
 | Table IClinicopathological features of
patients and lesions. |
Table I
Clinicopathological features of
patients and lesions.
| Pathological
diagnosis | |
|---|
|
| |
|---|
| M-SMs | SMm | P-value |
|---|
| Male:female | 200:113 | 35:30 | 0.07a |
| Age ± SD (years) | 64.5±11.6 | 66.9±9.6 | 0.11b |
| Mean size ± SD
(mm) | 20.9±16.8 | 24.1±16.2 | 0.16b |
| Location | | | |
| Right side of
colon | 98 | 21 | 0.84a |
| Left side of
colon | 132 | 25 | |
| Rectum | 83 | 19 | |
In total, 56.9% of SMm were recognised as type III
and 91.7% of M/SMs cancers were type I or II (Table II). When we assumed that type III
was an index of SMm, the sensitivity, specificity, and accuracy of
diagnosis were 56.9% (95% CI, 44.0–69.2), 91.7% (95% CI,
88.1–94.5), and 85.7% (95% CI, 81.8–89.1), respectively
(P<0.001).
| Table IIRelationship between pathological
diagnosis and surface pattern for all lesions and each
morphological group. |
Table II
Relationship between pathological
diagnosis and surface pattern for all lesions and each
morphological group.
| Pathological
diagnosis | Surface pattern
I/II/III | P-valuea |
|---|
| Depressed type | M-SMs | 1/7/12 | 0.12 |
| SMm | −/2/16 | |
| Protruded type | M-SMs | 43/46/7 | <0.001 |
| SMm | 4/7/13 | |
| Flat type | M-SMs | 132/58/7 | <0.001 |
| SMm | 1/14/8 | |
| Total | M-SMs | 176/111/26 | <0.001 |
| SMm | 5/23/37 | |
The sensitivity, specificity and accuracy of type
III for the diagnosis of SMm in each macroscopic type were as
follows: depressed type: 88.9% (95% CI, 65.3–98.6), 40.0% (95% CI,
19.1–64.0), and 63.2% (95% CI, 46.0–78.2), respectively (P=0.05);
flat elevated type: 54.2% (95% CI, 32.8–74.5), 92.7% (95% CI,
85.6–97.0), and 85.0% (95% CI, 77.3–90.9), respectively
(P<0.001); and protruded type: 34.8% (95% CI, 16.4–57.3), 96.4%
(95% CI, 92.8–98.6), and 90.0% (95% CI, 85.3–93.6), respectively
(P<0.001) (Table III). The
specificity and accuracy of diagnosis of the depressed type was
significantly lower, whereas sensitivity was significantly higher,
than those of the other macroscopic types. Inter-observer agreement
of kappa value was 0.75 (95% CI, 0.59–0.91), and intra-observer
agreement of kappa value was 0.96 (95% CI, 0.89–1.03) for M.M. 0.93
(95% CI, 0.83–1.02) for Y.W.
| Table IIIDiagnostic ability of surface pattern
for early colorectal cancer for all lesions and each morphological
group. |
Table III
Diagnostic ability of surface pattern
for early colorectal cancer for all lesions and each morphological
group.
| | | | P-valuea | |
|---|
| | | |
| |
|---|
| Depressed type | Protruded type | Flat elevated
type | Depressed vs.
protruded | Protruded vs.
flat | Flat vs.
depressed | Total |
|---|
| Sensitivityb (95% CI)% | 88.9
(65.3–98.6) | 54.2
(32.8–74.5) | 34.8
(16.4–57.3) | 0.016 | NS | <0.001 | 56.9
(44.0–59.2) |
| Specificityb (95% CI)% | 40.0
(19.1–64.0) | 92.7
(85.6–97.0) | 96.4
(92.8–98.6) | <0.001 | NS | <0.001 | 91.7
(88.1–94.5) |
| Accuracyb (95% CI)% | 63.2
(46.0–78.2) | 85.0
(77.3–90.9) | 90.0
(85.3–93.6) | <0.001 | NS | NS | 85.7
(81.8–89.1) |
Discussion
In the present study, we made two important clinical
observations. First, the diagnostic accuracy of surface pattern was
insufficient to decide treatment procedure in daily practice.
Second, the diagnostic accuracy of surface pattern varied among
each macroscopic type, with the depressed type faring the
worst.
To decrease the frequency of false positives in the
diagnosis of invasion depth of colorectal lesions a highly specific
diagnostic modality is needed. Our previous report showed that
VI high-grade or VN pit patterns in
chromoendoscopy are considered diagnostic for SMm, and we could
differentiate between SMm and SMs with a sensitivity of 89.7% and
specificity of 88.0% (10). The
specificity was similar to that for the present study, although the
previous study included only submucosal invasive cancer. However,
sensitivity was quite low in the present study (Table II) because there were several
lesions in which the surface pattern could be recognised (type I or
II) but they were SMm. These false negatives were especially more
frequent in protruded and flat elevated cancers. Tanaka et
al(26) reported that
magnifying NBI was useful for diagnosed colorectal lesions that
revealed a regular pit pattern. Ikematsu et al(33) described the efficacy of capillary
pattern classification. Their classification was based on the
irregularity of the microvascular pattern, without consideration
for the surface pattern. Sensitivity, specificity and accuracy of
their classification for differentiating M-SMs from SMm were 84.8,
88.7 and 87.7%, respectively. We realised that their result was a
standard performance based on observation of the surface
microvascular pattern by magnifying NBI. Kanao et
al(15) previously classified
colorectal lesions according to the magnifying NBI findings of the
visibility of surface pattern and the irregularity of capillary
pattern. Their classification was more useful for diagnosis of
massively submucosal invasive cancer than capillary pattern alone
(15–19). Oba et al(18) reported that the obscurity of surface
pattern seen when using magnifying NBI was an acceptable indicator
for deep submucosal invasive cancer. They described that a
significantly high percentage of lesions with widely exposed
desmoplastic reactions was the cause of the obscurity. As described
in previous reports, the type VN pit pattern is a
well-established index of SMm (12–14).
If the cancer is massively invasive, desmoplastic reactions accrue
and expose the surface of the lesion and this exposed desmoplastic
reaction can appear to be non-structural. Thus, we presume that the
obscurity of the surface pattern revealed by magnifying NBI (it was
a counterpart of type III in the present study) correlates with
invasion depth. In fact, 58.7% of lesions identified as type III
were SMm, and 17.2% of type II lesions were SMm (Table II). At first glance, the rate of
SMm in type II was high, but there were significant differences
between the rate of SMm in type II and III (P<0.001, Chi-square
test). Oka et al(17)classified magnifying NBI findings into
5 patterns (A, B, C1, C2 and C3), their type C3 correspond
approximately to our type III. Their classification consisted of
evaluating not only the surface microvascular pattern but also the
surface pattern of colorectal lesions. Sensitivity, specificity,
and accuracy of type C3 for a diagnosis of SMm were 63.7, 99.2 and
94.0%, respectively. Thus, they concluded that type C3 was a useful
predictor of SMm. These results were more robust than ours, but
their investigation included non-neoplastic lesions and low- or
high-grade adenoma. If these lesions were excluded, sensitivity,
specificity and accuracy were 63.7, 97.8 and 87.2%, respectively.
This diagnostic accuracy is still high compared to our result;
thus, using surface pattern alone for diagnosis in daily practice
may be insufficient. However, according to the present study, 97.2%
lesions which revealed type I surface pattern were M-SMs (Table II). Therefore, we presume that type
III or II need another modality such as chromoendoscopy or
endoscopic ultrasonography, but type I might not need another
modality.
From a morphological perspective, in the depressed
type cancers, specificity and accuracy of type III for the
diagnosis of SMm were significantly lower. In the present study,
about 60% of M and SM depressed type cancers revealed
non-structural surface pattern (type III). These results led to
decreased specificity and accuracy for the diagnosis of SMm in
depressed type cancers. However, some investigations report surface
structure differences when using NBI compared to more traditional
methods of analysis such as chromoendoscopy. Machida et
al(2) compared magnifying
chromoendoscopy with NBI, and reported that visualization of the
surface structure of colorectal lesions observed by NBI was
inferior to that of chromoendoscopy (P<0.05). Hirata et
al(22) compared pit pattern
diagnosis by magnifying NBI with magnifying chromoendoscopy in the
same colorectal lesions. They reported that concordance for type
VI pit pattern was 78%, which was lower than that for
other regular pit patterns. They suggested that low concordance
obtained for type VI pit pattern may reflect the
difficulties of NBI assessment of type VI pit pattern
with mild atypia. Furthermore, East et al(21) reported that surface structures
observed by NBI and pit pattern observed by chromoendoscopy were
not always identical. They also calculated weighted kappa values of
vascular pattern intensity and surface pattern, and found that
agreement of vascular pattern (weighted k=0.64) was higher than
that of surface pattern (weighted k=0.48). Tanaka et
al(26) reported that the
correspondence rate of pit pattern diagnosis between magnifying NBI
and stereoscopic findings was 57% (4/7) for the VN pit
pattern. They reported that higher-grade irregular pit patterns are
more difficult to detect by magnifying NBI. Hayashi et
al(20) described that the
surface pattern visible in NBI magnifying observation was clearly
revealed to be inferior to the fine surface structure obtained by
pit pattern diagnosis. To summarise previous reports, an irregular
pit pattern like that of type V is scarcely visible by NBI. What
was the reason for several M and SMs depressed type cancers
presenting as type III? Commonly, the glands of depressed type
cancers are small and have a compact arrangement, compared to other
morphology (13,23). We think that very small and
compactly arranged orifices of glands could be obscured during
magnifying NBI. Therefore, care should be taken in assessing the
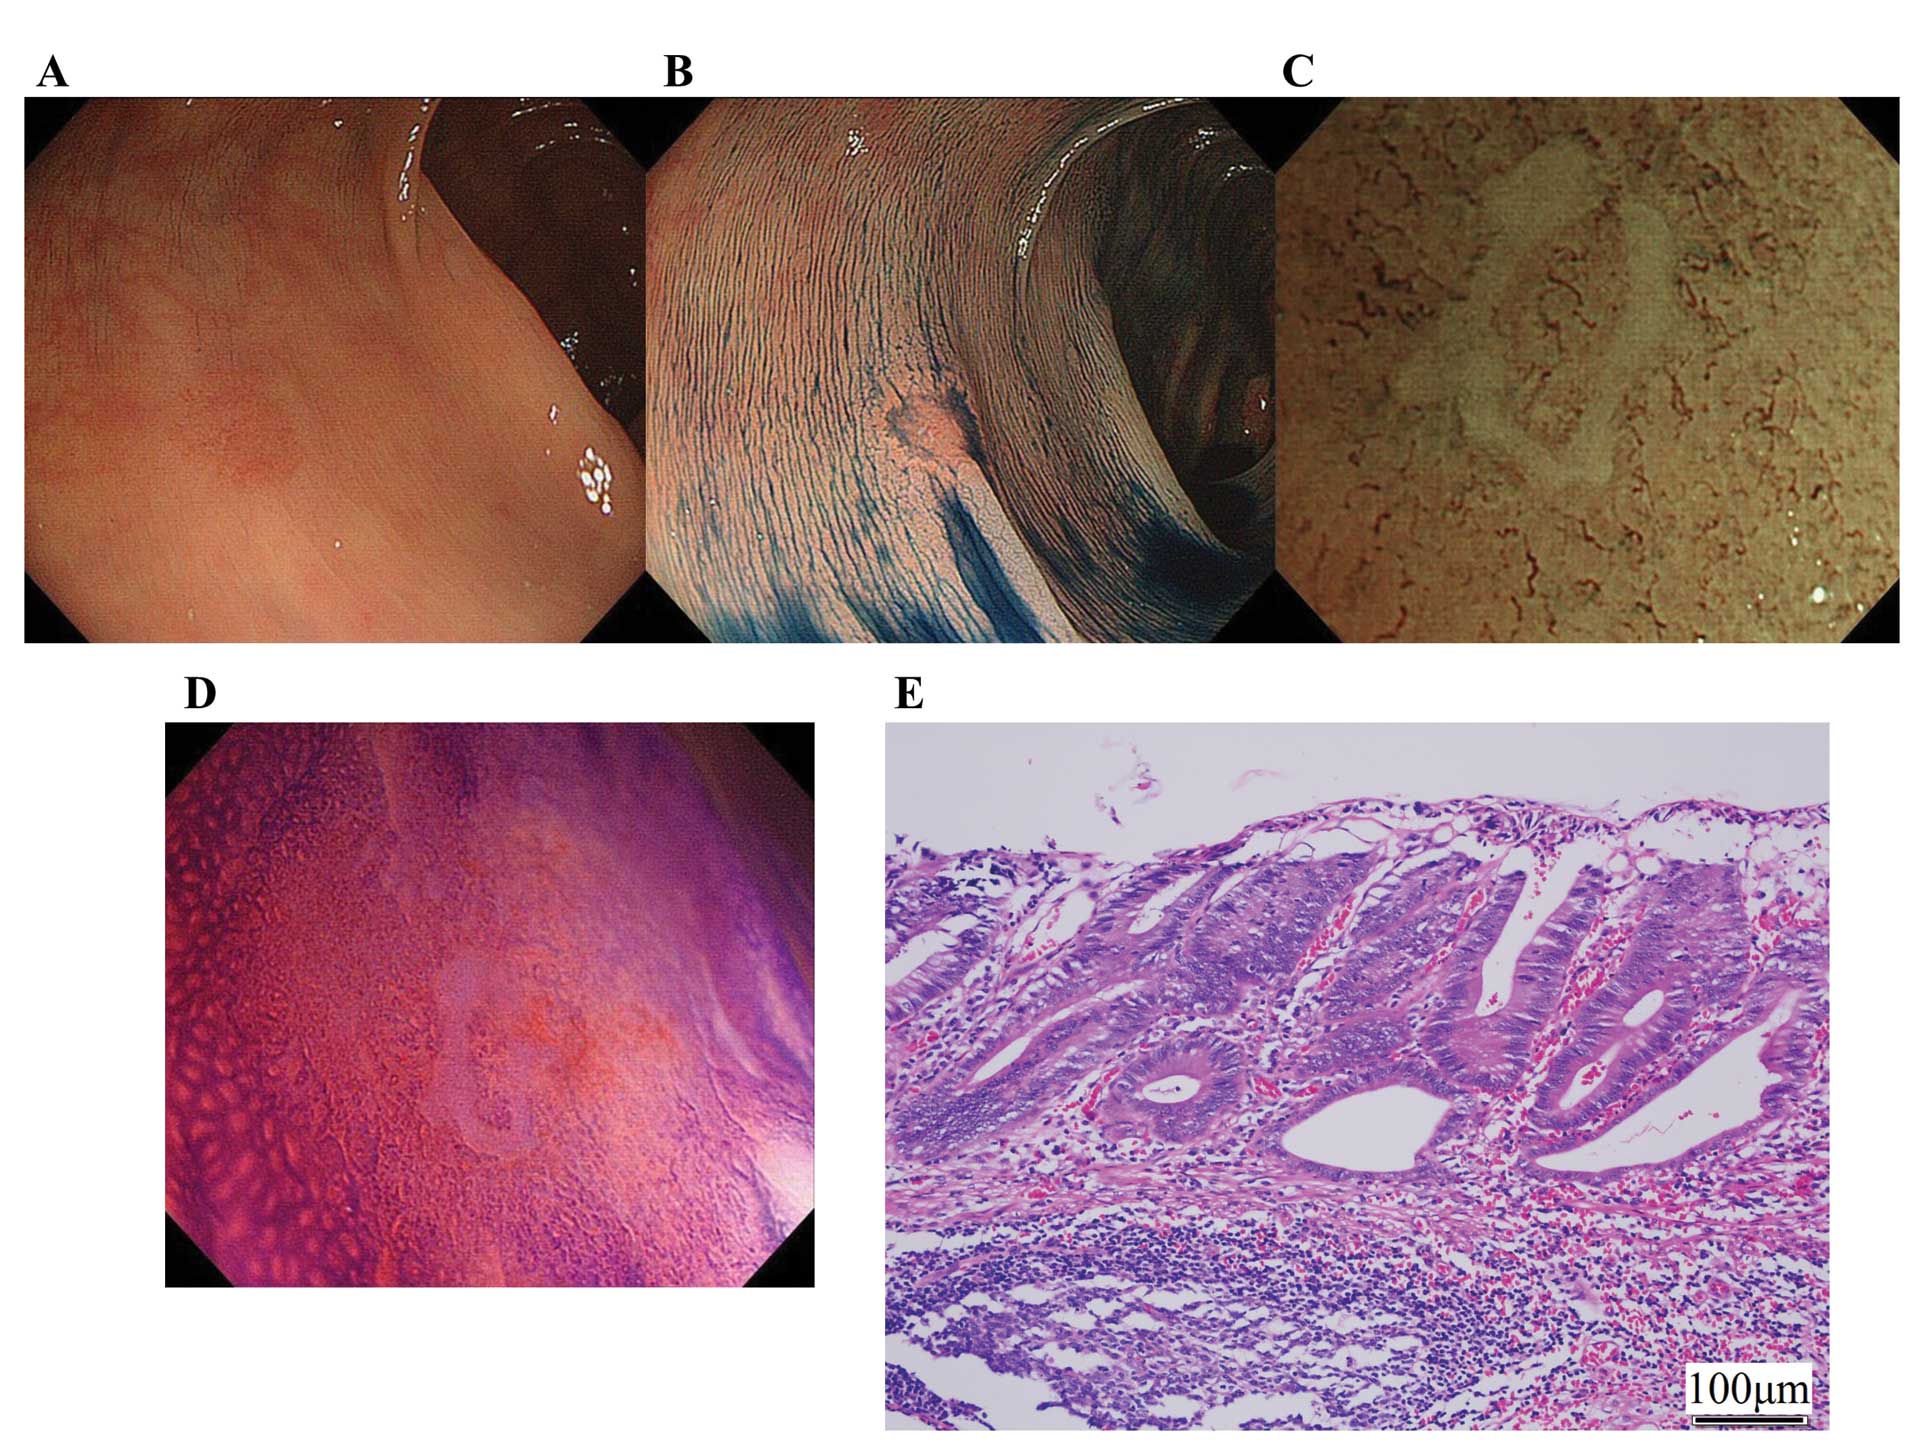
surface pattern, especially in depressed types. We encountered such
a lesion; this was a small reddish lesion in the transverse colon
(Fig. 4A). After indigo carmine dye
spraying, there was a clear depression within the lesion (Fig. 4B). Surface structure was completely
invisible by magnifying NBI, thus, we classified this lesion as
type III (Fig. 4C). Despite the
invisibility of the surface structure, this was not an invasive
cancer (Fig. 4E). Such depressed
lesions require magnifying chromoendoscopy and direct evaluation of
the orifice of the glands (Fig.
4D).
NBI has several advantages compared with
chromoendoscopy. First, no dye solutions are required. Second, it
is user friendly as it solely depends on the use of optical filters
that are easily enabled by a manual switch on the handle of the
endoscope. NBI will shorten examination times and reduce the burden
on patients and endoscopists. Moreover, mucous attachment on the
lesions can interfere with diagnosis, and washing the surface of a
lesion with pronase solution takes additional time during pit
pattern diagnosis by magnification colonoscopy with indigo carmine
dye spraying or crystal violet staining.
The present study had several limitations. First,
the surface pattern was judged by 2 individuals that were well
experienced in magnifying NBI. Further investigation by less
experienced endoscopists should also be performed to validate our
findings. Second, candidate lesions were limited to early
colorectal cancer. If they also included low-grade adenoma, as is
seen in usual clinical practice, diagnostic ability might increase.
Third, this was a pilot study, so we did not estimate the sample
size before starting the study. However, we calculated post hoc
power analysis based on Chi-square test, sample size was 378,
effect size which was calculated based on our result was 0.52,
degrees of freedom was 2, and level of significance was 0.05. Using
these parameters, the power of the present study was 1.0,
indicating a sufficient sample size.
In conclusion, the present study showed that the
diagnostic accuracy of surface pattern was insufficient to decide
treatment procedure in daily practice; the accuracy in depressed
type lesions was particularly poor. However, additional studies are
necessary for evaluation of the usefulness of surface pattern
analysis by magnifying NBI.
Acknowledgements
The authors thank Editage for editing the
manuscript.
References
|
1
|
Sano Y, Muto M and Tajiri H:
Optical/digital chromoendoscopy during colonoscopy using
narrow-band imaging system. Digest Endosc. 17:S43–S48. 2005.
View Article : Google Scholar
|
|
2
|
Machida H, Sano Y, Hamamoto Y, et al:
Narrow-band imaging in the diagnosis of colorectal mucosal lesions:
a pilot study. Endoscopy. 36:1094–1098. 2004. View Article : Google Scholar : PubMed/NCBI
|
|
3
|
Tischendorf JJ, Wasmuth HE, Koch A, Hecker
H, Trautwein C and Winograd R: Value of magnifying chromoendoscopy
and narrow band imaging (NBI) in classifying colorectal polyps: a
prospective controlled study. Endoscopy. 39:1092–1096. 2007.
View Article : Google Scholar : PubMed/NCBI
|
|
4
|
East JE, Suzuki N, Bassett P, et al:
Narrow band imaging with magnification for the characterization of
small and diminutive colonic polyps: pit pattern and vascular
pattern intensity. Endoscopy. 40:811–817. 2008. View Article : Google Scholar : PubMed/NCBI
|
|
5
|
Katagiri A, Fu KI, Sano Y, et al: Narrow
band imaging with magnifying colonoscopy as diagnostic tool for
predicting histology of early colorectal neoplasia. Aliment
Pharmacol Ther. 27:1269–1274. 2008. View Article : Google Scholar : PubMed/NCBI
|
|
6
|
Sano Y, Ikematsu H, Fu KI, et al: Meshed
capillary vessels by use of narrow-band imaging for differential
diagnosis of small colorectal polyps. Gastrointest Endosc.
69:278–283. 2009. View Article : Google Scholar : PubMed/NCBI
|
|
7
|
Henry ZH, Yeaton P, Shami VM, et al:
Meshed capillary vessels found on narrow-band imaging without
optical magnification effectively identifies colorectal neoplasia:
a North American validation of the Japanese experience.
Gastrointest Endosc. 72:118–126. 2010. View Article : Google Scholar
|
|
8
|
Fukuzawa M, Saito Y, Matsuda T, Uraoka T,
Itoi T and Moriyasu F: Effectiveness of narrow-band imaging
magnification for invasion depth in early colorectal cancer. World
J Gastroenterol. 16:1727–1734. 2010. View Article : Google Scholar : PubMed/NCBI
|
|
9
|
Wada Y, Kudo SE, Kashida H, et al:
Diagnosis of colorectal lesions with the magnifying narrow-band
imaging system. Gastrointest Endosc. 70:522–531. 2009. View Article : Google Scholar : PubMed/NCBI
|
|
10
|
Wada Y, Kashida H, Kudo SE, Misawa M,
Ikehara N and Hamatani S: Diagnostic accuracy of pit pattern and
vascular pattern analyses in colorectal lesions. Dig Endosc.
22:192–199. 2010. View Article : Google Scholar : PubMed/NCBI
|
|
11
|
Wada Y, Kudo SE, Misawa M, Ikehara N and
Hamatani S: Vascular pattern classification of colorectal lesions
with narrow band imaging magnifying endoscopy. Dig Endosc. 23(Suppl
1): 106–111. 2011. View Article : Google Scholar : PubMed/NCBI
|
|
12
|
Kudo SE, Tamura S, Nakajima T, Yamano H,
Kusaka H and Watanabe H: Diagnosis of colorectal tumorous lesions
by magnifying endoscopy. Gastrointest Endosc. 44:8–14. 1996.
View Article : Google Scholar : PubMed/NCBI
|
|
13
|
Kudo SE, Rubio CA, Teixeira CR, Kashida H
and Kogure E: Pit pattern in colorectal neoplasia: endoscopic
magnifying view. Endoscopy. 33:367–373. 2001. View Article : Google Scholar : PubMed/NCBI
|
|
14
|
Kashida H and Kudo SE: Early colorectal
cancer: concept, diagnosis, and management. Int J Clin Oncol.
11:1–8. 2006. View Article : Google Scholar
|
|
15
|
Kanao H, Tanaka S, Oka S, Hirata M,
Yoshida S and Chayama K: Narrow-band imaging magnification predicts
the histology and invasion depth of colorectal tumors. Gastrointest
Endosc. 69:631–636. 2009. View Article : Google Scholar : PubMed/NCBI
|
|
16
|
Oba S, Tanaka S, Oka S, et al:
Characterization of colorectal tumors using narrow-band imaging
magnification: combined diagnosis with both pit pattern and
microvessel features. Scand J Gastroenterol. 45:1084–1092. 2010.
View Article : Google Scholar : PubMed/NCBI
|
|
17
|
Oka S, Tanaka S, Takata S, Kanao H and
Chayama K: Clinical usefulness of narrow band imaging magnifying
classification for colorectal tumors based on both surface pattern
and microvessel features. Dig Endosc. 23(Suppl 1): 101–105. 2011.
View Article : Google Scholar : PubMed/NCBI
|
|
18
|
Oba S, Tanaka S, Sano Y, Oka S and Chayama
K: Current status of narrow-band imaging magnifying colonoscopy for
colorectal neoplasia in Japan. Digestion. 83:167–172. 2011.
View Article : Google Scholar : PubMed/NCBI
|
|
19
|
Tanaka S and Sano Y: Aim to unify the
narrow band imaging (NBI) magnifying classification for colorectal
tumors: current status in Japan from a summary of the consensus
symposium in the 79th Annual Meeting of the Japan
Gastroenterological Endoscopy Society. Dig Endosc. 23(Suppl 1):
131–139. 2011. View Article : Google Scholar
|
|
20
|
Hayashi N, Tanaka S, Kanao H, Oka S,
Yoshida S and Chayama K: Relationship between narrow-band imaging
magnifying observation and pit pattern diagnosis in colorectal
tumors. Digestion. 87:53–58. 2013. View Article : Google Scholar : PubMed/NCBI
|
|
21
|
East JE, Suzuki N and Saunders BP:
Comparison of magnified pit pattern interpretation with narrow band
imaging versus chromoendoscopy for diminutive colonic polyps: a
pilot study. Gastrointest Endosc. 66:310–316. 2007. View Article : Google Scholar : PubMed/NCBI
|
|
22
|
Hirata M, Tanaka S, Oka S, et al:
Magnifying endoscopy with narrow band imaging for diagnosis of
colorectal tumors. Gastrointest Endosc. 65:988–995. 2007.
View Article : Google Scholar : PubMed/NCBI
|
|
23
|
Kudo SE, Kashida H, Nakajima T, Tamura S
and Nakajo K: Endoscopic diagnosis and treatment of early
colorectal cancer. World J Surg. 21:694–701. 1997. View Article : Google Scholar
|
|
24
|
Kudo SE, Kashida H, Tamura T, et al:
Colonoscopic diagnosis and management of nonpolypoid early
colorectal cancer. World J Surg. 24:1081–1090. 2000. View Article : Google Scholar : PubMed/NCBI
|
|
25
|
Dixon MF: Gastrointestinal epithelial
neoplasia: Vienna revisited. Gut. 51:130–131. 2002. View Article : Google Scholar : PubMed/NCBI
|
|
26
|
Tanaka S, Oka S, Hirata M, et al: Pit
pattern diagnosis for colorectal neoplasia using narrow band
imaging magnification. Digest Endosc. 18:S52–S56. 2006. View Article : Google Scholar
|
|
27
|
Rastogi A, Pondugula K, Bansal A, et al:
Recognition of surface mucosal and vascular patterns of colon
polyps by using narrow-band imaging: interobserver and
intraobserver agreement and prediction of polyp histology.
Gastrointest Endosc. 69:716–722. 2009. View Article : Google Scholar
|
|
28
|
Japanese Society for Cancer of the Colon
and Rectum. Japanese Classification of Colorectal Carcinoma. 2nd
edition. Kanehara & Co., Ltd; Tokyo: pp. 112009
|
|
29
|
Kudo SE, Lambert R, Allen JI, et al:
Nonpolypoid neoplastic lesions of the colorectal mucosa.
Gastrointest Endosc. 68:S3–47. 2008. View Article : Google Scholar : PubMed/NCBI
|
|
30
|
Kudo SE: Endoscopic mucosal resection of
flat and depressed types of early colorectal cancer. Endoscopy.
25:455–461. 1993. View Article : Google Scholar : PubMed/NCBI
|
|
31
|
Kudo SE, Tamure S, Nakajima T, et al:
Depressed type of colorectal cancer. Endoscopy. 27:54–61. 1995.
View Article : Google Scholar
|
|
32
|
Kudo SE, Tamegai Y, Yamano H, Imai Y,
Kogure E and Kashida H: Endoscopic mucosal resection of the colon:
the Japanese technique. Gastrointest Endosc Clin N Am. 11:519–535.
2001.PubMed/NCBI
|
|
33
|
Ikematsu H, Matsuda T, Emura F, et al:
Efficacy of capillary pattern type IIIA/IIIB by magnifying narrow
band imaging for estimating depth of invasion of early colorectal
neoplasms. BMC Gastroenterol. 10:332011. View Article : Google Scholar : PubMed/NCBI
|