Introduction
Oral squamous cell carcinoma (OSCC), one of the most
common oral malignancies, presents a clinical diagnostic challenge,
particularly in its early stages of development. Nevertheless, the
early diagnosis of oral cancer plays a key role in patient
survival. While early stages of OSCC are curable in 80% of the
cases, the 5-year survival rate drops to 30% in advanced stages and
corresponds, finally, to a rate of 50%. Unfortunately, still two
thirds of the patients suffering from OSCC are diagnosed in an
advanced stage resulting in a 5-year survival rate of ~50%. Hence,
methods for early diagnosis of the disease are urgently needed
(1–3).
A second problem in development of oral carcinomas
is that ~67% of them are preceded by oral potentially malignant
disorders mostly by leukoplakia (OLP) which represents the most
common potentially malignant lesion of the oral mucosa.
Statistically, 1–18% of these lesions show malignant transformation
to OSCC (4–7). However, like early diagnosis of the
malignancy the evaluation of cancer risk coming up from individual
lesions is difficult. To date, histopathological assessment of the
degree of dysplasia is the basis for the prediction of malignant
transformation (4,5,8,9).
Unfortunately, this method is subjective and lacks intra- and
inter-observer reproducibility (10). In addition, it was found that
histological features alone cannot accurately predict whether these
tissue changes of the oral mucosa remain stable, regress or
progress to malignancy and sometimes even non-dysplastic lesions
suddenly show malignant transformation (10).
Therefore, attempts have been made to develop
diagnostic and prognostic biomarkers and methods for monitoring
premalignant stages (7). Specific
molecular biological chances in oral tissues hold great promise in
this respect and in the past attempts were made to develop methods
based on specific molecular markers for more accurate assessment of
cancer risk of OPL. However, so far none of these markers has been
introduced to clinical routine (7,11–22).
Aberrant expression and function of molecules
involved in signalling networks controlling cell cycle,
differentiation, apoptosis, genomic stability, motility,
angiogenesis and metastasis have been considered as biomarkers for
risk assessment of malignant transformation (5,9).
The epithelial growth factor (EGFR) regulates the
signalling involved in cell proliferation and differentiation. It
is overexpressed in several tumors including OSCC. There is
substantial, but not clear evidence that high expression of EGFR is
correlated with advanced tumor stages, metastases and poor clinical
outcome (23,24).
Enhanced expression of the EGFR family has been
detected in proliferative cells of the basal layer in normal oral
mucosa and leukoplakia with mild, moderate and severe dysplastic
lesions. Some studies report that the pattern of EGFR expression in
dysplastic leukoplakia coincides with the histological assessment
of dysplasia in these lesions and they have indicated that EGFR
upregulation may be a useful marker for identifying individuals at
risk of OSCC development (7,18,24–28).
To date, there is a lack of information on the rate
of malignant transformation of OLP over longer follow-up intervals
comparing immunohistochemical features and conventional
histopathological aspects of the lesions. Therefore, the present
study included only OLP lesions of patients with 5-year follow-up
data. The aim of the present study was to evaluate if there were
correlations between EGFR overexpression in OLP, the rate of
malignant transformation and the histopathological grade of
dysplasia.
Materials and methods
Tissue samples and patients
The study was approved by the Ethics Committee of
the University of Erlangen-Nuremberg and patients' informed consent
was obtained. A total of 148 tissue samples (paraffin blocks) were
included in the study that had been collected at the Department of
Pathology, University Hospital Erlangen between 1997 and 2011.
Group I consisted of 53 OLP samples that showed malignant
transformation into OSCC during the 5-year follow-up. Group II
included 45 OLP samples that did not show a malignant
transformation in the 5-year follow-up. Group III included 30
samples of sound oral mucosa (NOM) of healthy volunteers and served
as negative control. Group IV consisted of 21 OSCC samples that
were the result of malignant transformation of OLP of group I.
Basic patient data including age and gender were collected.
Moreover, the time interval between diagnosis of OLP and the
diagnosis of OSCC (disease-free survival time, DFS) was
determined.
Oral epithelial dysplasia classification
and tumor histopathology and staging
All samples were evaluated by two pathologists to
ensure consistent results. The grade of dysplasia of the OLP
samples was histopathologically classified according to WHO
classification 2005. Based on architectural, certain histological
and cytological features dysplasia of tissues is divided into the
stages D0 for no, D1 for mild, D2 for moderate and D3 for severe
dysplasia (8). Ideally, diagnosis
corresponds to the nature of the lesion meaning that the level of
epithelial dysplasia implies the risk of progression into
malignancy (D0, no risk; D1, low risk; D2, moderate risk; and D3,
severe risk) (9). Clinical staging
and TNM classification were done for each tumor patient developing
a malignancy based on the primary precursor lesion according to
UICC. The OSCC were also classified according to WHO for loss of
differentiation as G1, G2 and G3 for well, moderately and poor
differentiation, respectively. All biopsies were evaluated by two
pathologists to ensure consistent results. Clinical staging (stages
I–IV) and classification according to early (including stages I and
II) and late (including stages III and IV) clinical stages were
recorded.
Immunhistochemical staining of EGFR-1
expression
Immunohistochemical staining was performed with the
alkaline phosphatase-anti-alkaline phosphatase method and an
automated staining device (Autostainer plus; DakoCytomation,
Hamburg, Germany). On all samples the Dako labeled streptavidin
biotin alkaline phosphatase system kit (Dako K5005; Dako Diagnostic
GMBH, Hamburg, Germany) was applied. EGFR expression was detected
by the murine monoclonal antibody M3563 (dilution 1:300; Dako
Diagnostic) directed against EGFR-1. Serial sections of 4 μm
thickness were taken on silanized slides for IHC. Paraffin tissue
sections were first dewaxed with xylene (30 min) and rehydrated
gradually with ethanol and water. Antigen retrieval applying
Proteinase K for 5 min (Dako S3020; Dako Diagnostic) and the whole
staining was done using the DakoCytomation Autostainers plus (Dako
Diagnostic) according to the recommends of the distributor. After
staining the slides were gently rinsed with distilled water and
counterstained with haemalaun (Dako S3301; Dako Diagnostic)
manually, and then washed gently under running water for 5 min and
mounted in aquatex (Merck, Darmstadt, Germany) using cover
slips.
Presence of red coloured end product at the site of
target antigen was indicative of positive reactivity. Membranous
and/or cytoplasmatic staining was estimated as positive result. An
unrelated murine IgG1 antibody at the same concentration as the
test antibody was used as a negative control.
Semi-quantitative immunohistochemical
analysis
We performed semi-quantitative analysis of the
membranous and cytoplasmatic expression of EGFR to determine the
labelling index of the tissues which is defined as the percentage
of expressing cells (ratio of positively stained cells to the total
number of cells per ROI, multiplied by 100). Therefore, sections of
OLP, OSCC and healthy tissues were first qualitatively evaluated
under a bright light microscope (Axioskop; Carl Zeiss, Jena,
Germany) at magnifications of ×20 and ×40. For each sample two or
three regions of interest (ROI) which span (if possible) the whole
epithelium and include 200–300 cells were selected, digitized and
documented with a CCD camera (Axiocam 5; Carl Zeiss) and Axiovision
software (magnification ×200–x400; Axiovison, Carl Zeiss). Cell
counting was performed by two independent observers who were
blinded to the tissue origin. Afterwards, the ratio of positively
stained cells to the total number of cells per ROI, i.e. the
labelling index, was defined.
Statistics
The labelling index per ROI of positively stained
cells was used to analyze statistically relevant differential
expression rates of EGFR determined by immunohistochemical
staining. For the data results three analyzed ROIs were pooled. The
labeling indices data were expressed as the median (ME), the
interquartile range (IQR), standard deviation (SD) and range.
Graphical diagrams are plotted as Box-Whisker Plots which represent
the median, the interquartile range, the minimum and the maximum
values of determined EGFR expression.
To investigate from which value increased expression
is relevant for the likelihood of transformation a cut-of point
(COP) was determined. For this a ROC (receiver operating
characteristic) curve was established and highest Youdan index and
its associated COP (optimal threshold value) were calculated. If
the value of a patient lies above the COP, the likelihood of
malignant transformation is considered as high. Based on this COP
group I and II was divided into two subgroups which show an
expression rate over or under the COP. Then the odds ratio and the
95% confidential interval was calculated.
Comparisons were performed between groups I and II,
OSCC and groups I and II and healthy mucosa (group IV) and the
groups I, II and II, respectively. Association between malignant
transformation and overexpression of EGFR was analysed by
Man-Whitney U test and by Fischer's exact test. P-values <0.05
were considered as statistically significant. All calculations were
performed with SPSS 19.0 for Windows (SPSS Inc., Chicago, IL,
USA).
Results
Clinical features, histopathological data
and follow-up of the patients
Of the OLP samples 60.2% (59/98) belonged to male
and 39.8% (39/98) to female patients. The average age of examined
patients with OLP was 55.8 years. Thirty-seven of the OLP had no
dysplasia (37.8%), 33 (33.7%) showed mild, 17 (17.3%) moderate and
11 (11.2%) severe dysplasia (Table
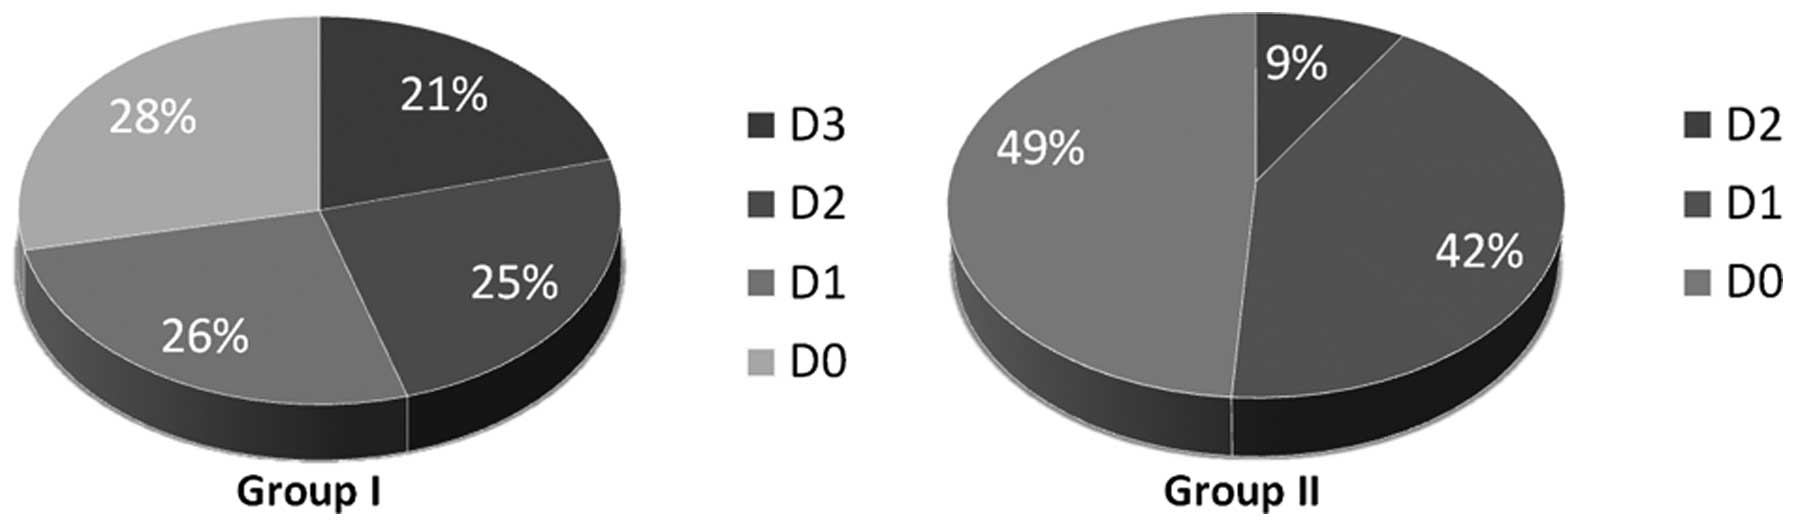
I). Transforming lesions are included in each group of
dysplasia. Within the proceeding lesions the distribution of the
dysplasia was nearly equal, whereas in group II (non-proceeding
OLP) predominantly tissues with low degrees and none with severe
dysplasia could be seen. Regarding D2 the fraction of the lesion
which transformed was three times higher as within the comparison
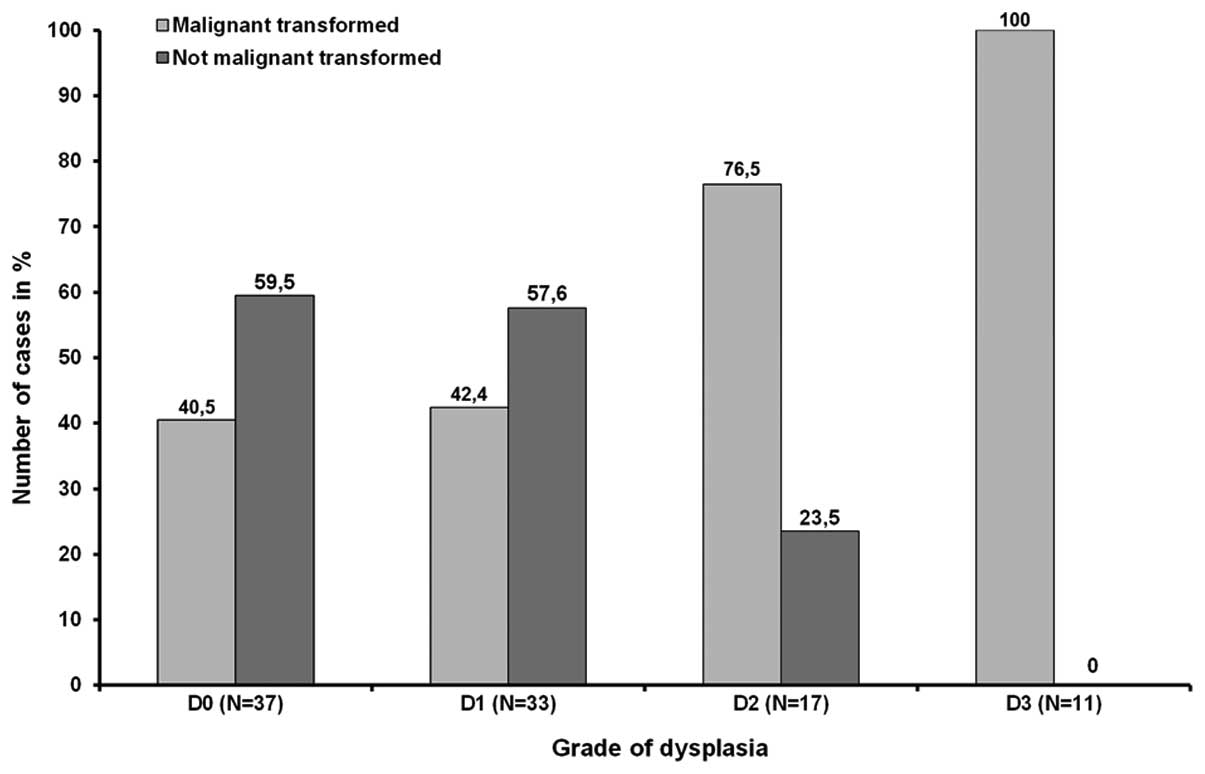
group II (Table I, Fig. 1). With rising grades of dysplasia
the risk of malignant transformation increases although the number
of emerging malignancies in D0 and D1 was almost equal. Out of 37
and 33 OLP exhibiting no or mild dysplasia 40.5% (n=15) and 42.4%
(n=19) proceeded into carcinoma, respectively. In contrast, 76.5%
(13/17) of all lesions showing moderate dysplasia and all 11 (100%)
OLP graded as D3 were base of a malignancy (Fig. 2). Statistical investigation revealed
that despite of the preselecting of transforming lesions the
correlation between risk of tumor development and grade of
dysplasia was significant (P<0.01).
 | Table IDistribution of dysplasia in total
samples and the two groups and disease-free survival time (DFS) of
the patients. |
Table I
Distribution of dysplasia in total
samples and the two groups and disease-free survival time (DFS) of
the patients.
| Grade of
dysplasia |
|---|
|
|
|---|
| D0
N (%) | D1
N (%) | D2
N (%) | D3
N (%) | Total
N |
|---|
| Group I | 15 (28.3) | 14 (26.4) | 13 (24.5) | 11 (20.8) | 53 |
| Group II | 22 (48.9) | 19 (42.2) | 4 (8.9) | 0 (0) | 45 |
| Total | 37 (37.8) | 32 (33.7) | 17 (17.3) | 11 (11.2) | 98 |
| | Mean value
(month) | | |
| DFS in group I | 17.4 | 29.6 | 11.7 | 8.5 | 16.8 |
| Mean DSF | Mean DSF | P<0.05a |
| 23.5 | 10.5 | |
The OLP lesions were divided into two groups. Group
I includes 53 lesions proceeding into malignancy within 5 years and
45 samples of group II did not show any malignant transformation
(Table I).
Out of the 53 proceeding OLP 40 were found in the
oral cavity and 13 in the oropharynx; of these, 64.2% (34/53) were
male and 35.8% (19/53) female. Consequently, the ratio of men to
women was about 2:1. The average age of the patients was 61.8
years. The average age of the male patients was 60.2 and that of
the women 63.3 years. Within group I all grades of dysplasia were
represented. Fifteen patients (28.3%) had no (D0), 14 (26.4%) mild,
13 (24.5%) moderate and 11 (20.8%) severe dysplasia. There was no
preference for any grade of dysplasia within group I (Table I, Fig.
1). The time interval between diagnosis of OLP and detection of
malignancy (DFS) was between 10 days and 60 months. The median time
from occurrence of OLP until manifestation of OSCC was 16.8 months.
The mean values of disease-free survival were lower with higher
dysplastic grade. Lesion exhibiting grades of dysplasia higher than
D1 transformed to OSCC in a time interval of 10.5 months. Mean DFS
value of the group that included D0 and D1 grades of dysplasia was
23.5 months. Because of the small case numbers a statistical
analysis was not carried out (Table
I).
Group II includes 45 samples which did not transform
within the 5-year follow-up period. All samples originated from the
oral cavity. Of this group 55.6% (25/45) were male and 44.4%
(20/45) female. The average age of the patients with OLP was 49.8
years. The average age of the men was 48.3 and that of the women
was 51.4 years. Contrary to group I only samples with the degrees
of D0 to D2 were included. No OLP with the grade D3 existed; 48.9%
(22/45) showed no dysplasia (D0), 42.2% (19/45) mild and 8.9%
(4/45) moderate dysplasia (Table I,
Fig. 1). There was no preference
for D0 or D1 grades of dysplasia within group II (P>0.05).
However, samples with high grade of dysplasia were clearly
under-represented. The distribution is given in Fig. 2.
Clinical and histological
characterization of corresponding OSCC and healthy oral mucosa
Out of the available corresponding tumors 21 could
be investigated immunhistologically. Most of the corresponding
tumors were small at time of diagnosis. In 15 cases data for tumor
size was available; 60% of all OSCC were T1, 13.3% were T2, 6.7%
were T3 and 6.7% were T4 tumors. In 2 cases a carcinoma in
situ (CIS) was diagnosed (13.3%). Twenty OSCC were also graded
for differentiation. Five (25%) OSCC cases were well (G1) and 9
(45%) were moderately (G2) and 6 (30%) were poorly differentiated.
Out of 16 valid samples 81.3% of the patients who developed a
malignancy were diagnosed at early stages of the disease. Only
18.8% belonged to late stages.
The 30 specimens of normal oral mucosa of healthy
volunteers did not show remarkable changes, such as inflammation
and hyper- or dysplasia, or any clinical abnormalities.
EGFR overexpression in proceeding and
non-proceeding leukoplakia and correlation to cancer risk
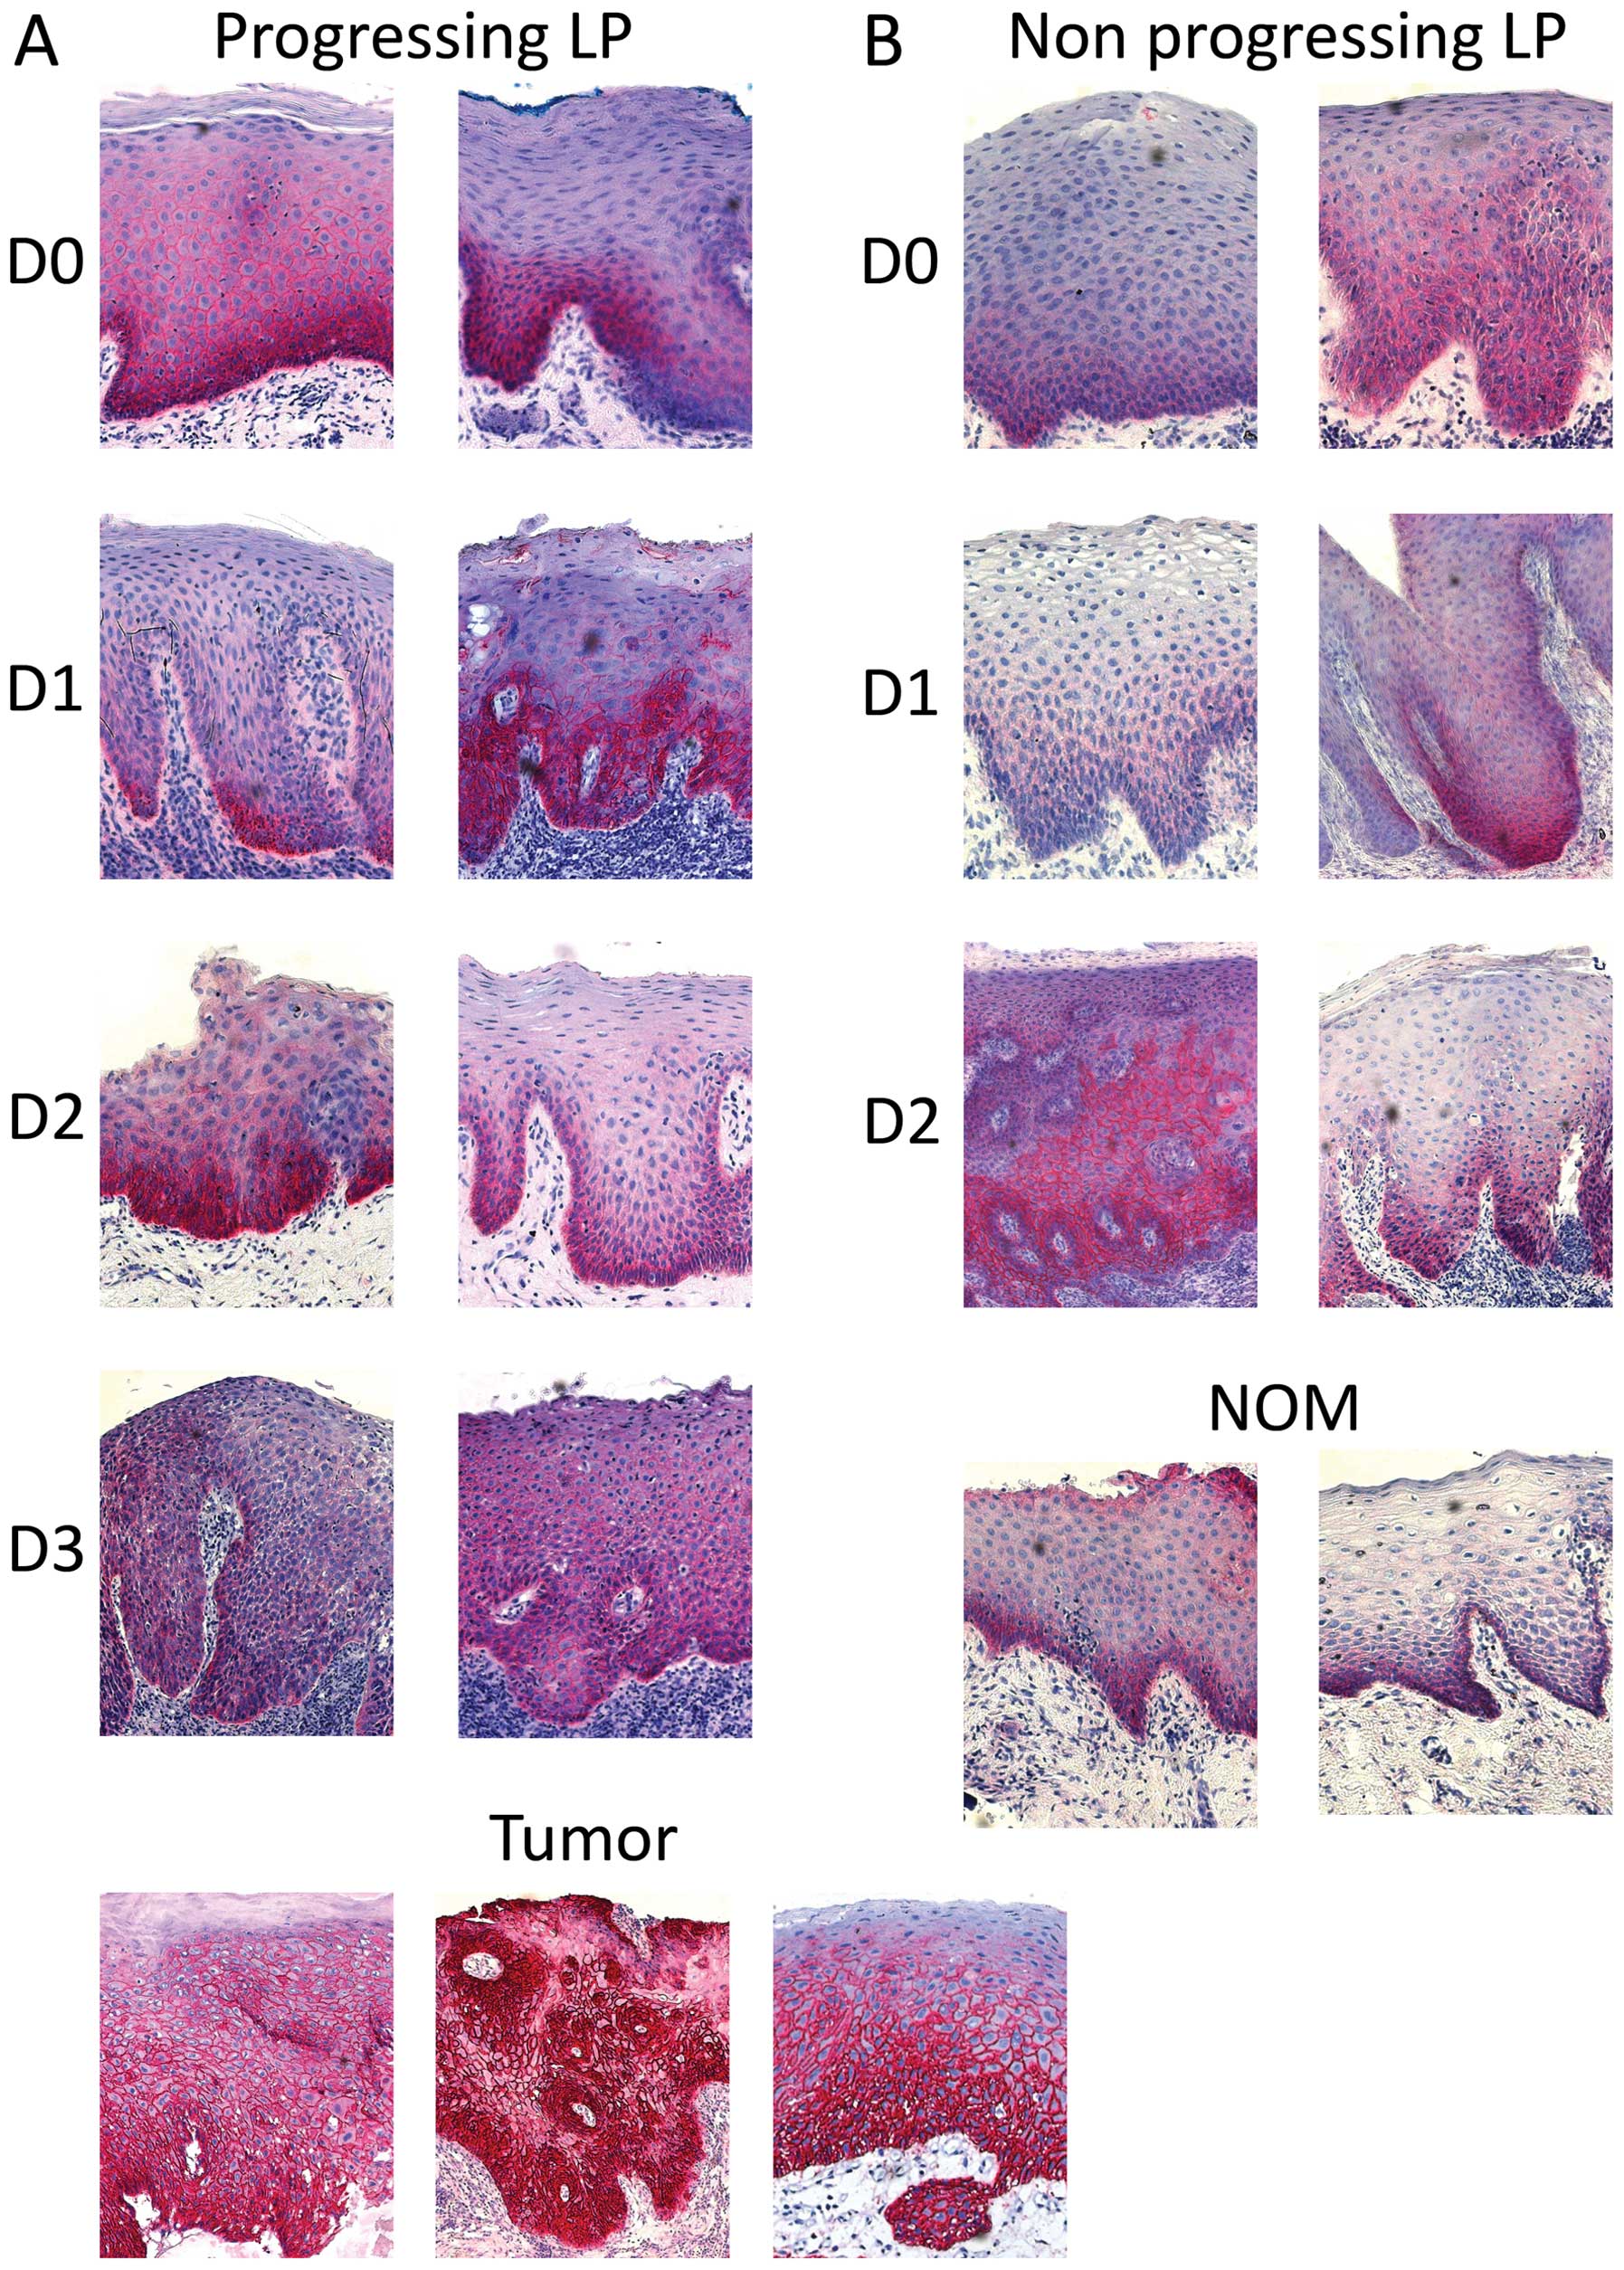
Representative staining of tissues is shown in
Fig. 3. Membranous and
cryptoclastic staining could be observed in all types of tissue
specimens with different labelling indices. The negative controls
demonstrated the absence of non-specific staining (data not
shown).
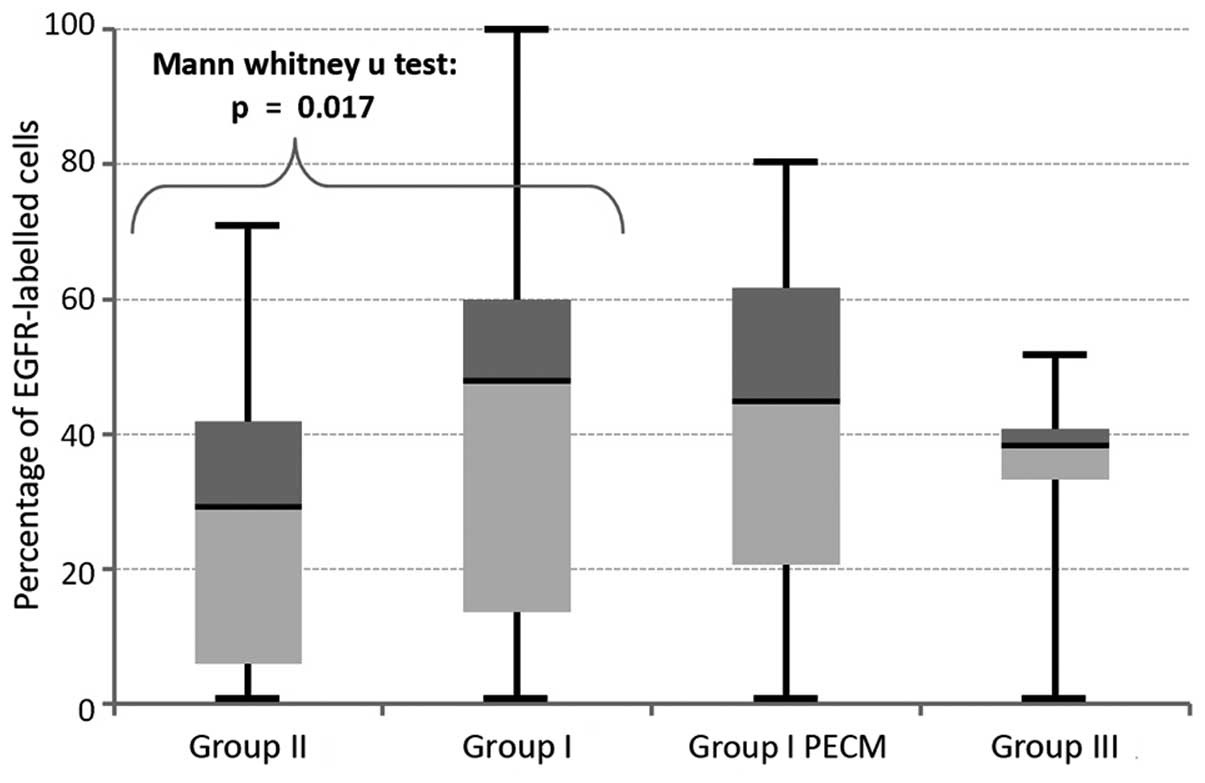
A significant different expression rate could be
determined between transformed and non-transformed OLP (P=0.017;
Fig. 4). Therefore, overexpression
of EGFR is a significant parameter for estimation of cancer risk in
OLP. No significant differences in labelling indices could be
ascertained for comparison of malignancies with either normal
healthy tissues (P=0.22) or with the OLP which they were based on
(P=0.50; Fig. 4). Additionally, no
significant difference in expression was found between the control
group (group IV) and group I (P=0.08) and group II (P=0.3),
respectively. All P-values of the comparisons between the different
groups are summarized in Table
II.
| Table IISummary of all calculated P-values
determined between the groups. |
Table II
Summary of all calculated P-values
determined between the groups.
| Comparison of
groups | P-value |
|---|
| Group I vs. group
II | 0.017 |
| Group I vs. group
III | 0.08 |
| Group I vs.
OSCC | 0.05 |
| Group III vs. group
II | 0.3 |
| Group III vs.
OSCC | 0.22 |
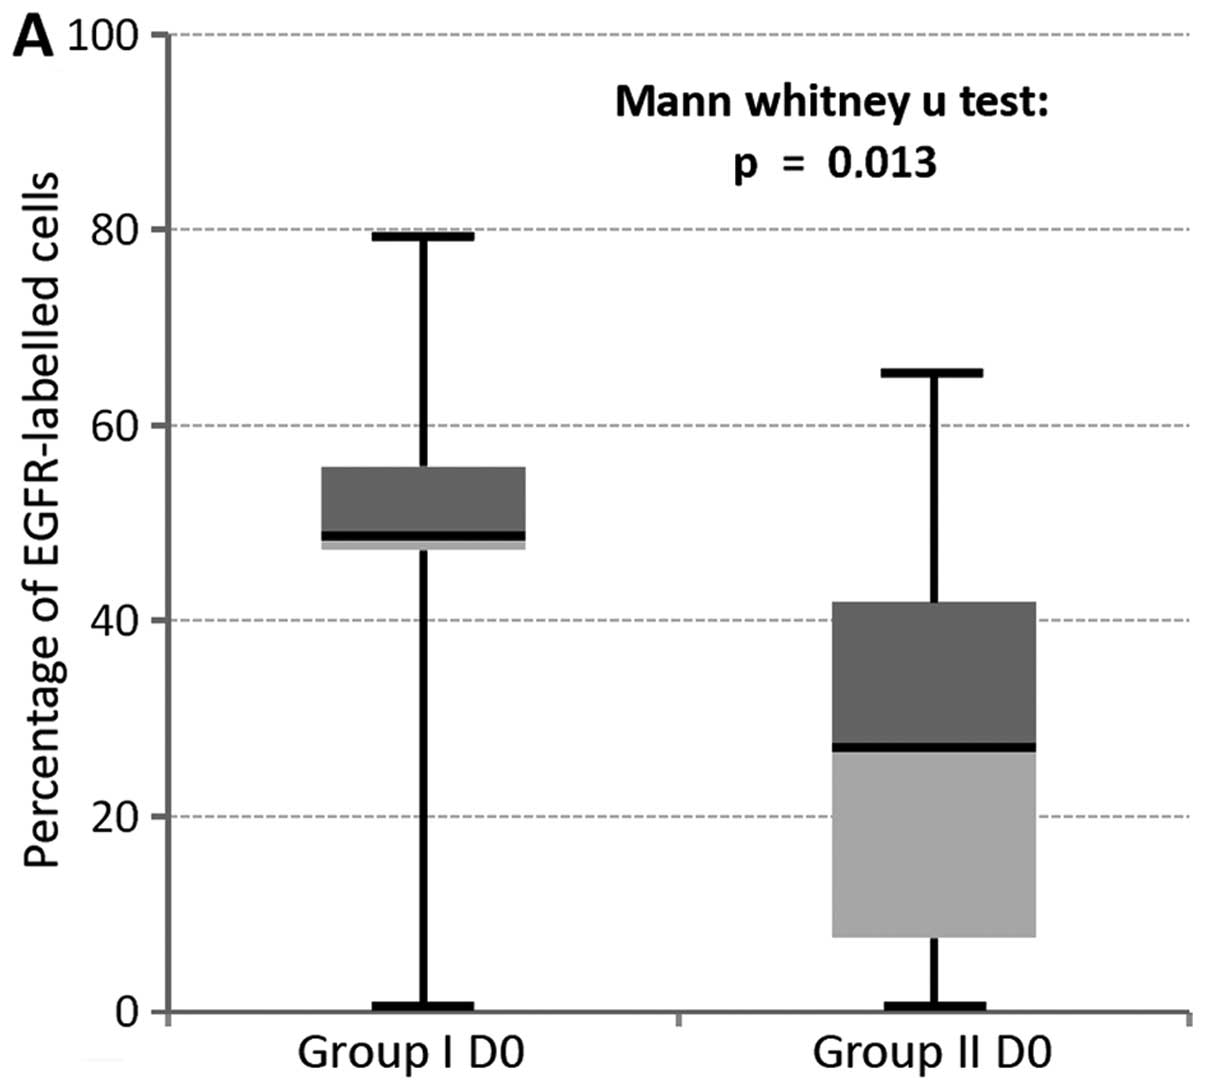
In addition, the mean expression level of EGFR in
OLP showing no histological (D0) or mild (D1) changes proceed into
cancer was highly different from non-transformed lesions. This was
not observed for the small group of D2 dysplasia (n=4; Table III). Accordingly, a statistically
significant different expression could be proven for low dysplasia
lesions. Statistic evaluation revealed that for this lesion the
expression was significantly increased in group I compared to group
II (D0, P=0.013; D1, P=0.049, Fig.
5).
| Table IIIDifferences of expression rates
within dysplasia groups. |
Table III
Differences of expression rates
within dysplasia groups.
| Labelling
index/expression rate |
|---|
|
|
|---|
| Grade of
dysplasia | D0 | D1 | D2 | D3 |
|---|
| Group I | 45.68 | 44.95 | 28.09 | 39.65 |
| Group II | 27.06 | 26.12 | 37.95 | - |
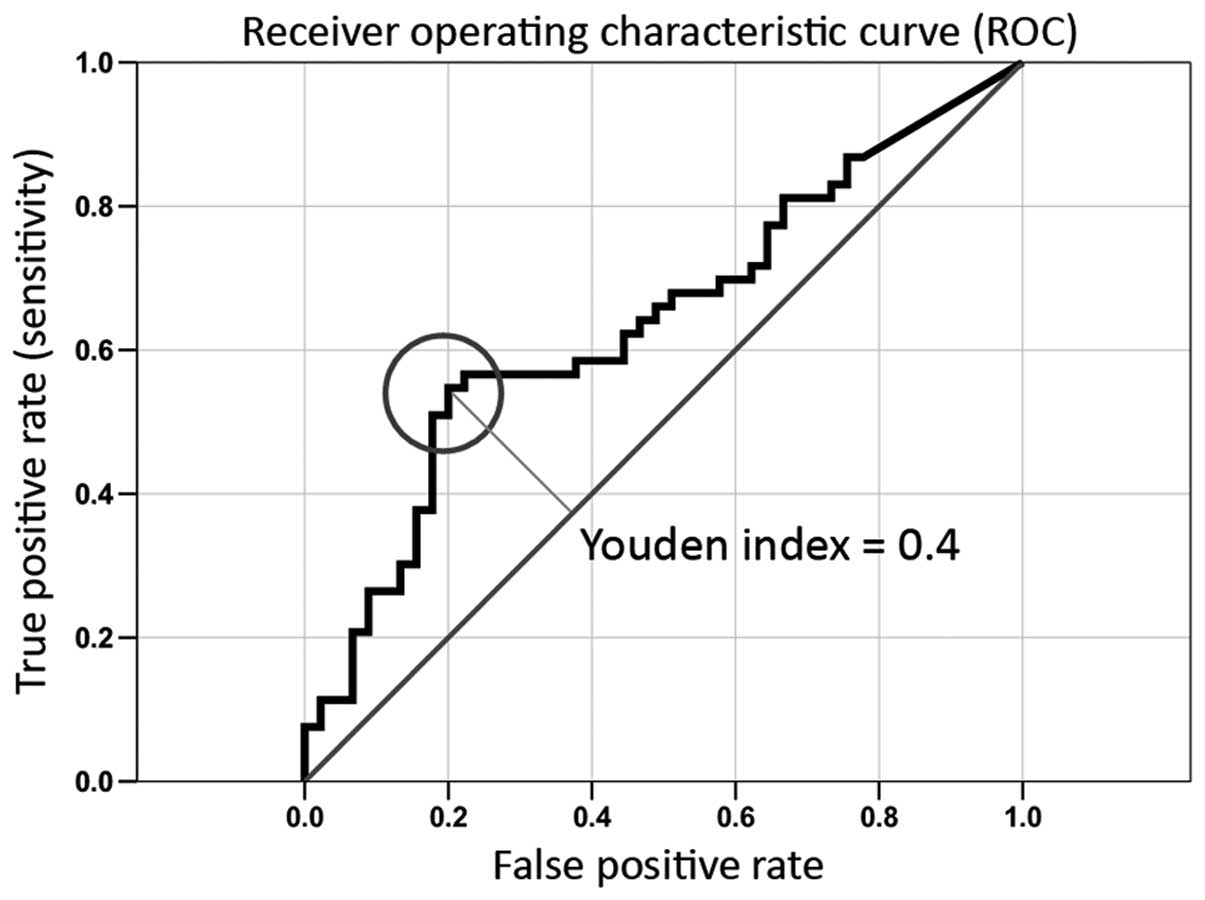
To display the discriminatory accuracy of the marker
for distinguishing between group I and group II, the ROC (receiver
operating characteristic) curve was used. It is a plot of the
sensitivity (true positive rate) vs. 1-specifity (false positive
rate) over all possible threshold values of the marker (Fig. 6). For selection of the optimal
threshold value (cut of point) for the biological marker the Youdan
index (Y) which is a frequently used summary measure of the ROC
curve was calculated. Both measure the effectiveness of a
diagnostic marker and enables the selection of an optimal threshold
value (cut-off point) for the marker which is associated with the
highest Youdan index (Y = Sensitivity + Specificity - 1) (29). The highest Youden index was 0.4. The
AUC value amounts to 64%. The optimal threshold value (COP) for
distinguishing the transformed from non-transformed lesions was
44.96 (critical expression rate of EGFR).
Using the determined COP the groups were divided
into positive and negative lesions where the parameter allows the
prediction of the development of a malignancy for individual
patients. Out of 53 proceeding OLP 29 (54.7%) exhibited a labelling
index over 44.96. whilst in ‘benign’ lesions 9 (20%) showed an
expression level above this. The correlation between high risk
lesions and the detection of increased expression rates were
significant (P=0.001; Table
IV).
| Table IVCorrelation between overexpression of
EGFR (COP=44.96) and malignant transformation of OLP. |
Table IV
Correlation between overexpression of
EGFR (COP=44.96) and malignant transformation of OLP.
| No. of cases | + | − | Positive (%) | P-value |
|---|
| Proceeding OLP | 53 | 29 | 24 | 54.7 | 0.001a |
| Non-proceeding
OLP | 45 | 9 | 36 | 20 | |
In addition, the odds ratio and the 95% confidence
interval (CI) could be determined on the results of the cross
table. The value of odd ratio was 4.83. Thus, the risk of cancer
development of patients suffering from an OLP exhibiting an
expression over the COP of 44.96% is nearly 5 times higher. The 95%
CI ranges from 1.95 to 11.99. Thus, the risk of malignant
transformation of OLP, which exceeds the threshold of 44.96 is at
least double and maximally 12 times higher compared to those which
are below the threshold value.
Discussion
To date, the risk of malignant transformation of OLP
lesions are evaluated histopathologically based on the degree of
dysplasia (4–6,8–10).
This evaluation relies on single biopsies that sometimes are not
representative for the whole lesion. Moreover, a high
inter-examiner and intra-examiner variability has been identified
in the assessment of the degree of epithelial dysplasia (9,10,30–32).
It has been stated that objective molecular biological tools are
urgently needed to improve the evaluation of the risk of malignant
transformation of OLP (6,7,33).
Today many markers are discussed, but none of them is either used
in clinical routine or can predict the behaviour of OLP on its own
(6,11,13–17,24,27,34–36).
Therefore, in order to increase accuracy identification of
additional reproducible molecular markers by multi-centric studies
with larger cohorts for multivariate analyses is urgently
needed.
Additionally, only a few studies include a follow up
of patients over 5 years (14,15).
Hence, there is a lack of information on the rate of malignant
transformation of OLP over longer follow-up intervals comparing
immunohistochemical features and conventional histopathological
aspects of the lesions. Therefore, the present study included only
OLP lesions of patients with 5-year follow-up data. Its aim was to
evaluate if there were correlations between EGFR overexpression in
OLP, the rate of malignant transformation and the histopathological
grade of dysplasia.
Previous studies have demonstrated increased EGFR
expression in oral leukoplakia (18,23,24,26,27,37).
Especially, it has been shown that the percentage of EGFR positive
OLP lesions is significantly increased in high-risk sites of the
oral cavity, where OSCC often occur (24,26,27).
To the best of our knowledge, the present study is the largest one
in the field as far as EGFR overexpression is concerned. We were
able to include approximately 100 OLP lesions. The main finding is
that a relevant overexpression of EGFR was present exclusively in
OLP lesions that transformed into OSCC. The correlation between
malignant transformation of OLP and EGFR overexpression was
statistically significant. Consequently, it seems that in the
future prospective studies have to show if routine
immunohistochemical determination of EGFR overexpression in OLP
allows identifying those lesion that will transform into OSCC. The
present study confirms previous findings that concern the relevance
of determination of the histopathological grade of dyslasia of OLP
for the prediction of malignant transformation. It seems that the
histopathological determination of the degree of dysplasia of OLP
may have only a limited value for predicting malignant
transformation (18,38).
In conclusion, the significant overexpression of
EGFR in OLP that transform into OSCC gives information as to the
use of the determination of EGFR overexpression in predicting
malignant transformation of these lesions. On the other hand, the
histopathological determination of the grade of dysplasia of OLP
seems to have only a limited value as far as the prediction of
malignant transformation is concerned.
Acknowledgements
The present study has been supported by the DFG
(Deutsche Forschungsgemeinschaft, NK 453/3-1). The authors would
also like to thank Ms. E. Diebel, Ms. A. Krautheim-Zenk and Ms. S.
Schönherr for their valuable technical support.
References
|
1
|
Gondos A, Arndt V, Holleczek B, Stegmaier
C, Ziegler H and Brenner H: Cancer survival in Germany and the
United States at the beginning of the 21st century: an up-to-date
comparison by period analysis. Int J Cancer. 121:395–400. 2007.
View Article : Google Scholar : PubMed/NCBI
|
|
2
|
Jemal A, Siegel R, Xu J and Ward E: Cancer
statistics, 2010. CA Cancer J Clin. 60:277–300. 2010. View Article : Google Scholar
|
|
3
|
Lung T, Tascau OC, Almasan HA and Muresan
O: Head and neck cancer, treatment, evolution and post therapeutic
survival. Part 2: a decade's results 1993–2002. J Craniomaxillofac
Surg. 35:126–131. 2007.PubMed/NCBI
|
|
4
|
Warnakulasuriya S, Johnson NW and van der
Waal I: Nomenclature and classification of potentially malignant
disorders of the oral mucosa. J Oral Pathol Med. 36:575–580. 2007.
View Article : Google Scholar : PubMed/NCBI
|
|
5
|
van der Waal I: Potentially malignant
disorders of the oral and oropharyngeal mucosa; terminology,
classification and present concepts of management. Oral Oncol.
45:317–323. 2009.PubMed/NCBI
|
|
6
|
Reibel J: Prognosis of oral pre-malignant
lesions: significance of clinical, histopathological, and molecular
biological characteristics. Crit Rev Oral Biol Med. 14:47–62. 2003.
View Article : Google Scholar : PubMed/NCBI
|
|
7
|
Pitiyage G, Tilakaratne WM, Tavassoli M
and Warnakulasuriya S: Molecular markers in oral epithelial
dysplasia: review. J Oral Pathol Med. 38:737–752. 2009. View Article : Google Scholar : PubMed/NCBI
|
|
8
|
Pindborg JJ, Reichart P, Smith CJ and Waal
I: World Health Organization: histological typing of cancer and
precancer of the oral mucosa. Springer-Verlag; Berlin: pp. 47–62.
1997
|
|
9
|
Warnakulasuriya S, Reibel J, Bouquot J and
Dabelsteen E: Oral epithelial dysplasia classification systems:
predictive value, utility, weaknesses and scope for improvement. J
Oral Pathol Med. 37:127–133. 2008. View Article : Google Scholar
|
|
10
|
Fleskens S and Slootweg P: Grading systems
in head and neck dysplasia: their prognostic value, weaknesses and
utility. Head Neck Oncol. 1:112009. View Article : Google Scholar : PubMed/NCBI
|
|
11
|
Warnakulasuriya S: Lack of molecular
markers to predict malignant potential of oral precancer. J Pathol.
190:407–409. 2000. View Article : Google Scholar : PubMed/NCBI
|
|
12
|
Ha PK, Chang SS, Glazer CA, Califano JA
and Sidransky D: Molecular techniques and genetic alterations in
head and neck cancer. Oral Oncol. 45:335–339. 2009. View Article : Google Scholar : PubMed/NCBI
|
|
13
|
Nasser W, Flechtenmacher C, Holzinger D,
Hofele C and Bosch FX: Aberrant expression of p53,
p16INK4a and Ki-67 as basic biomarker for malignant
progression of oral leukoplakias. J Oral Pathol Med. 40:629–635.
2011.PubMed/NCBI
|
|
14
|
Ries J, Agaimy A, Vairaktaris E, Gorecki
P, Neukam FW, Strassburg LH and Nkenke E: Detection of MAGE-A
expression predicts malignant transformation of oral leukoplakia.
Cancer Invest. 30:495–502. 2012. View Article : Google Scholar : PubMed/NCBI
|
|
15
|
Ries J, Agaimy A, Vairaktaris E, Kwon Y,
Strassburg LH, Neukam FW and Nkenke E: Evaluation of MAGE-A
expression and grade of dysplasia for predicting malignant
progression of oral leukoplakia. Int J Oncol. 41:1085–1093.
2012.PubMed/NCBI
|
|
16
|
Ries J, Ponader S, Mollaoglu N,
Vairaktaris E, Neukam FW and Nkenke E: Early findings of a novel
established molecular diagnostic technique for the prediction of
malignant transformation in leukoplakia. Mol Med Report. 2:947–952.
2009. View Article : Google Scholar : PubMed/NCBI
|
|
17
|
Schaaij-Visser TB, Bremmer JF, Braakhuis
BJ, Heck AJ, Slijper M, van der Waal I and Brakenhoff RH:
Evaluation of cornulin, keratin 4, keratin 13 expression and grade
of dysplasia for predicting malignant progression of oral
leukoplakia. Oral Oncol. 46:123–127. 2010. View Article : Google Scholar : PubMed/NCBI
|
|
18
|
Shin DM, Ro JY, Hong WK and Hittelman WN:
Dysregulation of epidermal growth factor receptor expression in
premalignant lesions during head and neck tumorigenesis. Cancer
Res. 54:3153–3159. 1994.PubMed/NCBI
|
|
19
|
Smith J, Rattay T, McConkey C, Helliwell T
and Mehanna H: Biomarkers in dysplasia of the oral cavity: a
systematic review. Oral Oncol. 45:647–653. 2009. View Article : Google Scholar : PubMed/NCBI
|
|
20
|
Vairaktaris E, Serefoglou Z, Avgoustidis
D, Yapijakis C, Critselis E, Vylliotis A, Spyridonidou S, et al:
Gene polymorphisms related to angiogenesis, inflammation and
thrombosis that influence risk for oral cancer. Oral Oncol.
45:247–253. 2009. View Article : Google Scholar : PubMed/NCBI
|
|
21
|
Vairaktaris E, Yapijakis C, Derka S,
Vassiliou S, Serefoglou Z, Vylliotis A, Wiltfang J, et al:
Association of platelet glycoprotein Ia polymorphism with minor
increase of risk for oral cancer. Eur J Surg Oncol. 32:455–457.
2006. View Article : Google Scholar : PubMed/NCBI
|
|
22
|
Yapijakis C, Vairaktaris E, Vassiliou S,
Vylliotis A, Nkenke E, Nixon AM, Derka S, et al: The low VEGF
production allele of the +936C/T polymorphism is strongly
associated with increased risk for oral cancer. J Cancer Res Clin
Oncol. 133:787–791. 2007.
|
|
23
|
Oliveira LR and Ribeiro-Silva A:
Prognostic significance of immunohistochemical biomarkers in oral
squamous cell carcinoma. Int J Oral Maxillofac Surg. 40:298–307.
2011. View Article : Google Scholar : PubMed/NCBI
|
|
24
|
Ribeiro DC, Gleber-Netto FO, Sousa SF,
Bernardes VD, Guimaraes-Abreu MH and Aguiar MC: Immunohistochemical
expression of EGFR in oral leukoplakia: association with
clinicopathological features and cellular proliferation. Med Oral
Patol Oral Cir Bucal. 17:e739–744. 2012. View Article : Google Scholar : PubMed/NCBI
|
|
25
|
Nagatsuka H, Ishiwari Y, Tsujigiwa H,
Nakano K and Nagai N: Quantitation of epidermal growth factor
receptor gene amplification by competitive polymerase chain
reaction in pre-malignant and malignant oral epithelial lesions.
Oral Oncol. 37:599–604. 2001. View Article : Google Scholar
|
|
26
|
Taoudi Benchekroun M, Saintigny P, Thomas
SM, et al: Epidermal growth factor receptor expression and gene
copy number in the risk of oral cancer. Cancer Prev Res. 3:800–809.
2010.PubMed/NCBI
|
|
27
|
Srinivasan M and Jewell SD: Evaluation of
TGF-alpha and EGFR expression in oral leukoplakia and oral
submucous fibrosis by quantitative immunohistochemistry. Oncology.
61:284–292. 2001. View Article : Google Scholar : PubMed/NCBI
|
|
28
|
Srinivasan M and Jewell SD: Quantitative
estimation of PCNA, c-myc, EGFR and TGF-α in oral submucous
fibrosis - an immunohistochemical study. Oral Oncol. 37:461–467.
2001.PubMed/NCBI
|
|
29
|
Fluss R, Faraggi D and Reiser B:
Estimation of the Youden Index and its associated cutoff point.
Biom J. 47:458–472. 2005. View Article : Google Scholar : PubMed/NCBI
|
|
30
|
Brennan M, Migliorati CA, Lockhart PB,
Wray D, Al-Hashimi I, Axell T, Bruce AJ, et al: Management of oral
epithelial dysplasia: a review. Oral Surg Oral Med Oral Pathol Oral
Radiol Endod. 103(Suppl 19): S19.e1–S19.e12. 2007. View Article : Google Scholar
|
|
31
|
Fleskens SA, Bergshoeff VE, Voogd AC, van
Velthuysen ML, Bot FJ, Speel EJ, Kremer B, et al: Interobserver
variability of laryngeal mucosal premalignant lesions: a
histopathological evaluation. Mod Pathol. 24:892–898. 2011.
View Article : Google Scholar : PubMed/NCBI
|
|
32
|
Holmstrup P, Vedtofte P, Reibel J and
Stoltze K: Oral premalignant lesions: is a biopsy reliable? J Oral
Pathol Med. 36:262–266. 2007. View Article : Google Scholar : PubMed/NCBI
|
|
33
|
Napier SS and Speight PM: Natural history
of potentially malignant oral lesions and conditions: an overview
of the literature. J Oral Pathol Med. 37:1–10. 2008. View Article : Google Scholar : PubMed/NCBI
|
|
34
|
Angiero F, Berenzi A, Benetti A, Rossi E,
Del Sordo R, Sidoni A, Stefani M and Dessy E: Expression of p16,
p53 and Ki-67 proteins in the progression of epithelial dysplasia
of the oral cavity. Anticancer Res. 28:2535–2539. 2008.PubMed/NCBI
|
|
35
|
Cruz IB, Snijders PJ, Meijer CJ, Braakhuis
BJ, Snow GB, Walboomers JM and van der Waal I: p53 expression above
the basal cell layer in oral mucosa is an early event of malignant
transformation and has predictive value for developing oral
squamous cell carcinoma. J Pathol. 184:360–368. 1998. View Article : Google Scholar : PubMed/NCBI
|
|
36
|
Feng CJ, Li HJ, Li JN, Lu YJ and Liao GQ:
Expression of Mcm7 and Cdc6 in oral squamous cell carcinoma and
precancerous lesions. Anticancer Res. 28:3763–3769. 2008.PubMed/NCBI
|
|
37
|
Grandis JR and Tweardy DJ: TGF-alpha and
EGFR in head and neck cancer. J Cell Biochem. (Suppl 17): 188–191.
1993. View Article : Google Scholar : PubMed/NCBI
|
|
38
|
Rautava J, Jee KJ, Miettinen PJ, Nagy B,
Myllykangas S, Odell EW, Soukka T, et al: ERBB receptors in
developing, dysplastic and malignant oral epithelia. Oral Oncol.
44:227–235. 2008. View Article : Google Scholar : PubMed/NCBI
|