Introduction
Urinary bladder cancer (BC) is the fifth most common
malignancy. In the US, every year approximately 15,000 individuals
succumb to this disease (1). The
diagnostic ‘gold standard’ in cases of urinary BC is cystoscopy, an
invasive and relatively expensive procedure. Non-invasive urine
cytology shows diagnostic high specificity but has the disadvantage
of low sensitivity. Numerous urine-based tests such as bladder
tumour antigen (BTA), nuclear matrix protein 22 (NMP22) or FISH
cannot replace cystoscopy or cytology for diagnosis and follow-up
examination (2). Thus, the
development of non-invasive diagnostic markers for the detection of
BC is an essential objective in urology.
Several studies have shown that microRNAs (miRNAs)
are involved in various biological processes, including
tumourigenesis (3,4). miRNAs act as oncogenes or
tumour-suppressor genes depending on the target that they regulate.
The detection of differentially expressed miRNAs in tissues and
body fluids is becoming increasingly important. Specific miRNA
profiles have been identified for several types of carcinomas,
among them urinary BC. The results are partly contradictory since
different array platforms, sample processing modes, patient groups,
and normalization strategies were used (5–11).
miRNAs in easily accessible body fluids could reflect tissue
situation and are therefore of great, diagnostic and prognostic
interest. Data regarding the detection of miRNAs in urine samples
have been rarely published (12–16).
In bladder cancer, urinary miR-126 was described as a specific
indicator of BC (16), while
overexpressed miR-96 and miR-183 were found to be correlated to
tumour stage and grade (15).
Another study showed a characteristic panel of 3 miRNAs
(miR-15b/miR-135b/miR-1224-3p) in urine sediments for detecting
urothelial cell carcinomas (12).
We analyzed the miRNA expression profile in whole
blood and urine samples from patients with superficial and invasive
bladder tumours in comparison with healthy individuals. In a first
step, an miRNA microarray technology identified a panel of
significant miRNAs. In a second step, following investigation of a
greater number of patients, the expression level of a limited
number of selected differentially expressed miRNAs was validated
using real-time quantitative PCR (RT-qPCR). In blood samples, 3
miRNAs (miR-26b-5p, miR-144-5p, miR-374b-5p) were identified as
discriminators between invasive tumours and the control group,
while 3 other miRNAs (miR-520e, miR-618, miR-1255b-5p) were
significantly increased in urine samples of patients with invasive
tumours.
Materials and methods
Blood and urine of patient groups and
controls
Blood and urine samples were collected from BC
patients without metastasis and from a control group including
healthy individuals and patients with benign urological diseases.
All samples were collected immediately before transurethral
resection of BC or cystectomy at the Charité University Hospital
between 2010 and 2012. Following surgery, tumour classification was
established according to the UICC 2010 TNM system. The study was
approved by the Human Use Committee of our hospital (file:
EA1/187/09), and informed consent of all patients was obtained. All
BCs were transitional cell carcinomas; samples from patients with
CIS were not investigated. Blood samples were collected and stored
using PAXgene™ blood RNA tubes (Becton-Dickinson, Heidelberg,
Germany). Urine collection (30 ml) was performed with a urine RNA
concentration, preservation and isolation kit (Norgen Biotek Corp.,
Thorold, Canada). The study was performed on two independent sample
sets of blood and urine. Set one included 12 blood and urine
(Table I) and set two, 58 blood and
55 urine samples (Table II),
respectively. The demographic and clinicopathological
characteristics of the study groups are summarized in Tables I and II. Samples from set one were used for
miRNA profiling on a microarray platform and samples from set two
were used for the RT-qPCR validation of miRNAs.
 | Table IClinical and demographic
characteristics of the patients in set one for the study of miRNAs
in blood and urine samples using the TaqMan microarray
platform. |
Table I
Clinical and demographic
characteristics of the patients in set one for the study of miRNAs
in blood and urine samples using the TaqMan microarray
platform.
| Patient no. | Age (years) | Gender | Stage | Grade |
|---|
| 1 | 58 | Male | Healthy | - |
| 2 | 39 | Female | Healthy | - |
| 3 | 68 | Male | Healthy | - |
| 4 | 56 | Female | Healthy | - |
| 5 | 73 | Male | Superficial Ta | G1, low |
| 6 | 61 | Male | Superficial Ta | G1, low |
| 7 | 63 | Male | Superficial Ta | G2, high |
| 8 | 63 | Male | Superficial Ta | G1, low |
| 9 | 66 | Female | Invasive T2a | G3 |
| 10 | 78 | Male | Invasive T2 | G3 |
| 11 | 66 | Male | Invasive T3b | G3 |
| 12 | 91 | Female | Invasive T1 | G3 |
| Table IIClinical and demographic
characteristics of the patients in set two for the study of miRNAs
in blood and urine samples using RT-qPCR. |
Table II
Clinical and demographic
characteristics of the patients in set two for the study of miRNAs
in blood and urine samples using RT-qPCR.
|
Characteristics | Control group | Superficial Ta | Invasive
>T1 |
|---|
| Blood samples |
| Total no. | 20 | 18 | 20 |
| Age, in years
median (range) | 43 (27–82) | 67 (30–83) | 69 (46–76) |
| Gender |
| Male | 5 | 8 | 12 |
| Female | 15 | 10 | 8 |
| Grade |
| G1, low | | 8 | |
| G2, low | | 9 | |
| G2, high | | 1 | 2 |
| G3 | | | 18 |
| Urine samples |
| Total no. | 19 | 16 | 20 |
| Age, in years
median (range) | 49 (27–82) | 67 (51–83) | 70 (46–79) |
| Gender |
| Male | 4 | 9 | 12 |
| Female | 15 | 7 | 8 |
| Grade |
| G1, low | | 6 | |
| G2, low | | 9 | 2 |
| G2, high | | 1 | 3 |
| G3 | | | 15 |
RNA isolation from blood and urine
samples
Total RNA from the PAXgene™ blood samples was
isolated using the PAXgene Blood miRNA kit (Qiagen, Hilden,
Germany). The Norgen kit was used for the isolation of total RNA
from urine samples including DNase treatment. RNA was collected in
300 μl elution buffer and concentrated using the Concentrator 5301
(Eppendorf, Hamburg, Germany). The concentrated RNA was dissolved
in a final volume of 70 μl of RNase-free water. As we detected DNA
despite the DNase treatment step in the Norgen isolation procedure,
we executed an additional DNase treatment using the
Ambion® Turbo DNA-free™ kit (Applied Biosystems, Foster
City, CA, USA). Quant-iT™ RiboGreen® RNA reagent
(Molecular Probes, Göttingen, Germany) was applied for urine RNA
quantification on the LightCycler 1.5 (17).
microRNA microarray experiments
Microarray experiments were carried out using
TaqMan® array human microRNA cards (Applied Biosystems)
including 754 human miRNAs from the Sanger database v14 and 8
control miRNAs. The urine RNA samples were investigated using an
additional pre-amplification step. Reverse transcription was
performed with 3 μl blood RNA (~200 ng/μl) or urine RNA (~10
ng/μl). On the microarray cards, miRNAs were quantified until a
Cq-threshold of 32. The expression level was calculated using the
formula 2−ΔCq and normalized to snRNA U6. In this
report, the current nomenclature of miBase v 19 was used.
microRNA RT-qPCR
For each study group, 6 miRNAs were selected from
the large number of differentially expressed miRNAs to validate
them in blood and urine samples. The PCR reaction was carried out
under the following conditions. Reverse transcription was performed
using 6 ng blood and 1 ng urine RNA, respectively, and
TaqMan® microRNA reverse transcription kit (Applied
Biosystems). In the case of blood samples, the PCR reaction
included 1 μl miRNA-specific cDNA, 1X TaqMan® Universal
PCR Master Mix and gene-specific 1X TaqMan® microRNA
assay solution (Applied Biosystems). In the case of urine samples,
a modification occurred, since 0.2X TaqMan® MicroRNA
assay solution was used. Afterwards a pre-amplification reaction
only for the urine samples was performed with 1 μl cDNA,
TaqMan® Preamp Mix and gene-specific 0.05X
TaqMan® microRNA assay solution. Each PCR run included a
non-template control with water instead of cDNA. An miRNA was
detected with a Cq-value ≤35 and was normalized to the expression
of small RNA U6 for blood miRNAs. The urine miRNAs were normalized
to 1 ng urine RNA which was used for cDNA amplification. All PCR
reactions with sample set one were carried out in triplicates.
All PCR reactions with the sample set two were
carried out under the same conditions. All PCR reactions were
carried out in duplicates. Standard curves of diluted
miRNA-specific cDNA miR-26b-5p for blood and miR-29a-3p for urine
as well as snRNA U6 from pooled normal bladder tissue was generated
and used for calculation of expression values. The resulting
expression values are provided as arbitrary units. The analytical
reliability of PCR methods was characterized by the efficiency of
amplification between 1.80 and 2.08 for snRNA U6 and miR-26b-5p,
respectively. The precision of repeated measurements was tested
with snRNA U6 (n=10) and miR-26b-5p (n=8) of 0.47 and 0.63% at
threshold cycles (Cq-values) of 27.3±0.13 and 28.8±0.18,
respectively. These details related to the blood RNA-isolates.
Sample set two (Table
II) was used for validation. The blood miRNAs were normalized
to snRNA U6 and the urine miRNAs to RNA concentration of the urine
RNA isolate after concentration and DNase-treatment. Afterwards,
the median expression for miRNA in each group was computed and
tested for significance between the groups.
Statistical analysis
Statistical analyses were performed with the
software GraphPad Prism for Windows, version 5 (GraphPad Software,
San Diego, CA, USA). Outliers in the control groups were identified
with the Grubbs’ test. The two outliers in the blood control group
were from the same healthy individuals and were excluded from
further analysis. The samples from these individuals were collected
in 2010 and no bladder cancer was diagnosed at the end of 2012. The
outliers in the urine control group were caused by different
healthy individuals so that these values were not excluded from
further analysis. The Kruskal-Wallis and Mann-Whitney U tests were
used for data comparison between groups. Medians were considered
significantly different at P<0.05 (two tailed).
Receiver operation characteristic (ROC) analysis
(MedCalc, version 12 for Windows, Mariakerke, Belgium) was used to
characterize the capacity of a single miRNA or a combination of
miRNAs to discriminate between urine samples from controls and
bladder cancer patients.
Results
Characteristics of the patient groups and
samples
Blood and urine samples of set one were collected
from 4 controls and 4 patients with superficial and invasive
bladder cancer, respectively (Table
I). Sample set two included varying numbers of blood and urine
samples of controls and patients with superficial tumours (Table II). The analyzed blood and urine
samples were not always collected from the same patient due to the
very low RNA concentration in some urine samples. The median age
between BC patients and the control group was significantly
different (67 vs. 43 years, P<0.05) in blood and urine set two.
To date, reports concerning age-dependent changes in miRNA
expression in body fluids are not available. The snRNA U6 was
undetectable in 13 of 55 urine RNA samples (23.6%), and was
therefore not used for normalization. A similar observation was
reported by Hanke et al(16).
Identification of differentially
expressed miRNAs with microarray experiments
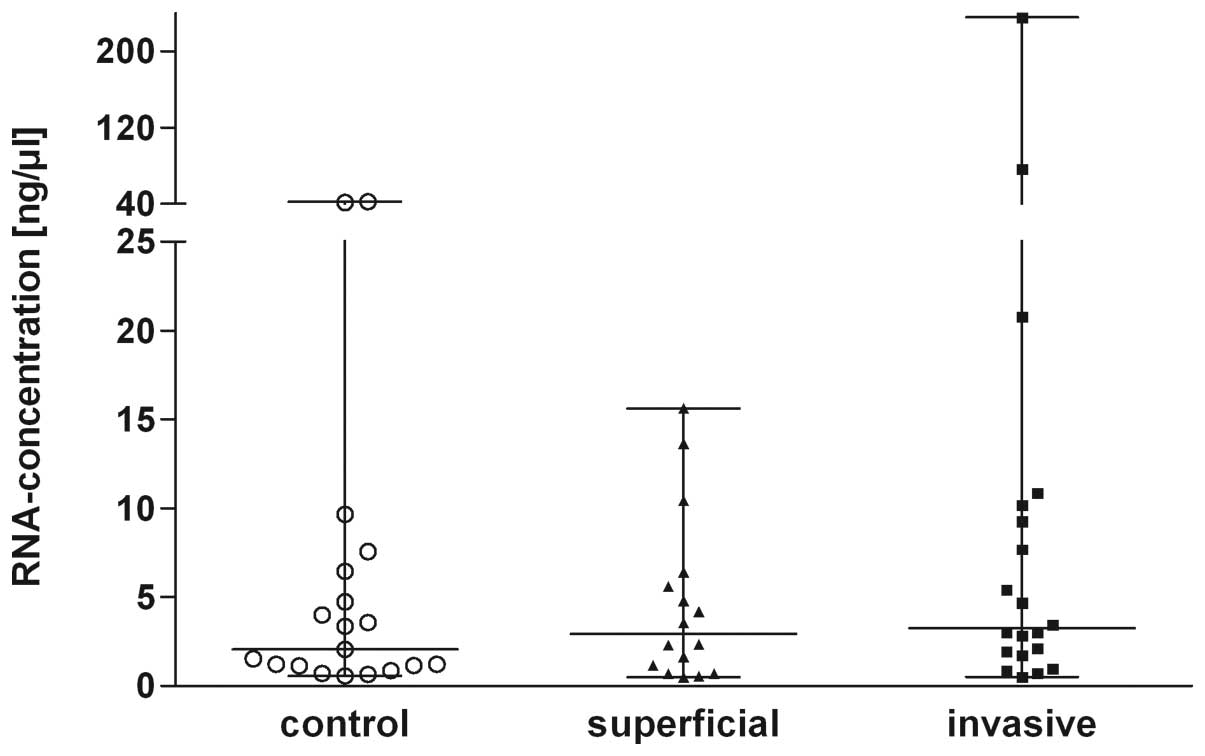
The characteristics of the RNA samples are
summarized in Table III. After
all preparation steps, the urine RNA concentrations were comparable
(Kruskal-Wallis; P=0.07) in all 3 groups (Fig. 1). Several urine RNA isolates showed
low RIN values <3. However, since the detection of miRNAs was
not compromised in RNA preparations with a low RIN value (18) all preparations were used for further
analysis. The microarray experiments identified >100
differentially expressed miRNAs in blood and >80 miRNAs in
urine. In blood samples, only increased miRNAs were observed in
comparison to the controls. The number of detected miRNAs in the
tumour group was greater than that in the controls. In urine
samples from invasive tumours, expression differences were observed
for 60 miRNAs. A short list of differently expressed miRNAs in the
samples are given in Tables IV and
V. There was no similarity between
miRNAs with the greatest expression differences between tumour and
control in blood and in urine. Therefore, various miRNAs were
selected for validation with RT-qPCR in blood and urine. miRNAs in
the patient samples with an increased fold-change ≥2.5 or a
decreased fold-change ≥10 were selected for further investigation.
In addition, miR-139-5p was also selected for further validation as
it showed a characteristic differential expression between tumour
and normal tissues (6,7,10).
Other miRNAs with expression alterations in tumour tissues such as
miR-21 and miR-205 (19,20) were not included in the validation
set of miRNAs since they were not detected in the blood or urine
samples.
| Table IIICharacteristics of the blood and
urine RNA samples. |
Table III
Characteristics of the blood and
urine RNA samples.
|
Characteristics | Control group | Superficial Ta | Invasive ≥T1 |
|---|
| Blood samples |
| Total no. | 20 | 18 | 20 |
|
A260/A280a (arithmetic mean ± SD) | 2.02±0.04 | 2.04±0.04 | 2.03±0.04 |
| RNA
integrityb, value (range) | 7.2–9.4 | | 8.8–9.2 |
|
Concentrationa (ng/μl) (arithmetic mean ± SD) | 222.7±143.6 | 177.8±57.9 | 218.7±162.4 |
| Urine samples |
| Total no. | 19 | 16 | 20 |
|
A260/A280a (arithmetic mean ± SD) | 1.40±0.52 | 1.28±0.49 | 1.70±0.56 |
| RNA
integrityb, value (range) | 1.7–2.9 | | 2.4 |
|
Concentrationc (ng/μl) (arithmetic mean ± SD) | 7.08±12.58 | 4.63±4.75 | 20.06±53.33 |
| Table IVShort list of differentially
expressed miRNAs in blood samples (microarray results). |
Table IV
Short list of differentially
expressed miRNAs in blood samples (microarray results).
| Fold changes |
|---|
|
|
|---|
| miRNA |
Superficial/control |
Invasive/control | Tumour/control |
|---|
|
hsa-miR-625-3p | 10.97 | 17.80 | 13.33 |
|
hsa-miR-574-3p | 5.61 | 13.23 | 7.76 |
| hsa-miR-361-5p | 0.67 | 8.86 | 7.04 |
|
hsa-miR-374b-5p | 2.44 | 7.93 | 4.99 |
|
hsa-miR-144-5p | 21.88 | 23.86 | 23.86 |
| hsa-miR-671-3p | 2.93 | 7.13 | 5.44 |
| hsa-miR-486-5p | 2.29 | 4.65 | 3.64 |
|
hsa-miR-26b-5p | 2.63 | 8.53 | 5.99 |
|
hsa-miR-374a-5p | 5.49 | 4.95 | 4.95 |
| hsa-miR-485-3p | 1.84 | 7.96 | 3.48 |
| hsa-miR-26a-5p | 2.29 | 6.82 | 4.29 |
| hsa-miR-18a-3p | 3.13 | 5.53 | 3.82 |
| hsa-miR-629-3p | 6.41 | 11.61 | 10.45 |
|
hsa-miR-550a-5p | 4.26 | 10.56 | 5.18 |
| hsa-miR-484 | 2.43 | 3.87 | 3.46 |
| hsa-miR-99b-5p | 2.55 | 6.61 | 4.52 |
|
hsa-miR-139-5p | 2.21 | 5.38 | 2.72 |
| hsa-miR-342-3p | 2.87 | 5.61 | 4.07 |
| hsa-miR-21-5p | 2.94 | 4.10 | 3.59 |
| hsa-miR-192-5p | 3.64 | 4.60 | 3.77 |
| Table VShort list of differentially
expressed miRNAs in urine samples (microarray results). |
Table V
Short list of differentially
expressed miRNAs in urine samples (microarray results).
| Fold changes |
|---|
|
|
|---|
| miRNA |
Superficial/control |
Invasive/control | Tumour/control |
|---|
| hsa-miR-21-5p | 94.28 | −5.48 | 5.48 |
| hsa-miR-202-3p | 1.73 | 17.78 | 15.42 |
|
hsa-miR-302a-3p | −3.17 | 18.18 | 9.78 |
|
hsa-miR-483-5p | −4.32 | 4.52 | 3.58 |
|
hsa-miR-548d-5p | 1.34 | 46.91 | 44.01 |
|
hsa-miR-618 | 1.93 | 14.23 | 8.12 |
|
hsa-miR-520e | −11.13 |
5,154.55 |
3,479.90 |
| hsa-miR-516-3p | 1.19 | 3.09 | 2.05 |
|
hsa-miR-520c-3p | 2.70 | 6.90 | 4.89 |
| hsa-miR-1303 | 1.60 | 3.94 | 3.25 |
|
hsa-miR-1255b-5p | 1.21 | 21.35 | 16.05 |
|
hsa-miR-875-5p | 4.12 | −40.95 | −22.15 |
| hsa-miR
29a-3p | −10.11 | −26,013 |
−2,535.4 |
| hsa-miR-222-3p | −5.42 | −38.08 | −29.24 |
| hsa-miR-342-3p | −23.42 | −95.82 | −62.06 |
| hsa-let-7e-5p | −88.28 | −114.43 | −103.31 |
Validation of differentially expressed
miRNAs with RT-qPCR
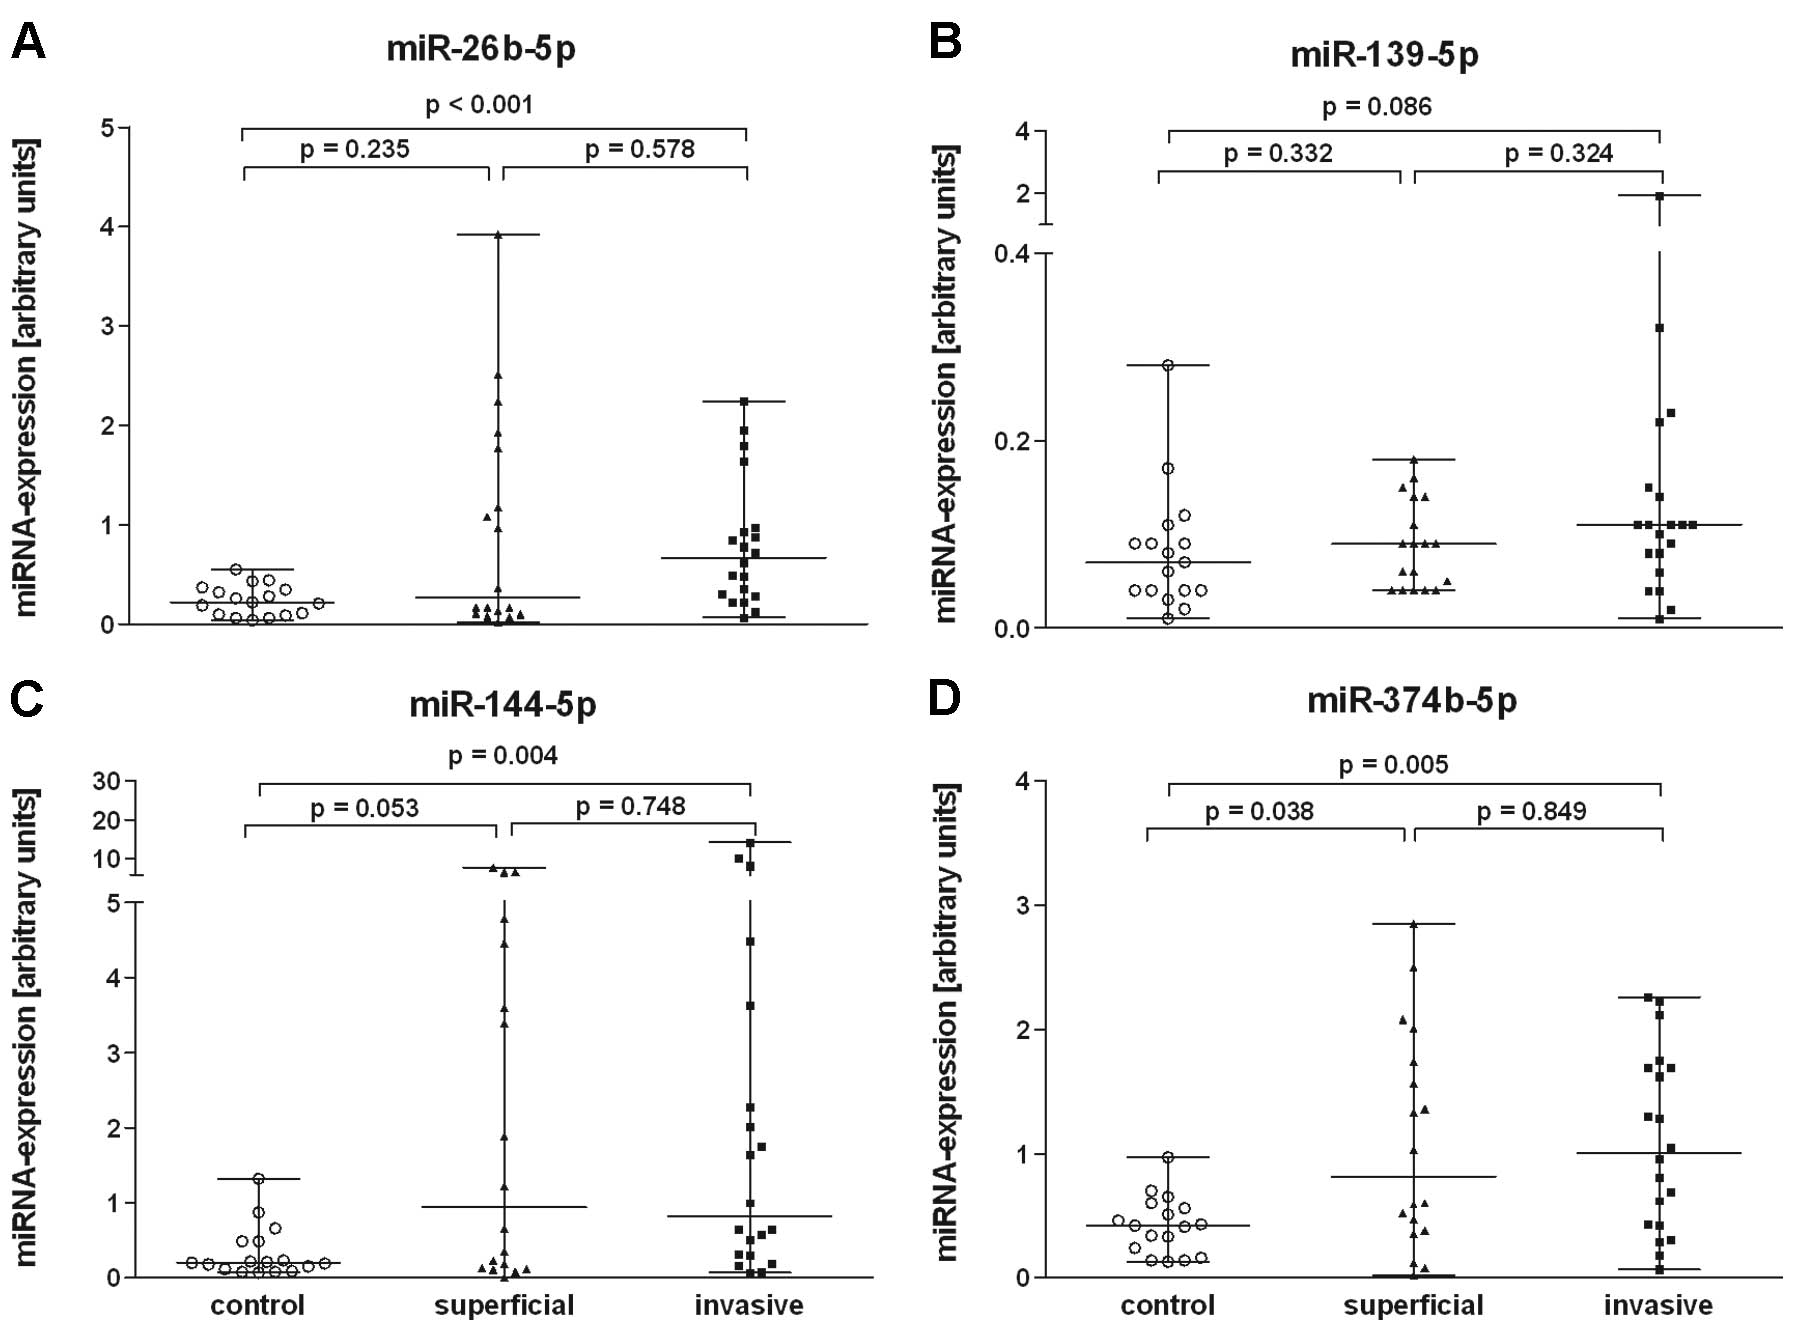
The quantification of blood miRNAs in sample set 2
showed an increased expression (≥2.0-fold) in invasive tumours for
miR-26b-5p, miR-144-5p and miR-374b-5p (Fig. 2) in comparison to the controls. The
other 3 miRNAs (miR-139-5p, miR-574-3p, miR-625-3p) were only
>1.5 times increased. The expression difference for these miRNAs
observed in microarray experiments could not be reproduced in the
RT-qPCR analysis. The expression of miRNAs miR-26b-5p (P<0.001),
miR-144-5p (P=0.004) and miR-374b-5p (P=0.005) in blood of patients
with invasive tumours was significantly increased in comparison to
the control group. Only miR-374b-5p discriminated between control
and patients with superficial tumours (P=0.038). Expression
differences of the other 2 miRNAs (miR-26-5p, miR-144p) between
patients with invasive and superficial tumours were not significant
(Fig. 2). When the blood samples
from the cancer patients were compared as one group (invasive and
superficial tumours together) with the control group, the
expression differences were significant for all 3 miRNAs
(miR-26b-5p, P=0.008; miR-144-5p, P=0.005 and miR-374b-5p,
P=0.005).
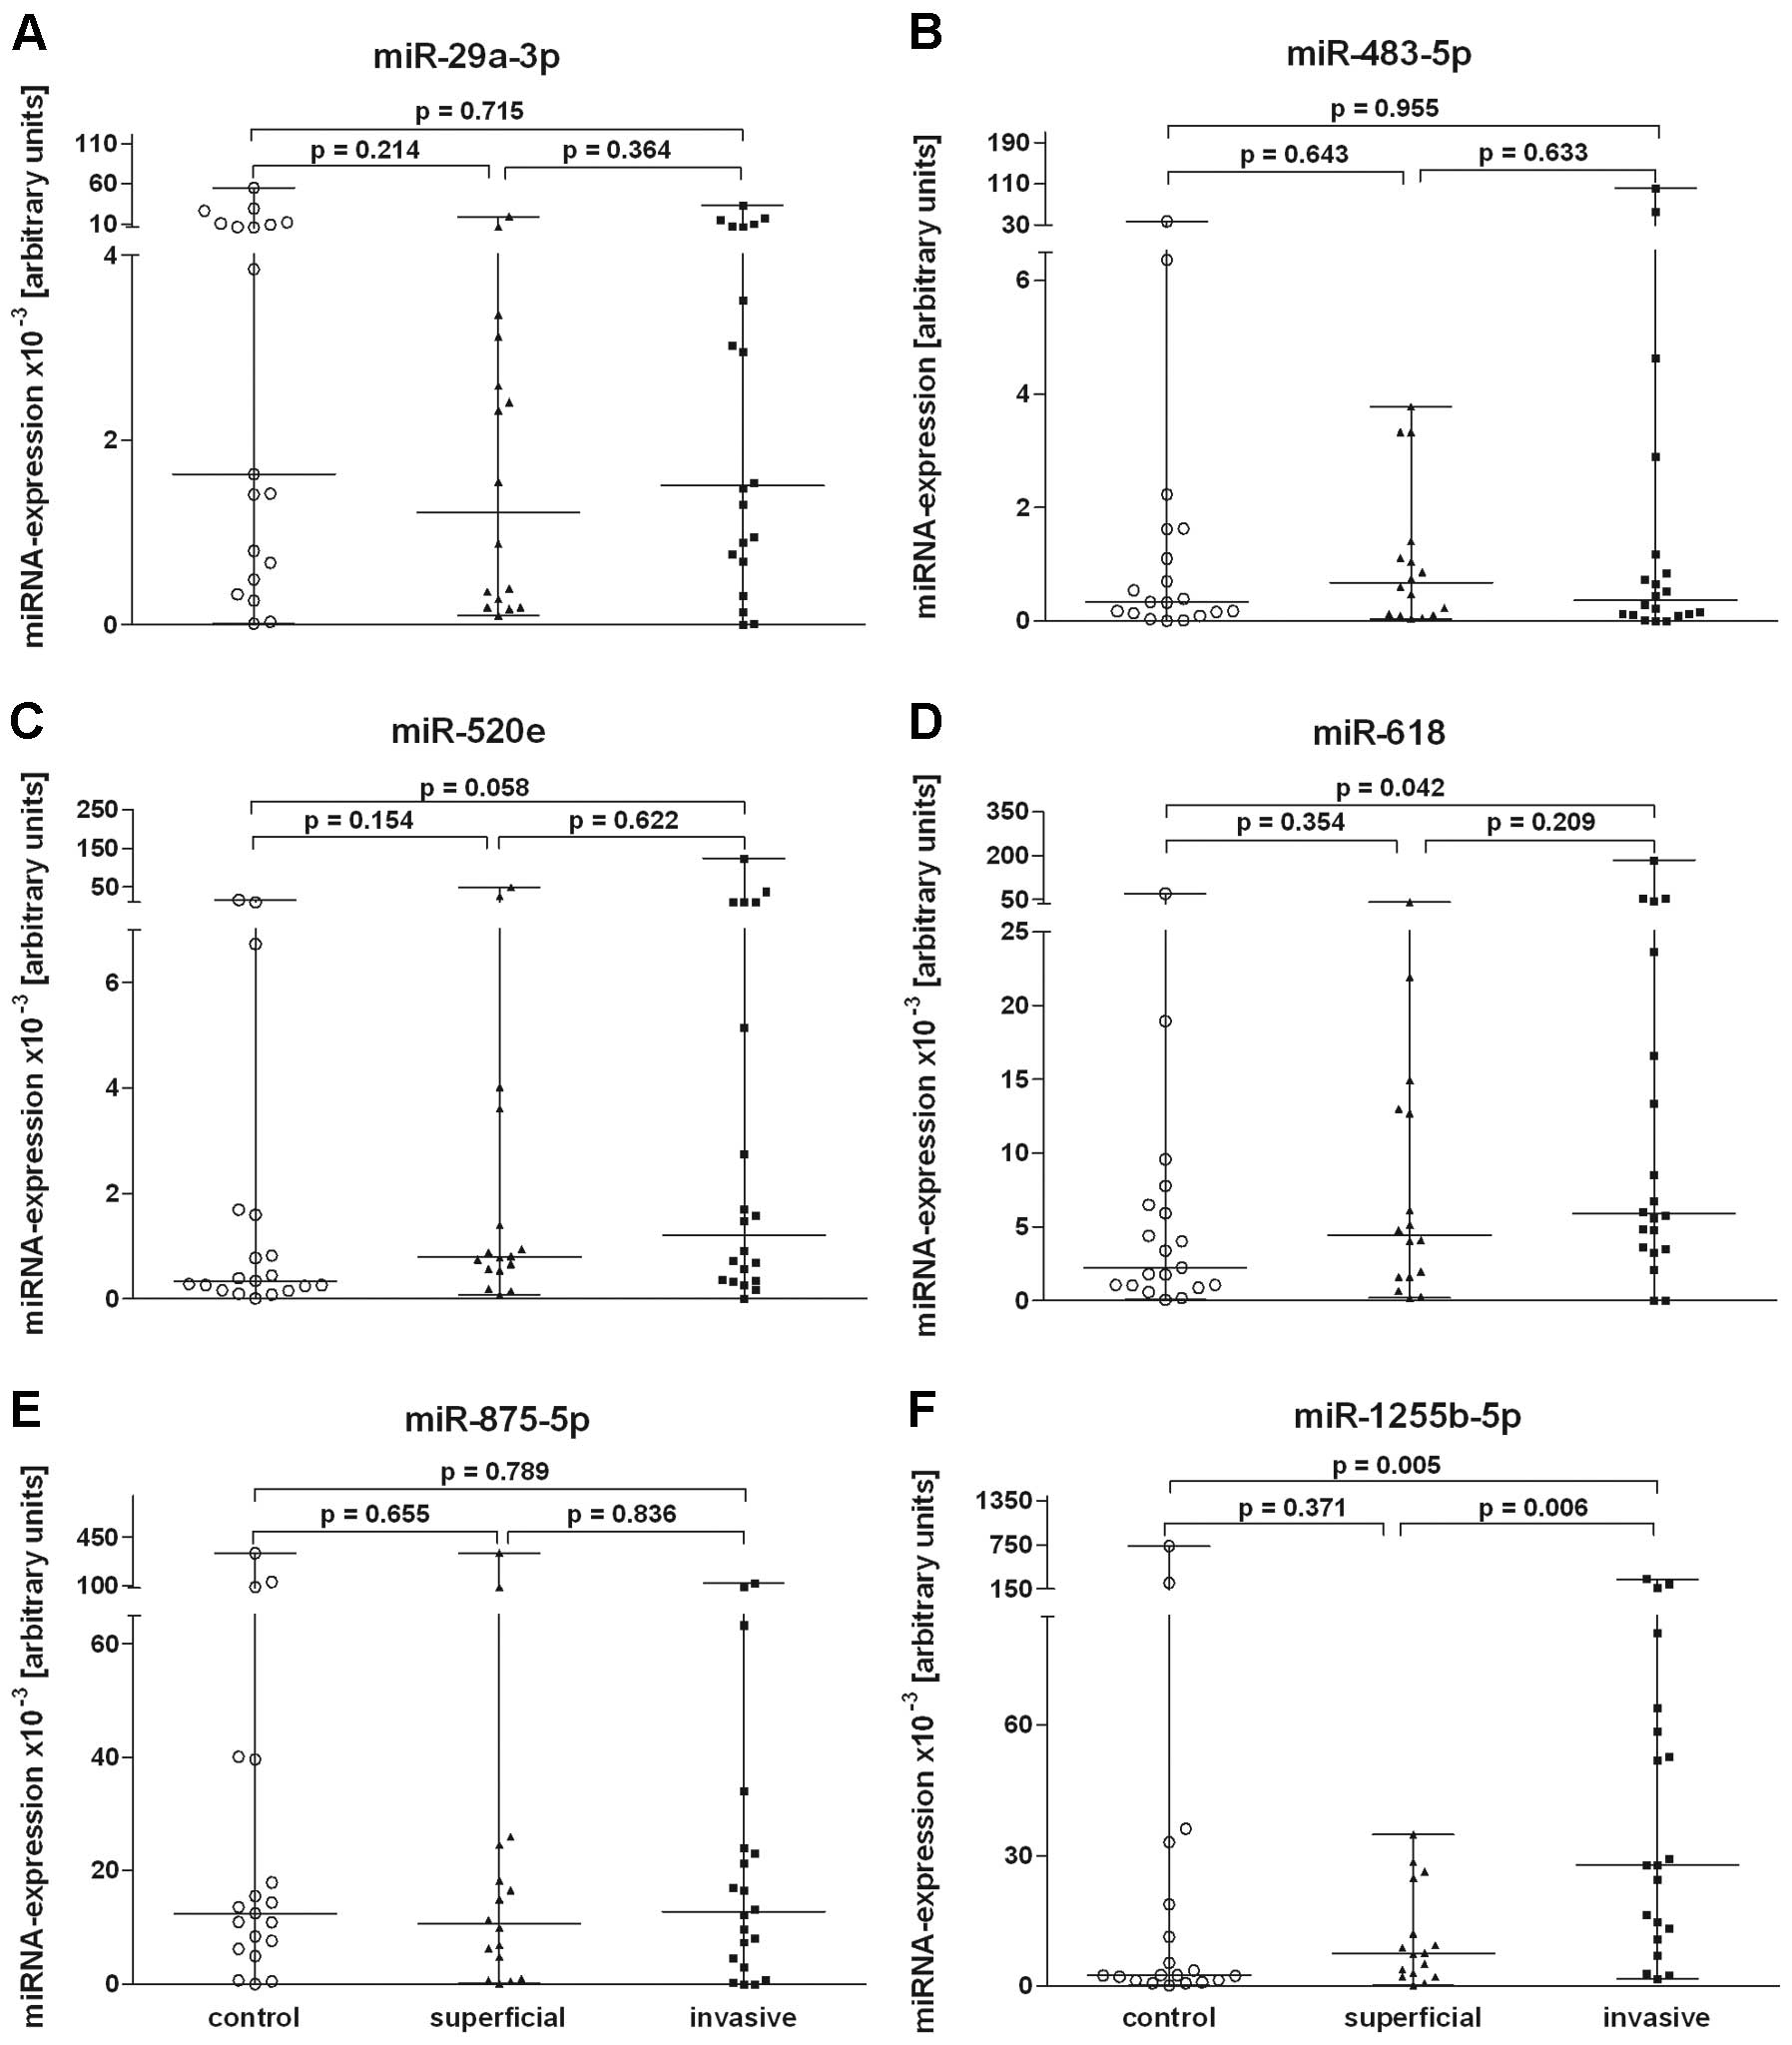
The validation of urine miRNAs in sample set two
showed an increasing expression (≥2.0-fold) in invasive tumours for
miR-520e, miR-618 and miR-1255b-5p. The expression of urine miRNAs
miR-618 (P=0.042) and miR-1255b-5p (P=0.005) in invasive tumours
was significantly increased in comparison to the control group. The
expression of miR-520e showed a tendency for increased values
(P=0.058) in the urine of the invasive tumour group compared with
the controls. Significant expression differences of these miRNAs
between invasive and superficial tumours were not observed
(Fig. 3). When the miRNAs of the
urine samples from the entire tumour group were compared with those
of the healthy controls, the expression differences were
significant for miR-1255b-5p (P=0.024).
Receiver operation characteristic (ROC)
analysis
ROC curve analysis demonstrated that each blood
miRNA had a good specificity but low sensitivity for the
identification of invasive tumours. All 3 urine miRNAs attained a
sensitivity ≥70%, but the specificity was equally low for the
identification of invasive tumours (Table VI).
| Table VIReceiver operating characteristic
curves are shown for 6 microRNAs detected in blood and urine
samples from 20 patients with invasive bladder carcinoma in
comparison with 20 and 19 healthy individuals, respectively. |
Table VI
Receiver operating characteristic
curves are shown for 6 microRNAs detected in blood and urine
samples from 20 patients with invasive bladder carcinoma in
comparison with 20 and 19 healthy individuals, respectively.
| miRNA | AUC | 95% CI | Cut-offa | Sensitivity
(%) | Specificity
(%) |
|---|
| Blood samples |
|
hsa-miR-26b-5p | 0.824 | 0.663–0.929 | 0.59 | 65.0 | 94.1 |
| hsa-miR-144
5p | 0.779 | 0.613–0.899 | 0.52 | 70.0 | 82.4 |
|
hsa-miR-374-5p | 0.774 | 0.606–0.894 | 0.54 | 60.0 | 94.1 |
| Urine samples |
| hsa-miR-520e | 0.679 | 0.510–0.819 | 0.44 | 70.0 | 63.2 |
| hsa-miR-618 | 0.692 | 0.524–0.830 | 4.4 | 70.0 | 68.4 |
|
has-miR-1255b-5p | 0.764 | 0.601–0.885 | 5.32 | 85.0 | 68.4 |
Discussion
miRNAs in blood and urine are of great interest from
the diagnostic and prognostic point of view since they can be
obtained by non-invasive or minimally invasive techniques. This is
the first study concerning dysregulated miRNAs in whole blood
samples from bladder cancer patients. From the 6 selected miRNAs
that were found with increased expression in blood, 4 miRNAs
(miR-26b-5p, miR-139-5p, miR-374b-5p, miR-574-3p) (6,7,10,11)
were also identified as markers in bladder cancer tissue. We
confirmed increased miR-26b-5p and miR-374b-5p values in blood
samples that reflected the increased values already described in
bladder cancer tissue samples (7,11).
miR-26b-5p and miR-374-5p in blood showed both a specificity of 94%
and sensitivities of 65 and 60%, respectively, in detecting
invasive tumours. Levels of the other 2 miRNAs miR-139-5p and
miR-574-3p were unchanged in blood whereas their expression was
found reduced in tumour tissue (6,7,10).
Additionally, this study identified miR-144-5p in blood samples as
a new marker of invasive bladder tumours. There are no reports
available concerning miR-144-5p in bladder cancer patients.
Expression alterations for the 3 miRNAs with increased expression
found in the blood samples in this study were reported in
connection with other carcinomas. Lung cancer showed alterations in
miR-26b and miR-374 (21,22). Changes in miR-144 expression levels
were observed in hepatocellular, lung and prostate cancer tissues
(23).
The investigation of miRNAs in whole blood samples
includes miRNAs from blood cells, released tumour cells, exosomes
as well as all circulating, cell-free miRNAs released from the
tumour. Since the proportion of circulating miRNAs of the total
miRNAs in blood samples is small, variations are mainly caused by
the blood cells and may be the result of systemic reactions linked
to the tumour disease. In conclusion, a tumour characteristic miRNA
pattern results from a specific reaction of the organism (24,25).
The second part of the present study referred to the
analysis of the RNA profile in urine. Reports on bladder
cancer-specific miRNA signatures in urine samples are rare
(12,15,16,26–28).
Using the RT-qPCR-based microarray we investigated the abundance of
754 different human miRNA species. This is the most comprehensive
examination of miRNA markers in urine after the report of Hanke
et al(16) who tested 157
different human miRNAs. In several other studies (15,26,27),
miRNAs were selected as urinary markers based on the distinct
expression differences found in tumour tissue. Other the authors
investigated only urine sediment (12,28).
However, most of the above analyzed miRNAs in those studies were
not detectable in the present microarray analysis of urine
specimens. miR-192 and miR-222 (28), although they were detected in all
urine samples, were not selected for further investigations as the
Cq-differences between samples from patients and controls were
<2.
In urine of the BC patients, using the microarray
approach, we identified the 2 miRNAs miR-29a-3p and miR-483-5p out
of the 6 selected miRNAs that had previously been described as
characteristic differentially expressed markers in bladder cancer
tissue (7,9). However, these characteristics found in
the initial sample set one could not be confirmed in sample set
two. Still, the expression differences for miR-618 and miR-1255b-5p
could be confirmed in the larger patient set two. For these 2
miRNAs, downregulated urinary excretion data has been described in
hepatocellular and renal carcinoma (29,30).
Both miRNAs may be linked with carcinomas but the origin of their
occurrence in urine is unclear. The expression of miR-520e showed a
tendency for increased values in the urine of the invasive tumour
group compared with the controls. The findings of Zhang et
al(31) suggest that miR-520e
may be a tumour-suppressor miRNA in hepatocellular carcinomas since
NF-κB-inducing kinase is one of the direct target genes of
miR-520e. Further studies with a large sample size will confirm
this tendency.
Commonly, small RNAs are used as endogenous controls
to normalize the expression data of miRNAs in tissues. Our results
showed that these endogenous controls are not suitable for
normalization of urine data as snRNA U6 was not expressed equally
in all samples. A systematic evaluation of normalization approaches
including the use of potential reference genes for the analysis of
urine miRNA has been lacking to date. For this reason, we
normalized the miRNA excretion using the same quantity of total RNA
for all measurements. This approach to normalization by using total
RNA was suggested by Bustin (32)
when reliable reference genes are not available. However, this
approach requires a reliable quantification of RNA, which we
achieved, despite the low RNA concentrations, using the
fluorimetric RNA assay with RiboGreen®(17).
In conclusion, this pilot study discovered three
dysregulated miRNAs in whole blood and 2 others in urine for the
identification of bladder cancer patients. miR-26b-5p is
significantly increased in the blood of invasive bladder cancer
patients and increased miR-1255b-5p in urine samples is also
characteristic. The receiver operating characteristic curve
analyses indicated that blood miR-26b-5p alone (AUC=0.824) and
urine miR-1255b-5p alone (AUC=0.764) provide significant accuracy
for invasive bladder cancer diagnosis. This study serves as a basis
for further studies to specify useful blood and urine miRNA
signatures and their application for initial bladder cancer
detection and surveillance.
Acknowledgements
This study was supported by grants from the European
Regional Development Fund (EFRE), ProFIT grant no. 10146784. We are
grateful to Sabine Weickmann for the excellent technical
assistance.
References
|
1
|
Siegel R, Naishadham D and Jemal A: Cancer
statistics, 2012. CA Cancer J Clin. 62:10–29. 2012. View Article : Google Scholar
|
|
2
|
Hakenberg OW: Epidemiologie, diagnose und
urinbasierte untersuchungsverfahren beim harnblasenkarzinom.
Onkologe. 13:1067–1079. 2007.(In German).
|
|
3
|
Calin GA and Croce CM: MicroRNA signatures
in human cancers. Nat Rev Cancer. 6:857–866. 2006. View Article : Google Scholar : PubMed/NCBI
|
|
4
|
Bartel DP: MicroRNAs: genomics,
biogenesis, mechanism, and function. Cell. 116:281–297. 2004.
View Article : Google Scholar : PubMed/NCBI
|
|
5
|
Han Y, Chen J, Zhao X, et al: MicroRNA
expression signatures of bladder cancer revealed by deep
sequencing. PLoS One. 6:e182862011. View Article : Google Scholar : PubMed/NCBI
|
|
6
|
Yoshino H, Chiyomaru T, Enokida H, et al:
The tumour-suppressive function of miR-1 and miR-133a targeting
TAGLN2 in bladder cancer. Br J Cancer. 104:808–818. 2011.
View Article : Google Scholar : PubMed/NCBI
|
|
7
|
Song T, Xia W, Shao N, et al: Differential
miRNA expression profiles in bladder urothelial carcinomas. Asian
Pac J Cancer Prev. 11:905–911. 2010.PubMed/NCBI
|
|
8
|
Wang G, Zhang H, He H, et al:
Up-regulation of microRNA in bladder tumor tissue is not common.
Int Urol Nephrol. 42:95–102. 2010. View Article : Google Scholar : PubMed/NCBI
|
|
9
|
Dyrskjøt L, Ostenfeld MS, Bramsen JB, et
al: Genomic profiling of microRNAs in bladder cancer: miR-129 is
associated with poor outcome and promotes cell death in vitro.
Cancer Res. 69:4851–4860. 2009.PubMed/NCBI
|
|
10
|
Ichimi T, Enokida H, Okuno Y, et al:
Identification of novel microRNA targets based on microRNA
signatures in bladder cancer. Int J Cancer. 125:345–352. 2009.
View Article : Google Scholar : PubMed/NCBI
|
|
11
|
Gottardo F, Liu CG, Ferracin M, et al:
Micro-RNA profiling in kidney and bladder cancers. Urol Oncol.
25:387–392. 2007. View Article : Google Scholar : PubMed/NCBI
|
|
12
|
Miah S, Dudziec E, Drayton RM, et al: An
evaluation of urinary microRNA reveals a high sensitivity for
bladder cancer. Br J Cancer. 107:123–128. 2012. View Article : Google Scholar : PubMed/NCBI
|
|
13
|
Wang G, Kwan BC, Lai FM, Chow KM, Li PK
and Szeto CC: Elevated levels of miR-146a and miR-155 in kidney
biopsy and urine from patients with IgA nephropathy. Dis Markers.
30:171–179. 2011. View Article : Google Scholar : PubMed/NCBI
|
|
14
|
Lorenzen JM, Volkmann I, Fiedler J, et al:
Urinary miR-210 as a mediator of acute T-cell mediated rejection in
renal allograft recipients. Am J Transplant. 11:2221–2227. 2011.
View Article : Google Scholar : PubMed/NCBI
|
|
15
|
Yamada Y, Enokida H, Kojima S, et al:
MiR-96 and miR-183 detection in urine serve as potential tumor
markers of urothelial carcinoma: correlation with stage and grade,
and comparison with urinary cytology. Cancer Sci. 102:522–529.
2011. View Article : Google Scholar
|
|
16
|
Hanke M, Hoefig K, Merz H, et al: A robust
methodology to study urine microRNA as tumor marker: microRNA-126
and microRNA-182 are related to urinary bladder cancer. Urol Oncol.
28:655–661. 2010. View Article : Google Scholar : PubMed/NCBI
|
|
17
|
Cheong A, Fountain SJ and Beech DJ:
Quantitative RT-PCR methods for investigation of low copy potassium
channel gene expression in native murine arteries. Methods Mol
Biol. 491:19–33. 2008. View Article : Google Scholar : PubMed/NCBI
|
|
18
|
Jung M, Mollenkopf HJ, Grimm C, et al:
MicroRNA profiling of clear cell renal cell cancer identifies a
robust signature to define renal malignancy. J Cell Mol Med.
13:3918–3928. 2009. View Article : Google Scholar : PubMed/NCBI
|
|
19
|
Neely LA, Rieger-Christ KM, Neto BS, et
al: A microRNA expression ratio defining the invasive phenotype in
bladder tumors. Urol Oncol. 28:39–48. 2010. View Article : Google Scholar : PubMed/NCBI
|
|
20
|
Catto JW, Miah S, Owen HC, et al: Distinct
microRNA alterations characterize high- and low-grade bladder
cancer. Cancer Res. 69:8472–8481. 2009. View Article : Google Scholar : PubMed/NCBI
|
|
21
|
Gao W, Shen H, Liu L, Xu J, Xu J and Shu
Y: MiR-21 overexpression in human primary squamous cell lung
carcinoma is associated with poor patient prognosis. J Cancer Res
Clin Oncol. 137:557–566. 2011. View Article : Google Scholar : PubMed/NCBI
|
|
22
|
Miko E, Czimmerer Z, Csánky E, Boros G,
Buslig J, Dezso B and Scholtz B: Differentially expressed microRNAs
in small cell lung cancer. Exp Lung Res. 35:646–664. 2009.
View Article : Google Scholar : PubMed/NCBI
|
|
23
|
Wang W, Peng B, Wang D, Ma X, Jiang D,
Zhao J and Yu L: Human tumor microRNA signatures derived from
large-scale oligonucleotide microarray datasets. Int J Cancer.
129:1624–1634. 2011. View Article : Google Scholar : PubMed/NCBI
|
|
24
|
Kossenkov AV, Vachani A, Chang C, et al:
Resection of non-small cell lung cancers reverses tumor-induced
gene expression changes in the peripheral immune system. Clin
Cancer Res. 17:5867–5877. 2011. View Article : Google Scholar : PubMed/NCBI
|
|
25
|
Keller A, Leidinger P, Borries A, et al:
miRNAs in lung cancer - studying complex fingerprints in patient’s
blood cells by microarray experiments. BMC Cancer.
9:3532009.PubMed/NCBI
|
|
26
|
Puerta-Gil P, García-Baquero R, Jia AY, et
al: miR-143, miR-222, and miR-452 are useful as tumor
stratification and noninvasive diagnostic biomarkers for bladder
cancer. Am J Pathol. 180:1808–1815. 2012. View Article : Google Scholar : PubMed/NCBI
|
|
27
|
Snowdon J, Boag S, Feilotter H, Izard J
and Siemens DR: A pilot study of urinary microRNA as a biomarker
for urothelial cancer. Can Urol Assoc J. 1–5. 2012. View Article : Google Scholar : PubMed/NCBI
|
|
28
|
Wang G, Chan ES, Kwan BC, Li PK, Yip SK,
Szeto CC and Ng CF: Expression of microRNAs in the urine of
patients with bladder cancer. Clin Genitourin Cancer. 10:106–113.
2012. View Article : Google Scholar : PubMed/NCBI
|
|
29
|
Abdalla MA and Haj-Ahmad Y: Promising
candidate urinary microRNA biomarkers for the early detection of
hepatocellular carcinoma among high-risk Hepatitis C virus Egyptian
patients. J Cancer. 3:19–31. 2012. View
Article : Google Scholar
|
|
30
|
Hidaka H, Seki N, Yoshino H, et al: Tumor
suppressive microRNA-1285 regulates novel molecular targets:
Aberrant expression and functional significance in renal cell
carcinoma. Oncotarget. 3:44–57. 2012.PubMed/NCBI
|
|
31
|
Zhang S, Shan C, Kong G, Du Y, Ye L and
Zhang X: MicroRNA-520e suppresses growth of hepatoma cells by
targeting the NF-κB-inducing kinase (NIK). Oncogene. 31:3607–3620.
2012.PubMed/NCBI
|
|
32
|
Bustin SA: Quantification of mRNA using
real-time reverse transcription PCR (RT-PCR): trends and problems.
J Mol Endocrinol. 29:23–39. 2002. View Article : Google Scholar : PubMed/NCBI
|