Introduction
Cancer is a major cause of mortality worldwide,
mainly due to metastasis (World Cancer Report 2008; URL: http://www.iarc.fr/en/publications/pdfs-online/wcr/index.php).
However, the molecular mechanism of metastasis is not well known.
The metastatic cascade has a series of discrete steps, including
epithelial-mesenchymal transition, invasion, anoikis, angiogenesis,
transport through vessels and outgrowth of secondary tumors.
Furthermore, recent findings suggested yet another step, a
premetastatic niche, before metastasis becomes evident (1). This cascade is a complex process.
SN12C clones have been established to be a suitable
model for spontaneous metastasis (2). SN12C was established from a human
renal cell carcinoma (HRCC) surgical specimen (3). SN12C-clone 2 and SN12C-PM6 have higher
metastatic potential than parental SN12C, with SN12C-PM6 having the
highest metastatic potential of all cell clones (4,5). On
the other hand, SN12C-clone 4 has lower metastatic potential than
parental SN12C (4).
Our previous studies using two-dimensional
electrophoresis (2-DE) covering pH 3.0–10.0 suggested eight protein
spots as potential candidates for high metastatic potential in
SN12C cell clones. In particular, ubiquitin carboxyl-terminal
hydrolase isozyme L1 (UCH-L1) correlated with high metastatic
potential SN12C clones. However, we were not able to show any
candidate for the low metastatic potential of SN12C-clone 4
(6). In the present study, we
performed proteomic differential display analysis for the four
SN12C cell clones with different metastatic potential (3–5) by
using 2-DE over a narrow pH range (pH 4.0–7.0), since in our
previous study, several protein spots were separated in the range
of pH 4.0–7.0 on the gels. In the present study, we showed that
glyoxalase 1 (GLO1) increases in high metastatic clones at the
protein level and we also discussed the biological significance of
the increase in the metastatic potential of SN12C HRCC clones and
scirrhous gastric cancer OCUM.
Materials and methods
Tumor cell lines and culture
conditions
We used four SN12C cell clones: SN12C (parent cell
line), SN12C-clone 2, SN12C-clone 4 and SN12C-PM6 (3–5). The
parental SN12C was established in culture from a primary renal cell
carcinoma from a 43-year-old man as previously described (3). SN12C-clones 2 and 4 were isolated from
SN12C by a double limiting dilution technique (7). SN12C-PM6 was established in
vitro from a solitary metastatic lung HRCC nodule of Balb/c
nude mouse which had been injected with 1×10⁶ viable
parental SN12C into the renal subcapsule (5). SN12C-clone 2 and SN12C-PM6 have a
higher metastatic potential than the SN12C (4,5).
We also used three human scirrhous gastric cancer
cell lines: OCUM-2M, OCUM-2D and OCUM-2MLN. OCUM-2M has a low
metastatic potential, while OCUM-2D and OCUM-2MLN, which have a
high metastatic potential, were previously established by Yashiro
et al(8) and Fujihara et
al(9). OCUM-2M, OCUM-2D and
OCUM-2MLN were maintained in high-glucose Dulbecco’s Modified
Eagle’s Medium (DMEM) with 10% fetal bovine serum (FBS) at 37°C in
a 5% CO2 atmosphere.
The SN12C cell clones were maintained in RPMI-1640
medium (Nissui, Tokyo, Japan) supplemented with 10% FBS at 37°C in
a 5% CO2 atmosphere.
We used SN12C clones and human scirrhous gastric
cancer cell lines passaged less than fifteen times culture after
the cells had been sent to our laboratory. We used passage number
of 8th to 15th culture for 2-DE and western blot analysis.
As confirmation, we used seven cell lines with
varying metastatic potential.
Sample preparation
Cells were homogenized in lysis buffer (50 mM
Tris-HCl, pH 7.5, 165 mM sodium chloride, 10 mM sodium fluoride, 1
mM sodium vanadate, 1 mM PMSF, 10 mM EDTA, 10 μg/ml aprotinin, 10
μg/ml leupeptin and 1% NP-40) on ice. The suspensions were
incubated for 1 h at 4°C, centrifuged at 21,500 × g for 30 min at
4°C, and the supernatants were stored at −80°C until use (10–13).
Two-dimensional gel electrophoresis
(2-DE)
Eighty micrograms of protein were used for each
2-DE. For the first dimension, isoelectric focusing (IEF) was
performed in an IPGphor 3 IEF unit (GE Healthcare, Buckinghamshire,
UK) on 11 cm, immobilized, pH 4.0–7.0 linear gradient strips
(Bio-Rad, Hercules, CA, USA) at 20°C and 50 μA/strip. Samples were
mixed with 200 μl of rehydration buffer (8 M urea, 2% CHAPS, 0.01%
bromophenol blue, 1.2% Destreak reagent and 0.5% IPG buffer; GE
Healthcare) and loaded onto the IPGphor strip holder. IEF was
performed using the following voltage program: rehydration 10 h (no
voltage), IEF stepwise increase from 0 to 500 V for 240 min,
500–1,000 V for 60 min, 1,000–8,000 V for 240 min, a linear
increase from 8,000 V for 20 min and a final phase of 500 V from
20,000 to 30,000 Vh. In the second dimension, SDS-PAGE was
performed on a precast polyacrylamide gel with a linear
concentration gradient of 5–20% (Bio-Rad), run at 200 V (14).
Flamingo staining
Agitation was carried out at all stages. After 2-DE,
the gels were subjected to a fixing solution with 40% ethanol and
10% acetic acid for 4 h. The gels were stained with Flamingo™
(Bio-Rad) overnight. Next, background stain was removed by wash
solution containing 0.1% Tween-20 for 10 min. Prior to imaging, the
gels were washed twice in ultra pure water for 10 min.
Image analysis and spot picking
The positions of protein spots on each 2-DE gel were
recorded by using a Pro Express 2D Proteomic Imaging System
(PerkinElmer, Waltham, MA, USA). Expression levels of the proteins
were quantified by analyzing the intensity of each spot with
Progenesis PG240 software (PerkinElmer). We selected the protein
spots whose expression level significantly increased or decreased
by >1.5-fold (P<0.05) compared with that of the SN12C parent
cell line in all experiments. In addition, these protein spots were
picked up and analyzed further for correlation with the metastatic
potential of SN12C clones as suggested from the results of 2-DE.
The intensity of each spot was statistically analyzed by the
Student’s t-test. We performed five runs of 2-DE for image
analysis.
Following statistical analysis, the gels were
re-stained with See Pico™ (Benebiosis Co., Ltd., Seoul, Korea) and
the selected spots were petal picked for mass spectrometry (MS)
analysis. The spots, whose expression was significantly different
between SN12C and SN12C-clone 2, SN12C-clone 4 or SN12-PM6, were
selected for picking (15).
In-gel digestion
The See Pico dye was removed from the gel piece by
rinsing two times in 60% methanol, 50 mM ammonium bicarbonate and 5
mM DTT for 10 min. The protein sample in the gel piece was reduced
twice in 50% ACN, 50 mM ammonium bicarbonate and 5 mM DTT for 10
min. The gel piece was dehydrated in 100% ACN twice for 30 min and
then rehydrated with an in-gel digestion reagent containing 10
μg/ml Sequencing Grade Modified Trypsin (Promega, Madison, WI, USA)
in 30% ACN, 50 mM ammonium bicarbonate and 5 mM DTT. This procedure
for the in-gel digestion was performed overnight at 30°C. The
samples were lyophilized overnight using a Labconco Lyph-lock 1L
Model 77400 (Labconco, Kansas, MO, USA). Lyophilized samples were
dissolved in 0.1% formic acid.
Liquid chromatography and mass
spectrometry (LC-MS)
Samples dissolved in 0.1% formic acid were
centrifuged at 21,500 × g for 5 min and the supernatant was stored
at −80°C until use. An Agilent 1100 LC/MSD Trap XCT (Agilent
Technologies, Palo Alto, CA, USA) was used for HPLC and MS/MS.
Protein identification and post-transmodification search were
performed in the Agilent Spectrum MILL MS Proteomics Workbench
against the Swiss-Prot protein database search engine (http://kr.expasy.org/sprot/). Using the Agilent
Spectrum MILL MS Proteomics Workbench, we performed the final
assessment for protein identification using the peptide sequencing
tag. The criteria for positive identification of proteins were set
as follows: filter results by valid, filter by protein score 10.0
and filter peptide by score >8, % scored peak intensity (%SPI)
>70. The Spectrum Mill workbench can search MS/MS spectra using
an MS/MS ion search (16,17).
Western blot analysis
Thirty and forty micrograms or forty micrograms of
protein were used for 1-D or 2-D (IEF followed by SDS-PAGE) western
blotting, respectively. After electrophoresis, proteins were
transferred electrophoretically onto PVDF membranes (Immobilon-P;
Millipore, Bedford, MA, USA) and blocked overnight at 4°C with
Dulbecco’s PBS (−) containing 5% skimmed milk and 0.2% Tween-20.
The primary antibody used was anti-GLO1 mouse polyclonal antibody
(dilution range 1:2,000; Abnova Corp., Taipei, Taiwan) and
anti-actin goat polyclonal antibody (1:200) (dilution range 1:200;
Santa Cruz Biotechnology, Inc., Santa Cruz, CA, USA). Membranes
were incubated with the primary antibody for 1.5 h at room
temperature, washed four times with Dulbecco’s PBS (−) containing
0.2% Tween-20 and then incubated with a horseradish
peroxidase-conjugated secondary antibody (dilution range 1:10,000;
Jackson; ICN Biomedicals, Aurora, OH, USA) for 1.5 h at room
temperature. Membranes were developed using a chemiluminescense
reagent (ECL Plus Western Blotting Detection Reagents; GE
Healthcare). The immunoreactive protein bands were then quantified
using Progenesis PG240 software (PerkinElmer). The differences in
expression between parental SN12C and SN12C-clone 2, SN12C-clone 4
or SN12-PM 6, as well as between OCUM-2M and OCUM-2D or OCUM-2MLN,
were analyzed statistically by the Student’s t-test.
Results
Differential expression of GLO1 in 2-DE
analysis
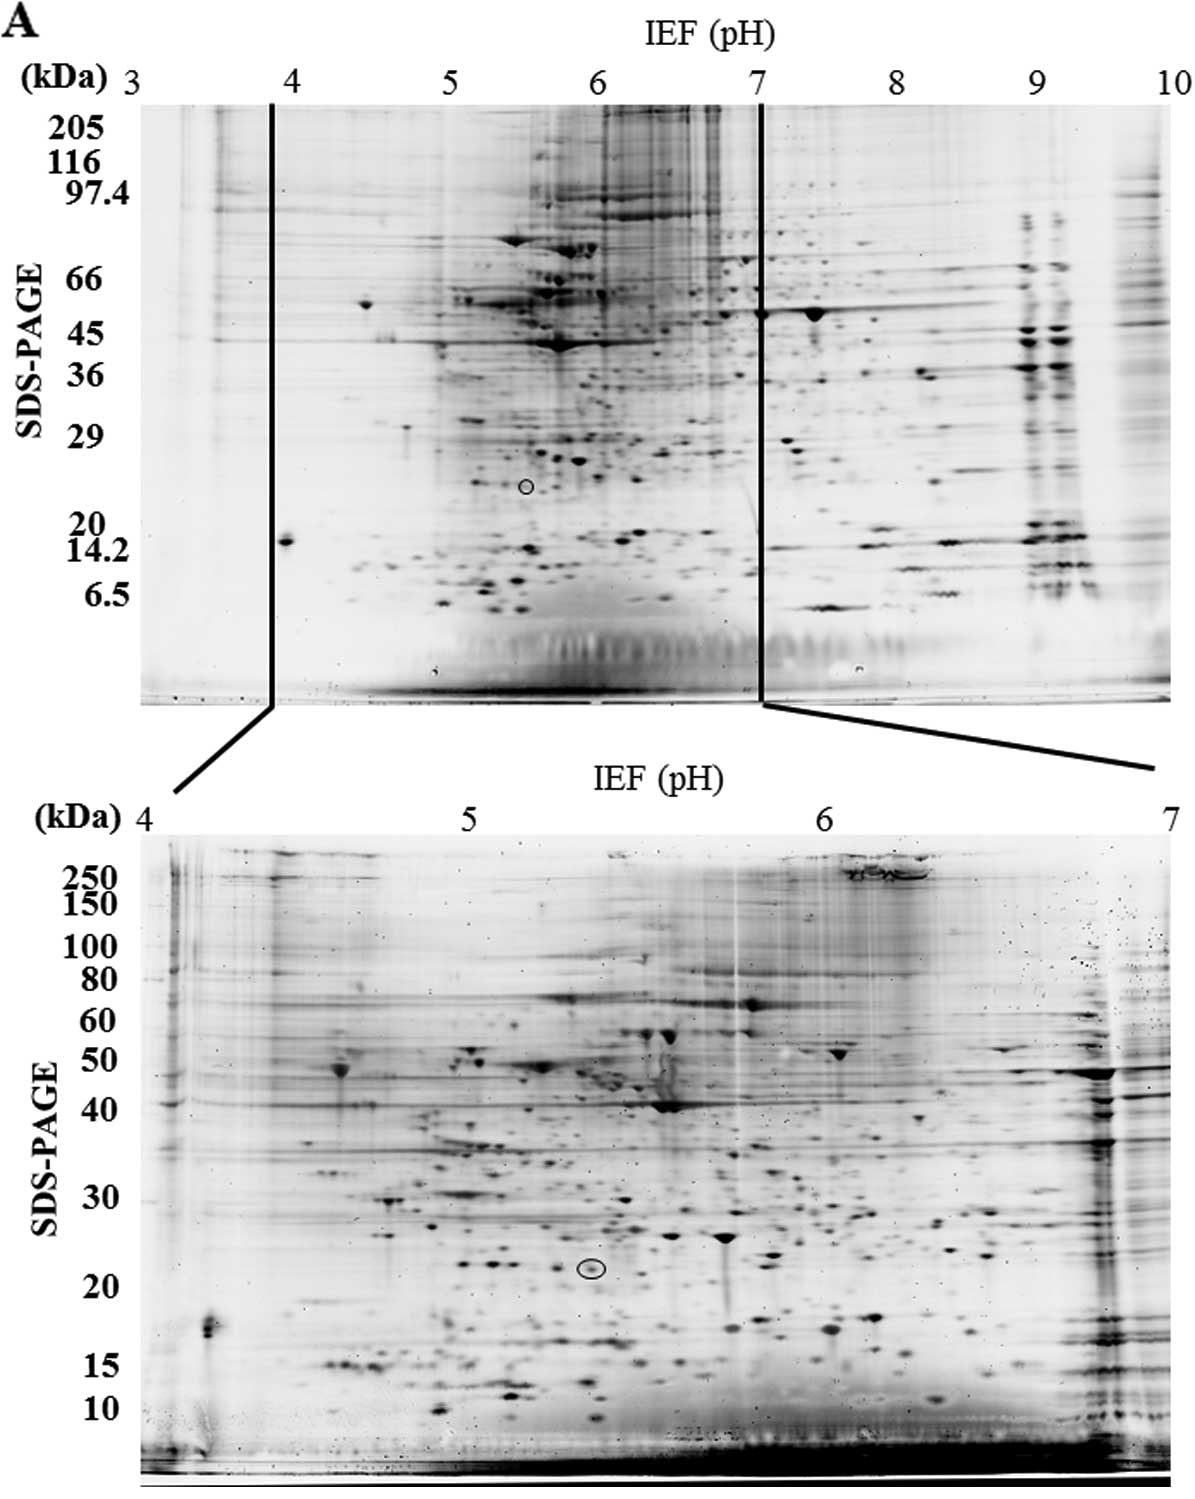
Protein expression in the SN12C cell clones was
assessed by 2-DE over a narrow pH range covering pH 4.0–7.0. This
pH range was selected as our previous 2-DE study using a wide pH
range covering pH 3.0–10.0 showed that most spots were concentrated
in the pH 4.0–7.0 range (Fig.
1A).
The 2-DE was performed five times under the same
conditions. From 200 to 350 spots were visualized on the 2-DE gels,
and differences in spot intensity between parental SN12C and
SN12C-clone 2, SN12C-clone 4 or SN12C-PM6 were analyzed with
Progenesis PG240 software for each gel. We identified proteins
whose expression was significantly different in agreement with the
metastatic potential of the clone. Since several studies used the
criteria of >1.5 fold-change, we used this criteria as well
(6,18,19).
The spot whose expression level increased or decreased by
>1.5-fold (P<0.05) are indicated by the circle (Fig. 1). We found only one protein spot
whose intensity was >1.5-fold different. The spot was consistent
with our previous study (6) and
significantly increased in high metastatic clones. However, this
spot could not be identified by using MS analysis in our previous
study. In the present study, the protein spot showed lower
expression in the low metastatic clone than parental SN12C and
higher expression in the high metastatic clones. The spot with
differential expression was picked, digested and used for MS
analysis. The results of LC-MS/MS for this spot are shown in
Table I.
 | Table IIdentification of the protein which
was differentially expressed between parental SN12C and other SN12C
cell clones. |
Table I
Identification of the protein which
was differentially expressed between parental SN12C and other SN12C
cell clones.
| Accession no. | Theoretical pI | Theoretical Mr | Protein name | Distinct
peptides | Sequence coverage
(%) | MS/MS search
score | Low metastatic
clone | High metastatic
clones |
|---|
|
|
|---|
| Clone 4 | Clone 2 | PM6 |
|---|
| Q04760 | 5.12 | 20777.8 | Glyoxalase 1 | 4 | 25% | 53.49 | − | + | + |
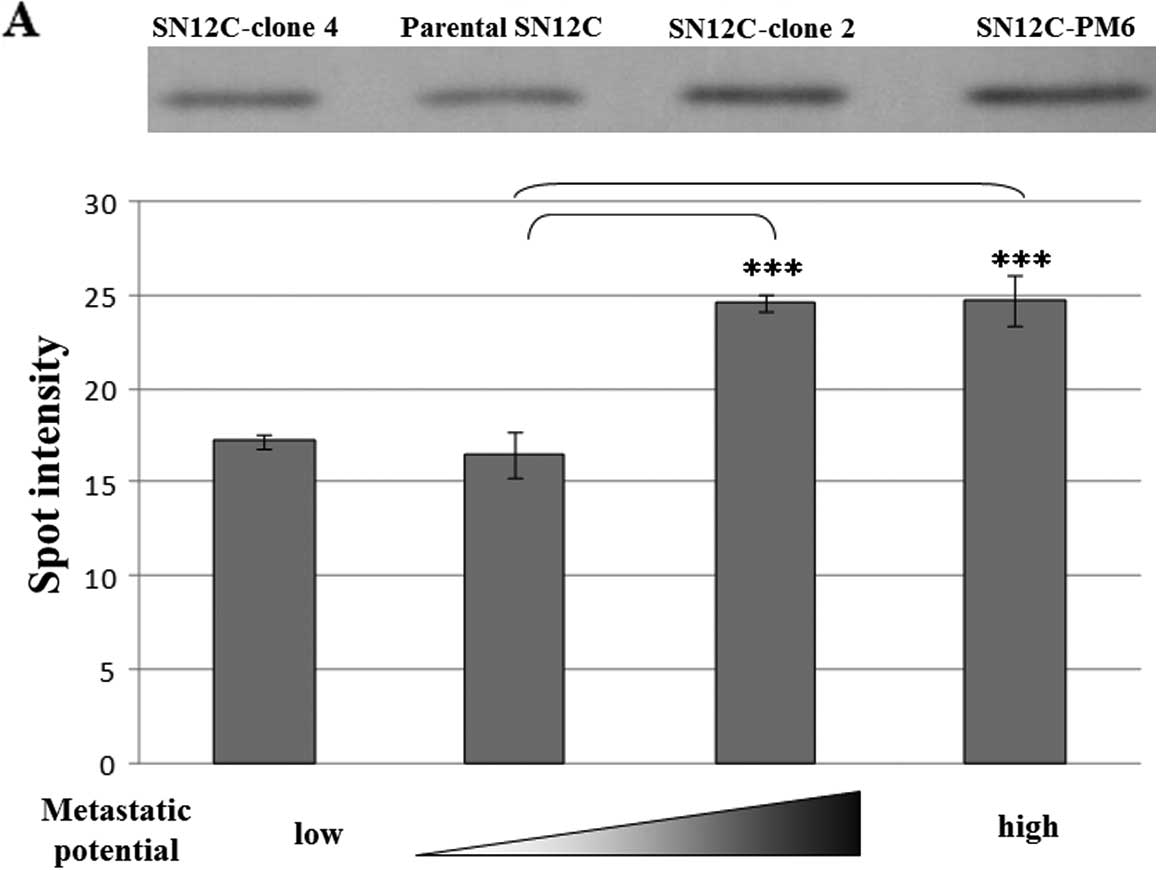
Increase of GLO1 by western blotting in
high metastatic potential SN12C clones
Western blot analysis of GLO1 was performed for all
four SN12C clones. The immunoreactive GLO1 band was increased in
the two high metastatic clones (Fig.
2A). In the 2-D immunoblotting for GLO1, four isoforms were
observed for the SN12C clones (Fig.
2B); only Spots 3 and 4 (Fig. 2B
and C) were identified as GLO1 from 2-DE analysis by using
LC-MS/MS. However, the nature of the modifications of these GLO1
variants is thus far unknown. The intensity of Spot 4 (Figs. 1B and 2C) was significantly different in the
SN12C clones compared with parental SN12C on 2-DE (Figs. 1B and 2C). Western blotting for Spot 4 in
SN12C-clone 2, SN12C-clone 4 and SN12C-PM6 was consistent with 2-DE
results.
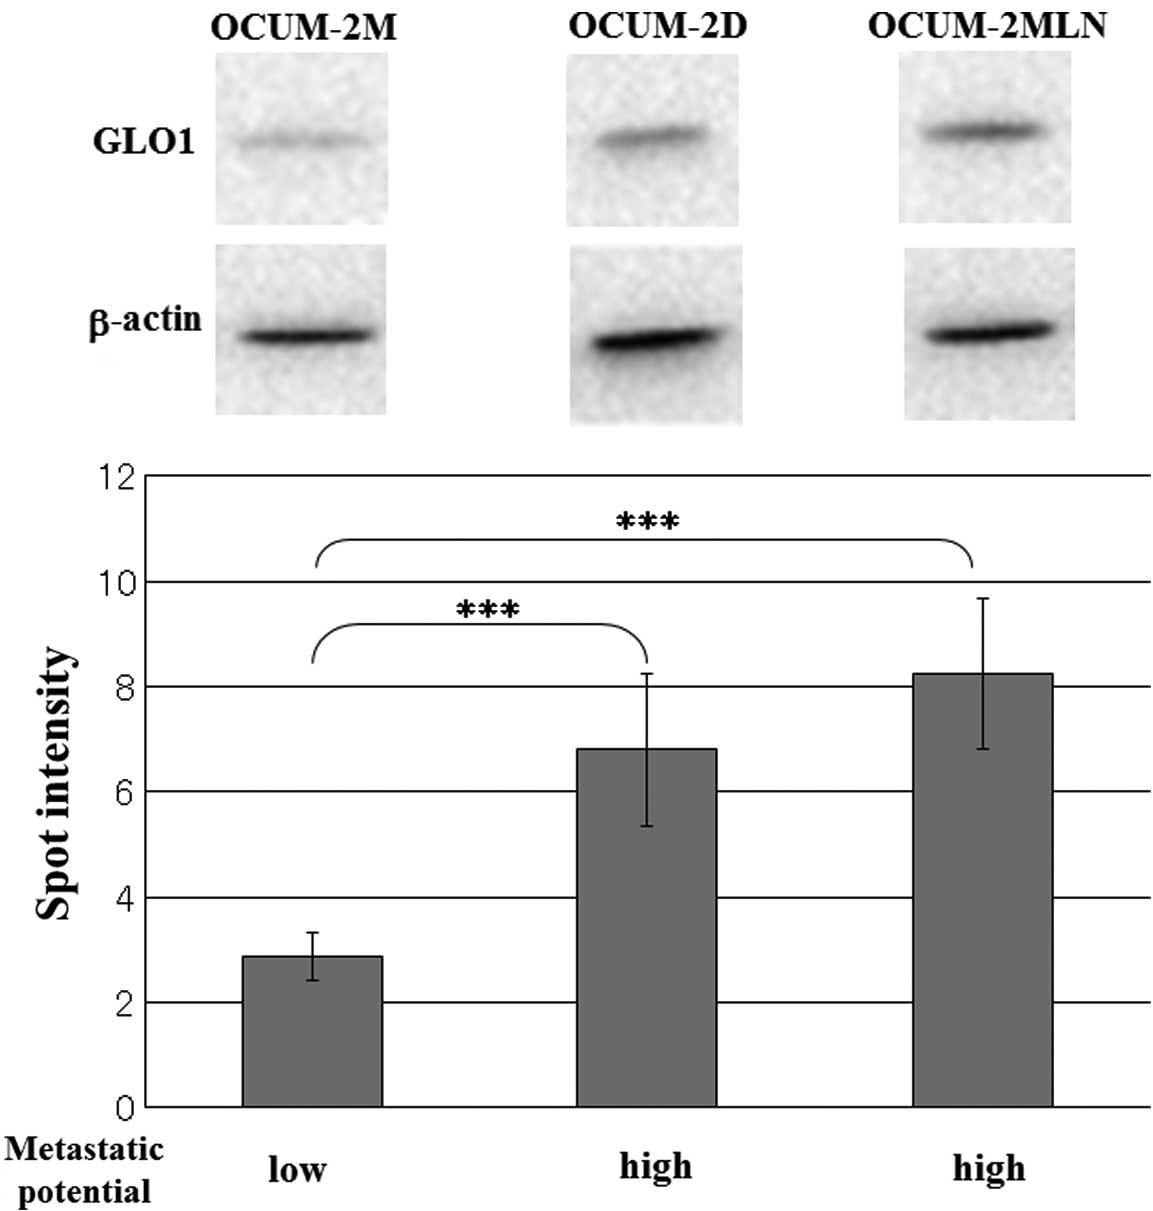
To confirm whether an increase of GLO1 was also
present in other cell lines observable of known differential
metastatic potential, we performed western blotting for GLO1 in the
scirrhous gastric cancer cell lines OCUM-2M, OCUM-2D and OCUM-2MLN.
The results are shown in Fig. 3.
The expression of GLO1 in the high metastatic scirrhous gastric
cancer cell lines was also increased.
Discussion
In the present study, we showed proteomic
differential display analysis of SN12C HRCC cell clones having
different metastatic potential by using 2-DE in the range of pH
4.0–7.0, since most protein spots in our previous study were
separated in the range of pH 4.0–7.0 on the gels by using 2-DE in
the range of pH 3.0–10.0 (6). Only
one protein spot level was found to be significantly different in
accordance with the metastatic potential of the cells. The protein
spot was identified as GLO1 by LC-MS/MS. Western blotting with a
specific antibody against GLO1 confirmed an increase in GLO1
expression in high metastatic cells compared with low metastatic
cells. By 2-D immunoblotting for GLO1, four isoforms were observed
in SN12C clones. Spot 4 in SN12C-clone 2, SN12C-clone 4 and
SN12C-PM6 were consistent with the significantly different spot
observed in the 2-DE results. Furthermore, western blotting for
GLO1 in scirrhous gastric cancer cell lines was performed. GLO1
expression was increased in the high metastatic OCUM cell line.
GLO1 is part of the glyoxalase system in the cytosol
of cells, a side-product of glycolysis. This system is one of the
most effective detoxification systems for reactive α-oxoaldehydes,
including methylglyoxal (MG) (20).
The major physiological substrate for GLO1 is MG. GLO1 plays an
important role in catalyzing the conversion of MG to
S-D-lactoylglutathione. In addition, GLO1 activity in situ
is proportional to the cellular concentration of glutathione
(20,21). Several reports suggested that
different isoforms of GLO1 exist (22–25)
and these isoforms are subjected to several post-translational
modifications, including a nitric-oxide (NO)-responsive form and
phosphorylation (23).
NO-responsive GLO1 appeared to be the most basic isoform of GLO1 on
2-DE gels (22,23). In the present study, the most basic
isoform of GLO1 was significantly altered in the SN12C clones.
However, the nature of these modifications present in the
additional GLO1 variants is thus far unknown. The GLO1 protein may
be modified post-translationally. Previous reports indicated that a
correlation between the expression level of GLO1 and the nature of
various tumors exists (26–29). Cheng et al(26) reported that high expression of GLO1
in gastric cancer enhances the metastatic ability of tumor cells
in vitro and in vivo. MG has long been regarded as a
natural anticancer agent and, therefore, GLO1 inhibitors have long
been considered possible anticancer agents (30,31).
For example, Santel et al(30) reported curucumin (a naturel phenol)
inhibits GLO1 and has a strong impact on highly proliferative and
invasive tumor cells such as 1321N, PC-3 and MDA-MB-231. Recently,
GLO1 was identified as a methyl-gerfelin (M-GFN)-binding protein.
M-GFN (a methyl benzoate) inhibited the enzymatic activity of GLO1
in vitro and in situ(32). Imoto (33) reported that invasion of cancer cells
was inhibited by the inhibitory activity of M-GFN. These results
suggest that the increased GLO1 expression provides advantages to
the metastatic potential in SN12C clones. In addition, inhibition
of GLO1 may have therapeutic potential for the treatment of
metastatic cancer.
The increase of GLO1 and the decrease of UCH-L1 are
significant at the protein level in high metastatic clones compared
with parental SN12C. Our findings strongly suggest that GLO1 and
UCH-L1 are associated with the metastatic potential of SN12C HRCC
cells. However, the type of relationship that exists between
increased GLO1 and decreased UCH-L1 remains to be clarified.
Collectively, in the present study, we performed
differential display analysis of proteins in an attempt to find
candidate proteins linked to the metastatic potential of SN12C
renal cell carcinoma clones by using 2-DE in the narrow range of pH
4.0–7.0. From 200 to 350 spots were visualized on the 2-DE gels,
but only one GLO1 spot was significantly increased in the high
metastatic clones and decreased in the low metastatic clone
compared with parental SN12C. The increase of GLO1 was confirmed in
high metastatic SN12C clones and additionally in metastatic
scirrhous gastric cancer cell lines. Further studies are required
to clarify the biological significance of GLO1 in the metastatic
potential of these cell lines. The type of post-translational
modification that occurred in the GLO1 isoforms and the difference
between these isoforms need to be examined. In addition, we need to
assess the correlation between GLO1 and other metastasis-related
factors, including UCH-L1.
Abbreviations:
|
HRCC
|
human renal cell carcinoma
|
|
2-DE
|
two-dimensional electrophoresis
|
|
MS
|
mass spectrometry
|
|
LC-MS/MS
|
liquid chromatography-tandem mass
spectrometry
|
|
UCH-L1
|
ubiquitin carboxyl-terminal hydrolase
isozyme L1
|
|
GLO1
|
glyoxalase 1
|
|
%SPI
|
% scored peak intensity
|
|
MG
|
methylglyoxal
|
|
NO
|
nitric-oxide
|
References
|
1
|
Geiger TR and Peeper DS: Metastasis
mechanisms. Biochim Biophys Acta. 1796:293–308. 2009.PubMed/NCBI
|
|
2
|
Fidler IJ: Models for spontaneous
metastasis. Cancer Res. 66:97872006. View Article : Google Scholar : PubMed/NCBI
|
|
3
|
Naito S, von Eschenbach AC, Giavazzi R and
Fidler IJ: Growth and metastasis of tumor cells isolated from a
human renal cell carcinoma implanted into different organs of nude
mice. Cancer Res. 46:4109–4115. 1986.PubMed/NCBI
|
|
4
|
Naito S, Walker SM, von Eschenbach AC and
Fidler IJ: Evidence for metastatic heterogeneity of human renal
cell carcinoma. Anticancer Res. 8:1163–1167. 1988.PubMed/NCBI
|
|
5
|
Naito S, Walker SM and Fidler IJ: In vivo
selection of human renal cell carcinoma cells with high metastatic
potential in nude mice. Clin Exp Metastasis. 7:381–389. 1989.
View Article : Google Scholar : PubMed/NCBI
|
|
6
|
Tanaka T, Kuramitsu Y, Fujimoto M, Naito
S, Oka M and Nakamura K: Downregulation of two isoforms of
ubiquitin carboxyl-terminal hydrolase isozyme L1 correlates with
high metastatic potentials of human SN12C renal cell carcinoma cell
clones. Electolophoresis. 29:2651–2659. 2008. View Article : Google Scholar : PubMed/NCBI
|
|
7
|
Fidler IJ and Kripke ML: Metastasis
results from preexisting variant cells within a malignant tumor.
Science. 197:893–895. 1977. View Article : Google Scholar : PubMed/NCBI
|
|
8
|
Yashiro M, Chung YS, Nishimura S, Inoue T
and Sowa M: Peritoneal metastatic model for human scirrhous gastric
carcinoma in nude mice. Clin Exp Metastasis. 14:43–54. 1996.
View Article : Google Scholar : PubMed/NCBI
|
|
9
|
Fujihara T, Sawada T, Hirakawa K, Chung
YS, Yashiro M, Inoue T and Sowa M: Establishment of lymph node
metastatic model for human gastric cancer in nude mice and analysis
of factors associated with metastasis. Clin Exp Metastasis.
16:389–398. 1998. View Article : Google Scholar : PubMed/NCBI
|
|
10
|
Fukagawa Y, Nishikawa J, Kuramitsu Y,
Iwakiri D, Takada K, Imai S, Satake M, et al: Epstein-Barr virus
upregulates phosphorylated heat shock protein 27 kDa in carcinoma
cells using the phosphoinositide 3-kinase/Akt pathway.
Electrophoresis. 29:3192–3200. 2008.PubMed/NCBI
|
|
11
|
Mori-Iwamoto S, Kuramitsu Y, Ryozawa S,
Taba K, Fujimoto M, Okita K, Nakamura K and Sakaida I: A proteomic
profiling of gemcitabine resistance in pancreatic cancer cell
lines. Mol Med Rep. 1:429–434. 2008.PubMed/NCBI
|
|
12
|
Mori-Iwamoto S, Kuramitsu Y, Ryozawa S,
Mikuria K, Fujimoto M, Maehara S, Maehara Y, et al: Proteomics
finding heat shock protein 27 as a biomarker for resistance of
pancreatic cancer cells to gemcitabine. Int J Oncol. 31:1345–1350.
2007.PubMed/NCBI
|
|
13
|
Hayashi E, Kuramitsu Y, Okada F, Fujimoto
M, Zhang X, Kobayashi M, Iizuka N, et al: Proteomic profiling for
cancer progression: differential display analysis for the
expression of intracellular proteins between regressive and
progressive cancer cell lines. Proteomics. 5:1024–1032. 2005.
View Article : Google Scholar
|
|
14
|
Kuramitsu Y, Miyamoto H, Tanaka T, Zhang
X, Fujimoto M, Ueda K, Tanaka T, et al: Proteomic differential
display analysis identified upregulated astrocytic phosphoprotein
PEA-15 in human malignant pleural methothelioma cell lines.
Proteomics. 9:5078–5089. 2009. View Article : Google Scholar
|
|
15
|
Tamesa M, Kuramitsu Y, Fujimoto M, Maeda
N, Nagashima Y, Tanaka T, Yamamoto S, et al: Detection of
autoantibodies against cyclophilin A and triosephosphate isomerase
in sera from breast cancer patients by proteomic analysis.
Electrophoresis. 30:2168–2181. 2009. View Article : Google Scholar : PubMed/NCBI
|
|
16
|
Takashima M, Kuramitsu Y, Yokoyama Y,
Iizuka N, Harada T, Fujimoto M, Sakaida I, et al: Proteomic
analysis of autoantibodies in patients with hepatocellular
carcinoma. Proteomics. 6:3894–3900. 2006. View Article : Google Scholar : PubMed/NCBI
|
|
17
|
Takashima M, Kuramitsu Y, Yokoyama Y,
Iizuka N, Fujimoto M, Nishisaka T, Okita K, Oka M and Nakamura K:
Overexpression of alpha enolase in hepatitis C virus-related
hepatocellular carcinoma: association with tumor progression as
determined by proteomic analysis. Proteomics. 5:1686–1692. 2005.
View Article : Google Scholar
|
|
18
|
Ding Q, Wu Z, Guo Y, Zhao C, Jia Y, Kong
F, Chen B, et al: Proteome analysis of up-regulated proteins in the
rat spinal cord induced by transection injury. Proteomics.
6:505–518. 2006. View Article : Google Scholar : PubMed/NCBI
|
|
19
|
Henschke P, Vorum H, Honoré B and Rice GE:
Protein profiling the effects of in vitro hyperoxic exposure on
fetal rabbit lung. Proteomics. 6:1957–1962. 2006. View Article : Google Scholar : PubMed/NCBI
|
|
20
|
Shinohara M, Thornalley PJ, Giardino I,
Beisswenger P, Thorpe SR, Onorato J and Brownlee M: Overexpression
of glyoxalase-I in bovine endothelial cells inhibits intracellular
advanced glycation endproduct formation and prevents
hyperglycemia-induced increases in macromolecular endocytosis. J
Clin Invest. 101:1142–1147. 1998. View Article : Google Scholar
|
|
21
|
Thornalley PJ: Glyoxalase I - structure,
function and a critical role in the enzymatic defence against
glycation. Biochem Soc Trans. 31:1343–1348. 2003. View Article : Google Scholar : PubMed/NCBI
|
|
22
|
Mitsumoto A, Kim KR, Oshima G, Kunimoto M,
Okawa K, Iwamatsu A and Nakagawa Y: Glyoxalase I is a novel nitric
oxide responsive protein. Biochem J. 3:837–844. 1999. View Article : Google Scholar : PubMed/NCBI
|
|
23
|
de Hemptinne V, Rondas D, Vandekerckhove J
and Vancompernolle K: Tumour necrosis factor induces
phosphorylation primarily of the nitric-oxide-responsive form of
glyoxalase I. Biochem J. 407:121–128. 2007.PubMed/NCBI
|
|
24
|
de Hemptinne V, Rondas D, Toepoel M and
Vancompernolle K: Phosphorylation on Thr-106 and NO-modification of
glyoxalase I suppress the TNF-induced transcriptional activity of
NF-kappaB. Mol Cell Biochem. 325:169–178. 2009.PubMed/NCBI
|
|
25
|
Van Herreweghe F, Mao J, Chaplen FW,
Grooten J, Gevaert K, Vandekerckhove J and Vancompernolle K: Tumor
necrosis factor-induced modulation of glyoxalase I activities
through phosphorylation by PKA results in cell death and is
accompanied by the formation of a specific methylglyoxal-derived
AGE. Proc Natl Acad Sci USA. 99:949–954. 2002.
|
|
26
|
Cheng WL, Tsai MM, Tsai CY, Huang YH, Chen
CY, Chi HC, et al: Glyoxalase-I is a novel prognosis factor
associated with gastric cancer progression. PLoS One. 7:e343522012.
View Article : Google Scholar : PubMed/NCBI
|
|
27
|
Wang Y, Kuramitsu Y, Ueno T, Suzuki N,
Yoshino S, Izuka N, Akada J, et al: Glyoxalase I (GLO1) is
up-regulated in pancreatic cancerous tissues compared with related
non-cancerous tissues. Anticancer Res. 32:3219–3222.
2012.PubMed/NCBI
|
|
28
|
Fonseca-Sánchez MA, Rodríguez Cuevas S,
Mendoza-Hernández G, Bautista-Piña V, Arechaga Ocampo E, Hidalgo
Miranda A, Quintanar Jurado V, et al: Breast cancer proteomics
reveals a positive correlation between glyoxalase 1 expression and
high tumor grade. Int J Oncol. 41:670–680. 2012.PubMed/NCBI
|
|
29
|
Jones MB, Krutzsch H, Shu H, Zhao Y,
Liotta LA, Kohn EC and Petricoin EF III: Proteomic analysis and
identification of new biomarkers and therapeutic targets for
invasive ovarian cancer. Proteomics. 2:76–84. 2002. View Article : Google Scholar : PubMed/NCBI
|
|
30
|
Santel T, Pflug G, Hemdan NY, Schäfer A,
Hollenbach M, Buchold M, Hintersdorf A, et al: Curcumin inhibits
glyoxalase 1: a possible link to its anti-inflammatory and
anti-tumor activity. PLoS One. 3:e35082008. View Article : Google Scholar : PubMed/NCBI
|
|
31
|
Tsuruo T, Naito M, Tomida A, Fujita N,
Mashima T, Sakamoto H and Haga N: Molecular targeting therapy of
cancer: drug resistance, apoptosis and survival signal. Cancer Sci.
94:15–21. 2003. View Article : Google Scholar : PubMed/NCBI
|
|
32
|
Kawatani M, Okumura H, Honda K, Kanoh N,
Muroi M, Dohmae N, Takami M, et al: The identification of an
osteoclastogenesis inhibitor through the inhibition of glyoxalase
I. Proc Natl Acad Sci USA. 105:11691–11696. 2008. View Article : Google Scholar : PubMed/NCBI
|
|
33
|
Imoto M: Isolation of novel GGPP
synthase-inhibitor Gerfelin and evaluation of its activity. Bunshi,
Chobunshi, Chokozotai Rikogaku Heisei 15 Nendo Kenkyu Seika
Hokokusho Gakujutsu Furonthia. 597–656. 2004.(In Japanese).
|