Introduction
Ovarian cancer is the most fatal cancer of the
female reproductive system and a cause of high mortality rates
worldwide every year. Due to few early symptoms, most patients are
diagnosed with advanced stage, and the 5-year survival rates are
<40%. Although the standard taxane/platinum regiment results in
a complete response rate of 40–60% in advanced ovarian cancer
patients, relapse occurs in >70% of the patients (1,2). Tumor
metastasis and invasion play important roles in cancer development,
while there is no effective means to determine the degree of
metastasis and invasion. Heparanase (HPSE) is encoded by
HPSE which located on chromosome 4 (4q21.3) and is the only
endonuclease which can degrade the heparan sulfate proteoglycans
(HSPGs) in vivo, remodel extracellular matrix (ECM) via
depolymerizing HS chains which are covalently attached to the
HPSGs. HPSE may regulate angiogenesis, tissue repair and lipid
metabolism by releasing HS bound growth factors and enzymes such as
basic fibroblast growth factor (bFGF) (3).
It has been proved that HPSE is overexpressed in
several types of malignant cancer such as liver cancer, pancreas
cancer, endometrial carcinoma and ovarian cancer, and is associated
with tumor invasion and metastasis (4–6).
Experiments in vitro also revealed that HPSE plays important
roles in tumor metastasis, and it may be a potential biomarker for
the determination of metastasis status (7,8). In
this study, the relationship between the clinicopathological
factors and the expression of HPSE in ovarian cancer and the
amounts of HPSE in serum were analyzed. Overexpression and gene
silencing of HPSE in epithelial ovarian cancer cells were performed
to study its effects on the biological behavior of tumor cells.
This study illustrated the biological functions of HPSE in tumor
metastasis, and provided useful information for the diagnosis of
tumor metastasis and clinical treatment of ovarian cancer.
Materials and methods
Sample
All blood samples were collected either from
patients who were diagnosed with malignant/benign ovarian tumors,
or from healthy females undergoing routine physical examinations at
the Department of Gynecologic Oncology, Affiliated Tumor Hospital
of Guangxi Medical University. The malignant group consisted of 177
cases of ovarian cancer, including 109 cases of serous
cystadenocarcinoma, 54 of mucinous cystadenocarcinoma, and 14 of
undifferentiated carcinoma according to the criteria of the World
Health Organization (WHO, 1973). Among them, 81 cases were stages
I–II and 96 cases were stages III–IV in accordance with FIGO
standards (2004). The age of patients was 26–67 years (average,
44.6 years), and all patients were followed up for 2.4–62.16 months
(mean, 41.10 months). The benign group consisted of 101 cases,
including 59 of serous cystadenoma, 42 of ovarian teratoma, and the
patients for these samples were aged 14–64 years (average, 35.6
years). The control group consisted of 49 healthy female aged 25–53
years (average, 43.4 years). All blood samples were obtained prior
to any treatments, and 2 ml of blood was centrifuged at 3,000 rpm
for 5 min, and the supernatants were kept at −80°C.
All ovarian samples were collected from patients
after surgery in the Department of Gynecologic Oncology, Affiliated
Tumor Hospital of Guangxi Medical University and were diagnosed by
pathologists. Of the 57 cases of malignant ovarian tumors, 30 were
serous cystadenocarcinoma, 12 were mucinous cystadenocarcinoma, and
15 were low differentiated adenocarcinomas according to the WHO
criteria; 26 cases were stages I–II and 31 were stages III–IV in
accordance with FIGO standards. All patients for those 57 samples
ranged in age from 28 to 73 years (average, 47.4 years). There were
23 cases of benign ovarian tumors, including 10 of serous
cystadenoma, 7 of mucinous cystadenoma and 6 of ovarian teratoma,
and the patients were aged 18–73 years (average, 43.4 years). There
were 22 cases of normal ovarian tissues excised when the patients
underwent the myomectomy or total hysterectomy, following receipt
of informed consent and were confirmed to be normal by a
pathologist; the patients were aged 48–67 years (average, 58.7
years). The ovarian sample for cDNA cloning of HPSE was a mucinous
adenocarcinoma diagnosed by pathologists. The study was endorsed by
the Ethics Committee of the Guangxi Medical University. All
patients received an explanation concerning the aims of the study
and provided signed informed consent. All samples were collected
from primary lesions during surgery, and stored in a liquid
nitrogen tank. The stored samples were then ready for mRNA
isolation and histopathological examination.
Vectors and cells
pcDNA3.1 expression vector (Invitrogen), pEGFP-N1
vector (Clontech) and E Coli DH-5α were laboratory kept
vectors. Ovarian cancer cells including A2780, SKOV3 and HO-8910
were purchased from Shanghai Institute of Cellular Biology of
Chinese Academy of Sciences. Cells including HO-8910pm,
CBP-resistant SKOV3 and DDP-resistant SKOV3 were established in our
laboratory.
Primers
Primers were designed according to the nucleotide
sequence of HPSE mRNA which had been deposited in the GenBank
database (NM_006665). The gene specific primers were: primers for
measurement of HPSE expression in ovarian cancer: forward,
5′-TCCGAGAACACTACCAG-3′ and reverse, 5′-GCATCTTAGCCGTCTTTC-3′.
β-actin was used as the control gene: forward,
5′-CTCCATCCTGGCCTCGCTGT-3′ and reverse, 5′-GCTGTCACCTTCACCGTTCC-3′.
Primers for cDNA cloning of HPSE: forward,
5′-CCGCTCGAGATGCTGTGCGCTCGAAG-3′ and reverse,
5′-CCGGAATTCATTTTCAGATGCAAGCAG-3′.
Six siRNAs for HPSE silencing approach were: 1)
pGPU6/GFP/Neo-heparanase-548: GGAGAAGTTACGGTTGGAATG; 2)
pGPU6/GFP/Neo-heparanase-640: GCTCTGTAGATGTGCTATACA; 3)
pGPU6/GFP/Neo-heparanase-1222: GCTTTATGTGGCTGGATAAAT; 4)
pGPU6/GFP/Neo-heparanase-1556: GCAAGTGGATAAATACCTTCT; 5) positive
control (pGPU6/GFP/Neo-shGAPDH): GTATGACAACAGCCTCAAG; 6) Negative
control (pGPU6/GFP/Neo-shNC): GTTCTCCGAACGTGTCACGT.
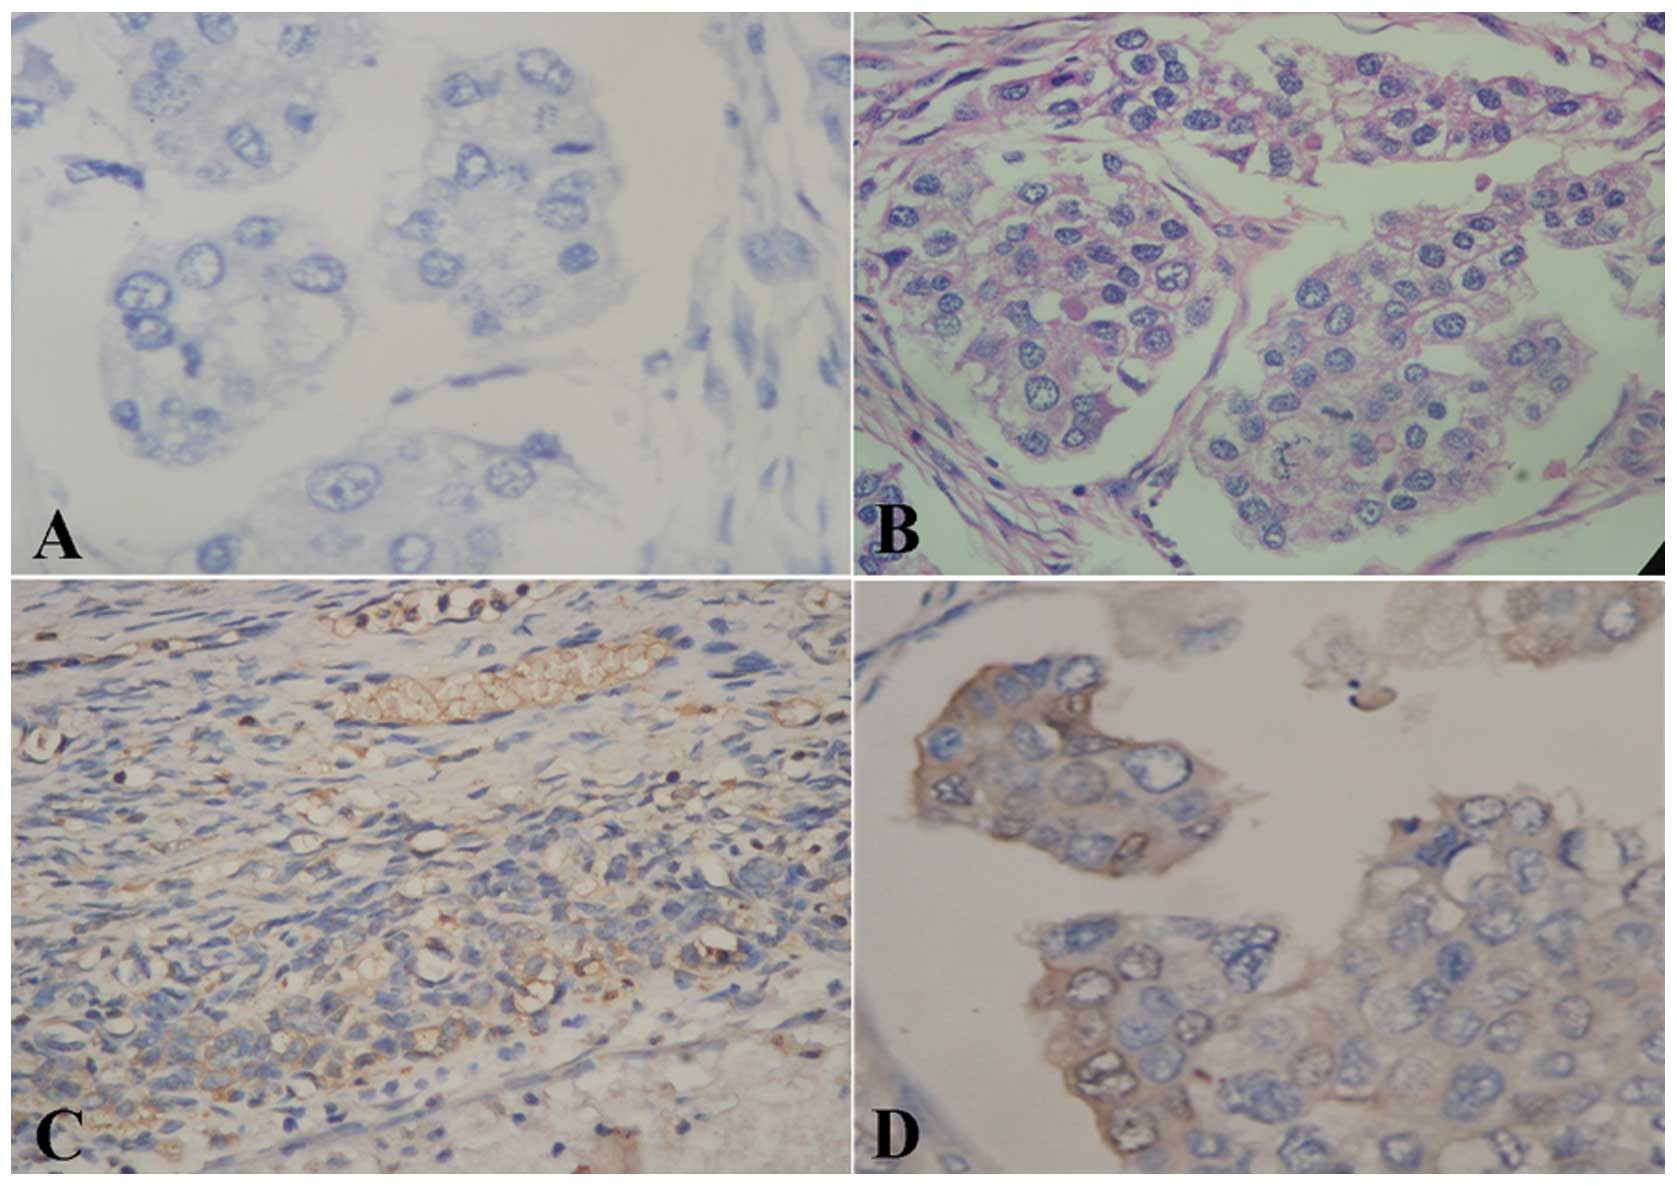
Measurement of HPSE expression
Protein expression of HPSE was measured by
streptavidin-biotin complex assay (SABC). The SABC kit was
purchased from Wuhan Boster Bio-Engineering Inc., (Wuhan, China).
Anti-HPSE polyclonal antibody was purchased from Santa Cruz Inc.
The images were reviewed in a blinded manner by two experienced
pathologists. The determination of staining intensity was as
follows: the cytoplasm of ovarian cancer cells exhibiting brown
granular staining (Fig. 1D) was
considered positive staining and samples showing the absence of
staining (Fig. 1A–C) were
considered negative. The intensity of protein expression was
related identically to the rate of positive cells. The cells with
cytoplasmic or membranous staining showing dark brown granules were
determined to exhibit strong positivity (score 3). Cells stained
light brown indicated weakly positive (score 1) staining, and cells
with no brown granules were scored 0. Intensity between strong
positivity and weak positivity was considered as medium positive
(score 2) intensity. The positive staining of cells was determined
by the number of positive cells vs. the number of total cells at
high magnification. A percentage of <5% cells was scored as 0;
6–25%, 1; 26–50%, 2; 51–75%, 3 and >75%, 4. The product of the
staining intensity and the positive rate of cells in each field was
determined to be the immunity score, and average score of 5 visions
in each section was the final immunity score. A final immunity
score ranging from 0–2 was determined as negative and a score ≥2
was determined as positive.
The concentration of HPSE in serum was measured
using enzyme-linked immunosorbent assay (ELISA) in accordance with
the manufacturer's instructions.
RT-PCR
The transcript expression of HPSE was measured by
RT-PCR. Total RNA was isolated using TRIzol Reagents (Gibco, USA)
and first strand cDNA was synthesized using M-MuLV system
(MBI-Fermentas) from 2 μg RNA. Primers were designed according to
the nucleotide sequence that had been deposited in the GenBank
database. Polymerase chain reaction amplification was performed
with the following protocol: initial denaturation at 94°C for 5
min, followed by a variable number of 35 cycles, 94°C for 30 sec,
specific annealing temperature for 30 sec, elongation at 72°C for
45 sec, and then a final elongation at 72°C for 5 min. PCR products
were visualized on 2% agarose gels containing ethidium bromide and
photographed using imaging system. PCR products of HPSE were
purified and sequenced.
Establishment of stable HPSE up- and
downregulated ovarian cell lines
The stable HPSE upregulated cell line was
established as follows: cDNA of HPSE cloned from tissue of
epithelial ovarian cancer by PCR was sub-cloned into BglII
sites of pGEM-T Easy Vector (Promega) for sequencing. Then the
XholI and EcoRI fragments were inserted into
XholI and EcoRI-digested pcDNA3.1 vector to generate
HPSE recombinant expression system, and the insert was confirmed by
sequencing. The pcDNA3.1-HPSE was transfected into A2780 cells
using Lipofectamine 2000 (Invitrogen, USA). Individual clones were
screened for G418-based induction. RT-PCR and western blotting were
performed to measure the HPSE expression.
The stable HPSE silencing cell line was established
as follows: transfection was performed at ~80% confluency in
six-well plates (Corning, NY, USA) using Lipofectamine 2000
(Invitrogen) according to the manufacturer's instructions. Four
purified pGPU6/GFP/Neo-shRNA expression vectors which contained the
HPSE shRNA insert and two control vectors were transfected into
SKOV3 cells with 10 μl of Lipofectamine 2000 reagent. After 48 h of
transfection, RT-PCR and western blotting were performed to assess
the efficiency of HPSE knockdown.
Methods to determine the cell biological
behaviors
Cell growth inhibition was determined by MTT assay,
with 3 replications (4); cell
proliferation rate was determined using the colony forming assay as
previously reported (5); cell cycle
was detected by flow cytometry, and the proportion of cells in the
G1, G2 and S phases of cell cycle was analyzed using multicycle
software. Cell invasion in vitro was measured by Matrigel
invasion, and the kit was purchased from Biological Centre of
Peking University (Beijing, China); cell migration in vitro
was measured by Transwell migration, and the kit was purchased from
Corning Costar (Cambridge, MA, USA); cell adhesion in vitro
was measured by Adhesion assay, and the kit was purchased from
Biological Centre of Peking University. All steps were carried out
in accordance with the manufacturer's instructions.
Statistical analysis
The data were analyzed by SPSS13.0 software. The
results of ELISA are presented as the means ± SD. The measurement
data were analyzed using one-way ANOVA, complemented with
Kruskal-Wallis tests. The statistical data were analyzed with the
Chi-square tests; comparison within groups was analyzed using
t-test. p<0.05 was considered to indicate a statistically
significant difference. The prognosis was analyzed using the Cox
model.
Results
Serum concentration of HPSE and its
relationship with clinicopathological factors in ovarian
cancer
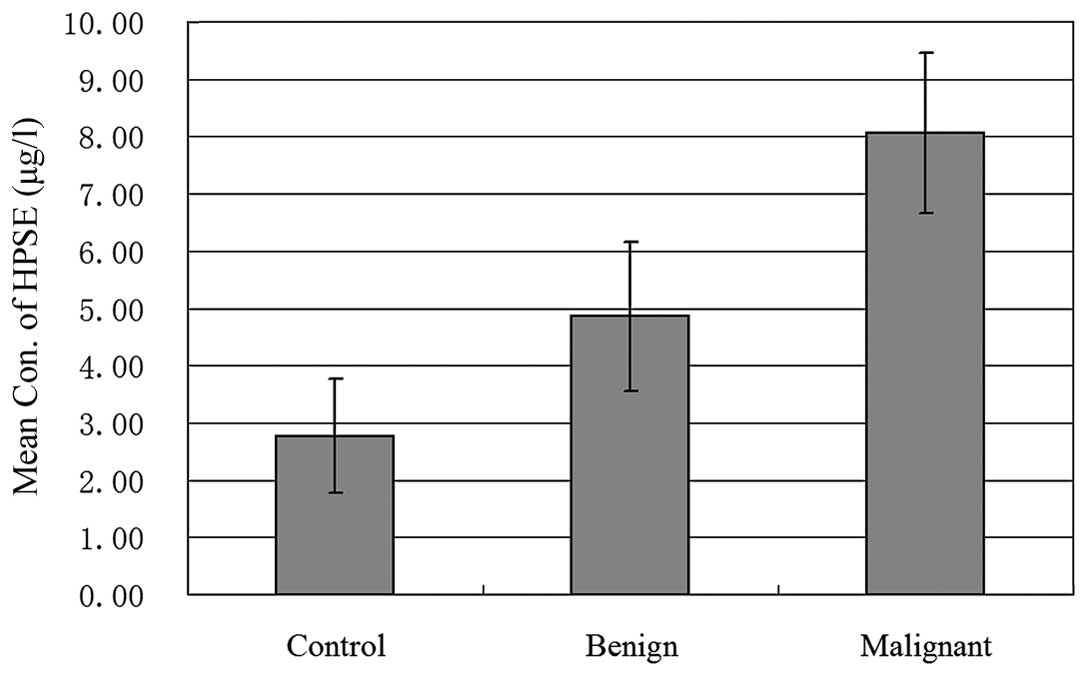
As shown in Fig. 2,
the concentration of HPSE in serum of patients with malignant
ovarian tumors was visibly higher than that in the serum of
patients with benign ovarian tumors and controls (p=0.0), but no
statistical difference between the benign group and controls was
observed. Further study revealed that the amount of HPSE in ovarian
cancer patients with distant metastasis was notably higher than the
amount in patients with no distant metastasis (p=0.042), but no
relationship between serum concentration of HPSE and lymphatic,
pelvic and peritoneal metastasis was observed (as shown in Table I). Moreover, the concentration of
HPSE in serum of patients with serous, mucinous and
undifferentiated cancer showed no statistical difference,
suggesting there was no direct relationship between serum
concentration of HPSE and histological type, although the serum
concentration of HPSE in patients with poorly differentiated and
stages III–IV cancer were significantly higher than the
concentrations in well differentiated and stages I–II cancer
(p=0.035 and 0.000, respectively).
 | Table IThe relationship between serum
concentration of HPSE and clinicopathological factors. |
Table I
The relationship between serum
concentration of HPSE and clinicopathological factors.
| Clinicopathological
factors | No. of samples | Serum concentration
of HPSE (μg/l) (mean ± STDEV) |
|---|
| Pathological
type |
| Epithelial
cancer | 177 | 8.05±2.05 |
| Serous cancer | 109 | 8.10±2.02 |
| Mucinous cancer | 54 | 7.97±2.14 |
| Undifferentiated
adenocarcinomas | 14 | 8.06±2.17 |
| Differentiation
grade |
| High-medium
differentiated cancer | 29 | 7.20±2.51 |
| Low differentiated
cancer | 148 | 8.22±1.92 |
| FIGO stage |
| Stages I–II
cancer | 62 | 7.21±2.05 |
| Stages III–IV
cancer | 115 | 8.51±1.92 |
| Metastasis |
| Intra-abdominal
lymph node metastasis (+) | 85 | 8.11±2.09 |
| Intra-abdominal
lymph node metastasis (−) | 92 | 8.00±2.04 |
| Pelvic metastasis
(+)a | 125 | 8.11±2.09 |
| Pelvic metastasis
(−) | 52 | 8.00±2.04 |
| Peritoneal
metastasis (+)b | 115 | 8.20±2.19 |
| Peritoneal
metastasis (−) | 62 | 7.29±1.761 |
| Distant metastasis
(+)c | 32 | 8.63±1.69 |
| Distant metastasis
(−) | 145 | 7.93±2.11 |
In addition, the diagnostic value of serum HPSE
concentration prior to surgery was also evaluated. As shown in
Table II, when the serum CA125
concentration was 35 U/ml, the sensitivity for prognosis was 75.7%,
the specificity for prognosis was 69.5%, the area under the ROC
curve was 0.776, the standard deviation was 0.030, and the 95%
confidence interval was 0.717, 0.836 (p=0.000); in comparison, when
the serum HPSE concentration was 4.60 ng/ml, the sensitivity was
76.3%, the specificity was 55.9%, the area under the ROC curve was
0.685, the standard deviation was 0.031, and the 95% confidence
interval was 0.700, 0.823 (p=0.000). These results revealed that
all the parameters for diagnosis with HPSE concentration were
similar or close to the parameters for diagnosis with CA125
concentration, indicating that HPSE may be a potential biomarker
for ovarian cancer diagnosis.
| Table IIComparison of diagnosis value of HPSE
and CA125 in serum concentration. |
Table II
Comparison of diagnosis value of HPSE
and CA125 in serum concentration.
| Area under ROC
curve | Sensitivity % | Specificity % | Missed diagnosis rate
% | Misdiagnosis rate
% | Positive likelihood
ratio | Negative likelihood
ratio |
|---|
| HPSE | 0.685 | 69.6 (80/115) | 67.7 (42/62) | 30.4 (35/115) | 32.3 (20/62) | 2.1 | 0.5 |
| CA125 | 0.776 | 75.7 | 69.5 | 24.3 | 30.5 | 2.5 | 0.3 |
Positive expression of HPSE in ovarian
cancer and its relationship with clinicopathological factors
As shown in Table
III, the positive expression rates of HPSE at both the mRNA and
protein levels in malignant ovarian tumors were significantly
higher than the rates in benign tumors and controls (p=0.013 and
0.007, respectively), while no statistically significant difference
was observed between the rates in benign tumors and controls. As
shown in Table IV, further study
showed that the positive expression rate of HPSE in malignant
ovarian cancer had no direct correlations with histological type,
but was closely related to differentiation grade and stages.
Compared to the rates in well differentiated and stages III–IV
cancer, the positive expression rates of HPSE at both the mRNA and
protein levels were clearly upregulated in low differentiated and
stages I–II cancer (p=0.025 and 0.014; 0.013 and 0.001,
respectively), and the rate in ovarian cancer patients with distant
metastasis was notably higher than that in patients with no distant
metastasis (p=0.027 and 0.003), although no relationship between
the rates and lymphatic, pelvic and peritoneal metastasis was
observed.
| Table IIIThe expression of HPSE at both the
mRNA and protein levels in ovarian tumors and controls. |
Table III
The expression of HPSE at both the
mRNA and protein levels in ovarian tumors and controls.
| Sample group | No. of samples | mRNA expression of
HPSE (mean ± STDEV) | Protein expression
rate of HPSE (%) |
|---|
| Controls | 22 | 0.06±0.120 | 18.2 |
| Benign ovarian
tumors | 23 | 0.077±0.146 | 30.4 |
| Malignant ovarian
tumors | 57 | 0.176±0.121 | 73.7 |
| Table IVThe positive expression of HPSE in
ovarian cancer and its relationship to clinicopathological
factors. |
Table IV
The positive expression of HPSE in
ovarian cancer and its relationship to clinicopathological
factors.
| Clinicopathological
factors | No. of samples | Serum concentration
of HPSE (μg/l) (mean ± STDEV) | Protein expression
rate of HPSE (%) |
|---|
| Pathological
type |
| Serous cancer | 30 | 0.166±0.172 | 73.3 |
| Mucinous
cancer | 12 | 0.146±0.184 | 75.0 |
| Undifferentiated
adenocarcinomas | 15 | 0.176±0.127 | 73.3 |
| Differentiation
grade |
| High-medium
differentiated cancer | 15 | 0.105±0.107 | 46.7 |
| Low differentiated
cancer | 42 | 0.287±0.164 | 83.3 |
| FIGO stages |
| Stages I–II
cancer | 26 | 0.031±0.073 | 53.8 |
| Stages III–IV
cancer | 31 | 0.238±0.176 | 90.3 |
| Metastasis |
| Intra-abdominal
lymph node metastasis (+) | 23 | 0.223±0.186 | 86.9 |
| Intra-abdominal
lymph node metastasis (−) | 34 | 0.123±0.165 | 64.7 |
| Pelvic metastasis
(+)a | 46 | 0.166±0.187 | 73.9 |
| Pelvic metastasis
(−) | 11 | 0.148±0.169 | 72.7 |
| Peritoneal
metastasis (+)b | 31 | 0.201±0.180 | 83.9 |
| Peritoneal
metastasis (−) | 26 | 0.116±0.167 | 61.5 |
| Distant metastasis
(+)c | 12 | 0.174±0.193 | 91.7 |
| Distant metastasis
(−) | 45 | 0.101±0.173 | 68.8 |
The positive expression of HPSE was also closely
associated with prognosis in ovarian cancer. Among all the factors
involved in prognosis such as age, histological type,
differentiation grade, FIGO stage, lymphatic metastasis, peritoneal
metastasis, distant metastasis, peritoneal fluid and tumor
residues, we found that tumor residue, lymphatic metastasis,
distant metastasis, mRNA expression of HPSE and the positive
protein expression rate of HPSE were closely associated with
prognosis in ovarian cancer according to COX model analysis (as
shown in Table V) (p=0.039, 0.031,
0.031, 0.028 and 0.01, respectively).
| Table VCOX model analysis of prognosis
related factors in ovarian cancer. |
Table V
COX model analysis of prognosis
related factors in ovarian cancer.
| Clinicopathological
factors | B | SE | Wald | df | Sig | Exp (B) | 95.0% CI for Exp
(B) |
|---|
|
|---|
| Lower | Upper |
|---|
| Histological
type | 1.344 | 0.744 | 3.270 | 1 | 0.071 | 3.836 | 0.893 | 16.474 |
| Histological
grade | 0.855 | 0.560 | 2.238 | 1 | 0.127 | 2.352 | 0.784 | 7.053 |
| FIGO stage | 0.702 | 0.574 | 1.495 | 1 | 0.221 | 2.018 | 0.655 | 6.217 |
| HPSE mRNA
expression | −4.572 | 2.077 | 4.848 | 1 | 0.028 | 0.010 | 0.000 | 0.065 |
| Protein positive
expression rate of HPSE | 2.318 | 0.906 | 6.552 | 1 | 0.010 | 10.032 | 1.721 | 59.946 |
| Pelvis
metastasis | 0.139 | 0.546 | 0.065 | 1 | 0.799 | 1.149 | 0.394 | 3.351 |
| Peritoneal
metastasis | 0.461 | 0.544 | 0.717 | 1 | 0.397 | 1.585 | 0.546 | 4.603 |
| Distant
metastasis | 0.983 | 0.533 | 3.201 | 1 | 0.039 | 0.449 | 0.521 | 0.901 |
| Lymph node
metastasis | 0.361 | 0.547 | 0.617 | 1 | 0.031 | 0.581 | 0.571 | 6.603 |
| Residue | −1.083 | 0.526 | 4.241 | 1 | 0.039 | 0.339 | 0.121 | 0.949 |
| Age | 0.032 | 0.021 | 2.392 | 1 | 0.122 | 1.032 | 0.991 | 1.075 |
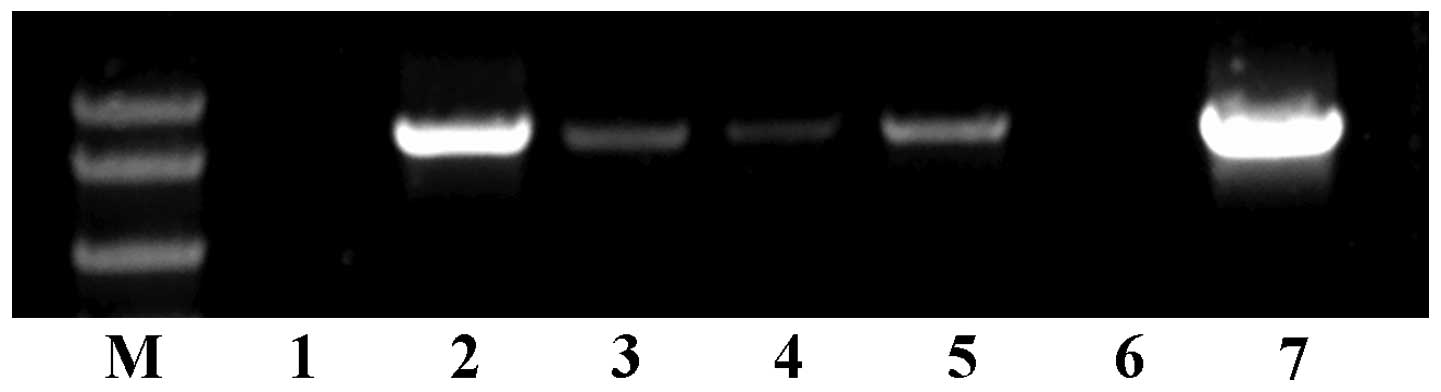
Expression of HPSE in ovarian cancer
cells and its effects on cell biological behaviors cDNA cloning of
HPSE and its expression in different ovarian cancer cells
cDNA of HPSE was cloned from tissue of epithelial
ovarian cancer by PCR, and the length was ~1,600 bp in accordance
with standard DNA marker, consistent with the theoretical length of
HPSE. The cDNA was sub-cloned into pcDNA3.1 vector and sequenced to
be 100% identical to the sequence of HPSE already deposited in
GenBank. The expression of HPSE in ovarian cancer cells varied
fairly. As shown in Fig. 3, RT-PCR
results indicated that HPSE was expressed in HO-8910pm,
HO-8910-178-1 and CBP-resistant SKOV3 ovarian cancer cells, and was
highly expressed in HO-8910 and normal SKOV3 cells, while no
expression was detected in A2780 and DDP-resistant SKOV3 cells.
Based on these results, the A2780 cells with no HPSE expression,
and SKOV3 cells with strong HPSE expression were selected for
subsequent studies.
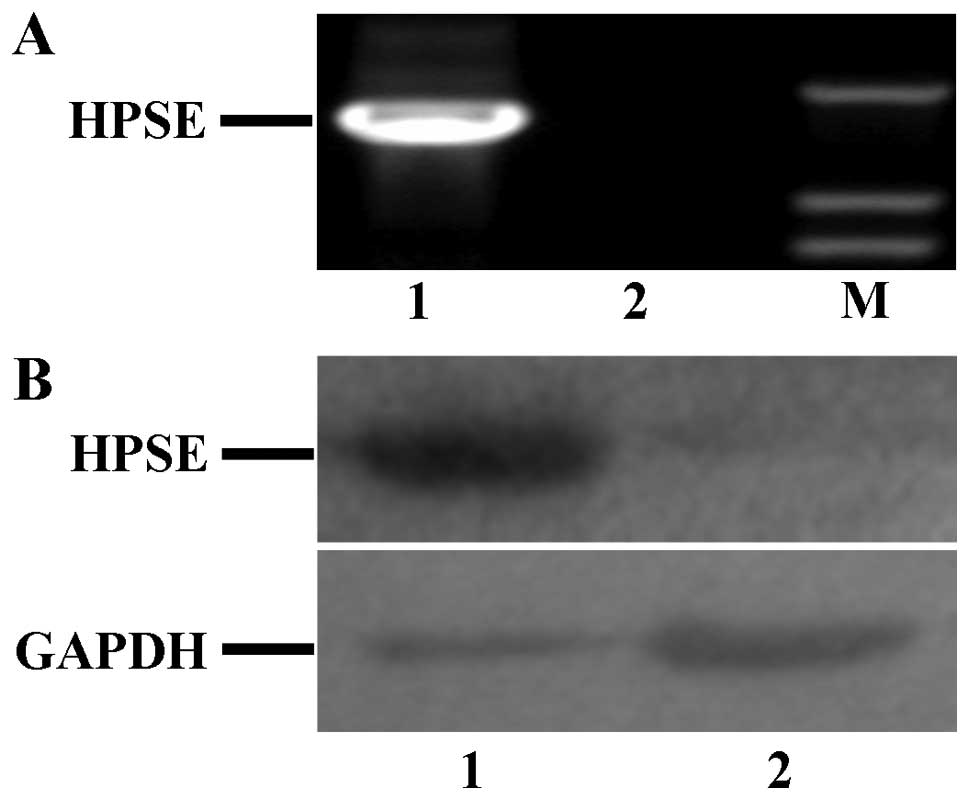
Establishment of stable HPSE up- and
downregulated ovarian cell lines
As shown in Fig. 4,
compared to the expression in A2780 cells transfected with pcDNA3.1
empty vector, HPSE expression at both the mRNA and protein level
was only detected in A2780 cells transfected with pcDNA3.1-HPSE
vector. Thus, the A2780 cells transfected with pcDNA3.1-HPSE vector
was used to study the influence on biological behaviors of tumor
cells caused by HPSE.
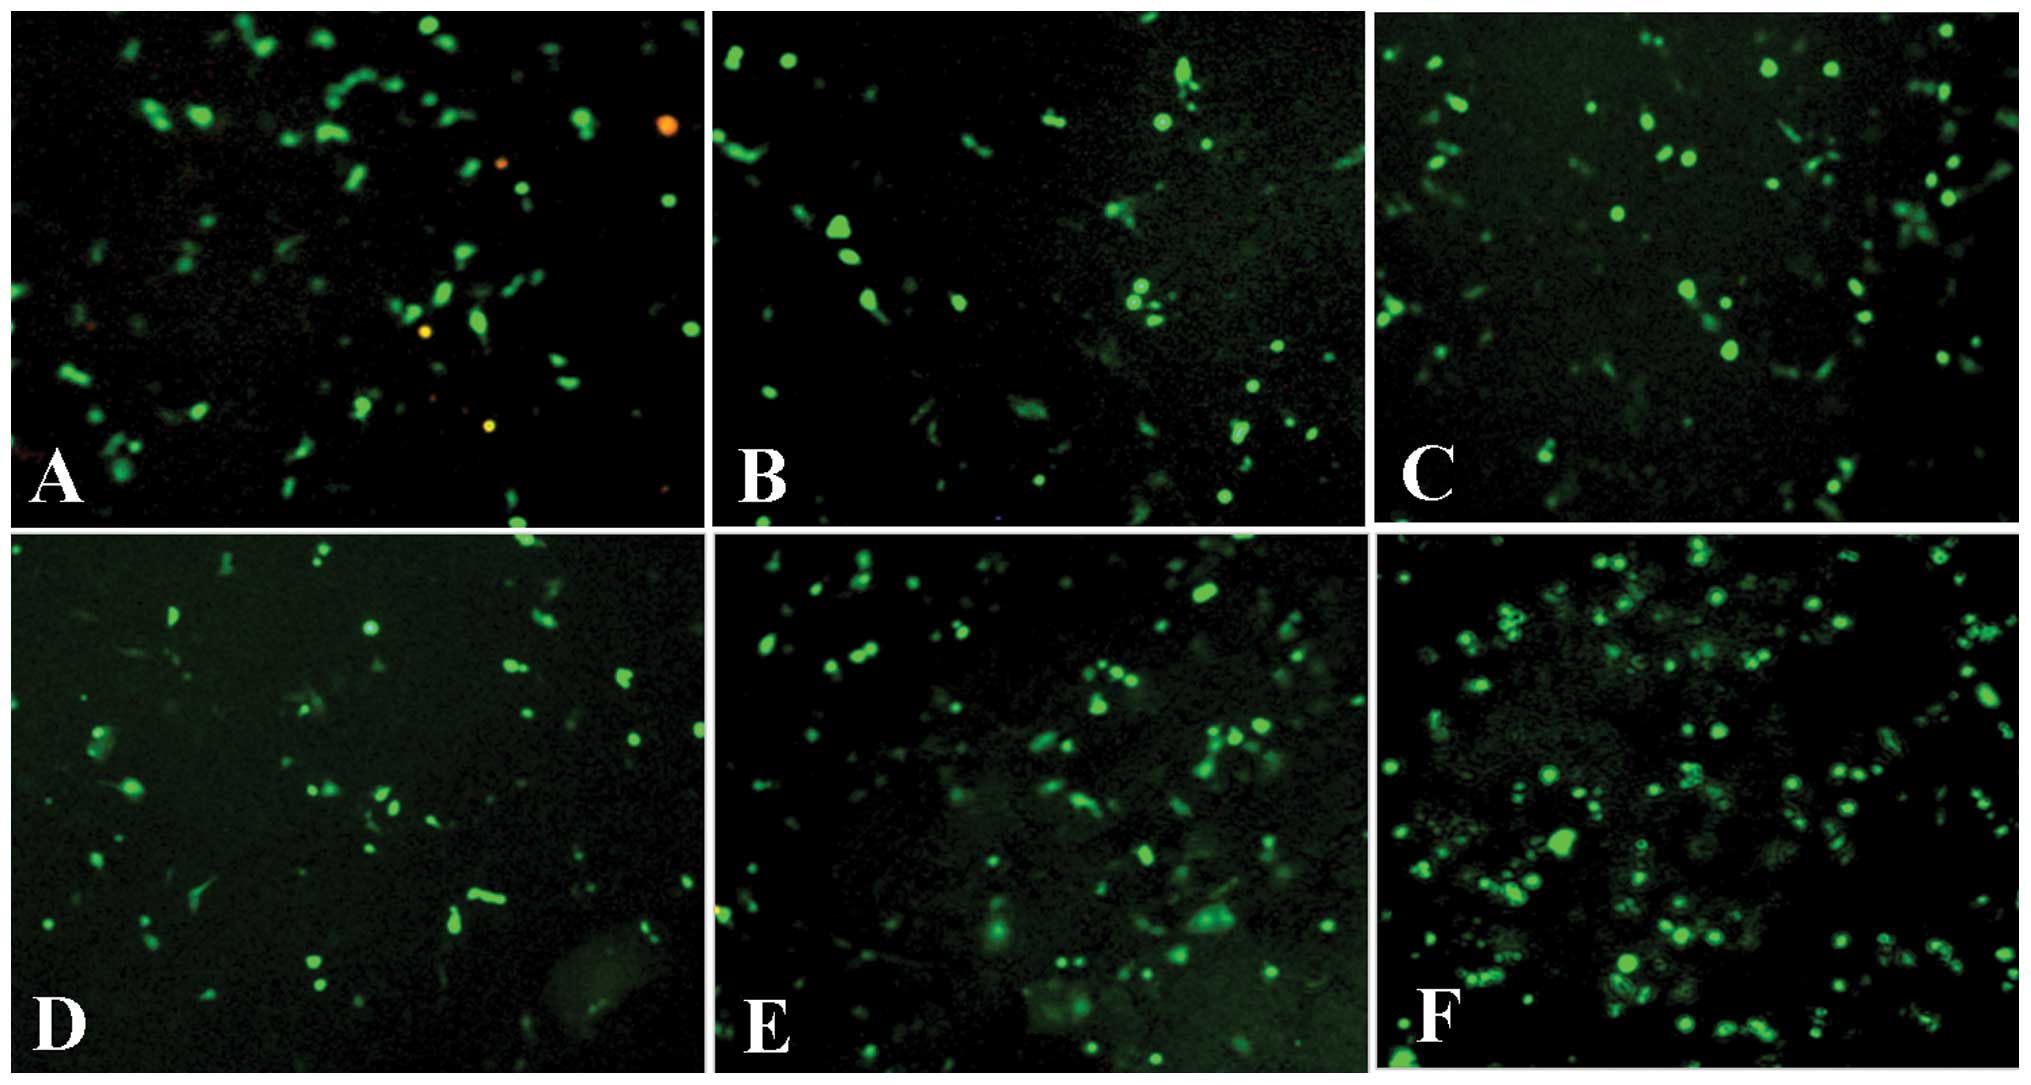
To gain further insight into the specific function
of HPSE, we developed a shRNA interference approach in SKOV3
ovarian cancer cells. Four purified pGPU6/GFP/Neo-shRNA expression
vectors, which contained the HPSE shRNA insert
(pGPU6/GFP/Neo-HPSE-548, pGPU6/GFP/Neo-HPSE-640,
pGPU6/GFP/Neo-HPSE-1222, and pGPU6/GFP/Neo-HPSE-1566) and two
control vectors (pGPU6/GFP/Neo-shNC and pGPU6/GFP/Neo-shGAPDH) were
transfected into SKOV3 cells. The transfection rate was measured by
GFP cells vs. total cells in one microscope field, each cell with
five fields. As shown in Fig. 5 and
Table VI, the transfection rates
between these six cells had no statistically significant
difference. However, the mRNA expression of HPSE in these 6 cells
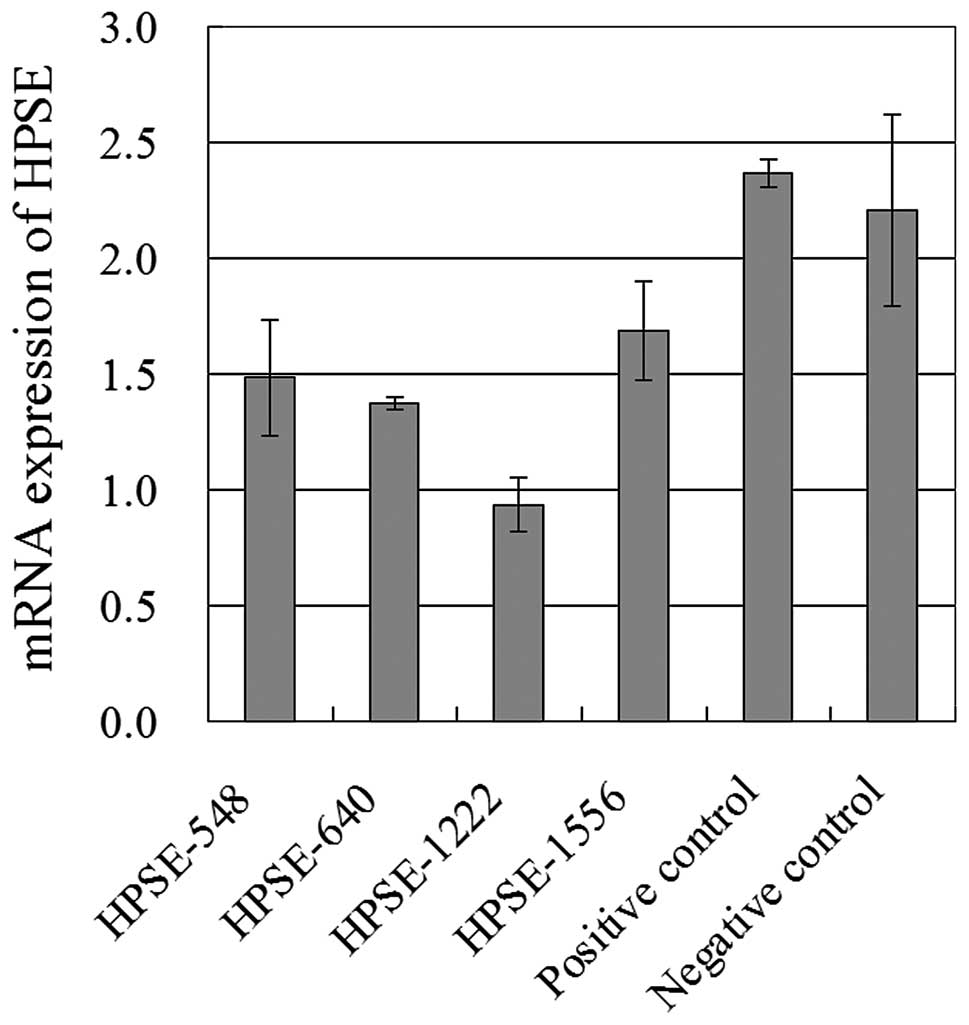
clearly varied. As shown in Fig. 6,
HPSE expression at mRNA level in SKOV3 cells transfected with
pGPU6/GFP/Neo-HPSE-1222 was significantly reduced compared to those
transfected with pGPU6/GFP/Neo-HPSE-548, pGPU6/GFP/Neo-HPSE-640,
pGPU6/GFP/Neo-HPSE-1556, and two control cells. Thus,
pGPU6/GFP/Neo-HPSE-1222 with the greatest silencing efficiency was
selected for further study.
| Table VITransfection rates of different shRNA
in SKOV3 cells. |
Table VI
Transfection rates of different shRNA
in SKOV3 cells.
| SKOV3 cells | Total cells
(no.) | GFP cells
(no.) | Transfection
rate | P-value |
|---|
| -HPSE-548 | 110.6±4.25 | 58.2±2.63 | 53.41±1.03 | |
| -HPSE-640 | 111.2±4.35 | 56.2±5.95 | 50.34±4.40 | 0.999 |
| -HPSE-1222 | 112.6±6.77 | 57.6±2.27 | 53.48±3.42 | 1.0 |
| -HPSE-1556 | 102.6±1.91 | 48.6±2.69 | 47.35±2.44 | 0.216 |
| -shGAPDH (positive
control) | 109.4±2.56 | 65.6±4.55 | 58.65±2.86 | 0.723 |
| -shNC (negative
control) | 122.4±2.42 | 60.8±6.91 | 49.34±6.00 | 0.999 |
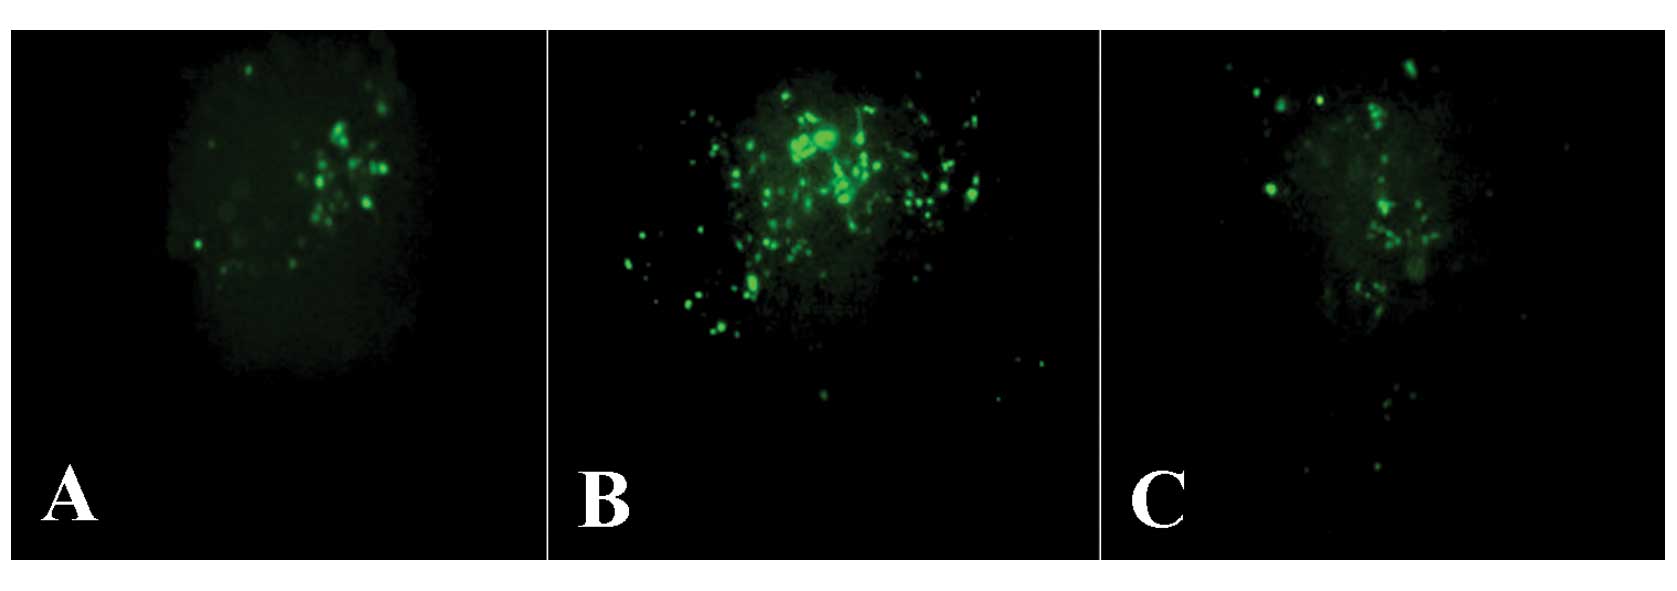
SKOV3 cells transfected with
pGPU6/GFP/Neo-HPSE-1222, pGPU6/GFP/Neo-shGAPDH and
pGPU6/GFP/Neo-shNC were incubated in G418 medium for 14 days, and
those still with GFP were identified as stable HPSE silencing cells
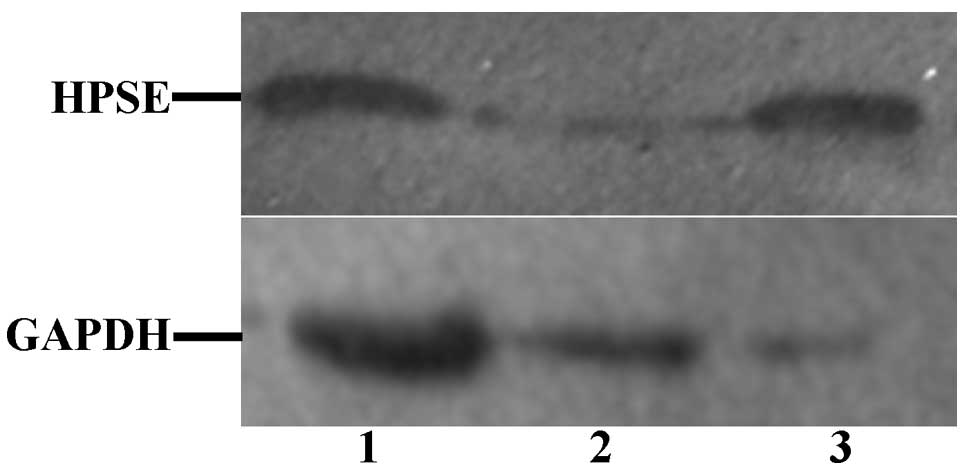
(as shown in Fig. 7). Western
blotting was performed to evaluate inhibition of HPSE protein
synthesis. As shown in Fig. 8, HPSE
protein was specifically silenced in SKOV3 cells transfected with
pGPU6/GFP/Neo-HPSE-1222 plasmids in comparison with that in control
cells.
Effects on biological behavior of ovarian
tumor cells mediated by altered expression of HPSE
The stable A2780 cells transfected with
pcDNA3.1-HPSE vector in which the HPSE was upregulated, and the
stable SKOV3 cells transfected with pGPU6/GFP/Neo-HPSE-1222 vector
for which the HPSE expression was downregulated, were used to study
the effects of HPSE on biological behaviors. 1) The effects on cell
growth: the overexpression of HPSE in A2780 cells clearly
accelerated the cell growth compared with the growth speed of
normal A2780 cells and pcDNA3.1-A2780 cells (p=0.003), and the
silencing of HPSE in SKOV3 cells apparently slowed down the cell
proliferation in comparison with that in two controls (p=0.001). 2)
The effects on cell cycle: as shown in Table VII, the percentage of cells in
proliferative phase (S phase + G2 phase + M phase) of cell cycle in
pcDNA3.1-HPSE-A2780 cells was visibly more than that in
pcDNA3.1-A2780 cells (p=0.003), and the percentage of cells in the
proliferative phase of cell cycle in pGPU6/GFP/Neo-HPSE-1222-SKOV3
cells was much less than that in control cells (p=0.034 and 0.015,
respectively). 3) The effects on cell invasion, metastasis and cell
adhesion: as shown in Table
VIII, the ability of cell invasion and adhesion of
pcDNA3.1-HPSE-A2780 cells was notably stronger than that of
pcDNA3.1-A2780 cells (p=0.003 and 0.002), although no difference
was observed in cell metastasis between them. The ability of
invasion and adhesion of pGPU6/GFP/Neo-HPSE-1222-SKOV3 cells was
markedly weaker than that of the two control cells (p=0.015, 0.015
and 0.038, respectively) and, similarly, no difference was observed
in cell metastasis between them. Collectively, these results
revealed that the expression of HPSE in ovarian cancer cells had
notable effects on biological behaviors of cancer cells, indicating
that HPSE might play a role in cancer development in the
clinic.
| Table VIIDistribution of cells in different
phases of cell cycle in different ovarian cancer cells. |
Table VII
Distribution of cells in different
phases of cell cycle in different ovarian cancer cells.
| No. of cells in
cell cycle (mean ± SD) |
|---|
|
|
|---|
| Cells | G0 + G1 phase | S phase | G2 + M phase |
|---|
|
pcDNA3.1-HPSE-A2780 | 56.80±0.99 | 26.91±2.09 | 16.29±0.77 |
| pcDNA3.1-A2780 | 76.61±0.46 | 17.93±0.70 | 5.47±0.57 |
| A2780 | 75.44±0.38 | 18.01±0.55 | 6.55±0.63 |
|
pGPU6/GFP/Neo-HPSE-1222-SKOV3 | 87.64±1.67 | 8.91±1.04 | 3.11±0.89 |
|
pGPU6/GFP/Neo-shGAPDH-SKOV3 | 74.67±2.18 | 14.99±2.67 | 10.01±0.45 |
|
pGPU6/GFP/Neo-shNC-SKOV3 | 77.30±2.03 | 12.92±2.32 | 8.70±0.64 |
| Table VIIIThe effects on cell invasion,
metastasis and adhesion of tumor cells mediated by the expression
of HPSE. |
Table VIII
The effects on cell invasion,
metastasis and adhesion of tumor cells mediated by the expression
of HPSE.
| Cell invasion | Cell
metastasis | Cell adhesion |
|---|
|
|
|---|
| Cells | Absorbance (mean ±
SD) |
|---|
| pcDNA3.1-HPSE-
2780 | 0.477±0.024 | 1.101±0.156 | 0.728±0.08 |
| pcDNA3.1-A2780 | 0.250±0.081 | 1.051±0.124 | 0.518±0.079 |
| A2780 | 0.278±0.077 | 1.043±0.133 | 0.497±0.063 |
|
pGPU6/GFP/Neo-HPSE-1222-SKOV3 | 0.690±0.085 | 0.569±0.106 | 0.753±0.076 |
|
pGPU6/GFP/Neo-shGAPDH-SKOV3 | 1.126±0.796 | 0.709±0.112 | 0.532±0.091 |
|
pGPU6/GFP/Neo-shNC-SKOV3 | 1.091±0.277 | 0.711±0.333 | 0.5833±0.119 |
Discussion
Several studies have focused on the roles of HPSE in
tumor invasion and metastasis (9–11).
However, the mechanisms of HPSE contributing to tumor invasion and
metastasis remain unknown, since those studies were single-factor
studies. In this study, based on the measurement of serum HPSE
concentration, the expression of HPSE at both the mRNA and protein
level in tumors and its effects on biological behaviors of cancer
cells, we systematically studied the role of HPSE in tumor invasion
and metastasis in ovarian cancer for the first time.
The serum concentration of HPSE and its expression
at both the mRNA and protein levels in malignant tumors were
clearly higher than in benign tumors and controls. This result was
similar to studies previously reported (12,13),
suggesting that the overexpression of HPSE might closely relate to
cancer development and, therefore, we concluded that either serum
HPSE concentration or its expression at mRNA or/and protein levels
might be the potential biomarkers for diagnosis in ovarian cancer.
Moreover, we observed that serum concentration of HPSE in ovarian
cancer patients after surgery was markedly decreased compared with
that prior to surgery (p=0.023), and serum concentration of HPSE in
patients with recurrent ovarian cancer was higher that in controls
(p=0.001), suggesting that the serum concentration of HPSE was
decreased when the tumor was excised, and increased when the tumor
developed again. This finding indicated that HPSE concentration in
serum may be a reflection of tumor size and growth state. Previous
studies revealed that HPSE was highly expressed in colon cancer,
liver cancer, ovarian cancer and endometrial carcinoma compared to
that in normal controls, respectively (14–17),
indicating that HPSE expression is likely associated with tumor
invasion, metastasis, neoplastic transformation and cancer
development. Collectively, we concluded that the serum
concentration of HPSE may be a useful biomarker for evaluation of
the surgery effects and prognosis prediction, and may also be
useful for condition monitoring in post-operative ovarian cancer
patients.
The relationship between clinical pathological
factors and the HPSE expression in ovarian cancer was investigated.
Compared to that in well differentiated tumors, stages III–IV
tumors and tumors without distant metastasis, the positive
expression of HPSE at both the mRNA and protein levels in ovarian
cancer and the serum concentration of HPSE were all significantly
upregulated in poorly differentiated tumors, stages I–II tumors and
tumors with distant metastasis, respectively. These results are
generally consistent with previous studies reported (18,19).
To gain further insight into the specific function
of HPSE in ovarian cancer, we developed the overexpression and
silencing approaches to study its effects on biological behaviors
in ovarian cancer cells. The results revealed that the altered
expression of HPSE led to notable changes in cell growth and cell
cycle, indicating that HPSE contributed to cell proliferation in
ovarian cancer. This function in ovarian cancer cells is consistent
with biological functions of HPSE itself (8).
The altered expression of HPSE had marked effects on
the ability of cell adhesion. The cell adhesion ability increased
when HPSE was overexpressed, and it decreased when the expression
was silenced. The possible mechanism for HPSE worked to cell
adhesion might be mediated by uPA. The uPA and tPA were released
from HS and were activated after the degradation of basement
membrane by HPSE. In turn, the plasminogen binding to cell surface
was activated by uPA to dissolve the tumor extracellular matrix.
Meanwhile, the uPA was limited and fixed on the tumor cell surface
to enhance the affinity of uPA-R with VN and integrin which were
both located on the cell surface. Finally, these cascade reactions
led to a gathering and adhesion of those proteins and tumor cells
in lesion. Therefore, the decreased adhesive ability of ovarian
cancer cells mediated by HPSE were closely related to protease
cascade resulting from degradation of basement membrane (16,20).
The expression of HPSE in ovarian cancer cells
significantly enhanced the ability of cell invasion, but no
apparent change was observed in metastases. This result is
consistent with previous studies reporting that HPSE had direct and
indirect effects on tumor invasion (21–23).
The direct effect of HPSE on cell invasion was that HPSE uniquely
degrades heparan sulfate proteoglycans in extracellular matrix
(HPSG), causes the degradation of heparin, destroys the
extracellular matrix and basement membrane, and eventually promotes
the tumor cell invasion.
Acknowledgements
This study was supported by a grant from the Science
and Technology Development Program of Guangxi Science and the
Technology Department (no. 2010GXNSFD013053).
References
|
1
|
Shaaban A and Rezvani M: Ovarian cancer:
detection and radiologic staging. Clin Obstet Gynecol. 52:73–93.
2009. View Article : Google Scholar
|
|
2
|
Chen WQ, Zhang SW, Zou XN and Zhao P:
Cancer incidence and mortality in China, 2006. Chin J Cancer Res.
23:3–9. 2011. View Article : Google Scholar
|
|
3
|
Hulett MD, Freeman C, Hamdorf BJ, Baker
RT, Harris MJ, et al: Cloning of mammalian heparanase, an important
enzyme in tumor invasion and metastasis. Nat Med. 5:803–809. 1999.
View Article : Google Scholar : PubMed/NCBI
|
|
4
|
Folkman J and Shing Y: Control of
angiogenesis by heparin and other sulfated polysaccharides. Adv Exp
Med Biol. 313:355–364. 1992. View Article : Google Scholar : PubMed/NCBI
|
|
5
|
Mesiano S, Ferrara N and Jaffe RB: Role of
vascular endothelial growth factor in ovarian cancer: inhibition of
ascites formation by immunoneutralization. Am J Pathol.
153:1249–1256. 1998. View Article : Google Scholar : PubMed/NCBI
|
|
6
|
Liu S, Li Y, Chen W, Zheng P, Liu T, et
al: Silencing glypican-3 expression induces apoptosis in human
hepatocellular carcinoma cells. Biochem Biophys Res Commun.
419:656–661. 2012. View Article : Google Scholar : PubMed/NCBI
|
|
7
|
Jiang G, Zheng L, Pu J, Mei H, Zhao J, et
al: Small RNAs targeting transcription start site induce heparanase
silencing through interference with transcription initiation in
human cancer cells. PLoS One. 7:e313792012. View Article : Google Scholar
|
|
8
|
Lenaerts L, van Dam W, Persoons L and
Naesens L: Interaction between mouse adenovirus type 1 and cell
surface heparan sulfate proteoglycans. PLoS One. 7:e314542012.
View Article : Google Scholar : PubMed/NCBI
|
|
9
|
Yoneda A, Lendorf ME, Couchman JR and
Multhaupt HA: Breast and ovarian cancers: a survey and possible
roles for the cell surface heparan sulfate proteoglycans. J
Histochem Cytochem. 60:9–21. 2012. View Article : Google Scholar : PubMed/NCBI
|
|
10
|
Davies EJ, Blackhall FH, Shanks JH, David
G, McGown AT, et al: Distribution and clinical significance of
heparan sulfate proteoglycans in ovarian cancer. Clin Cancer Res.
10:5178–5186. 2004. View Article : Google Scholar : PubMed/NCBI
|
|
11
|
Reiland J, Sanderson RD, Waguespack M,
Barker SA, Long R, et al: Heparanase degrades syndecan-1 and
perlecan heparan sulfate: functional implications for tumor cell
invasion. J Biol Chem. 279:8047–8055. 2004. View Article : Google Scholar : PubMed/NCBI
|
|
12
|
Quiros RM, Rao G, Plate J, Harris JE,
Brunn GJ, et al: Elevated serum heparanase-1 levels in patients
with pancreatic carcinoma are associated with poor survival.
Cancer. 106:532–540. 2006. View Article : Google Scholar : PubMed/NCBI
|
|
13
|
de Moura JP Jr, Nicolau SM, Stávale JN, da
Silva Pinhal MA, de Matos LL, et al: Heparanase-2 expression in
normal ovarian epithelium and in benign and malignant ovarian
tumors. Int J Gynecol Cancer. 19:1494–1500. 2009.PubMed/NCBI
|
|
14
|
Peretti T, Waisberg J, Mader AM, de Matos
LL, da Costa RB, et al: Heparanase-2, syndecan-1, and extracellular
matrix remodeling in colorectal carcinoma. Eur J Gastroenterol
Hepatol. 20:756–765. 2008. View Article : Google Scholar : PubMed/NCBI
|
|
15
|
Dong S and Wu XZ: Heparanase and
hepatocellular carcinoma: promoter or inhibitor? World J
Gastroenterol. 16:306–311. 2010. View Article : Google Scholar : PubMed/NCBI
|
|
16
|
Davidson B, Shafat I, Risberg B, Ilan N,
Trope CG, et al: Heparanase expression correlates with poor
survival in metastatic ovarian carcinoma. Gynecol Oncol.
104:311–319. 2007. View Article : Google Scholar : PubMed/NCBI
|
|
17
|
Inamine M, Nagai Y, Hirakawa M, Mekaru K,
Yagi C, et al: Heparanase expression in endometrial cancer:
analysis of immunohistochemistry. J Obstet Gynaecol. 28:634–637.
2008. View Article : Google Scholar : PubMed/NCBI
|
|
18
|
Ginath S, Menczer J, Friedmann Y, Aingorn
H, Aviv A, et al: Expression of heparanase, Mdm2, and erbB2 in
ovarian cancer. Int J Oncol. 18:1133–1144. 2001.PubMed/NCBI
|
|
19
|
Zhang W, Yang HC, Wang Q, Yang ZJ, Chen H,
et al: Clinical value of combined detection of serum matrix
metalloproteinase-9, heparanase, and cathepsin for determining
ovarian cancer invasion and metastasis. Anticancer Res.
31:3423–3428. 2011.PubMed/NCBI
|
|
20
|
Zetser A, Bashenko Y, Miao HQ, Vlodavsky I
and Ilan N: Heparanase affects adhesive and tumorigenic potential
of human glioma cells. Cancer Res. 63:7733–7741. 2003.PubMed/NCBI
|
|
21
|
Edovitsky E, Elkin M, Zcharia E, Peretz T
and Vlodavsky I: Heparanase gene silencing, tumor invasiveness,
angiogenesis, and metastasis. J Natl Cancer Inst. 96:1219–1230.
2004. View Article : Google Scholar : PubMed/NCBI
|
|
22
|
Shafat I, Ben-Arush MW, Issakov J, Meller
I, Naroditsky I, et al: Pre-clinical and clinical significance of
heparanase in Ewing's sarcoma. J Cell Mol Med. 15:1857–1864. 2011.
View Article : Google Scholar : PubMed/NCBI
|
|
23
|
Z CZ, Luo C, Yang Z and Wang L: Heparanase
participates in the growth and invasion of human U-2OS osteosarcoma
cells and its close relationship with hypoxia-inducible
factor-1alpha in osteosarcoma. Neoplasma. 57:562–571.
2010.PubMed/NCBI
|