Introduction
Glioma pathogenesis-related protein 1 (GliPR1) was
originally identified in human glioblastomas (1) and is also named related to
testes-specific, vespid and pathogenesis protein 1 (RTVP-1)
(2). Increased expression of GliPR1
was associated with myelomonocytic differentiation in macrophages
(3). While GliPR1 has been reported
to act as a tumor-suppressor gene inducing apoptosis in prostate
cancer (4–7), it appears to be an oncogene in
glioblastomas, that enhances proliferation (8) and is overexpressed in Wilms’ tumors
(9). Previously, we described
GliPR1 as an HIV-1 dependency factor (10).
RTVP-1 (GliPR1) protein was reported to contain an
N-terminal signal peptide sequence, a putative enzymatic center, a
CRISP domain of unknown function and a transmembrane domain
(11).
In the present study, the effect of GliPR1 knockdown
on cellular gene expression was studied to identify downstream
regulatory targets of GliPR1 and to reveal its relation to specific
cellular functional categories.
Materials and methods
Cell culture
For the siRNA knockdown experiments, HeLa cells were
cultured in Dulbecco’s modified Eagle’s medium (Invitrogen,
Karlsruhe, Germany). Medium was supplemented with 10% fetal bovine
serum (FBS), 1% glutamine and 1% antibiotic solution (penicillin
and streptomycin; all from Gibco-BRL, Karlsruhe, Germany).
Transfection of the cells was carried out in the absence of any
antibiotics.
siRNA transfection
A negative control non-silencing siRNA with no known
homology to mammalian genes (si-nons-Rho: 5′-UUC UCC GAA CGU GUC
ACG Udtdt-3′; 5-prime labeled with rhodamine); and two different
siRNAs specific to GliPR (si-GliPR-1, 5′-GGU GAA ACC AAC AGC CAG
Udtdt-3′ and si-GliPR-2, 5′-GGA CUA UGA CUU CAA GAC Udtdt-3′) were
used. All siRNAs were synthesized by Ambion (Darmstadt, Germany)
and were purchased as annealed RNA-duplexes. Twenty-four hours
before transfection, HeLa cells were plated in 24-well plates
(Corning, Kaiserslautern, Germany) at 5×10⁴ cells/well
in Dulbecco’s minimal essential medium containing 10% FBS with no
antibiotics. Transfections were performed with
Lipofectamine® 2000 transfection reagent (Invitrogen)
with siRNA at a final concentration of 20 nM according to the
manufacturer’s recommendations. After incubating for 6 h, the
lipid/siRNA complexes were removed and replaced with fresh medium.
For further analysis, cells were removed from the culture dish by
trypsinization with 0.25% trypsin/0.02% EDTA in PBS (Cambrex,
Verviers, Belgium) at different time points after transfection.
Transfection efficiency was analyzed by flow cytometry 24 h after
transfection. Data were acquired and analyzed on a FACScan
instrument with Cell Quest software (Becton-Dickinson, Heidelberg,
Germany). Effects on cellular viability after siRNA treatment were
measured using the cell proliferation reagent WST-1 (Roche,
Penzberg, Germany) according to the manufacturer’s
instructions.
Real-time PCR quantification
RNA was extracted using the RNeasy Mini kit
(Invitrogen) including treatment with RNase-free DNase I (Qiagen).
Synthesis of cDNA was carried out using random hexamer primers and
Superscript II RNaseH-reverse transcriptase (Invitrogen) according
to the manufacturer’s specifications.
Real-time PCR was performed in duplicate reactions
employing ABI PRISM 7700 (Applied Biosystems, Darmstadt, Germany)
under standard conditions (50°C for 2 min, 95°C for 10 min and 40
cycles at 95°C for 15 sec and 60°C for 1 min). The 25 μl PCR
included 2.5 μl cDNA, 1X TaqMan® Universal PCR Master
Mix (Applied Biosystems), 0.2 μM TaqMan® probe, 0.2 μM
forward primer and 0.2 μM reverse primer. Primers and probes were
designed using Primer Express v.1.0 software (Applied Biosystems)
and were synthesized by Thermo Hybaid (Ulm, Germany). In order to
quantify GliPR1 and GAPDH cDNA, the following primers and probes
were used: GliPR (sense, 5′-TGC CAG ACA AAG CAT GCG T-3′;
antisense, 5′-GCT GTG TGT GAA TAA TTG GAG ACA A-3′; probe,
5′-FAM-TCA CAC TTG CTA CAA TAG CCT GGA TGG TTT C-3′-TAMRA) and
GAPDH (sense, 5′-GAA GGT GAA GGT CGG AGT C-3′; antisense, 5′-GAA
GAT GGT GAT GGG ATT TC-3′; probe, 5′-FAM-CAA GCT TCC CGT TCT CAG
CC-3′-TAMRA). The probes were labeled with FAM at the 5′ end and
TAMRA at the 3′ end. Copy numbers of the respective transcripts
were calculated by plasmid standard curves, normalized by GAPDH
housekeeping gene transcripts. Standard curves were obtained after
amplification of log step dilutions between 10 to 106
copy numbers of purified plasmids carrying the amplicons of human
GliPR1 or GAPDH (12),
respectively. The plasmid standard for the quantification of GliPR1
was prepared by inserting a PCR-generated fragment (sense, 5′-GGA
TCC ATG CGT GTC ACA CTT GCT ACA ATA GC-3′ and antisense, 5′-GTC GAC
TTA GTC CAA AAG AAC TAA ATT AGG GTA CTT GAG C-3′) into pCR2.1
(Invitrogen), which was amplified using HeLa cDNA as a
template.
Gene expression analysis by
microarrays
The microarray analysis of the effect of GliPR1
suppression by siRNA was performed using the HG-U133 Plus 2.0
microarray of Affymetrix (Santa Clara, CA, USA) according to the
manufacturer’s instructions (GeneChip® Expression
Analysis Manual). This chip contains 47,000 transcripts which
represent 39,000 annotated genes. The data analysis was carried out
according to established standards for Affymetric microarrays using
GeneChip® Operating software (GCOS; Affymetrix) and
GeneSpring (Agilent Technologies).
Overexpression of GliPR1-EGFP fusion
protein
Since GliPR1 has an N-terminal signal peptide that
is important for its subcellular localization, EGFP was fused to
the C-terminus of GliPR1. The plasmid p53-EGFP (Clontech,
Heidelberg, Germany) was cut by restriction enzyme digestion with
BamHI and SacII, in order to remove the p53 gene. The
resulting gap was filled with the ORF of GliPR1 without the stop
codon that had been amplified from HeLa mRNA by primers containing
flanking BamHI and SacII restriction sites. The
correct cDNA sequence of the GliPR1 insert was verified by
sequencing.
Immune fluorescence microscopy
Intracellular localization of GliPR1 was determined
by confocal fluorescence microscopy. Therefore 1×10⁴ to
5×10⁴ adherently growing HeLa cells were seeded onto a
slide overnight (diagnostic slide with adhesive epoxy layer; Roth,
Karlsruhe, Germany) in culture dishes. Cells were gently washed in
PBS (37°C), fixed for 10 min in 3% (v/v) formaldehyde in PBS at
room temperature (RT) and permeabilized for 10 min in 0.1% (v/v)
Triton X-100 in PBS. Prior to incubating with the antibodies, cells
were blocked with Image-iT® FX Signal Enhancer reagent
(Molecular Probes, Eugene, OR, USA) for 30 min at RT and after
washing were incubated with the primary antibody [diluted in 3%
(w/v) BSA in PBS] for 90 min at RT. After washing in PBS, cells
were incubated with the respective fluorophore-coupled secondary
antibody for 90 min at RT. Then nuclei were stained with
4′,6-diamidino-2-phenylindol (DAPI; Molecular Probes) in dilution
of 1:300 PBS for 5 min at RT followed by the overlaying of cells
with cover medium (ProLong Mounting Medium; Molecular Probes).
Slides were evaluated with the Axioplan II imaging microscope and
AxioVision software (Zeiss, Göttingen, Germany) and displayed by
Adobe Photoshop 6.01 software (Adobe Systems GmbH, Munich,
Germany). Mouse IgG2a anti-protein disulfide isomerase (PDI)
antibody (Acris Antibodies GmbH, Herford, Germany) was used as the
primary antibody at a dilution of 1:200, and goat anti-mouse IgG
(1:500) labelled with Alexa 594 (Molecular Probes, OR, USA;
Invitrogen, Darmstadt, Germany) was employed as the secondary
antibody for staining of the ER.
Analysis of GliPR1 expression on Leukemia
Gene Atlas (LGA) platform
The LGA is a public platform which provides
published gene expression datasets in the field of leukemia that
can be used for further analyses in regard to specific genes of
interest (13). The dataset
published by Haferlach et al(14) (n=2,096 samples) was evaluated for
differential GliPR1 expression among different leukemias. The same
dataset was employed to compare GliPR1 expression between acute
myeloid leukemia (AML) patients with different karyotypes
(translocations) as well as between acute lymphoblastic leukemia
(ALL) patients with different karyotypes. The dataset published by
Verhaak et al(15) (n=461)
was utilized to evaluate GliPR1 expression between the FAB classes
of AML. Both datasets were generated on the Affymetrix HG-U133 Plus
2 platform that contains five probe sets for measuring the
expression of GliPR1. Analyses were based on the mean of these
probe sets. The Kruskal-Wallis test was applied to test for
differential expression across several groups. The Wilcoxon test
was applied to test for differences between a specific leukemia
subgroup and the reference group (16).
Results
Suppression of GliPR1 mediated by short
interfering RNA
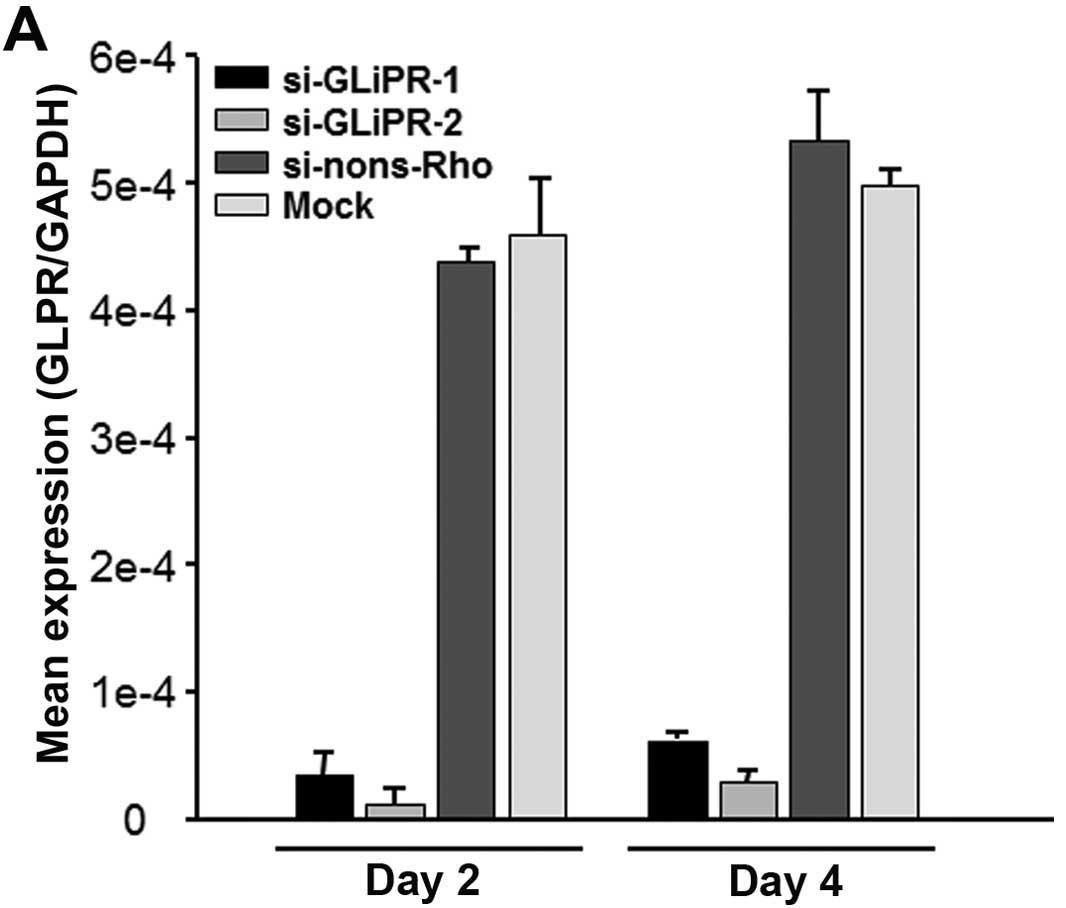
HeLa cells were transfected with siRNAs specific for
GliPR1 or a non-silencing siRNA, which was 5-prime-labeled with
rhodamine. Flow cytometric analysis of cells transfected with the
non-silencing siRNA 24 h post transfection revealed transfection
efficiencies on average of ~90%. Forty-eight hours after
transfection, the relative levels of GliPR1 mRNA transcripts were
decreased by more than 90%, compared to HeLa cells transfected with
the non-silencing control siRNA as measured by quantitative PCR
(Fig. 1A). Viability and the
proliferation rate of HeLa cells transfected with siRNAs against
GliPR1 or with the non-silencing siRNA remained unchanged as
determined by the WST-1 cell proliferation assay (Fig. 1B).
In conclusion, GliPR1-directed siRNAs reduced the
expression of GliPR1 effectively in HeLa cells without affecting
cell viability in general.
Differentially expressed genes after
GliPR1 suppression
In order to examine the effect of GliPR1 knockdown
on cellular gene expression, a microarray analysis was performed to
identify cellular target genes of GliPR1.
The microarray analysis showed a similar suppression
of GliPR1 expression to 20% confirming the results of the
quantitative PCR.
The knockdown of GliPR1 revealed 262 differentially
expressed genes including 40 induced genes and 222 suppressed genes
(≥3-fold increase or ≤0.3-fold decrease) as listed in Table I.
 | Table IDifferentially expressed cellular
genes after GliPR1 knockdown. |
Table I
Differentially expressed cellular
genes after GliPR1 knockdown.
| Common gene | Fold-change |
|---|
| OGFRL1 | 21.99 |
| UBE2D1 | 20.93 |
| CGA | 13.54 |
| PPP2R1B | 12.80 |
| SLC7A11 | 12.41 |
| DSC3 | 10.93 |
| TFF1 | 10.15 |
| PELI1 | 8.96 |
| KIAA1199 | 8.22 |
| TPPP | 6.76 |
| VAMP4 | 6.71 |
| HNRPH1 | 6.56 |
| ARHGAP19 | 6.27 |
| KMO | 5.57 |
| WBP4 | 5.26 |
| C21orf55 | 3.96 |
| BICD2 | 3.95 |
| G3BP2 | 3.87 |
| GDAP1 | 3.84 |
| RABL4 | 3.78 |
| GPR107 | 3.70 |
| CREM | 3.64 |
| RNF170 | 3.61 |
| SMARCA5 | 3.60 |
| PIM2 | 3.60 |
| SLC3A1 | 3.45 |
| TPM4 | 3.41 |
| MLH3 | 3.41 |
| CPM | 3.38 |
| BMP2 | 3.36 |
| RCP9 | 3.28 |
| MTM1 | 3.24 |
| MT1H | 3.24 |
| PRO1853 | 3.23 |
| FZD10 | 3.22 |
| ZNF3 | 3.14 |
| MAP3K9 | 3.06 |
| CDS2 | 3.01 |
| PMP22 | −3.02 |
| FLJ20280 | −3.02 |
| ANKRD15 | −3.02 |
| TBC1D16 | −3.03 |
| ADARB1 | −3.03 |
| WWTR1 | −3.03 |
| SDC2 | −3.05 |
| NSMAF | −3.05 |
| SFPQ | −3.05 |
| C14orf78 | −3.06 |
| PPP3CA | −3.06 |
| GPR125 | −3.06 |
| CAP2 | −3.06 |
| UBE2H | −3.08 |
| SEC23B | −3.08 |
| NASP | −3.09 |
| NEK7 | −3.09 |
| MCFD2 | −3.10 |
| MGC14376 | −3.10 |
| CD59 | −3.11 |
| ATG5 | −3.11 |
| CSGlcA-T | −3.12 |
| P15RS | −3.13 |
| MAST2 | −3.14 |
| AGPAT2 | −3.17 |
| EP400 | −3.17 |
| EXTL2 | −3.18 |
| PNPLA2 | −3.18 |
| GNB1 | −3.18 |
| GALNT10 | −3.20 |
| KIAA0143 | −3.22 |
| CCND1 | −3.22 |
| APITD1 | −3.22 |
| HIP1 | −3.22 |
| SEMA3F | −3.24 |
| MRPS30 | −3.24 |
| DST | −3.25 |
| CKLFSF6 | −3.26 |
| EVL | −3.26 |
| RBMS1 | −3.26 |
| AQP3 | −3.28 |
| TAF6L | −3.28 |
| MBNL2 | −3.28 |
| FER1L3 | −3.29 |
| SYNPO | −3.30 |
| HPS5 | −3.31 |
| ATP2B4 | −3.31 |
| C6orf210 | −3.31 |
| SLCO3A1 | −3.31 |
| PAWR | −3.31 |
| KIF3A | −3.33 |
| RAB26 | −3.34 |
| MAN1A2 | −3.35 |
| ARHGAP29 | −3.36 |
| NXN | −3.37 |
| SDC1 | −3.37 |
| RNGTT | −3.37 |
| SEC23A | −3.38 |
| BTBD1 | −3.38 |
| SNX10 | −3.42 |
| RCOR1 | −3.42 |
| TFPI | −3.42 |
| SEP11 | −3.45 |
| ABHD3 | −3.47 |
| SAR1A | −3.47 |
| ZNF42 | −3.48 |
| PEX10 | −3.49 |
| MRS2L | −3.50 |
| RBMS1 | −3.51 |
| LRP5 | −3.52 |
| PRKACB | −3.52 |
| FNDC3B | −3.53 |
| PDE4B | −3.54 |
| PRUNE | −3.55 |
| MOBK1B | −3.55 |
| PRKCA | −3.55 |
| ACYP2 | −3.55 |
| MAPK8IP3 | −3.55 |
| ZNF673 | −3.55 |
| CLASP2 | −3.58 |
| COL5A1 | −3.58 |
| MTCBP-1 | −3.58 |
| CACYBP | −3.59 |
| LRP8 | −3.59 |
| AQP3 | −3.60 |
| TNS3 | −3.60 |
| EIF4G3 | −3.61 |
| PLEKHA9 | −3.62 |
| KIAA0143 | −3.64 |
| LZTFL1 | −3.64 |
| CACYBP | −3.65 |
| PITPNC1 | −3.69 |
| HPCAL1 | −3.70 |
| SEP9 | −3.71 |
| C1orf22 | −3.72 |
| HOXA9 | −3.72 |
| PTPRM | −3.74 |
| COL5A1 | −3.77 |
| CRIM1 | −3.79 |
| GPM6B | −3.79 |
| HPCAL1 | −3.80 |
| HTRA1 | −3.83 |
| ME3 | −3.84 |
| UBL3 | −3.85 |
| SEC23A | −3.86 |
| HSPG2 | −3.86 |
| CCNE2 | −3.91 |
| SLC6A8 | −3.92 |
| DNAJC1 | −3.94 |
| NINJ2 | −3.95 |
| ATXN10 | −4.02 |
| MKL2 | −4.04 |
| SERPINI1 | −4.07 |
| PRKCA | −4.09 |
| HEMK1 | −4.10 |
| IGFBP6 | −4.10 |
| LMO7 | −4.12 |
| EHD2 | −4.13 |
| ROBO1 | −4.13 |
| DNAJB9 | −4.15 |
| FLJ21687 | −4.15 |
| RANBP10 | −4.19 |
| ELP4 | −4.20 |
| YIPF4 | −4.22 |
| MGC35048 | −4.24 |
| MKRN1 | −4.26 |
| IRF2 | −4.28 |
| DHRS3 | −4.32 |
| GMDS | −4.34 |
| RBMS1 | −4.39 |
| HSA9761 | −4.49 |
| LEPREL1 | −4.49 |
| SAMD4 | −4.53 |
| NCOR1 | −4.55 |
| ALPP | −4.58 |
| CTNND1 | −4.58 |
| COL4A3BP | −4.60 |
| RAB17 | −4.60 |
| PTPRK | −4.61 |
| EPS8 | −4.64 |
| PEMT | −4.70 |
| BDH | −4.72 |
| ADK | −4.72 |
| C9orf46 | −4.73 |
| CSGlcA-T | −4.77 |
| SORBS2 | −4.79 |
| LOC440669 | −4.80 |
| BTN3A3 | −4.83 |
| PORIMIN | −4.87 |
| GLS | −4.90 |
| KIAA1043 | −5.01 |
| SNTB2 | −5.07 |
| GLiPR | −5.08 |
| HFE | −5.23 |
| YAF2 | −5.26 |
| COPS8 | −5.32 |
| SEP9 | −5.33 |
| APC | −5.35 |
| MAP2K1IP1 | −5.43 |
| ELK3 | −5.60 |
| FLJ21168 | −5.67 |
| SUPT7L | −5.81 |
| SLC1A1 | −5.82 |
| KIAA1043 | −5.83 |
| CENTD1 | −5.89 |
| RGS20 | −5.95 |
| GMDS | −6.00 |
| SFPQ | −6.13 |
| RBBP5 | −6.13 |
| CLOCK | −6.24 |
| EGFR | −6.33 |
| DNAJC6 | −6.43 |
| BF | −6.46 |
| NCOA3 | −6.53 |
| ANKRD46 | −6.58 |
| PEX14 | −6.64 |
| PBX3 | −6.88 |
| GPHN | −6.91 |
| RAB28 | −6.96 |
| CENTG2 | −7.04 |
| AQP3 | −7.08 |
| RABGAP1L | −7.09 |
| ZNF307 | −7.19 |
| STS | −7.51 |
| SPHAR | −7.60 |
| FTO | −7.62 |
| GNB5 | −7.72 |
| CFDP1 | −7.74 |
| SNX24 | −7.91 |
| MYT1L | −8.05 |
| ELOVL6 | −8.22 |
| MALT1 | −8.38 |
| MSX2 | −8.40 |
| PDE6D | −8.85 |
| LOX | −8.86 |
| TPK1 | −8.89 |
| ZCCHC10 | −9.13 |
| MGC4707 | −9.66 |
| YIPF6 | −9.69 |
| OLFML1 | −9.69 |
| ZHX2 | −10.60 |
| HCRT | −10.74 |
| FAM38B | −11.44 |
| MBP | −12.35 |
| PLEKHA5 | −12.39 |
| PDE1A | −12.44 |
| MOBK1B | −12.59 |
| SMYD3 | −12.79 |
| APBB2 | −12.83 |
| UTX | −13.03 |
| SSX2IP | −13.28 |
| GPM6B | −15.02 |
| MRS2L | −15.43 |
| SDC2 | −16.54 |
| EVI5 | −17.15 |
| PDE6D | −17.54 |
| SDC2 | −20.23 |
| APBB2 | −22.18 |
GliPR1-associated differentially expressed genes
were grouped according to the Gene Ontology (GO) Databank
categories. The GO Databank is structured hierarchically according
to 3 different criteria: subcellular localization, type of
biological process and molecular function. Each of the
differentially regulated genes was annotated to one or more
specific GO categories. Subsequently, it was evaluated, which GO
categories showed an overrepresentation of the differentially
expressed genes compared to a theoretical random annotation.
Table II lists the relevant
overrepresented GO categories with their differentially expressed
genes. All of the genes in these overrepresented GO categories were
found repressed except for one gene (MTM1) in the category
dephosphorylation. The overrepresented GO categories included G
protein signaling pathways (7 downregulated genes), regulation of
cyclin-dependent protein kinase activity (4 downregulated genes),
ER to Golgi vesicle-mediated transport (3 downregulated genes),
axon guidance (10 downregulated genes) and dephosphorylation (1
upregulated gene; 6 downregulated genes). The factors by which
these genes were downregulated or upregulated are included in
Table I. The genes with a more
marked downregulation by a factor ≤1/5 were APC, EGFR, DNAJC6,
GNB5, APBB2 and phosphodiesterase 1A (PDE1A).
| Table IIGO categories overrepresented by the
differentially expressed genes after GliPR1 knockdown. |
Table II
GO categories overrepresented by the
differentially expressed genes after GliPR1 knockdown.
| GO categories | Regulation | Gene ID |
|---|
| Regulation of
cyclin-dependent protein kinase activity | ↓ | CCND1 (−3.2), CCNE2
(−3.9), APC (−5.4), EGFR (−6.3) |
|
Dephosphorylation | ↑ | MTM1 (3.2) |
| ↓ | PPP3CA (−3.1),
RNGTT (−3.4), TNS3 (−3.6), PTPRM (−3.7), PTPRK (−4.6), DNAJC6
(−6.3) |
| ER to Golgi
vesicle-mediated transport | ↓ | SEC23B (−3.1),
SEC23A (−3.4), SAR1A (−3.5) |
| Axon guidance | ↓ | CAP2 (−3.1), SEMA3F
(−3.2), EVL (−3.3), CLASP2 (−3.6), COL5A1 (−3.6), MAPK8IP3 (−3.6),
PTPRM (−3.7), ROBO1 (−4.1), EGFR (−6.3), APBB2 (−12.8) |
| G protein signaling
pathways | ↓ | PPP3CA (−3.1),
GNB1(−3.2), PRKACB (−3.5), PDE4B (−3.5), PRKCA (−3.6), GNB5 (−7.7),
PDE1A (−12.4) |
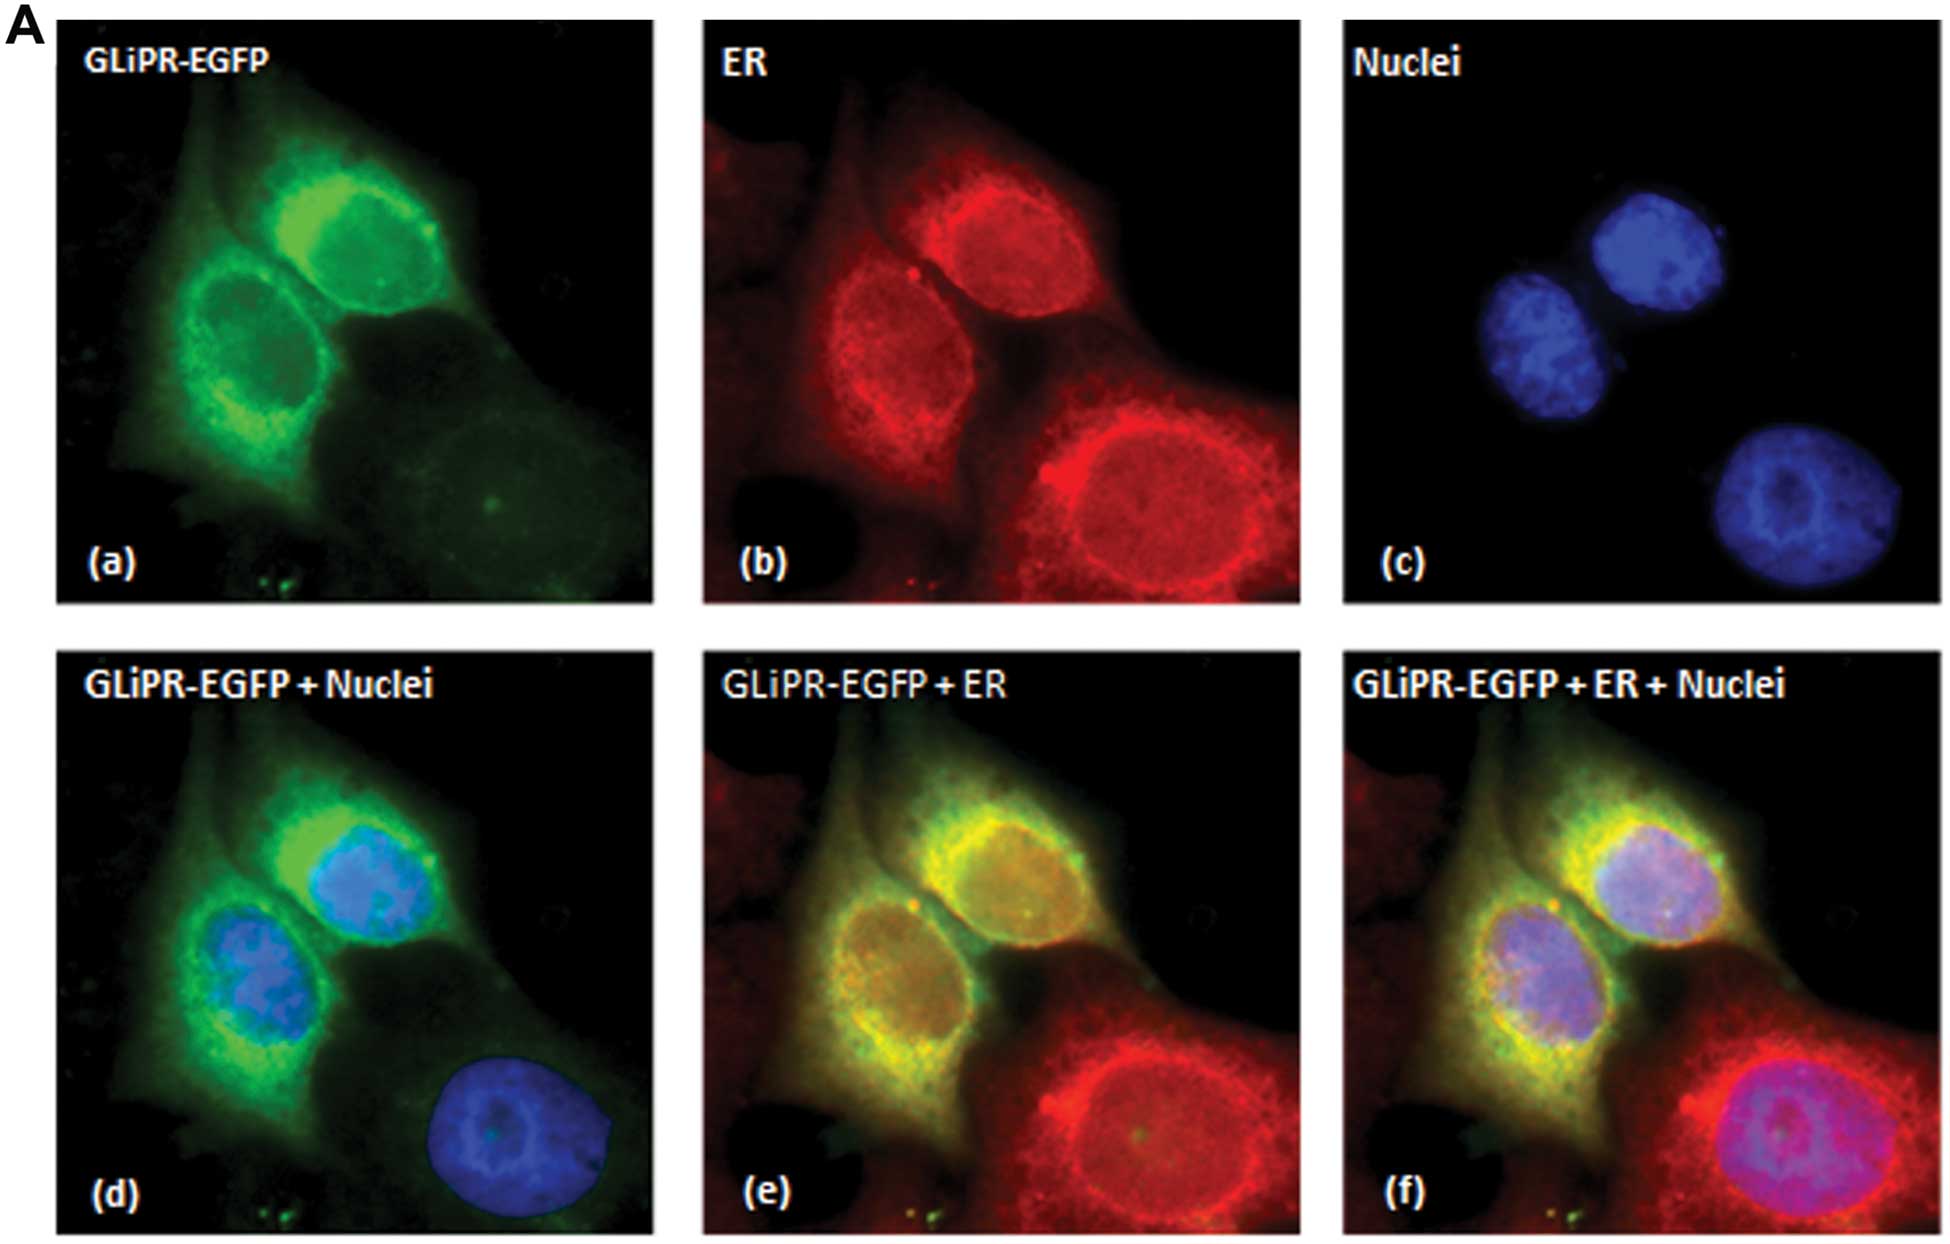
Subcellular localization of GliPR1
In order to ascertain a possible function of GliPR1,
its subcellular localization was studied. Confocal immune
fluorescence microscopy was employed to determine the subcellular
localization of GliPR1. Therefore, GliPR1 was expressed as an EGFP
fusion protein emitting green fluorescence (Fig. 2). The nuclei were contrasted with
DAPI dye showing no nuclear localization of GliPR1. The ER was
stained with a specific antibody against PDI and subsequently with
a secondary antibody labeled with fluorophore Alexa-594. Exogenous
expression of GliPR1 prompted apoptosis in ~25–35% of HeLa cells
after 24 h according to Annexin V testing (data not shown). The
confocal microscopy of cells without apoptotic morphology showed a
diffuse EGFP staining in the cytosole with intensified staining
around the nuclei (Fig. 2A). The
PDI staining (marker of ER) in red showed a similar pattern. When
the 3 fluorophores were analyzed by confocal microscopy
simultaneously, the red and green fluorescence became mostly yellow
indicating a co-localization of GliPR1 with the ER. Another cell
fraction revealed a vesicular pattern of green staining that was
not superimposable with the red fluorescence (Fig. 2B). This pattern suggests a
distribution of GliPR1 in cytoplasmic vesicles.
Expression pattern of GliPR1 in
leukemias
We questioned whether GliPR1 expression is
associated with specific leukemia types. The analysis was performed
in silico. A dataset based on a microarray analysis of bone
marrow samples of 2,096 hematological patients and controls in
total (14) was employed. Bone
marrow samples (n=542) of patients with AML prior to therapy
revealed a significantly increased GliPR1 expression level compared
to 73 subjects without leukemia and healthy bone marrow
(P<0.001) (Fig. 3A). In
contrast, 134 bone marrow samples of ALL at diagnosis prior to
therapy had a significantly decreased level of GliPR1 expression
compared with the control group (P<0.001). The subsets of
patients with chronic lymphocytic leukemia (CLL) and chronic
myeloid leukemia (CML) showed a slight decrease in GliPR1
expression (fold-changes, >0.7), although formally significantly
different from the control group (CLL, P=0.008; CML, P=0.001).
GliPR1 expression in the subset of patients with myelodysplastic
syndrome (MDS) was not significantly different from the normal
controls (P=0.136).
 | Figure 3Glioma pathogenesis-related protein 1
(GliPR1) expression in leukemias, acute myeloid leukemia (AML)
subgroups and acute lymphoblastic leukemia (ALL) subgroups. (A)
GliPR1 expression was analyzed in the public Leukemia Gene Atlas
platform in the dataset published by Haferlach et
al(14) comparing ALL (n=134),
AML (n=542), chronic lymphocytic leukemia (CLL; n=448), CML (n=76)
and myelodysplastic syndrome (MDS; n=207) subgroups with
non-leukemia bone marrow controls (n=73). (B) The dataset published
by Verhaak et al(15) was
evaluated in regard to GliPR1 expression in FAB classes M0 (n=16),
M1 (n=95), M2 (n=106), M3 (n=24), M4 (n=79), M4E (n=5), M5 (n=104)
and M6 (n=6). (C) The dataset published by Haferlach et
al(14) was used to determine
GliPR1 expression levels in AML subgroups with abnormal karyotypes
t(8;21) (n=40), t(15;17) (n=37), t(11q23) (n=38), inv(16) or t(16;16) (n=28), complex karyotype
(n=52) and normal karyotype (n=347). The healthy control group
(n=73) was plotted as reference. (D) Boxplot shows the GliPR1
expression patterns of ALL patients with the abnormal karyotypes
hyperdiploid (n=40), t(1;19) (n=36) and t(12;21) (n=58) compared to
the healthy controls (n=73) from the Haferlach et
al(14) dataset. |
Furthermore, we investigated whether GliPR1
expression levels were associated with specific subgroups of AML.
The dataset of Verhaak et al(15) revealed clear GliPR1 expression
differences between different FAB types (P<0.001) (Fig. 3B). FAB types M4, M4E and M5 were
characterized by high expression values compared to the other FAB
groups. We employed the Haferlach et al(14) dataset again to study the effect of
AML-specific chromosomal abnormalities on GliPR1 expression.
Particularly, AML patients with translocation t(15;17) or inversion
inv(16) showed an increased
expression compared to the non-leukemia controls (P<0.001)
(Fig. 3C), which is in line with
the findings from the Verhaak et al(15) dataset.
Comparison of ALL samples (Fig. 3D) that had abnormal karyotypes with
non-leukemia controls using the Haferlach et al(14) dataset revealed a significant
decrease in GliPR1 expression in ALL samples with translocation
t(1;19) (P<0.001) and in ALL samples with translocation t(12;21)
(P<0.001). Hyperdiploid ALL samples did not show altered GliPR1
expression (14–16).
Discussion
We characterized GliPR1 in regard to its cellular
localization and effect on the cellular gene expression pattern.
GliPR1 was found to be localized in the ER and in cytoplasmic
vesicles. Notably, knockdown of GliPR1 resulted in downregulation
of gene products related to the ER-to-Golgi vesicle-mediated
transport, one of the GO categories overrepresented by the
allocated differentially expressed genes. The other
over-represented GO categories included G protein signaling
pathways, regulation of cyclin-dependent protein kinase activity,
axon guidance and dephosphorylation. Of note, published microarray
data from various leukemia types revealed an increased GliPR1
expression in AML and a decreased GliPR1 expression in ALL when
compared to normal bone marrow samples.
GliPR1 was described to have an N-terminal signal
peptide and a C-terminal transmembrane domaine (17). In conjunction with our data, it
appears likely that GliPR1 is a transmembrane protein of the ER and
vesicles emerging from the ER for transport to the Golgi system.
The knockdown of GliPR1 resulted in downregulation of SEC23A,
SEC23B and SAR1A expression, which are core components of the coat
protein complex II (COPII) that is required by newly synthesized
secretory proteins to exit the ER (18). It is conceivable that a knockdown of
GliPR1 is associated with a downregulation of SEC23A, SEC23B and
SAR1A expression, as these proteins are regulated in a coordinated
manner and are functionally linked in the process of vesicle
formation at the ER. Furthermore, myotubularin (MTM1) was the only
upregulated gene among the overrepresented GO categories and is
thus of specific interest. MTM1 has been shown to remodel the
sarcoplasmic reticulum, the specialized ER of skeletal muscle cells
(19). MTM1 has been reported to be
involved in autophagy (vesicular trafficking pathway for protein
degradation) (20). These
observations may raise the question whether GliPR1 and MTM1 are
involved in opposing cellular processes.
Expression of β-amyloid precursor protein-binding
family B member 2 (APBB2, FE65L1) was most markedly decreased
(1/12.8) following knockdown of GliPR1. APBB2 has been reported to
be involved in the regulation of apoptosis (21) and differentiation of human embryonic
stem cells into neuronal precursor cells (22). Furthermore, APBB2 has been
associated with neurodegeneration such as in Alzheimer’s disease
(23). Perturbations of APBB2
splicing were found to be involved in cell cycle control and DNA
damage response leading to cell transformation and
tumorigenesis.
One of the most marked modifications of gene
expression following knockdown of GliPR1 was the downregulation of
PDE1A. It has been demonstrated that PDE1A inhibition exerts an
anti-proliferative effect on melanoma cells (24). GliPR1 may be an upstream
transcriptional effector of tumor proliferation in this
respect.
It is intriguing that GliPR1 was shown to be
upregulated and oncogenic in gliomas and glioblastomas (8), while being downregulated and a tumor
suppressor in prostate cancer cells (4–7). The
upregulation of GliPR1 (RTVP-1) was described to be regulated by
PKC via SRF affecting glioma cell migration (25). We observed an overexpression of
GliPR1 in AML bone marrow samples of newly diagnosed leukemia prior
to chemotherapy. The upregulation was very specific to AML as
compared to MDS, CML and CLL, which showed normal expression and as
opposed to ALL, which showed downregulated expression of GliPR1. It
may be hypothesized that GliPR1 exerts a pro-proliferative effect
in the cell type of AML. It should be investigated whether
knockdown of GliPR1 in AML cell lines is associated with inhibition
of cell proliferation and induction of apoptosis. This future
research direction may reveal whether GliPR1 should be
characterized further as a potential target in AML. In addition, it
may be of interest to elucidate the differential downregulation of
GliPR1 in ALL samples.
In conclusion, GliPR1 is located in the membrane of
the ER, and knockdown of GliPR1 was associated with transcriptional
modifications particularly in the G protein signaling pathway and
in cyclin-dependent kinases. Intriguingly, a leukemia gene
expression database revealed upregulation of GliPR1 in AML and
downregulation in ALL.
Acknowledgements
The present study was supported by grant M53 from
H.W. & J. Hector Stiftung, Mannheim, Germany to Urban
Scheuring. We are very grateful to Sandra Markovic for the
excellent technical assistance.
References
|
1
|
Murphy EV, Zhang Y, Zhu W and Biggs J: The
human glioma pathogenesis-related protein is structurally related
to plant pathogenesis-related proteins and its gene is expressed
specifically in brain tumors. Gene. 159:131–135. 1995. View Article : Google Scholar
|
|
2
|
Rich T, Chen P, Furman F, Huynh N and
Israel MA: RTVP-1, a novel human gene with sequence similarity to
genes of diverse species, is expressed in tumor cell lines of glial
but not neuronal origin. Gene. 180:125–130. 1996. View Article : Google Scholar : PubMed/NCBI
|
|
3
|
Gingras MC and Margolin JF: Differential
expression of multiple unexpected genes during U937 cell and
macrophage differentiation detected by suppressive subtractive
hybridization. Exp Hematol. 28:65–76. 2000. View Article : Google Scholar
|
|
4
|
Naruishi K, Timme TL, Kusaka N, et al:
Adenoviral vector-mediated RTVP-1 gene-modified tumor cell-based
vaccine suppresses the development of experimental prostate cancer.
Cancer Gene Ther. 13:658–663. 2006. View Article : Google Scholar : PubMed/NCBI
|
|
5
|
Ren C, Li L, Goltsov AA, et al: mRTVP-1, a
novel p53 target gene with proapoptotic activities. Mol Cell Biol.
22:3345–3357. 2002. View Article : Google Scholar : PubMed/NCBI
|
|
6
|
Ren C, Li L, Yang G, et al: RTVP-1, a
tumor suppressor inactivated by methylation in prostate cancer.
Cancer Res. 64:969–976. 2004. View Article : Google Scholar : PubMed/NCBI
|
|
7
|
Satoh T, Timme TL, Saika T, et al:
Adenoviral vector-mediated mRTVP-1 gene therapy for prostate
cancer. Hum Gene Ther. 14:91–101. 2003. View Article : Google Scholar : PubMed/NCBI
|
|
8
|
Rosenzweig T, Ziv-Av A, Xiang C, et al:
Related to testes-specific, vespid, and pathogenesis protein-1
(RTVP-1) is overexpressed in gliomas and regulates the growth,
survival, and invasion of glioma cells. Cancer Res. 66:4139–4148.
2006. View Article : Google Scholar : PubMed/NCBI
|
|
9
|
Chilukamarri L, Hancock AL, Malik S, et
al: Hypomethylation and aberrant expression of the glioma
pathogenesis-related 1 gene in Wilms tumors. Neoplasia. 9:970–978.
2007. View Article : Google Scholar : PubMed/NCBI
|
|
10
|
Capalbo G, Müller-Kuller T, Dietrich U,
Hoelzer D, Ottmann OG and Scheuring UJ: Inhibition of HIV-1
replication by small interfering RNAs directed against glioma
pathogenesis-related protein (GliPR) expression. Retrovirology.
7:262010. View Article : Google Scholar : PubMed/NCBI
|
|
11
|
Szyperski T, Fernández C, Mumenthaler C
and Wüthrich K: Structure comparison of human glioma
pathogenesis-related protein GliPR and the plant
pathogenesis-related protein P14a indicates a functional link
between the human immune system and a plant defense system. Proc
Natl Acad Sci USA. 95:2262–2266. 1998. View Article : Google Scholar
|
|
12
|
Scheuring UJ, Pfeifer H, Wassmann B, et
al: Early minimal residual disease (MRD) analysis during treatment
of Philadelphia chromosome/Bcr-Abl-positive acute lymphoblastic
leukemia with the Abl-tyrosine kinase inhibitor imatinib (STI571).
Blood. 101:85–90. 2003. View Article : Google Scholar
|
|
13
|
Hebestreit K, Gröttrup S, Emden D, et al:
Leukemia Gene Atlas - a public platform for integrative exploration
of genome-wide molecular data. PLoS One. 7:e391482012. View Article : Google Scholar : PubMed/NCBI
|
|
14
|
Haferlach T, Kohlmann A, Wieczorek L, et
al: Clinical utility of microarray-based gene expression profiling
in the diagnosis and subclassification of leukemia: report from the
International Microarray Innovations in Leukemia Study Group. J
Clin Oncol. 28:2529–2537. 2010. View Article : Google Scholar
|
|
15
|
Verhaak RG, Wouters BJ, Erpelinck CA, et
al: Prediction of molecular subtypes in acute myeloid leukemia
based on gene expression profiling. Haematologica. 94:131–134.
2009. View Article : Google Scholar : PubMed/NCBI
|
|
16
|
Kohlmann A, Bullinger L, Thiede C, et al:
Gene expression profiling in AML with normal karyotype can predict
mutations for molecular markers and allows novel insights into
perturbed biological pathways. Leukemia. 24:1216–1220. 2010.
View Article : Google Scholar : PubMed/NCBI
|
|
17
|
Gibbs GM, Roelants K and O’Bryan MK: The
CAP superfamily: cysteine-rich secretory proteins, antigen 5, and
pathogenesis-related 1 proteins - roles in reproduction, cancer,
and immune defense. Endocr Rev. 29:865–897. 2008. View Article : Google Scholar : PubMed/NCBI
|
|
18
|
Tao J, Zhu M, Wang H, et al: SEC23B is
required for the maintenance of murine professional secretory
tissues. Proc Natl Acad Sci USA. 109:E2001–E2009. 2012. View Article : Google Scholar : PubMed/NCBI
|
|
19
|
Amoasii L, Hnia K, Chicanne G, et al:
Myotubularin and PtdIns3P remodel the sarcoplasmic reticulum in
muscle in vivo. J Cell Sci. 126:1806–1819. 2013. View Article : Google Scholar : PubMed/NCBI
|
|
20
|
Fetalvero KM, Yu Y, Goetschkes M, et al:
Defective autophagy and mTORC1 signaling in myotubularin null mice.
Mol Cell Biol. 33:98–110. 2013. View Article : Google Scholar : PubMed/NCBI
|
|
21
|
Lange A, Thon L, Mathieu S and Adam D: The
apoptosis inhibitory domain of FE65-like protein 1 regulates both
apoptotic and caspase-independent programmed cell death mediated by
tumor necrosis factor. Biochem Biophys Res Commun. 335:575–583.
2005. View Article : Google Scholar : PubMed/NCBI
|
|
22
|
Porayette P, Gallego MJ, Kaltcheva MM,
Bowen RL, Vadakkadath Meethal S and Atwood CS: Differential
processing of amyloid-beta precursor protein directs human
embryonic stem cell proliferation and differentiation into neuronal
precursor cells. J Biol Chem. 284:23806–23817. 2009. View Article : Google Scholar
|
|
23
|
Penna I, Vassallo I, Nizzari M, et al: A
novel snRNA-like transcript affects amyloidogenesis and cell cycle
progression through perturbation of Fe65L1 (APBB2) alternative
splicing. Biochim Biophys Acta. 1833:1511–1526. 2013. View Article : Google Scholar : PubMed/NCBI
|
|
24
|
Abusnina A, Keravis T, Yougbaré I, Bronner
C and Lugnier C: Anti-proliferative effect of curcumin on melanoma
cells is mediated by PDE1A inhibition that regulates the epigenetic
integrator UHRF1. Mol Nutr Food Res. 55:1677–1689. 2011. View Article : Google Scholar : PubMed/NCBI
|
|
25
|
Ziv-Av A, Taller D, Attia M, et al: RTVP-1
expression is regulated by SRF downstream of protein kinase C and
contributes to the effect of SRF on glioma cell migration. Cell
Signal. 23:1936–1943. 2011. View Article : Google Scholar : PubMed/NCBI
|