Introduction
Carcinomas of the head and neck represent the sixth
most frequent cancer worldwide, and at least 90% of them are
squamous cell carcinomas (1). The
overall 5-year survival rate for patients with head and neck
squamous cell carcinomas (HNSCC) is among the lowest of the major
cancers and has not improved dramatically in the past years
(2,3). Adenoid cystic carcinoma (ACC) of the
head and neck is a tumor derived from the major and minor salivary
glands and it accounts for around 10% of all salivary gland
neoplasms, 22% of all salivary gland malignancies and ~1% of all
head and neck malignancies (4). ACC
is an uncommon tumor and its progression is a complex process that
includes malignant transformation, proliferation, invasion, and
metastasis of cancer cells and a high rate of local recurrence and
the delayed onset of distant hematogenous metastases, especially
with a high incidence of distant metastasis (DM) to the lung
(5), approximately 40–60% of
patients with ACC develop distant metastases to lungs, bone or soft
tissues. Thus, distant failure remains a significant obstacle in
the long-term cure of patients with ACC emphasizing the need for a
better understanding of the biological factors associated with this
malignancy (6). The molecular
mechanism of the metastasis development is poorly understood,
largely because the metastasis is a complex process involving
several distinct steps such as escape from primary tumor,
dissemination through the circulation, lodgment in small vessels at
distinct sites, penetration of the vessel wall and growth in the
new site as a secondary tumor (7).
Most deaths from salivary ACC are caused by lung metastases that
are resistant to conventional therapy. Therefore, the development
of new treatment strategies for the primary tumor and for
metastatic lesions remains a challenge. Although reasons for the
invasiveness and aggressive metastatic dissemination of ACCs remain
unclear, there is some research suggesting that angiogenesis may be
a possible mechanism involved (8).
Cancer/testis antigens (CTAs) comprise the largest
family of tumor antigens, of which >40 have now been identified,
are encoded by genes that are normally expressed only in the human
germ line, but are also expressed in various tumor types, including
melanoma, and carcinomas of the bladder, lung and liver. CTAs are
also being evaluated for their role in oncogenesis - recapitulation
of portions of the germline gene-expression programme might
contribute characteristic features to the neoplastic phenotype,
including immortality (9). In
recent years several CTAs, includingMAGE-A1, MAGE-A3, NY-ESO-1,
SSX2 and XAGE-1b, were found in lung tumors (10–13),
making it possible to apply CTA based immunotherapy to the
treatment of lung cancer (14,15).
XAGE-1 was identified originally as a PAGE/GAGE related gene on the
X chromosome by expressed sequence tag (EST) analysis (16). Studies of XAGE-1 expression revealed
that the gene is a CTA and it has been shown since to be expressed
in metastatic melanoma, Ewing’s sarcoma and some epithelial tumors,
including those of the breast and lung (17–19).
Among the four splice variants of XAGE-1 (XAGE-1a, b, c and d),
XAGE-1b is regarded as the most immunogenic, capable of eliciting
cellular and humoral immune responses. It is also highly expressed
in lung adenocarcinoma; thus, XAGE-1b is one of the most promising
targets for lung adenocarcinoma immunotherapy (20,21).
There is no report of research on the specific tumor marker or the
gene connected with migration of ACC, but there are some IHC
results which showed some correlation between protein kinase K,
laminin, fibronectin, keratin14, S-100 protein, P16 and P27 and the
pathologic stage or migration of ACC (3). The investigation focusing on the
migration of ACC based on the molecular level have begun (4,6), but
there are no studies on the mechanism on its migration at more high
tendency so far to our knowledge.
The eukaryotic overexpression XAGE-1b vector was
constructed, and the screened stably expressed cells were used for
the study of proliferation and migration phenotype in vivo
and in vitro. We constructed and screened the shRNA
expression vector for interfering with XAGE-1b expression in ACC-M
cells. The proliferation phenotype of ACC-M cells was observed with
XAGE-1b downregulation, and found both in vivo and in
vitro. The ACC-M cell proliferation in vitro and
subcutaneous tumors of nude mice were inhibited through interfering
XAGE-1b gene expression, ACC-2 cells with overexpression of XAGE-1b
showed more rapid proliferation and transmembrane and migration
in vivo and in vitro, with more angiogenesis. All the
above results indicated that XAGE-1b influenced the angiogenesis
directly or indirectly, and it led to migration. Therefore, the
correlation between XAGE-1b expression and lung metastases of ACC
was proven. The results may contribute to treatment of ACC focusing
on XAGE-1b as a drug target.
Materials and methods
Design and synthesis of the primers
Eukaryotic expression vector of pE-Xb which only
expressed XAGE-1b protein was constructed from pEGFP-N1, and
pEGFP-XP-GFP constructed from pEGFP-N1 is a fusion protein
expression vector combining with GFP. All the primer sequences are
shown in Table I. The shRNA
expression vector especially interfering with XAGE-1b expression
was designed and constructed to pGCsi-U6/Neo/RFP. All the single
oligo nucleotide sequences are shown in Table II. The primers used for detecting
XAGE-1b and GAPDH expression by RT-PCR are shown in Table III.
 | Table IThe primers of XAGE-1b expression
vector. |
Table I
The primers of XAGE-1b expression
vector.
| Construction of
vector | Primer | Primer
sequences | Plasm | Restriction
sites |
|---|
| pE-Xb | GN-1B-F |
5′-TCGACTCGAGATGGAGAGCCCCAAAAAGAAGA
3′ | pEGFP-N1 | XhoI |
| GN-1B-R |
5′-CGCGGATCCTCATTAAACTTGTGGTTGCTCTTCAC-3′ | | EcoRI |
| pEGFP-Xb-GFP | GN-1B-F |
5′-TCGACTCGAGATGGAGAGCCCCAAAAAGAAGA-3′ | pEGFP-N1 | XhoI |
| GN-1B-R(G) |
5′-CCGGAATTCGAACTTGTGGTTGCTCTTCAC-3′ | | EcoRI |
| Table IITargeting sequences of XAGE-1b
interfering vector. |
Table II
Targeting sequences of XAGE-1b
interfering vector.
| Plasmid | Construction of
vector | Oligo sequences of
targeting RNAi | Sequences of
palindromic structure | Location of the
targeting transcription |
|---|
| PGC | Sh-a |
5′-AGAACCAGCAGCTGAAAGT-3′ | TTCAAGAGA | 144–163 |
| Sh-b |
5′-GCTGCATCAGTCAAACACC-3′ | TTCAAGAGA | 249–268 |
| Sh-c |
5′-AGCTGAAACAACGCAAGCT-3′ | TTCAAGAGA | 380–399 |
| pG-Negative |
5′-GGCTGCGCATTGCCATAAA-3′ | TTCAAGAGA | - |
| Table IIIThe primer sequences for
semi-quantative PCR detection. |
Table III
The primer sequences for
semi-quantative PCR detection.
| Gene | Primer | Primer
sequences |
|---|
| GAPDH | G real-F |
5′-AGAAGGCTGGGGCTCATTTG-3′ |
| G real-R |
5′-AGGGGCCATCCACAGTCTTC-3′ |
| XAGE-1b | 1b-S |
5′-TACTGAGACACGGCGGAC-3′ |
| 1b-AS |
5′-TTCCATGTCGCGCACTG-3′ |
Construction of recombinant plasmids
To acquire cDNA of XAGE-1b from ACC-M cells and to
amplify the fragments with the primers of GN-1B-F and GN-1B-R, the
fragments were inserted into pEGFP-N1 plasmid pE-Xb expression
vector without GFP fusion. XAGE-1b vectors with GFP fusion were
constructed with the primers, including XAGE-1b, GN-1B-F and
GN-1B-R (G), named pEGFP-Xb-GFP. Negative control vector of
pEGFP-N1 was named pE-Negative. The shRNA for specially interfering
with XAGE-1b was designed and synthesized and constructed into
pGCsi-U6/Neo/RFP vector by Jikai (Shanghai, China). There are three
interfering vectors, including Sh-a, Sh-b and Sh-c, and the
positive control sequence named pG-Positive is designed specially
for interfering with GFP expression, the negative control sequence
(anything except for sequences against any human gene), was named
pG-Negative.
Animals, cell lines and cultures
The nude mice (BALB/c nu/nu) were purchased from the
Animal center of Shanghai, and cultivated in the animal
experimental center of the Second Military Medical University
(Shanghai, China). The human salivary ACC-2, ACC-M, SPC-A1 and 293T
cells used in the study were obtained from American Type Culture
Collection (ATCC, Manassas, VA, USA). ACC-2, ACC-M, SPC-A1 cells
were cultured in RPMI-1640 from Gibco (Langley, OK, USA)
supplemented with 10% fetal bovine serum (FBS) from Sigma (St.
Louis, MO, USA) at 37ºC in a humidified atmosphere of 5%
CO2 in air. 293T cells were cultured in DMEM from Gibco
(Carlsbad, CA, USA) supplemented with 10% FBS. All chemicals needed
for cell culture were purchased from Gibco. The effective fragments
of RNA interfering were chosen based on screening RNA interfering
exogenous expression in 293T cells and SPC-A1 cells.
RNA extraction, cDNA synthesis, and
RT-PCR
Reverse transcription-PCR. Total RNA isolated from
above culture cells was prepared with TRIzol (Invitrogen, Carlsbad,
CA, USA) according to the manufacturer’s instructions. RNA
quantification was done using spectrophotometry. Semi-quantitative
RT-PCR analysis for shRNA interfering expression and the internal
control GAPDH was carried out using ABI PE9600 PCR System. The PCR
products were electrophoresed on 2% agarose gel and stained with
ethidium bromide (Pierce, Rockford, IL, USA). Quantitative reverse
transcription PCR analysis was carried out to understand the
efficacy of the shRNA interfering expression.
Western blot analysis
ACC-2 cells were collected into 1.5 ml Eppendorf
tubes on ice, centrifuged at 800 rpm for 5 min at 4ºC, resuspended
in 100 μl cell lysis buffer containing proteinase inhibitor, and
incubated on ice for half an hour. The lysates were centrifuged at
14000 rpm for 30 min at 4ºC, the supernatants were collected and
stored at −70ºC for electrophoresis. The concentration of protein
sample was determined by the Lowry method. Proteins in conditioned
media were separated by electrophoresis on 15% SDS-PAGE gels and
transferred electrophoretically onto nitrocellulose membranes.
After being blocked for 2 h with 5% skim milk, blots were incubated
with 1:1,000 diluted sheep anti-human antibody XAGE-1b and 1:3000
diluted antibody GAPDH at room temperature overnight. After four
washes with PBST, the membrane was separately incubated with rabbit
anti-sheep antibody at a dilution of 1:2,000 and sheep anti-mouse
antibody GAPDH at a dilution of 1:4,000 for 1 h and 45 min,
respectively. Finally, the protein bands were visualized with an
ECL kit. Quantitative analysis of the blots was performed with an
imaging densitometer and GAPDH as the control. GAPDH served as an
internal control for total cDNA content.
Cell proliferation assay
MTT assay was used for detecting cell proliferation.
The stably expressing cell lines of ACC-2 and ACC-M were cultured
to logarithmic growth phase and synchronized with serum-free medium
for 24 h. All the cells were inoculated on a 96-well plate and
measured four times every 24 h continuously. MTT (10 μl) (Sigma)
was added into the plate, 4 h later, 100 μl DMSO (Sigma) was added
after emptying the cell plate and the OD570 values were
measured with the SpectraMax M5 (Molecular Devices Corp., Concord,
Ontario, Canada). Then the proliferation curve was drawn.
Cloning of cell lines
The stable expression cell lines of ACC-2 and ACC-M
were cultured to logarithmic growth phase and synchronized with
serum-free medium for 24 h. The cells were inoculated onto a 6-well
plate ~500 cells per well with three repeat wells, and cultured
with the G418-free medium. After 14 days, the medium was removed
and washed two times with PBS. Crystal violet (500 μl) was added
into the well and stained for 5 min, then the dye was removed and
washed two times again with PBS.
Transmembrane experiment in vitro
The transmembrane experiment in vitro with
ACC-2 cell line was carried out according to the manufacturer’s
instructions of the QCMTM 24-Well Cell Invasion Assay kit
(Chemicon, Billerica, MA, USA). The transmembrane rate was
calculated according to the experimental results.
Analysis of subcutaneous tumor growth in
vivo of nude mice and lung metastasis
Experimental groups, and amount of cells are list in
Table IV. The nude mice were
divided into three groups. Each cell line was cultured in a bottle
as 2×10⁶ cells, and the activity of cells was measured
by staining with 0.2% Trypan Blue. The cells were synchronized by
replacing with fresh serum-free and double-anti medium overnight
before the inoculation. Cells were digested with 0.25% trypsin and
counted using an automated counter before centrifugation. The
concentration was adjusted to 1×10⁷ cell/ml by
serum-free medium and prepared for injection. Cell suspension (100
μl) as 1×10⁶ cells was injected s.c. into the back or
the tail vein of 4- to 6-week-old female BALB/C nu/nu nude mice.
The condition of tumor and tumorigenesis time was observed and
recorded, the long and short diameter of tumor were measured after
inoculation every three days during the first two weeks and every
other day during the third to the forth week. The formula for
calculating the tumor is 1/2ab2, a being the maximum
diameter and b the minimum diameter of tumor. The nude mice were
photographed and the growth curve was drawn. The mice were
sacrificed 4 weeks later and photographed again, and weighed, and
all were dissected, and tumor tissues were removed. The tumor and
lung tissues with formalin-fixed and paraffin-embedded were
preserved for identification of RNA and DNA.
| Table IVThe groups of subcutaneous
tumorigenesis of the nude mice in vivo. |
Table IV
The groups of subcutaneous
tumorigenesis of the nude mice in vivo.
| Groups | Cell lines | Number of the nude
mice | Amount of cell |
|---|
| ACC-2 cell
subcutaneous | ACC-2-Xb-19 | 5 |
1×10⁶ |
| ACC-2-Xb-M | 5 |
1×10⁶ |
|
ACC-2-pE-Negative | 5 |
1×10⁶ |
| ACC-2 | 5 |
1×10⁶ |
| ACC-M cell
subcutaneous | ACC-M-pG-Sh-a | 4 |
1×10⁶ |
|
ACC-M-pG-Negative | 4 |
1×10⁶ |
| ACC-M | 4 |
1×10⁶ |
| ACC-2 cell tail
vein | ACC-2-Xb-19 | 6 |
1×10⁶ |
| ACC-2-Xb-M | 6 |
1×10⁶ |
|
ACC-2-pE-Negative | 6 |
1×10⁶ |
| ACC-2 | 6 |
1×10⁶ |
H&E and IHC staining of the tumor
lung tissue, and the microvessel density
H&E staining: All the tumor tissues were fixed
in formalin and embedded in paraffin. Sections (5 μm thick) were
obtained and used for H&E staining. Each section was
photographed at ×200 magnification. IHC staining: Antigen retrieval
was performed on tumor tissue of the XAGE-1b subcutaneous
expression group with formalin-fixed and paraffin-embedded, and
stained with the antibody XAGE-1. Follow-up staining of the
sections were performed by the Ultra Sensitive S-P kit Goat system
and photographed at ×200 and ×400 magnification, respectively.
Counting of the microvessel density of the tumor:
the tumor tissue slides were stained by IHC with antibody CD31
(Zhongshan Co., Beijing, China), and there are specific red-brown
particles precipitated on the surface of vascular endothelial
cells. Five different levels were stained, and two areas at ×200
magnification were randomly selected and photographed. The number
of the stained microvessels and the average number of the
microvessels in five levels represent the microvessel density of
tumor tissue.
Statistical analysis
Data are presented as the means ± SD. Multiple group
comparisons were analyzed by one-way ANOVA after Bonferroni’s
correction. Non-parametric data between two groups was computed by
Chi-square test or Fisher Exact test. The difference of two groups
was determined by Student’s t-test. A P-value of <0.05 was
considered statistically significant.
Results
Promotion effects on the proliferation of
ACC-2 cells with XAGE-1b overexpression in vivo and in vitro
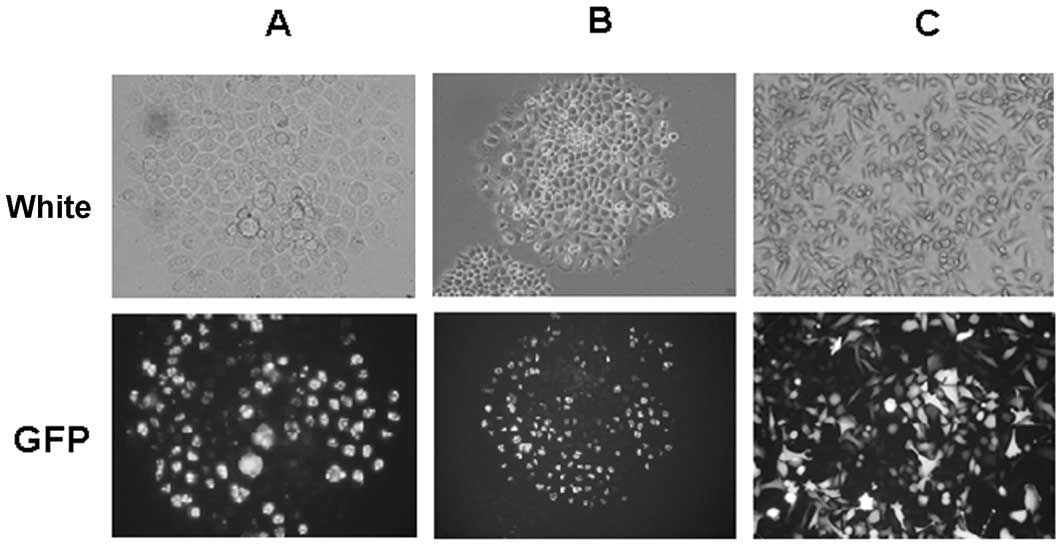
The expression vector, including pE-Xb and
pEGFP-Xb-GFP of XAGE-1b, and the empty vector pE-Negative were
transfected into ACC-2 cells. There are two monoclones after
transfection with pEGFP-Xb-GFP which expressed the fusion protein
of GFP and XAGE-1b. The green fluorescence focused in the nucleus
with the distribution of small points, and the monoclone
ACC-2-pE-Negative, obtained from ACC-2 cells transfected with the
empty vector as the negative control. The monoclonal cell lines
express green fluorescence protein stably and the positive rate
reaches 93% (Fig. 1).
The stable cell clones were obtained by G418
screening after pE-Xb transfection. The nineteenth stable
expression clone showed the maximum value based on XAGE-1b
expression by western blot assay and was named ACC-2-Xb-19
(Fig. 2A, upper image). The
residual G418-resistant cells without cloning were continuously
cultured and named ACC-2-Xb-M. XAGE-1b expression in the cell lines
is different by the semi-quantitative RT-PCT assay, and XAGE-1b
expression in ACC-2-Xb-19 is maximal among the cell lines, XAGE-1b
expression in ACC-2-pE-Negative is minimal (Fig. 2A, lower image), and the expression
in ACC-2-Xb-M is in between the two groups. The above three cell
lines and ACC-2 cells were applied for studying the proliferation
in vivo and in vitro. Based on the MTT assay, the
number of ACC-2-Xb-19 cells increased greatly compared with
ACC-2-pE-Negative after two days of culture (p<0.01, Fig. 2B). The number of mixed expression
ACC-2-Xb-M cells showed the difference in the negative control at
the beginning of the fourth day (p<0.05, Fig. 2B). There are differences among the
three cell lines of the cloning number, and the number of
ACC-2-Xb-19 is almost two times that of the negative control
(Fig. 2C).
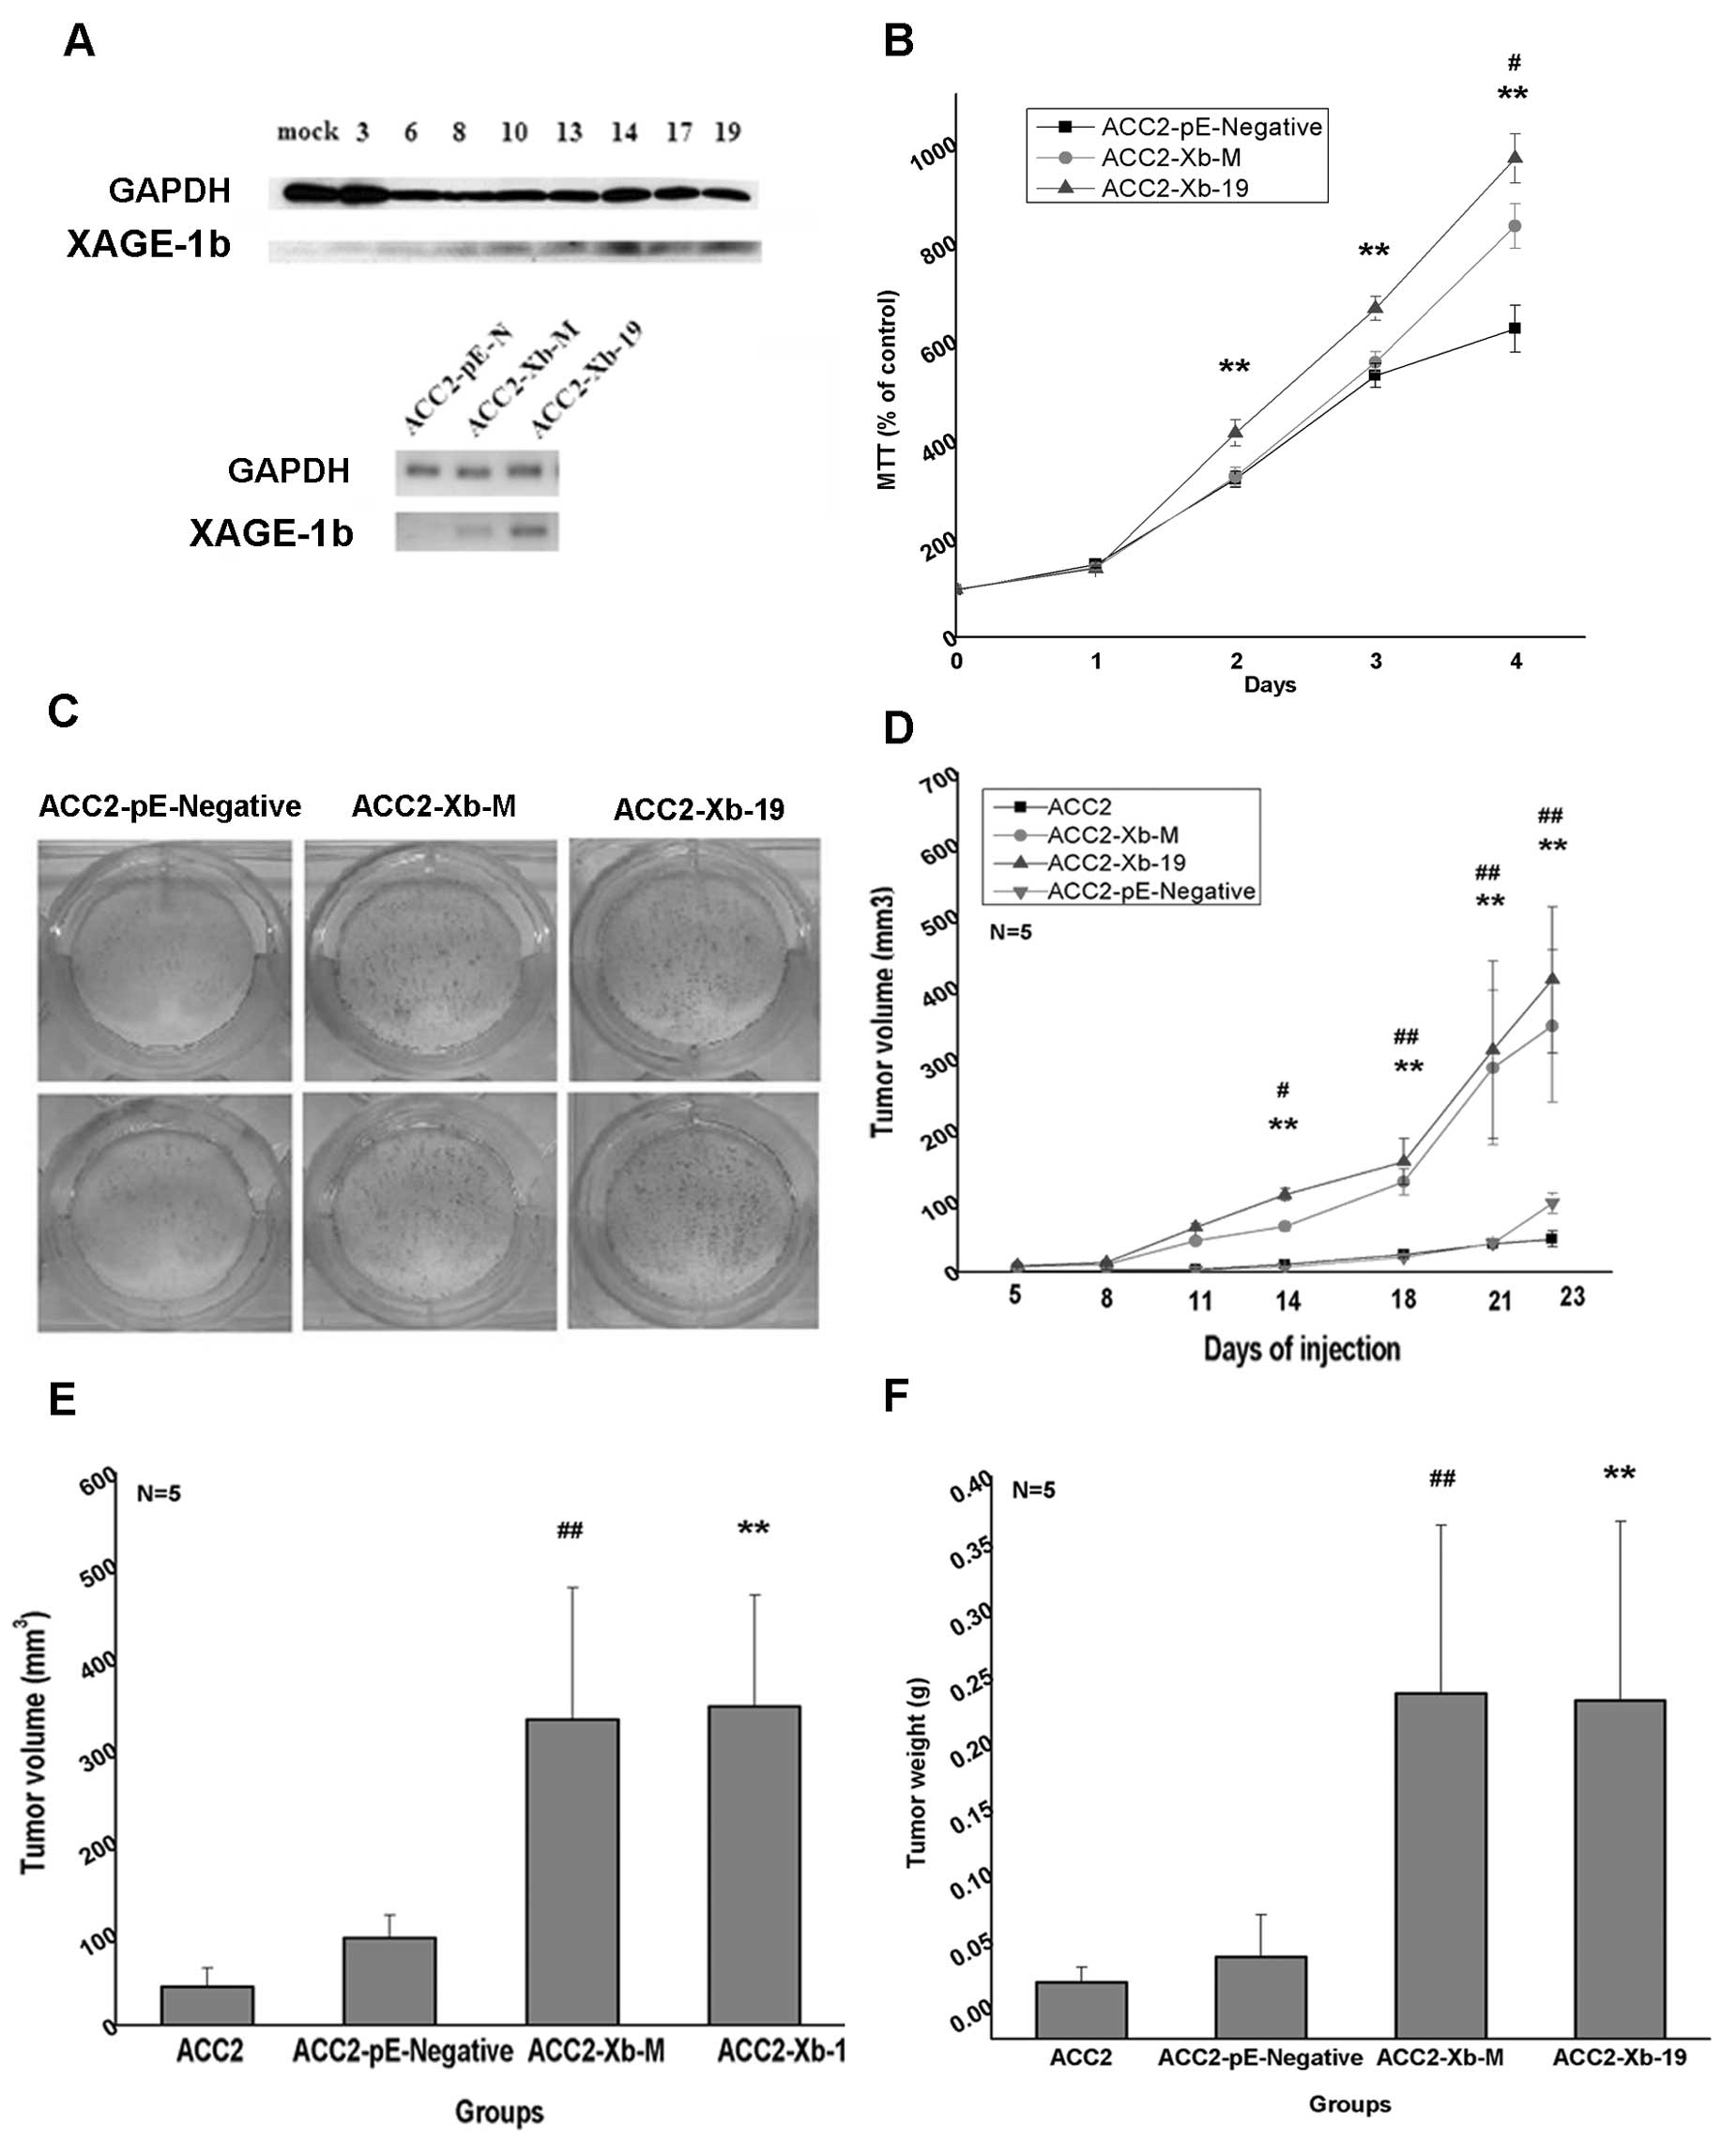 | Figure 2The effect on ACC-2 cell
proliferation in vitro and the subcutaneous proliferation
in vivo of the nude mice with XAGE-1b overexpression. (A)
The results of western blotting and RT-PCR assay. The upper image
is the amounts of XAGE-1b protein expression with pE-Xb and
pE-Negative plasmid transfection, respectively. Mock named
ACC2-pE-N represents the stable cells after empty vector
transfection. The number 3, 6, 8, 10, 13, 14, 17 and 19 represent
the cells with the stable XAGE-1b expression, respectively. The
number 19 clone named ACC2-Xb-19 showed the highest expression
level. GAPDH is the control of the total protein. The lower image
is RNA semi-quantitative result of ACC2-pE-N, ACC2-Xb-19 and
ACC2-Xb-M with G418 resistance after screening. (B) The results of
MTT originated from three independent experiments and three wells
each time. (C) The results of the different clones. (D) The tumor
growth curves. Tumor volume is calculated according to the formula
1/2ab2, a is the maximum diameter and b is the minimum
diameter (mean ± SD, n=5). (E) The comparison of the tumor volume
(mean ± SD, n=5). (F) The comparison of the tumor weight (mean ±
SD, n=5). *Represents the comparison between ACC2-Xb-19
and ACC2-pE-N. #Represents the comparison between
ACC2-Xb-M and ACC2-pE-N, *#, P<0.05, **##,
P<0.01. |
The effects of XAGE-1b on the subcutaneous tumor in
ACC-2 cells were detected in vivo of the nude mice. All
cells with the counts of 1×10⁶, including ACC-2-Xb-19,
ACC-2-Xb-M, ACC-2-pE-Negative and ACC-2, were injected s.c. into
the left back of mice, and the mice were observed and measured once
every three days. The tumors formed in ACC-2-Xb-19 and ACC-2-Xb-M
groups grew rapidly compared with ACC-2-pE-Negative and ACC-2 at
the beginning of the fourteenth day, and the results showed the
difference among the cell lines (Fig.
2D). We found that the average tumor volume of ACC-2-Xb-19, and
ACC-2-Xb-M, was 4–8 times higher than the other two groups, the
ACC-2-pE-Negative and ACC-2 groups (Fig. 2E), and the tumors weight was ~7–11
times that of the control (Fig.
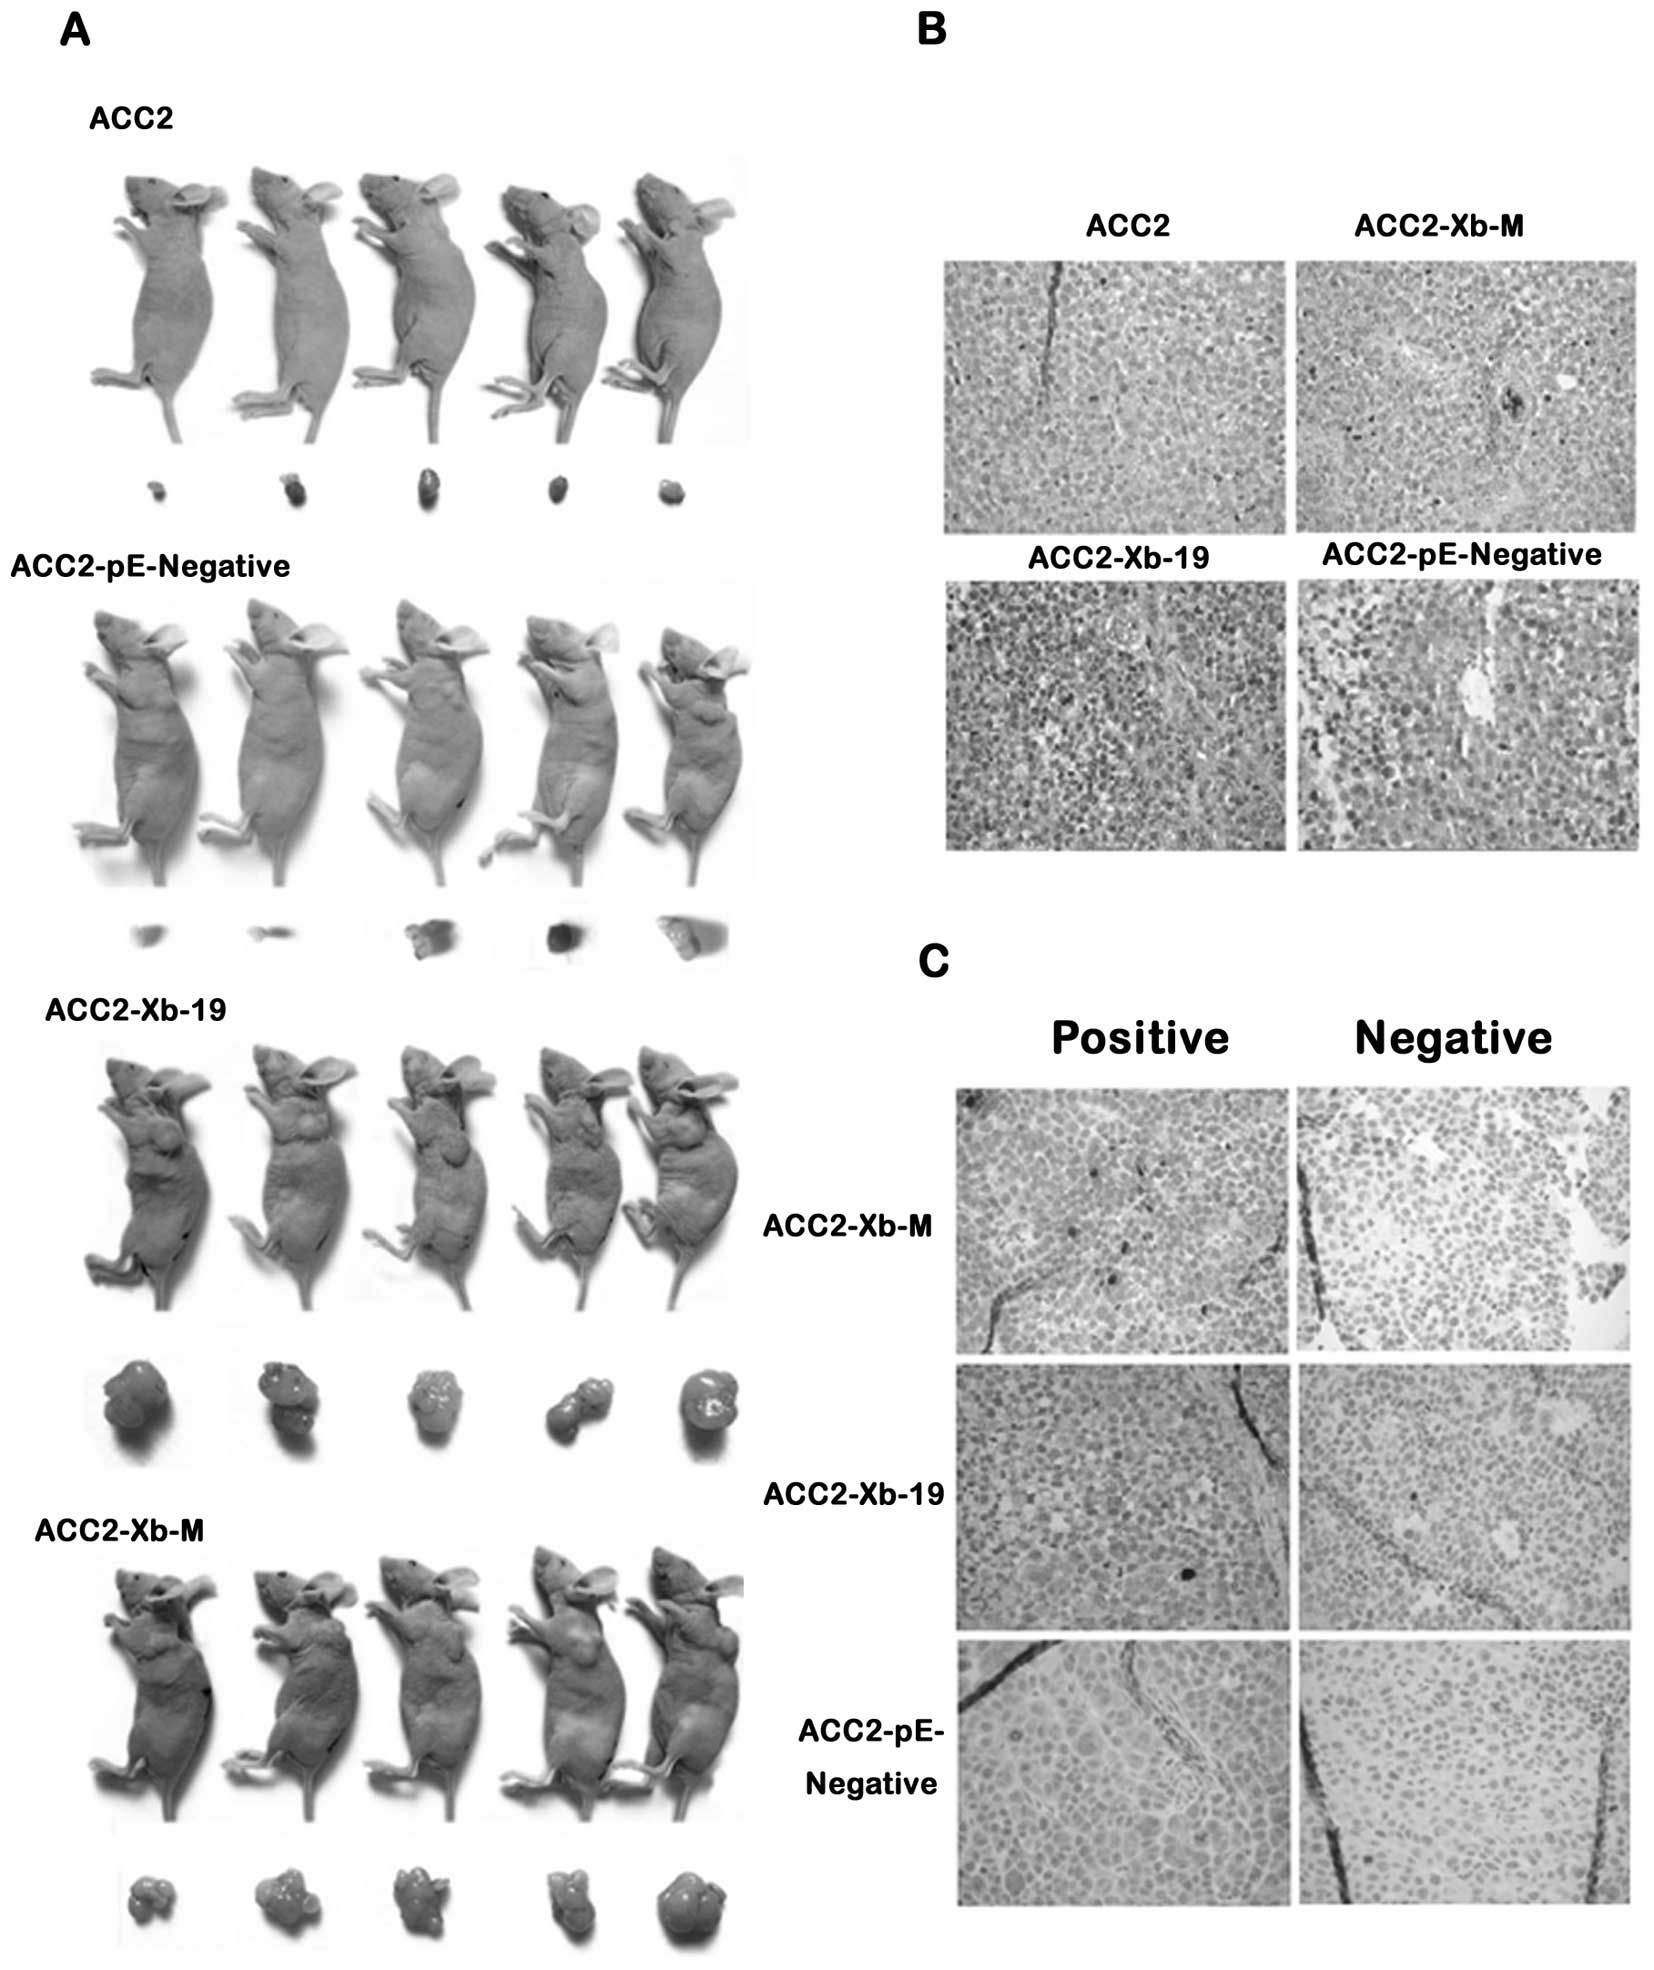
2F). The mice were sacrificed three or four weeks later and the
tumor tissues were weighed with record and photographed in detail
(Fig. 3A). H&E staining of
tumor tissues confirmed t the typical histological features of ACC
(Fig. 3B). XAGE-1b protein with IHC
staining 2was expressed much stronger in ACC-2-Xb-19 and ACC-2-Xb-M
cells (Fig. 3C). The average MVD of
a tumor is 19.8±5.57/field and it is higher than the control,
10.75±1.15/field (p<0.05, Fig. 3D
and E). At ×640 magnification it is very clear that XAGE-1b
staining focused in the nucleus. We detected the CD31 staining and
calculated the microvessel density (MVD) of tumor tissues in each
group to verify the correlation of enhancement between
tumorigenesis and angiogenesis (Fig.
4).
Promotion effects on the transmembrane
invasion in vitro and metastasis in vivo of nude mice with XAGE-1b
overexpression
We detected the transmembrane ability of ACC-2 cells
with XAGE-1b protein expression and other cells by a kit simulating
transendothelium stroma to verify the hypothesis of tumor
metastasis promotion of ACC with XAGE-1b overexpression. The
standard curve was drawn to reflect the correlation between the
amounts of transmembrane cells and the fluorescence intensity
(Fig. 5A). Cells of four groups
were inoculated in three wells, respectively. The amount of
transmembrane cells in ACC-2-Xb-19 is three times that of ACC-2
(p<0.01, Fig. 5B) and the
amounts of transmembrane cells in ACC-2-Xb-M is ~1.5 times that of
ACC-2 (p<0.01, Fig. 5B). There
is no significant difference between ACC-2-pE-Negative and ACC-2.
The data showed that XAGE-1b overexpression promoted the invasion
ability of ACC-2 cells in vitro.
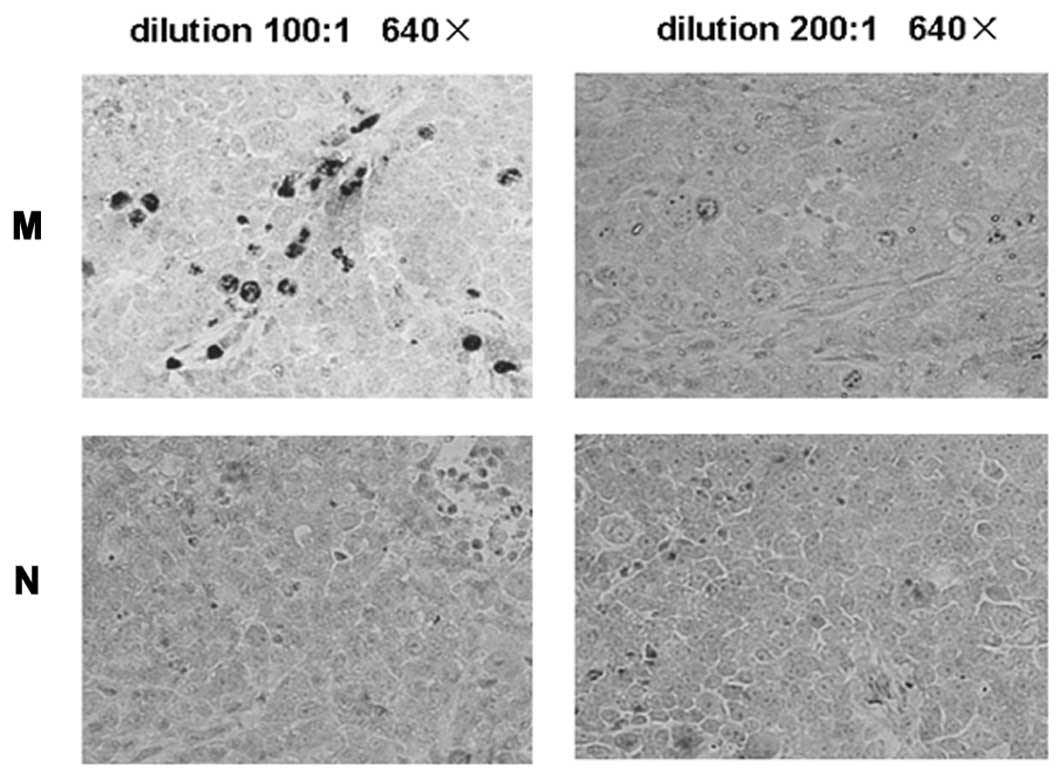
We established the nude mouse model of lung
mestastasis to study the ability of invasion and metastasis
promoted by XAGE-1b in vivo and tested the hypothesis
applying the metastasis rate analysis. All cells, including
ACC-2-Xb-19, ACC-2-Xb-M and ACC-2-pE-Negative, were injected into
the tail vein of the nude mice. The nude mice were sacrificed 56
days later, and the lungs were dissected. The evident tumor nodules
were observed on the lung of two mice in ACC-2-Xb-19 and one in
ACC-2-Xb-M, but there are no nodules in the control (Fig. 5C, the first and second line). The
average metastasis rate was calculated according to the PCR
results. The lung migration based on the molecular level could be
detected whether there was any visualized tumor nodules or not in
ACC-2-Xb-19 and ACC-2-Xb-M, and the average metastasis rate was
0.0475±0.114 (n=6) and 0.0223±0.0491 (n=5), respectively. There was
no migration in the control group of ACC-2-pE-Negative, that is to
say, there was no human gene in the lung tissue of nude mice, and
the average migration rate was ~0.0119±0.0251. The nodules formed
in the lung of ACC-2-Xb-19 and ACC-2-Xb-M were confirmed to be of
the typical tumor tissue features of ACC by H&E staining
(Fig. 5C, the third line), and it
proved the XAGE-1b protein expression in the lung migration by IHC
staining (Fig. 5C, the forth and
fifth line).
Inhibition of proliferation in vitro and
nude mouse subcutaneous tumors of ACC-M cells with interference of
XAGE-1b expression
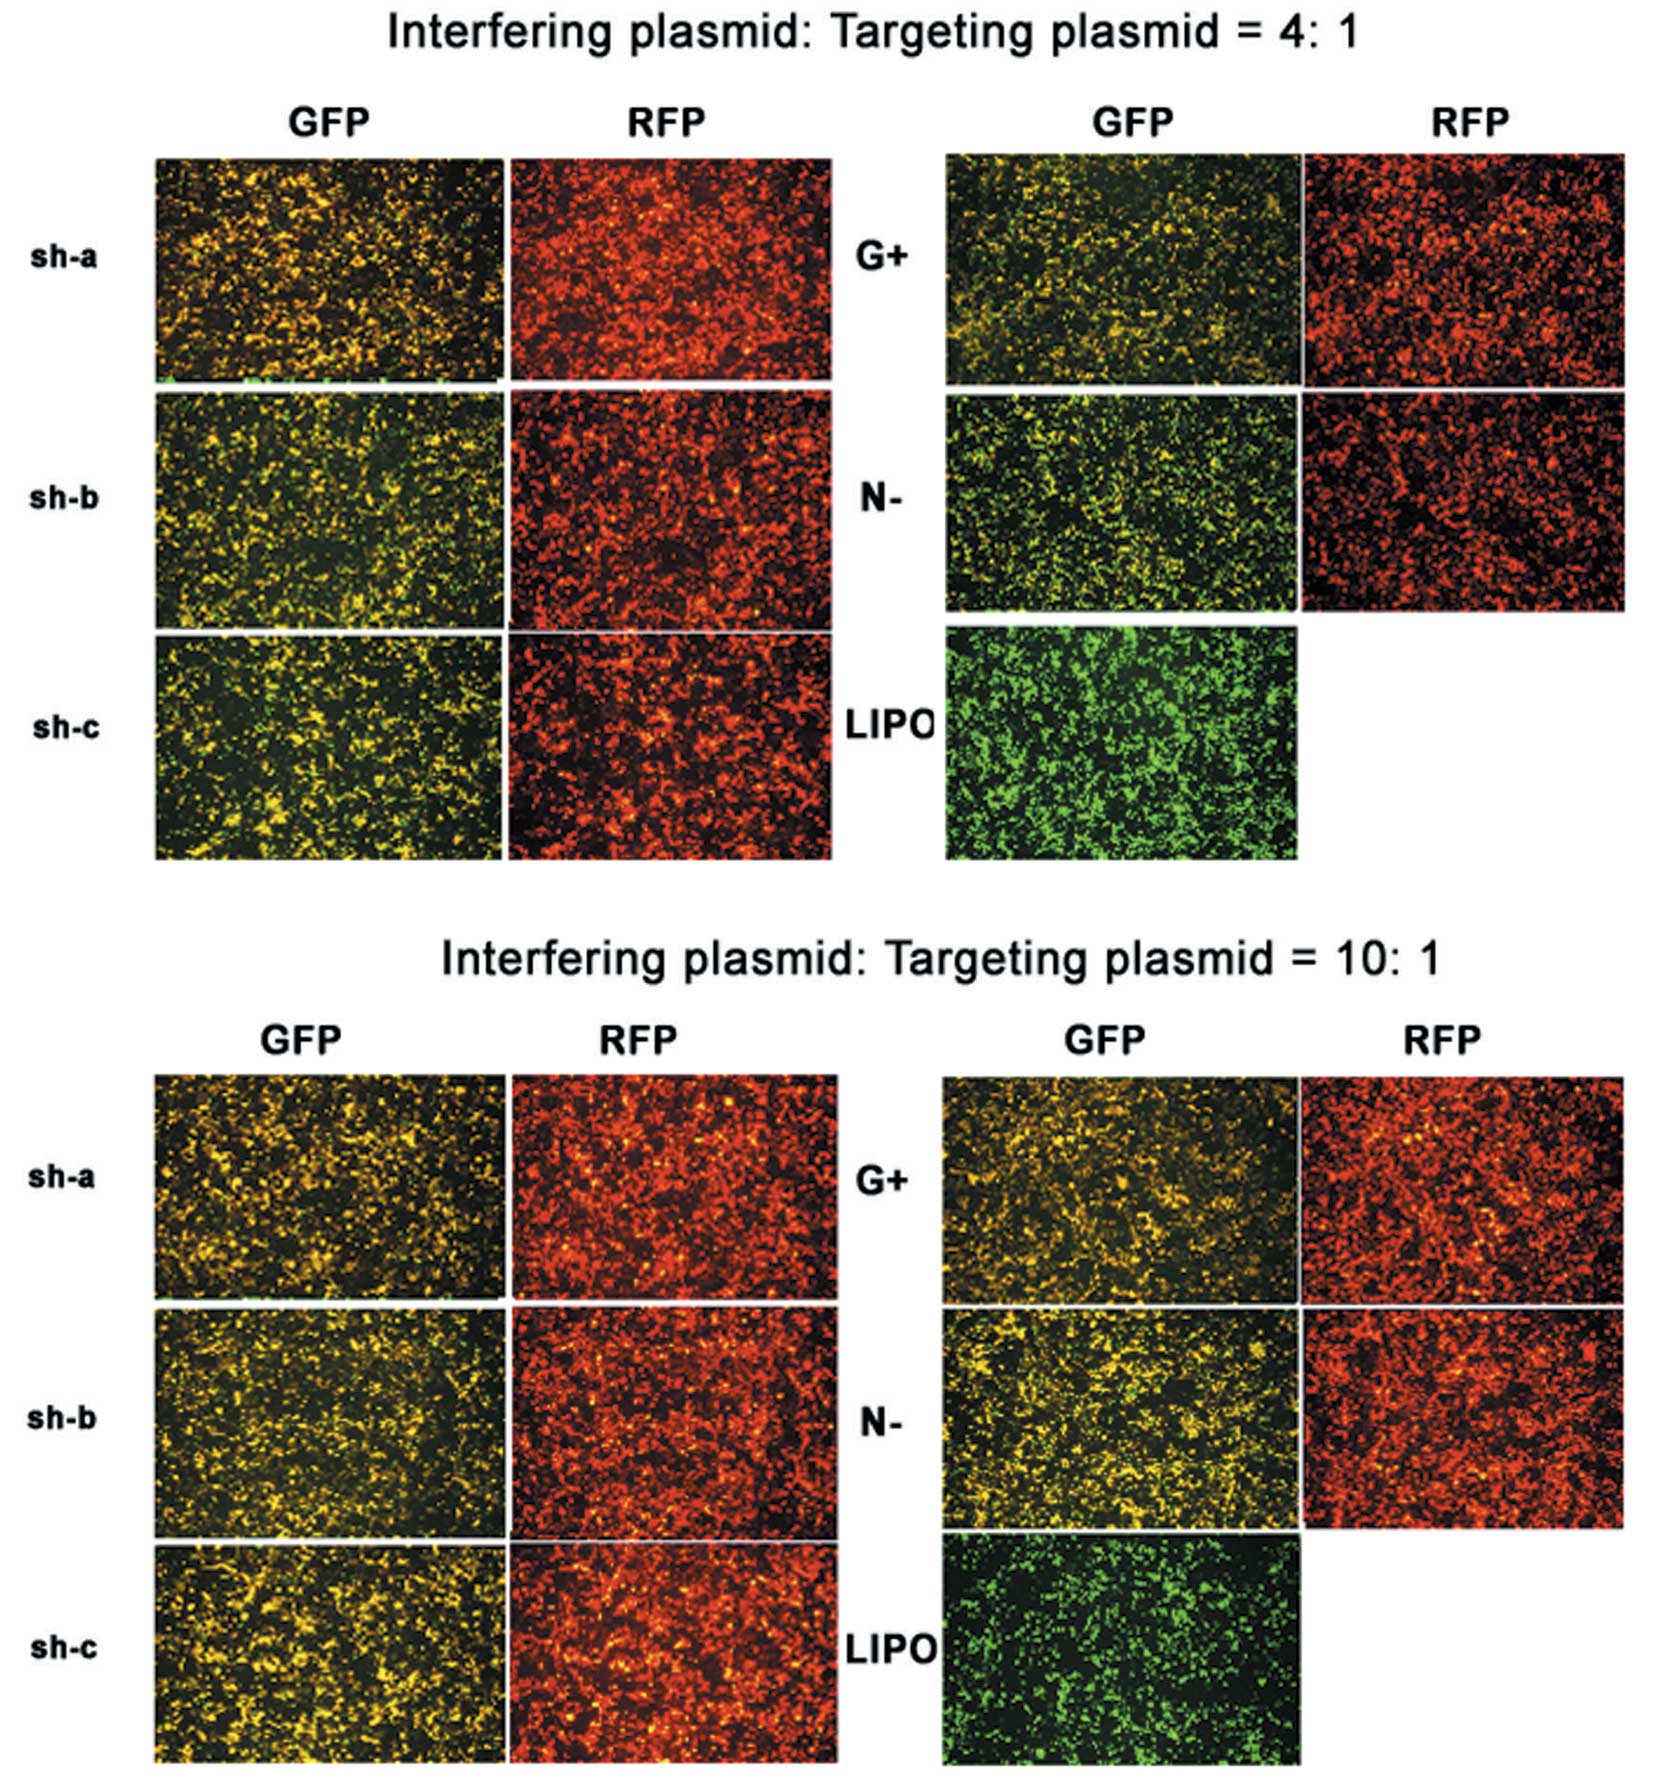
We detected RNA interfering effects on the exogenous
expression of green fluorescence fusion protein by several
candidate vectors. RNA interfering effects were observed through
co-transfecting 293T cells with pG-Sh-a, b, c and pEGFP-Xb-GFP
vector, Lipofectamine 2000 group was regarded as the control
without transfection, pG-Negative and pG-Positive vector
interfering GFP groups were regarded as the positive and negative
control group co-transfecting with pEGFP-XAGE-GFP vector. The
results were observed through the fluorescence microscopy and
photographed 36 h later (Fig. 6).
When the interference with the targeting plasmid ratio is 4:1 and
10:1, the fluorescence intensity of pG-Sh-a group was observed to
decrease greatly close to the positive control group level, pG-Sh-b
group decreased evidently but no more than pG-Sh-a group and
pG-Sh-c groups, the green fluorescence expression is the same as
negative pG-Negative.
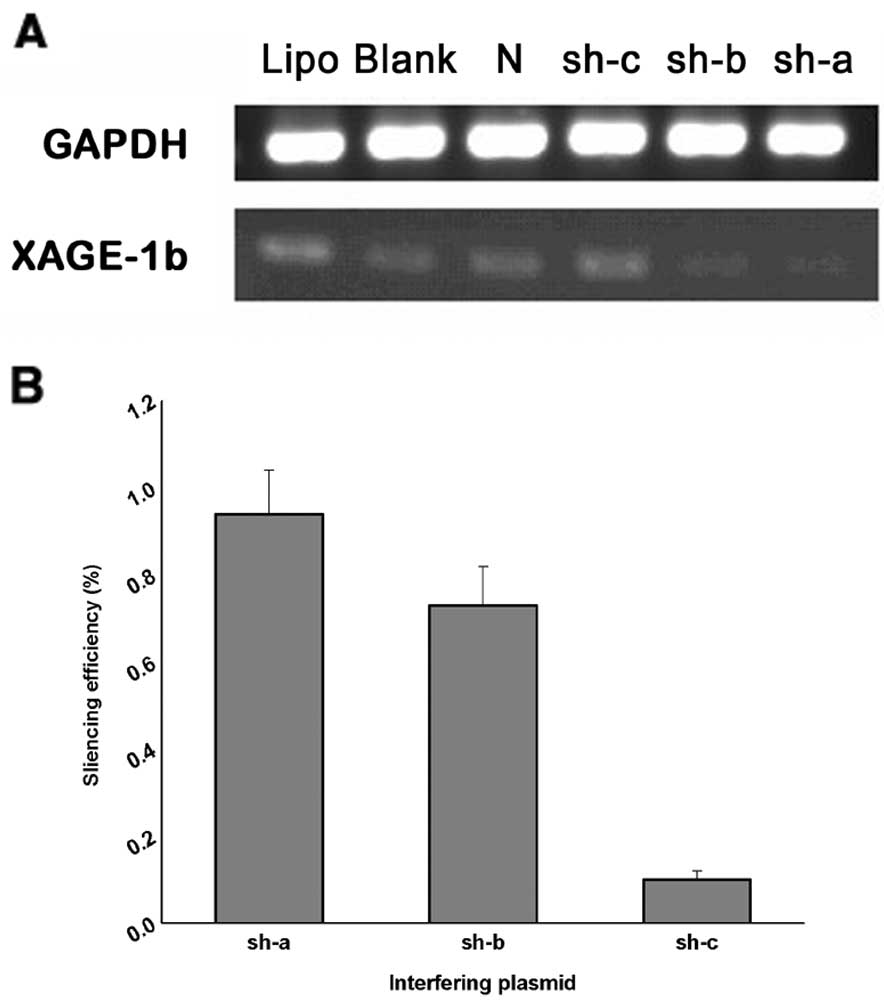
Interference on endogenous expression of XAGE-1b in
SPC-A1 cells was studied in detail. Semi-quantitative RT-PCR was
applied and we found that XAGE-1b expression transfected with the
interfering vector sh-a, and sh-b decreased evidently and was less
than the negative control, empty control and no-transfected vector
group, and the interfering effects were not obvious in the sh-c
group (Fig. 7A). For confirming the
interference rate and selecting the best interfering vector, we
quantitatively and calculated the interfering rate by real-time PCR
method (Fig. 7B). The results
showed that the interference rate of sh-a vector is the highest
among three groups and reach 94%, the others are 73.2% and 10% in
the sh-b and sh-c group, respectively.
The pG-Sh-a vector was chosen to establish the
stable interfering cell strains for the highest interference rate,
the negative control group of plasmid pG-Negative was also
screened. Because of the interfering plasmid with the red
fluorescence protein and linearized operation before transfection,
the expression of red fluorescence protein could be used for
characterizing the integration of the transfected fragment and the
successful expression of the interference sequence, and the cell
clones with the bright red fluorescence protein were chosen as the
stable interfering cell strains. There are two resistance cell
clones with 100% expression of red fluorescence protein in each
group respectively, and one was chosen as the ultimate stable cell
strain named ACC-M-pG-Sh-a and ACC-M-pG-Negative to be used for the
research on proliferation in vitro and in vivo of
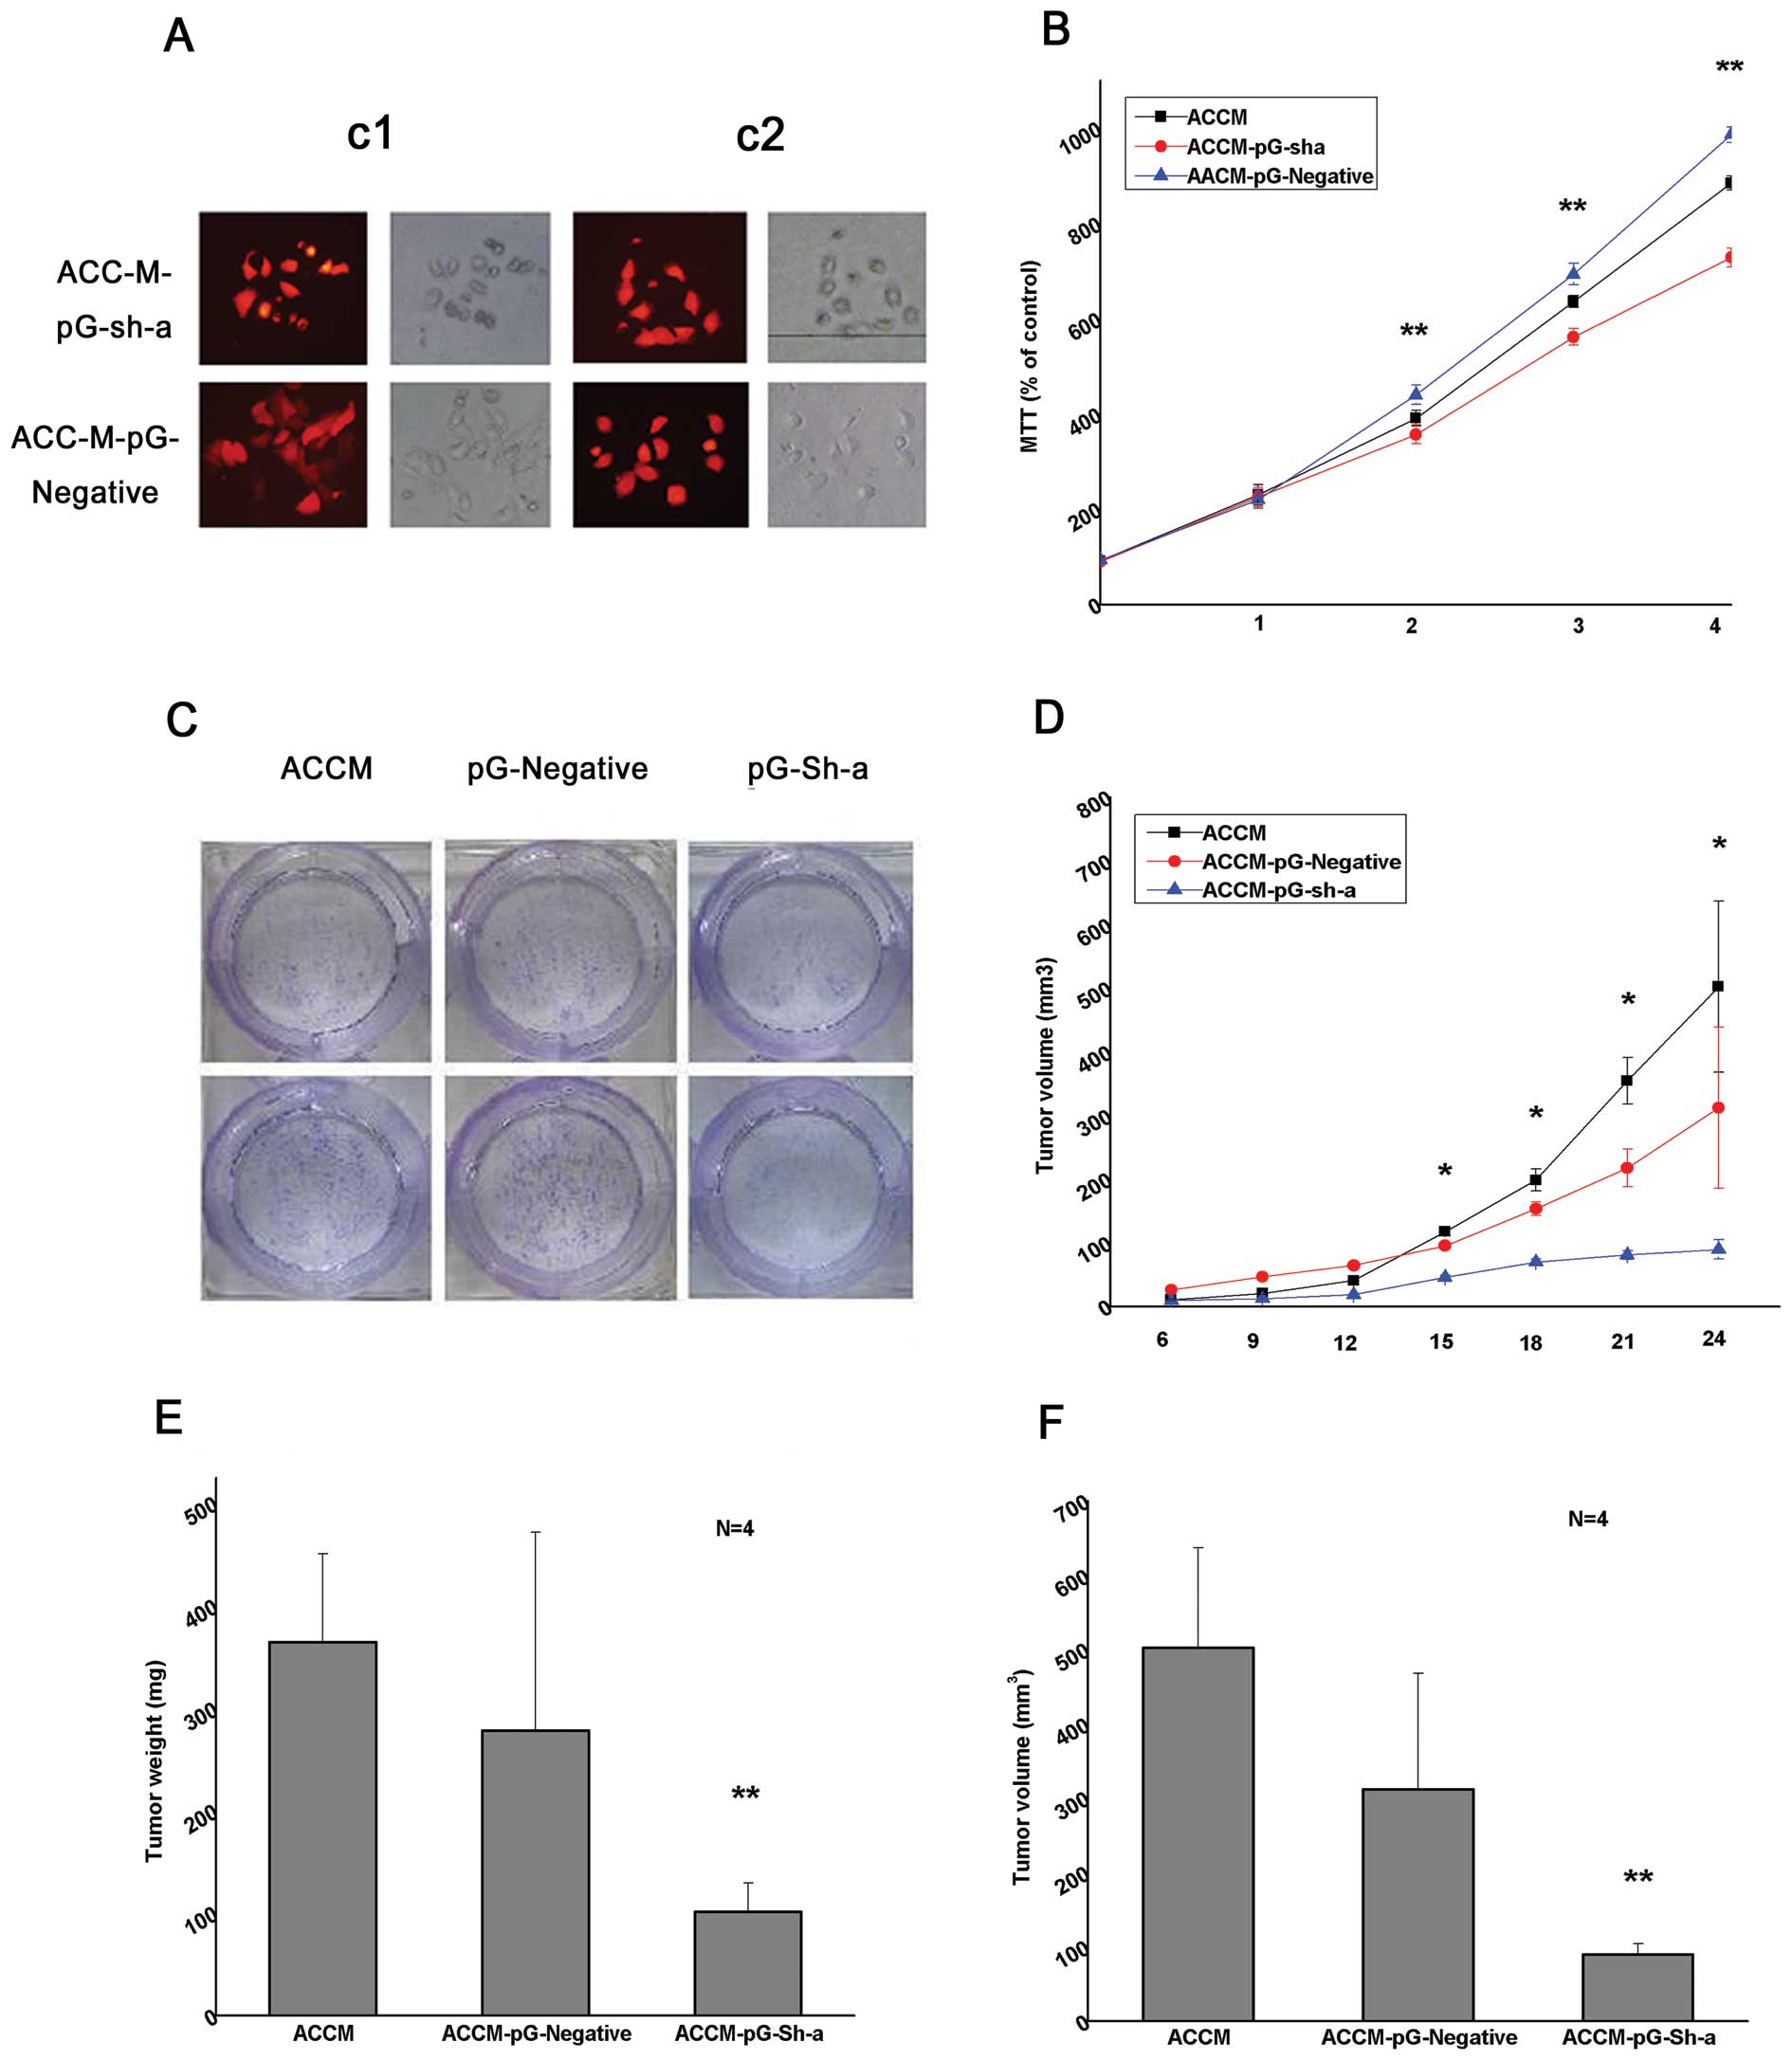
nude mice (Fig. 8A). The
proliferation of ACC-M-pG-Sh-a cells was observed to be less than
ACC-M-pG-Negative at the beginning of the second day and less than
ACC-M at the beginning of the third day according to the MTT assay
(p<0.01, Fig. 8B). In the
cloning study, the amount of cell cloning of ACC-M-pG-Sh-a is less
than ACC-M-pG-Negative and ACC-M group, and about 75% of the
control (Fig. 8C). The tumor volume
in ACC-M-pG-Sh-a is less than ACC-M-pG-Negative and ACC-M group,
and the growth began to slow at the beginning of the fifteenth day
with the evident difference (Fig.
8D). The mouse weight in ACC-M-pG-Sh-a is 4–8 times less than
the ACC-M-pG-Negative and ACC-M groups (Fig. 8E) and the tumor volume is 7–11 times
less than the control group (Fig.
8F).
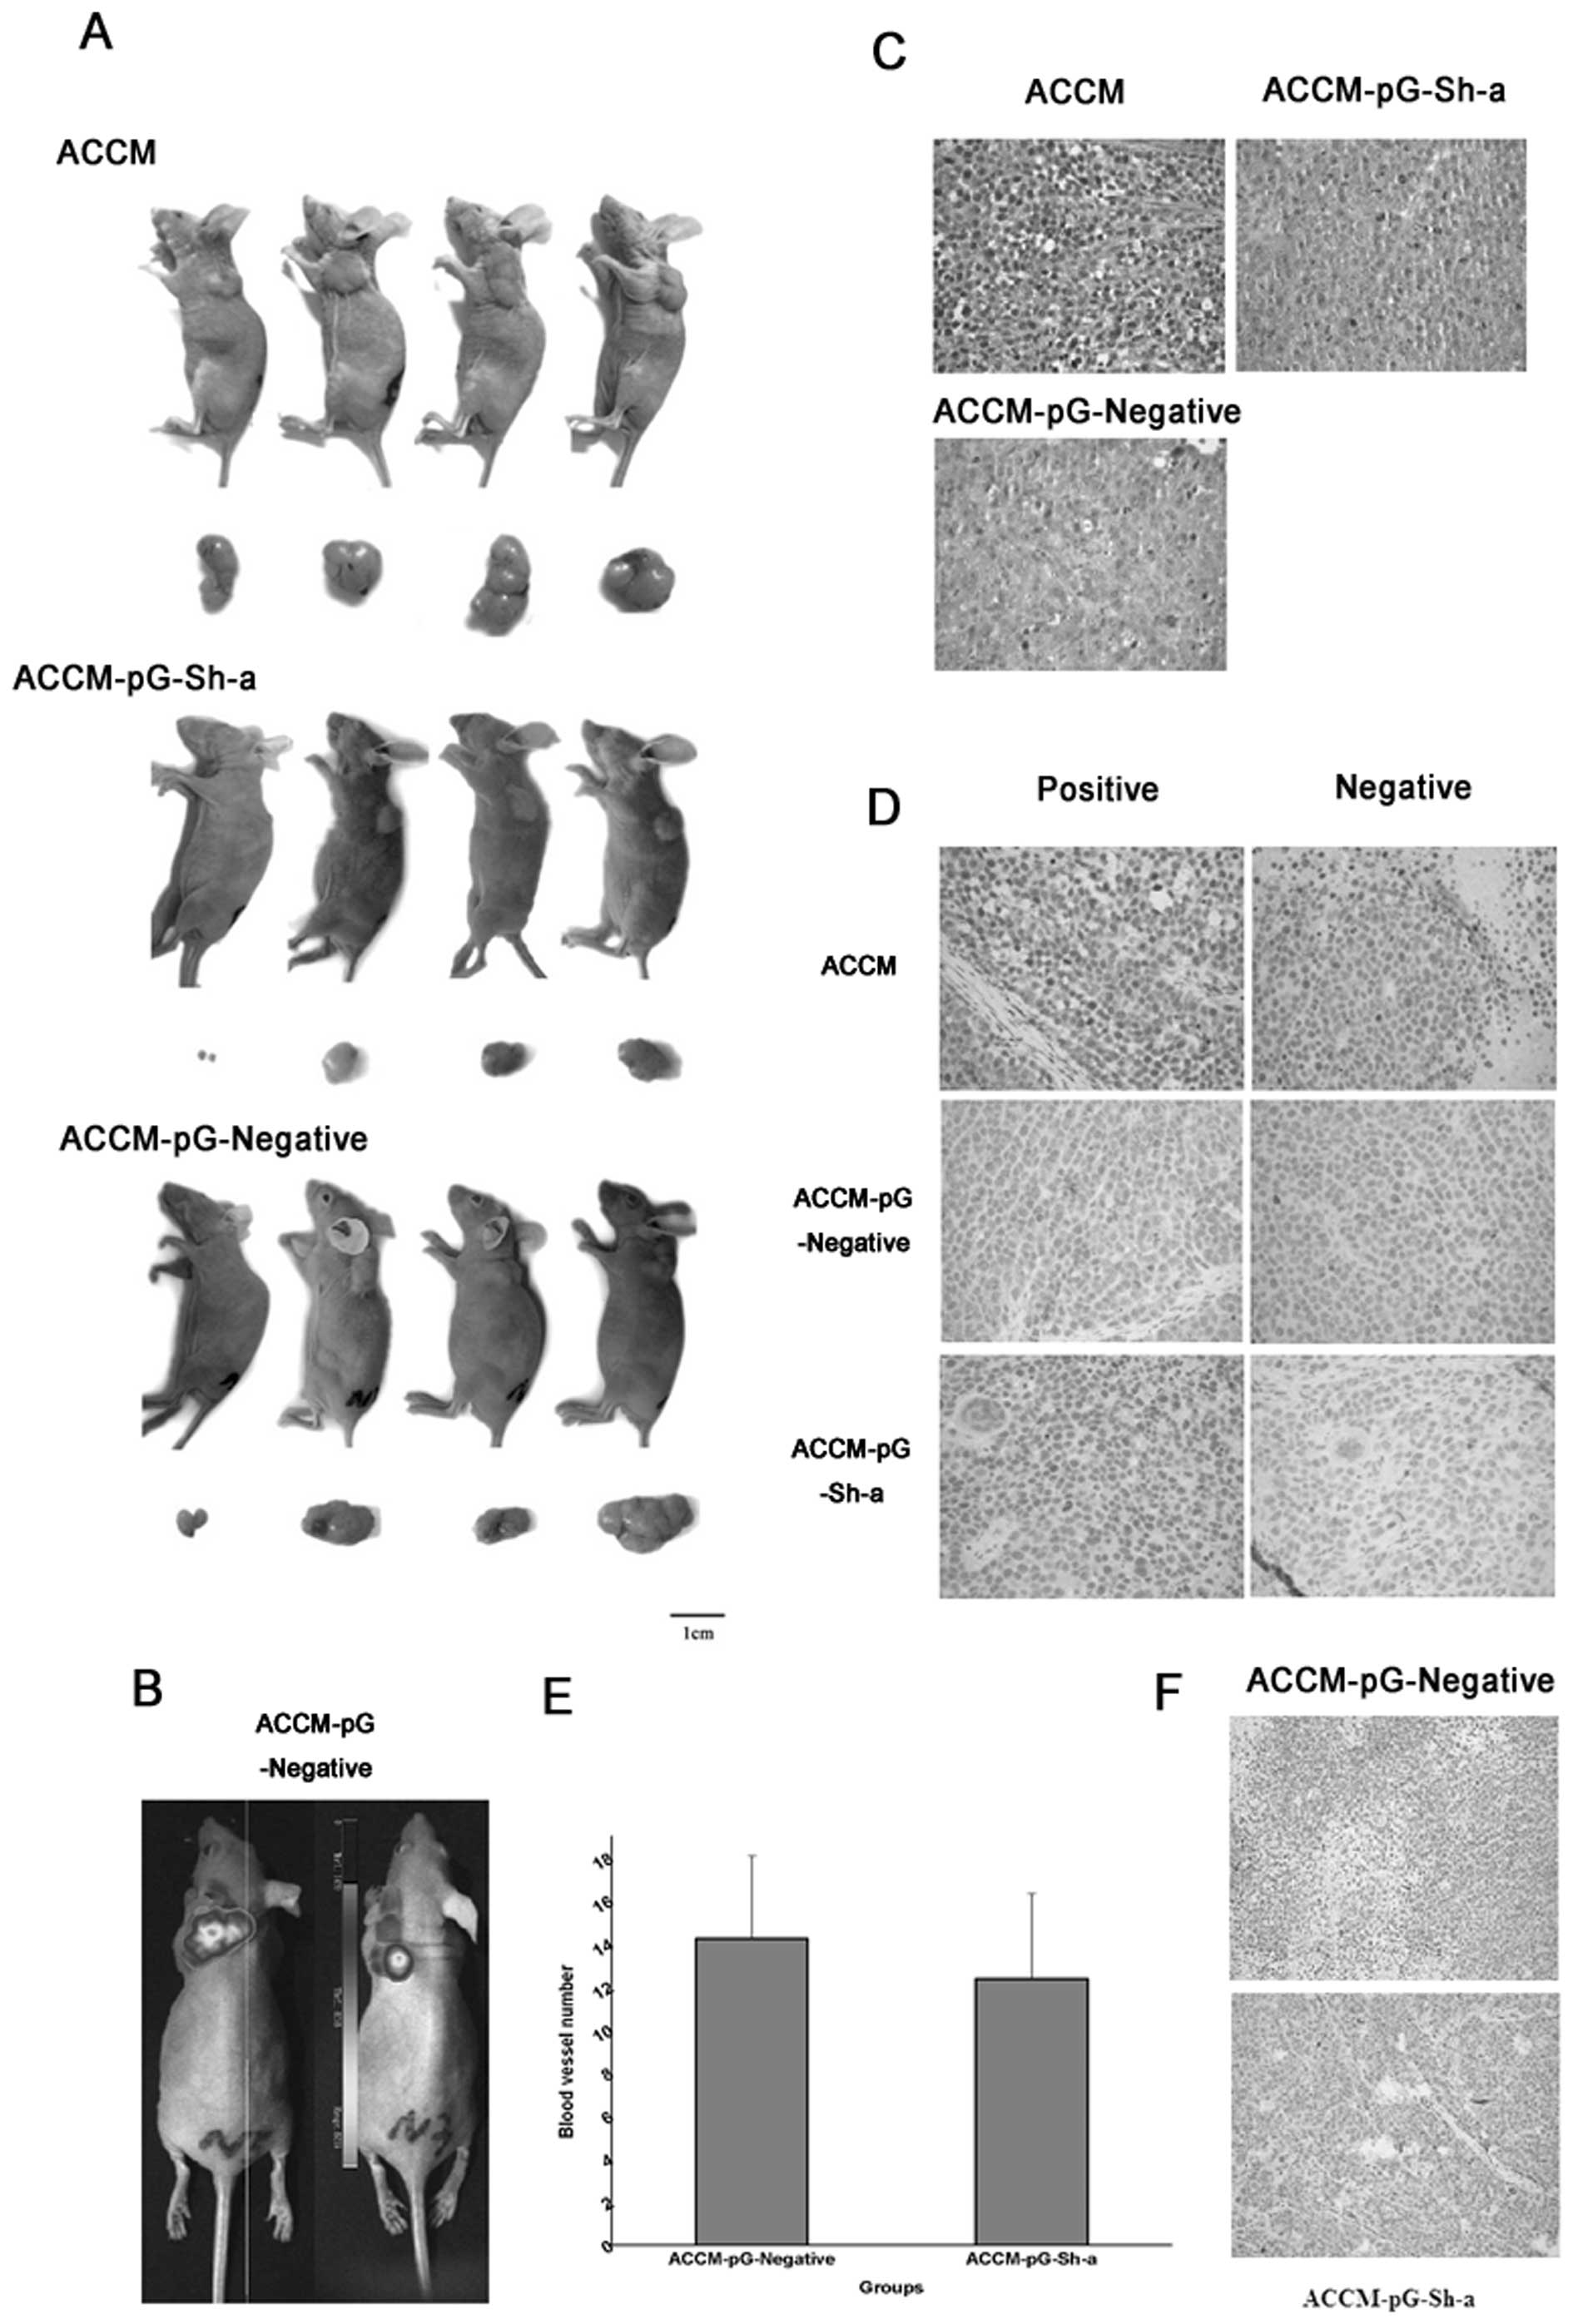
The effects on the ability of subcutaneous tumors
with XAGE-1b interference in vivo of nude mice was studied.
Cells in different groups, including ACC-M-pG-Sh-a and
ACC-M-pG-Negative and ACC-M cell lines, were observed with the
above method (Fig. 9A). The tumors
were found to give off the bright red fluorescence under the
exogenous excitation when two mice of ACC-M-pG-Negative group were
observed with live fluorescence before the sacrifice on day 24, it
showed the method could be used for the quantitation of tumor
volume and tracer of tumor cells (Fig.
9B). H&E staining displayed the characteristics of ACC
(Fig. 9C) and it confirmed the
difference of XAGE-1b expression by IHC staining (Fig. 9D). The microvessel density of the
tumors was also calculated. The microvessel density of
ACC-M-pG-Sh-a is 12.375±3.94, less than the value of 14.25±3.83 in
ACC-M-pG-Negative group without significant statistical difference
(Fig. 9E and F).
Discussion
No clear role for XAGE-1b exists as yet in
tumorigenesis of ACC. We found the negative effects on the
proliferation phenotype of ACC-M cell lines in vivo and
in vitro with XAGE-1b downregulation, and the results showed
that XAGE-1b overexpression promoted the proliferation of ACC-2
cell lines in vivo and in vitro, and its
overexpression promoted the transmembrane invasion in ACC-2 cell
lines in vitro and the metastasis in vivo of nude
mice. The proliferation in vitro of ACC-M cell lines and
subcutaneous tumors of nude mice was inhibited by interference with
XAGE-1b expression. The results also showed ACC-2 cells with
XAGE-1b overexpression presenting more rapid tumor growth and
higher ability of transmembrane invasion in vivo and in
vitro, and more angiogenesis. All the above results indicated
that XAGE-1b promoted angiogenesis of tumor directly or indirectly,
and it may lead to migration.
Some researchers have found close correlation
between the microvessel density (MVD) of ACC and the expression of
NF-κB, p65, iNOS and VEGF, and correlation between the tumor stage,
column, blood circulation transfer, relapse and the expression of
the cell factor (22). The definite
correlation research between XAGE-1b and ACC need to be done
progressively. The tumor growth of ACC-M strain slowed with the
stable interfering XAGE-1b in vivo and in vitro, its
transmembrane ability also decreased in vitro. However, the
lung metastases rate did not improve with XAGE-1b overexpression,
it may be connected with low metastases in ACC-2 cell lines. Thus,
it did not change the background of low metastases through changing
gene expression, and the short time period following the
inoculation after injection is another possible cause.
Angiogenesis is also crucial for the progression and
metastasis of many types of human tumors. However, few studies have
examined the implications of expression of angiogenesis-related
factors in salivary cancer. A recent study reported that both
vascular endothelial growth factor (VEGF) and basic fibroblast
growth factor are major angiogenesis factors in salivary gland
tumors (8). In another study, loss
of heterozygosity on chromosome 6q in ACC correlated with decreased
expression of thrombospondin-2, which is a potent inhibitor of
tumor angiogenesis (23).
Furthermore, microvessel density which will be applied in our
research is considered to be a prognostic indicator for the
incidence of distant metastasis in salivary ACC. These findings
suggest that the angiogenic signaling pathways of salivary ACC are
potential therapeutic targets.
Salivary ACC cell line and its highly metastatic ACC
clone were used as model systems to reveal the gene expression
alteration related to metastasis mechanism. The correlation of
metastatic phenotypic changes and expression levels of XAGE-1b gene
was further validated by using RT-PCR analysis (24). A poorly metastatic ACC-2 cell line
and highly metastatic ACC-M cell line were selected as an
experimental model to study on metastatic mechanism procedures
(25). A salivary ACC cell line
ACC-2 and a highly metastatic salivary ACC clone ACC-M, which was
screened from ACC-2 by the combination in vivo selection and
cloning in vitro(26). Since
ACC-2 and ACC-M share identical genetic background except for
different metastatic behavior, it is presumed that the
differentially expressed genes ACC-2 and ACC-M are metastasis
related genes, which play direct or indirect roles in the
progression of metastasis. We constructed a different vector for
expressing different levels of XAGE-1b and observed its effect on
the proliferation and migration after transfected into ACC-2 and
ACC-M cell lines. Particularly, cancer cell invasion and metastasis
are the critical processes that define the aggressive phenotype of
human cancers and pose major impediments to treatment (27,28).
Whereas the development of anticancer therapy is traditionally
focused on the inhibition of cancer cell proliferation, therapeutic
strategies targeted toward inhibiting the spread of cancer cells
from a primary tumor to secondary sites can be inhibited.
The results on the tumorigenesis mechanism of ACC
showed correlation between its tumorigenesis and the mutation of
chromosome 6q, 9q and 17p on the genome level, but there is
shortage of definite evidence (3).
It was found that the differentiation to malignant development of
ACC may be connected with the point mutation of p53 (29,30).
Interfering Skp2 can inhibit the proliferation of ACC with the p27
downregulation (31,32). The overexpression of downstream
factor Ebp1 in the ErbB signaling pathway of ACC-M strain can
decrease the proliferation, anchorage and migration in
vitro(34). A20 can decrease
the invasiveness of ACC-M cells with downregulation of the
expression of NF-κB (33). Data on
the tumorigenesis mechanism of ACC are scarce and no report on its
high metastases exists. Some research has shown higher expression
frequency of C-kit protein in ACC, and it leads to lower treatment
efficiency of ACC with imatinib (a kind of tyrosine kinase
inhibitor) (34). Although HER2
overexpression in ACC has been suggested, is not evident in ACC
with the HER2-target drug trastuzumab (35). It is important to study the
mechanism of tumorigenesis and metastases of ACC.
We found that XAGE-1b is connected with the tumor
growth and metastases in ACC through overexpression and
interference as one of the CTAs in the study. The mechanism of
action and the correlation with angiogenesis are worthy of research
progressively in the future.
Acknowledgements
This study is sponsored by Chinese National Natural
Science Foundation (no. 30772591).
References
|
1
|
Parkin DM, Laara E and Muir CS: Estimates
of the worldwide frequency of sixteen major cancers in 1980. Int J
Cancer. 41:184–197. 1988. View Article : Google Scholar : PubMed/NCBI
|
|
2
|
Stell PM: Survival time in end-stage head
and neck cancer. Eur J Surg Oncol. 15:407–410. 1989.PubMed/NCBI
|
|
3
|
Bockmühl U, Wolf G, Schmidt S, Schwendel
A, Jahnke V, Dietel M and Petersen I: Genomic alterations
associated with malignancy in head and neck cancer. Head Neck.
20:145–151. 1998.PubMed/NCBI
|
|
4
|
Dodd RL and Slevin NJ: Salivary gland
adenoid cystic carcinoma: a review of chemotherapy and molecular
therapies. Oral Oncol. 42:759–769. 2006. View Article : Google Scholar : PubMed/NCBI
|
|
5
|
Ampil FL and Misra RP: Factors influencing
survival of patients with adenoid cystic carcinoma of the salivary
glands. J Oral Maxillofac Surg. 45:1005–1010. 1987. View Article : Google Scholar : PubMed/NCBI
|
|
6
|
Spiro RH: Distant metastasis in adenoid
cystic carcinoma of salivary origin. Am J Surg. 174:495–498. 1997.
View Article : Google Scholar : PubMed/NCBI
|
|
7
|
Ito H, Hatori M, Kinugasa Y, Irie T,
Tachikawa T and Nagumo M: Comparison of the expression profile of
metastasis-associated genes between primary and circulating cancer
cells in oral squamous cell carcinoma. Anticancer Res.
23:1425–1431. 2003.PubMed/NCBI
|
|
8
|
Ishibashi H, Shiratuchi T, Nakagawa K,
Onimaru M, Sugiura T and Sueishi K: Hypoxiainduced angiogenesis of
cultured human salivary gland carcinoma cells enhances vascular
endothelial growth factor production and basic fibroblast growth
factor release. Oral Oncol. 37:77–83. 2001. View Article : Google Scholar
|
|
9
|
Simpson AJ, Caballero OL, Jungbluth A,
Chen YT and Old LJ: Cancer/testis antigens, gametogenesis and
cancer. Nat Rev Cancer. 5:615–625. 2005. View Article : Google Scholar : PubMed/NCBI
|
|
10
|
Scanlan MJ, Simpson AJ and Old LJ: The
cancer/testis genes: review, standardization, and commentary.
Cancer Immun. 4:12004.PubMed/NCBI
|
|
11
|
Old LJ: Cancer/testis (CT) antigens - a
new link between gametogenesis and cancer. Cancer Immun.
1:12001.PubMed/NCBI
|
|
12
|
Davis ID, Chen W, Jackson H, Parente P,
Shackleton M, Hopkins W, Chen Q, Dimopoulos N, Luke T, Murphy R,
Scott AM, Maraskovsky E, McArthur G, MacGregor D, Sturrock S, Tai
TY, Green S, Cuthbertson A, Maher D, Miloradovic L, Mitchell SV,
Ritter G, Jungbluth AA, Chen YT, Gnjatic S, Hoffman EW, Old LJ and
Cebon JS: Recombinant NY-ESO-1 protein with ISCOMATRIX adjuvant
induces broad integrated antibody and CD4(+) and CD8(+) T cell
responses in humans. Proc Natl Acad Sci USA. 101:10697–10702.
2004.PubMed/NCBI
|
|
13
|
Zhang Y, Sun Z, Nicolay H, Meyer RG,
Renkvist N, Stroobant V, Corthals J, Carrasco J, Eggermont AM,
Marchand M, Thielemans K, Wölfel T, Boon T and van der Bruggen P:
Monitoring of anti-vaccine CD4 T cell frequencies in melanoma
patients vaccinated with a MAGE-3 protein. J Immunol.
174:2404–2411. 2005. View Article : Google Scholar : PubMed/NCBI
|
|
14
|
Nakagawa K, Noguchi Y, Uenaka A, Sato S,
Okumura H, Tanaka M, Shimono M, Ali Eldib AM, Ono T, Ohara N,
Yoshino T, Yamashita K, Tsunoda T, Aoe M, Shimizu N and Nakayama E:
XAGE-1 expression in non-small cell lung cancer and antibody
response in patients. Clin Cancer Res. 11:5496–5503. 2005.
View Article : Google Scholar : PubMed/NCBI
|
|
15
|
Gure AO, Chua R, Williamson B, Gonen M,
Ferrera CA, Gnjatic S, Ritter G, Simpson AJ, Chen YT, Old LJ and
Altorki NK: Cancer-testis genes are coordinately expressed and are
markers of poor outcome in nonsmall cell lung cancer. Clin Cancer
Res. 11:8055–8062. 2005. View Article : Google Scholar : PubMed/NCBI
|
|
16
|
Brinkmann U, Vasmatzis G, Lee B and Pastan
I: Novel genes in the PAGE and GAGE family of tumor antigens found
by homology walking in the dbEST database. Cancer Res.
59:1445–1448. 1999.PubMed/NCBI
|
|
17
|
Liu XF, Helman LJ, Yeung C, Bera TK, Lee B
and Pastan I: XAGE-1, a new gene that is frequently expressed in
Ewing’s sarcoma. Cancer Res. 60:4752–4755. 2000.PubMed/NCBI
|
|
18
|
Zendman AJ, Van Kraats AA, Weidle UH,
Ruiter DJ and Van Muijen GN: The XAGE family of
cancer/testis-associated genes: alignment and expression profile in
normal tissues, melanoma lesions and Ewing’s sarcoma. Int J Cancer.
99:361–369. 2002.PubMed/NCBI
|
|
19
|
Egland KA, Kumar V, Duray P and Pastan I:
Characterization of overlapping XAGE-1 transcripts encoding a
cancer testis antigen expressed in lung, breast, and other types of
cancers. Mol Cancer Ther. 1:441–450. 2002.PubMed/NCBI
|
|
20
|
Ali Eldib AM, Ono T, Shimono M, Kaneko M,
Nakagawa K, Tanaka R, Noguchi Y and Nakayama E: Immunoscreening of
a cDNA library from a lung cancer cell line using autologous
patient serum: identification of XAGE-1b as a dominant antigen and
its immunogenicity in lung adenocarcinoma. Int J Cancer.
108:558–563. 2004.PubMed/NCBI
|
|
21
|
Sato S, Noguchi Y, Ohara N, Uenaka A,
Shimono M, Nakagawa K, Koizumi F, Ishida T, Yoshino T, Shiratori Y
and Nakayama E: Identification of XAGE-1 isoforms: predominant
expression of XAGE-1b in testis and tumors. Cancer Immun. 7:5–13.
2007.PubMed/NCBI
|
|
22
|
Scanlan MJ, Gure AO, Jungbluth AA, Old LJ
and Chen YT: Cancer/testis antigens: an expanding family of targets
for cancer immunotherapy. Immunol Rev. 188:22–32. 2002. View Article : Google Scholar : PubMed/NCBI
|
|
23
|
Kishi M, Nakamura M, Nishimine M, Ishida
E, Shimada K, Kirita T and Konishi N: Loss of heterozygosity on
chromosome 6q correlates with decreased thrombospondin-2 expression
in human salivary gland carcinomas. Cancer Sci. 94:530–535. 2003.
View Article : Google Scholar : PubMed/NCBI
|
|
24
|
Huang D, Chen W, He R, Yu F, Zhang Z and
Qiu W: Different cDNA microarray patterns of gene expression
reflecting changes during metastatic progression in adenoid cystic
carcinoma. World J Surg Oncol. 1:282003. View Article : Google Scholar : PubMed/NCBI
|
|
25
|
An J, Sun JY, Yuan Q, Tian HY, Qiu WL, Guo
W and Zhao FK: Proteomics analysis of differentially expressed
metastasis-associated proteins in adenoid cystic carcinoma cell
lines of human salivary gland. Oral Oncol. 40:400–408. 2004.
View Article : Google Scholar
|
|
26
|
Guan XF, Qiu WL, He RG and Zhou XJ:
Selection of adenoid cystic carcinoma cell clone highly metastatic
to the lung: an experimental study. Int J Oral Maxillofac Surg.
26:116–119. 1997. View Article : Google Scholar : PubMed/NCBI
|
|
27
|
Patel KJ, Pambuccian SE, Ondrey FG, Adams
GL and Gaffney PM: Genes associated with early development,
apoptosis and cell cycle regulation define a gene expression
profile of adenoid cystic carcinoma. Oral Oncol. 42:994–1004. 2006.
View Article : Google Scholar
|
|
28
|
Chen W, Zhang HL, Shao XJ, Jiang YG, Zhao
XG, Gao X, Li JH, Yang J, Zhang YF, Liu BL and Sun MY: Gene
expression profile of salivary adenoid cystic carcinoma associated
with perineural invasion. Tohoku J Exp Med. 212:319–334. 2007.
View Article : Google Scholar : PubMed/NCBI
|
|
29
|
Chau Y, Hongyo T, Aozasa K and Chan JKC:
Dedifferentiation of adenoid cystic carcinoma: a report of a case
implicating p53 gene mutation. Hum Pathol. 32:1403–1407. 2001.
View Article : Google Scholar : PubMed/NCBI
|
|
30
|
Karja VJ, Syrjanen KJ, Kurvinen AK and
Syrjanen SM: Expressions and mutations of p53 in salivary gland
tumours. J Oral Pathol Med. 26:217–223. 1997. View Article : Google Scholar : PubMed/NCBI
|
|
31
|
Keikhaee MR, Kudo Y, Siriwardena S, Wu L,
Ogawa I and Takata T: Skp2 expression is associated with
down-regulation of p27 protein and cell proliferation in salivary
adenoid cystic carcinoma. Virchows Arch. 450:567–574. 2007.
View Article : Google Scholar : PubMed/NCBI
|
|
32
|
Yu Y, Chen W, Zhang Y, Hamburger AW, Pan H
and Zhang Z: Suppression of salivary adenoid cystic carcinoma
growth and metastasis by ErbB3 binding protein Ebp1 gene transfer.
Int J Cancer. 120:1909–1913. 2007. View Article : Google Scholar : PubMed/NCBI
|
|
33
|
Zhang B, Guan CC, Chen WT, Zhang P, Yan M,
Shi JH, Qin CL and Yang Q: A20 inhibits human salivary adenoid
cystic carcinoma cells invasion via blocking nuclear factor-kappaB
activation. Chin Med J. 120:1830–1835. 2007.PubMed/NCBI
|
|
34
|
Freier K, Flechtenmacher C, Walch A,
Devens F, Mühling J, Lichter P, Joos S and Hofele C: Differential
KIT expression in histological subtypes of adenoid cystic carcinoma
(ACC) of the salivary gland. Oral Oncol. 41:934–939. 2005.
View Article : Google Scholar : PubMed/NCBI
|
|
35
|
Dori S, Vered M, David R and Buchner A:
HER2/neu expression in adenoid cystic carcinoma of salivary gland
origin: an immunohistochemical study. J Oral Pathol Med.
31:463–467. 2002. View Article : Google Scholar : PubMed/NCBI
|