Introduction
Colorectal cancer, one of the most common epithelial
carcinomas originating from epithelial cells, is the major cause of
cancer-related mortality in industrialized countries (1). Despite the development of numerous
surgical techniques and new treatment methods, metastatic
colorectal cancer is associated with a low (~10%) 5-year survival
rate and accounts for 90% of colon cancer-related deaths (2,3).
Primary tumors are known to metastasize through the process of
epithelial-mesenchymal transition (EMT) (4), which is an important step by which
epithelial cells transform into mesenchymal cells during embryonic
development, but loss of cell polarity, decreased cell to cell
adhesion, increased migratory ability and increased invasive
property are caused by the aberrant activation of EMT in cancer
cells (5–7). It is essential, therefore, to
understand the process of EMT that occurs during the development of
colon cancer, in addition to understanding the mechanisms involved
in the progression of carcinoma, to be able to establish objectives
for the prevention and treatment of metastasis. The process of EMT
is accompanied by various changes, such as repression of epithelial
markers, abnormal translocation of β-catenin, and upregulation of
mesenchymal markers, as well as expression of and interaction
between related proteins or so-called EMT regulators, such as
TWIST1 and SNAI1 (SNAIL), but there is still a lack of
understanding in individual carcinomas (6,8).
According to previous research, cancer cells appear
to acquire a stem cell-like phenotype during the process of EMT
(9). Cancer stem cells have
features of self-renewal and tumor-initiating capacity, and the
resultant tumors can be defined as cells having high heterogeneity
of a primary tumor. It has been suggested that, unlike stem cells
in the crypt of normal colonic mucosa, the microenvironment of
cancer stem cells hosts variants of diverse self-renewable
signaling pathways, such as the Wnt/β-catenin, TGF-β, Notch and
Hedgehog signaling pathways (10).
Cancer stemness is a concept introduced to describe cancer cell
resistance to conventional chemoradiation therapies and has been
suggested to have a close relationship with EMT in breast and
prostate cancer (11–13). ALDH1 has been found to be a valuable
marker in previous studies for identifying breast and colon cancer
stem cells (13–16). It has been speculated that the
extent of the expression of cancer stem cell phenotype markers may
be associated with the clinical prognosis of colon cancer, but
without sufficient clinical research to support it.
In the present study, we aimed to determine whether
EMT markers and the extent of expression of stem cell phenotype
markers are associated with the histological features and clinical
prognosis of colon cancer patients.
Materials and methods
Patients and tissue samples
After obtaining approval from the Institutional
Review Board of Bundang CHA Medical Center, 231 patients with
primary colon cancer recruited between March 2002 and October 2006
were included in the present study. The patients underwent surgery
for colon cancer at our center, and the collected samples were
examined and classified by GI pathologists at the center. The 231
patients consisted of 130 males and 101 females, ranging in age
from 31 to 95 years (mean age, 61.8). The patients were followed up
for a median of 71 (1–106) months. Of the 231 cases, 23 cases were
mucinous adenocarcinoma and 37 cases were right colon cancer. Other
clinical parameters such as gender, clinical stage and survival
time (months) are detailed in Tables
I and II. Tissue microarray
was used for the 231 cases of paraffin-embedded tissue blocks. For
109 cases with available normal tumor-paired samples, fresh
snap-frozen samples were used for quantitative analysis of mRNA
expression. In order to select cases containing at least 90% tumor
cells, frozen tissues were subjected to histological evaluation
with H&E staining. Clinical stages were determined according to
the AJCC staging system, 7th edition by a clinician who reviewed
the surgical pathology reports and clinical information (17).
 | Table IClinicopathological features and the
mean values of the relative quantification of mRNA expression of
EMT markers in the colorectal cancer cases. |
Table I
Clinicopathological features and the
mean values of the relative quantification of mRNA expression of
EMT markers in the colorectal cancer cases.
| n | E-cadherin (mean
±SD) | TWIST1 (mean
±SD) | SNAI1 (mean ±SD) |
|---|
| Total no. of
samples | 109 | 72.73±293.62 | 8.13±31.7 | 3.47±6.06 |
| Gender |
| Male | 64 | 2.97±298.91 | 1.28±34.81 | 1.53±3.84 |
| Female | 45 | 3.64±281.93 | 0.66±26.26 | 1.48±8.17 |
| P-value | | 0.751 | 0.475 | 0.929 |
| Age (years) |
| ≤50 | 20 | 105.63±363.01 | 3.53±6.22 | 3.67±4.02 |
| >50 | 89 | 65.34±273.32 | 9.17±34.72 | 3.42±6.4 |
| P-value | | 0.362 | 0.670 | 0.568 |
| Location of colon
cancer |
| Right colon | 23 | 3.64±58.24 | 0.66±23.9 | 1.59±2.72 |
| Left colon | 86 | 3.22±326.53 | 0.78±33.31 | 1.48±6.4 |
| P-value | | 0.832 | 0.469 | 0.741 |
| Primary lesion |
| Single | 105 | 3.37±297.47 | 0.73±29.95 | 1.48±5.95 |
| Multiple | 4 | 1.46±4.19 | 1.12±54.68 | 4.47±7.17 |
| P-value | | 0.203 | 0.573 | 0.375 |
| Pathological
diagnosis |
|
Adenocarcinoma | 93 | 3.16±312.53 | 0.8±31.73 | 1.45±6.21 |
| Mucinous
adenocarcinoma | 16 | 5.91±118.63 | 0.53±30.58 | 1.99±4.81 |
| P-value | | 0.132 | 0.137 | 0.177 |
|
Differentiationb |
| Well to
moderate | 86 | 3.23±324.34 | 0.81±32.45 | 1.38±3.52 |
| Poor to
undifferentiated | 7 | 1.69±8.22 | 0.53±20.71 | 2.38±17.3 |
| P-value | | 0.531 | 0.432 | 0.541 |
| Tumor stage |
| T1–2 | 11 | 1.81±7.87 | 0.54±2.79 | 0.35±1.58 |
| T3–4 | 98 | 3.62±307.3 | 0.78±33.19 | 1.48±6.4 |
| P-value | | 0.069 | 0.073 | 0.024a |
| Nodal stage |
| N0 | 56 | 3.44±332.95 | 0.68±15.64 | 0.78±2.89 |
| N1–3 | 53 | 3.27±241.82 | 0.89±41.84 | 1.6±7.94 |
| P-value | | 0.712 | 0.040a | 0.022a |
| Clinical stage |
| Stage I–II | 54 | 3.23±258.89 | 0.68±15.92 | 1.14±2.92 |
| Stage III–IV | 55 | 3.37±320.05 | 0.89±42.12 | 1.59±7.84 |
| P-value | | 0.341 | 0.057 | 0.064 |
| Lymphatic
invasion |
| Negative | 84 | 3.1±232.07 | 0.66±35.28 | 1.5±3.8 |
| Positive | 25 | 1±0.48 | 2.06±12.53 | 1.48±10.35 |
| P-value | | 0.104 | 0.032a | 0.668 |
| Vascular
invasion |
| Negative | 96 | 3.23±310.59 | 0.71±33.53 | 1.48±6.22 |
| Positive | 13 | 16.52±23.15 | 0.89±3.24 | 1.6±4.34 |
| P-value | | 0.736 | 0.870 | 0.483 |
| Neural
invasion |
| Negative | 102 | 3.28±301.61 | 0.69±32.18 | 1.51±3.94 |
| Positive | 7 | 7.62±7.1 | 0.88±17.71 | 3.52±20.14 |
| P-value | | 0.415 | 0.061 | 0.781 |
| Table IIRelationship between the
clinicopathological features and positive immunohistochemical
expression of EMT and stemness markers (ALDH1, TGF-β1, E-cadherin,
β-catenin, TWIST and SNAI1) in the 231 colorectal cancer
patients. |
Table II
Relationship between the
clinicopathological features and positive immunohistochemical
expression of EMT and stemness markers (ALDH1, TGF-β1, E-cadherin,
β-catenin, TWIST and SNAI1) in the 231 colorectal cancer
patients.
| | ALDH1 | TGF-β1 | Nuclear
E-cadherin | β-catenin | TWIST1 | SNAI1 |
|---|
| n | n (%) | n (%) | n (%) | n (%) | n (%) | n (%) |
|---|
| Gender |
| Male | 130 | 26 (20.0) | 40 (30.8) | 88 (67.7) | 66 (50.8) | 37 (28.5) | 33 (25.4) |
| Female | 101 | 16 (15.8) | 24 (23.8) | 68 (67.3) | 50 (49.5) | 28 (27.7) | 22 (21.8) |
| P-value | | 0.416 | 0.238 | 0.953 | 0.849 | 0.901 | 0.524 |
| Age (years) |
| ≤50 | 41 | 4 (9.8) | 9 (22.0) | 26 (63.4) | 15 (36.6) | 8 (19.5) | 11 (26.8) |
| >50 | 190 | 38 (20.0) | 55 (28.9) | 130 (68.4) | 101 (53.2) | 57 (30.0) | 44 (23.2) |
| P-value | | 0.179 | 0.364 | 0.535 | 0.054 | 0.176 | 0.617 |
| Location of colon
cancer |
| Right colon | 37 | 8 (21.6) | 6 (16.2) | 27 (73.0) | 15 (40.5) | 10 (27.0) | 9 (24.3) |
| Left colon | 194 | 34 (17.5) | 58 (29.9) | 129 (66.5) | 101 (52.1) | 55 (28.4) | 46 (23.7) |
| P-value | | 0.554 | 0.088 | 0.441 | 0.199 | 0.870 | 0.936 |
| Primary lesion |
| Single | 222 | 39 (17.6) | 59 (26.6) | 149 (67.1) | 112 (50.5) | 61 (27.5) | 52 (23.4) |
| Multiple | 9 | 3 (33.3) | 5 (55.6) | 7 (77.8) | 4 (44.4) | 4 (44.4) | 3 (33.4) |
| P-value | | 0.212 | 0.120 | 0.503 | 0.724 | 0.267 | 0.448 |
| Pathological
diagnosis |
|
Adenocarcinoma | 208 | 35 (16.8) | 57 (27.4) | 143 (68.8) | 109 (52.4) | 59 (28.4) | 50 (24.0) |
| Mucinous
adenocarcinoma | 23 | 7 (30.4) | 7 (30.4) | 13 (56.5) | 23 (44.4) | 6 (26.1) | 6 (21.7) |
| P-value | | 0.108 | 0.760 | 0.235 | 0.046a | 0.818 | 0.806 |
|
Differentiationb |
| Well-moderate | 195 | 34 (17.4) | 55 (28.2) | 137 (70.3) | 106 (54.4) | 59 (30.3) | 46 (23.6) |
|
Poor-undifferentiated | 13 | 1 (7.7) | 2 (15.4) | 6 (46.2) | 3 (30.4) | 0 (0.0) | 4 (30.8) |
| P-value | | 0.700 | 0.521 | 0.064 | 0.042a | 0.022a | 0.517 |
| Tumor stage |
| T1–2 | 24 | 4 (16.7) | 7 (29.2) | 15 (62.5) | 17 (70.8) | 7 (29.2) | 5 (20.8) |
| T3–4 | 207 | 38 (18.4) | 57 (27.5) | 141 (68.1) | 99 (47.8) | 58 (28.0) | 50 (24.2) |
| P-value | | 0.839 | 0.866 | 0.578 | 0.033a | 0.906 | 0.718 |
| Nodal stage |
| N0 | 113 | 13 (11.5) | 24 (21.2) | 77 (68.1) | 62 (54.9) | 28 (24.8) | 26 (23.0) |
| N1–3 | 118 | 29 (24.6) | 40 (33.9) | 79 (79.0) | 54 (45.8) | 37 (31.4) | 29 (24.6) |
| P-value | | 0.010a | 0.032a | 0.847 | 0.167 | 0.266 | 0.780 |
| Clinical stage |
| Stage I–II | 111 | 14 (12.6) | 25 (22.5) | 76 (68.5) | 61 (55.0) | 29 (26.1) | 26 (23.4) |
| Stage III–IV | 120 | 28 (23.3) | 39 (32.5) | 80 (66.7) | 55 (45.8) | 36 (30.0) | 29 (24.2) |
| P-value | | 0.035a | 0.090 | 0.81 | 0.166 | 0.513 | 0.895 |
| Lymphatic
invasion |
| Negative | 176 | 27 (15.3) | 48 (27.3) | 122 (69.3) | 94 (53.4) | 49 (27.8) | 41 (23.3) |
| Positive | 55 | 15 (27.3) | 16 (29.1) | 34 (61.8) | 22 (40.4) | 16 (29.1) | 14 (25.5) |
| P-value | | 0.045a | 0.793 | 0.300 | 0.083 | 0.857 | 0.743 |
| Vascular
invasion |
| Negative | 182 | 30 (16.5) | 51 (28.0) | 127 (69.8) | 89 (48.9) | 48 (26.4) | 37 (20.3) |
| Positive | 49 | 12 (24.5) | 13 (26.5) | 29 (59.2) | 27 (55.1) | 17 (34.7) | 18 (36.7) |
| P-value | | 0.197 | 0.836 | 0.160 | 0.441 | 0.250 | 0.017a |
| Neural
invasion |
| Negative | 209 | 37 (17.7) | 55 (26.3) | 144 (68.9) | 106 (50.7) | 58 (27.8) | 52 (24.9) |
| Positive | 22 | 5 (22.7) | 9 (40.9) | 12 (54.5) | 10 (45.5) | 7 (31.8) | 3 (13.6) |
| P-value | | 0.564 | 0.146 | 0.171 | 0.639 | 0.687 | 0.301 |
| Total | 231 | 42 | 64 | 156 | 116 | 65 | 55 |
RNA extraction and quantitative real-time
polymerase chain reaction (qRT-PCR)
RNA was extracted from 109 fresh snap-frozen samples
of colon cancer tissues and from the paired normal tissues using
TRIzol reagent (Invitrogen, Carlsbad, CA, USA). cDNA was
synthesized from the extracted RNA (1 μg) using the SuperScript III
kit (Invitrogen). Each cDNA sample was run three times
independently using the Bio-Rad CFX96 Real-Time PCR Detection
System (Bio-Rad, Hercules, CA, USA). Gene-specific primers and
probes for the TaqMan gene expression assay were purchased from
Applied Biosystems (Paisley, UK). This included three genes:
E-cadherin (Hs00170423_m1), TWIST1 (Hs00361186_m1) and SNAI1
(Hs00195591_m1). Glyceraldehyde 3-phosphate dehydrogenase (GAPDH)
(Hs99999905_m1) was used for normalization. The PCR reaction mix
consisted of a volume of 20 μl and was composed of 10 μl 2X TaqMan
Universal PCR Master Mix (Applied Biosystems), 1 μl of primers and
probe kit, 1 μl of cDNA and 8 μl of diethyl pyrocarbonate water.
The reverse transcription was carried out for 15 sec at 90°C,
repeated 40 times for 1 min at 60°C, and then was treated for 2 min
at 50°C and for 10 min at 95°C. Initial copy number at real-time
PCR analysis was quantified based on the threshold cycle (Ct), and
target genes were normalized against GAPDH. Relative quantification
of mRNA expression was calculated by the 2−ΔΔCt
method.
Immunohistochemical analysis
For the tissue microarray of the 231 cases, tissue
cores were obtained at a 2-mm diameter from expression regions on
formalin-fixed paraffin-embedded blocks using a manual tissue
microarray kit (Unitma, Quick-Ray; Unitech Science, Seoul, Korea).
The obtained tissues consisted of three cancer tissue cores from
different foci and one matched normal tissue core.
Immunohistochemical staining was performed on 5-μm sections cut
from formalin-fixed, paraffin-embedded tissue using mouse
monoclonal anti-ALDH1 (1:50) (BD Biosciences, La Jolla, CA, USA),
rabbit polyclonal anti-TGF-β1 (1:100) (Novus Biologicals,
Littleton, CO, USA), mouse monoclonal anti-E-cadherin (1:100),
mouse monoclonal anti-β-catenin (1:100) (both from BD Biosciences),
rabbit polyclonal anti-TWIST1 (1:200) and rabbit polyclonal
anti-SNAI1 (1:100) (both from Novus Biologicals). The visualization
system used was the BenchMark XT with heat-induced epitope
retrieval (CC1 solution) (both from Ventana). Sections were
incubated with primary antibodies for 32 min at 37°C. Staining was
detected with the ultraView Universal DAB detection kit (Ventana).
Immunohistochemical content was scored depending on the extent and
intensity of staining, as previously described (18). In brief, the intensity of staining
was graded according to a 4-tiered scale of 0 to 3 (with 3 as the
most intense staining). The extent of positive immunoreactivity was
graded according to the percentage of stained cells in the region
of interest: 0 points for 0%; 1 point for <20%; 2 points for
20–50% and 3 points for >50%. An overall score was obtained from
the sum of the intensity and the extent of the positive-staining.
Cases with a final score of >3 were defined as positive. Cases
with cytoplasmic and/or nuclear localization of β-catenin were
considered abnormal. All staining was separately scored in a
blinded manner by two trained researchers (Y.K. and C.K.) and one
pathologist (G.K.). In the case of disagreement in interpretation,
the results were discussed by all three researchers and a consensus
was reached for each case.
Statistical analysis
Quantitative values of qRT-PCR were presented as
means ± standard deviation (SD) or median. The Mann-Whitney U test
was used for quantitative comparison of mRNAs with respect to
various clinical and histological parameters. The Chi-square test
was used to compare immunohistochemical staining with clinical and
pathological indices. For correlation of EMT and stemness markers,
Spearman’s rank correlation was used. Patient overall survival was
determined from official death records by the Korea Statistics
Promotion Institute. Survival curves were calculated using the
Kaplan-Meier method, and differences between the survival curves
were analyzed using log-rank test. Multivariate analysis of
independent prognostic factors of survival was performed using
Cox’s proportional hazard regression model. All statistical
analyses were performed with IBM® SPSS®
Statistics (version 19.0.0), and P-value <0.05 was considered to
indicate a statistically significant result.
Results
Correlation between the relative
quantification (RQ) of mRNA expression of EMT markers and
clinicopathologic characteristics of the colorectal cancer
cases
The mean values of RQ for E-cadherin, TWIST1 and
SNAI1 were 72.73±293.62 (median, 3.27), 8.13±31.7 (median, 0.73)
and 3.47±6.06 (median, 1.48), respectively in the 109 cases.
Table I summarizes the differences
in the mean values of RQ of each marker according to the
clinicopathological characteristics. The mean values of RQ of
E-cadherin, TWIST1 and SNAI1 were not significantly different in
regards to gender, age, location of the colon cancer, number of
primary lesions and pathological diagnosis. When samples excluding
mucinous adenocarcinoma were divided into a well to moderate
differentiation group and a poor to undifferentiated group, the two
subgroups were not significantly different in regards to the mean
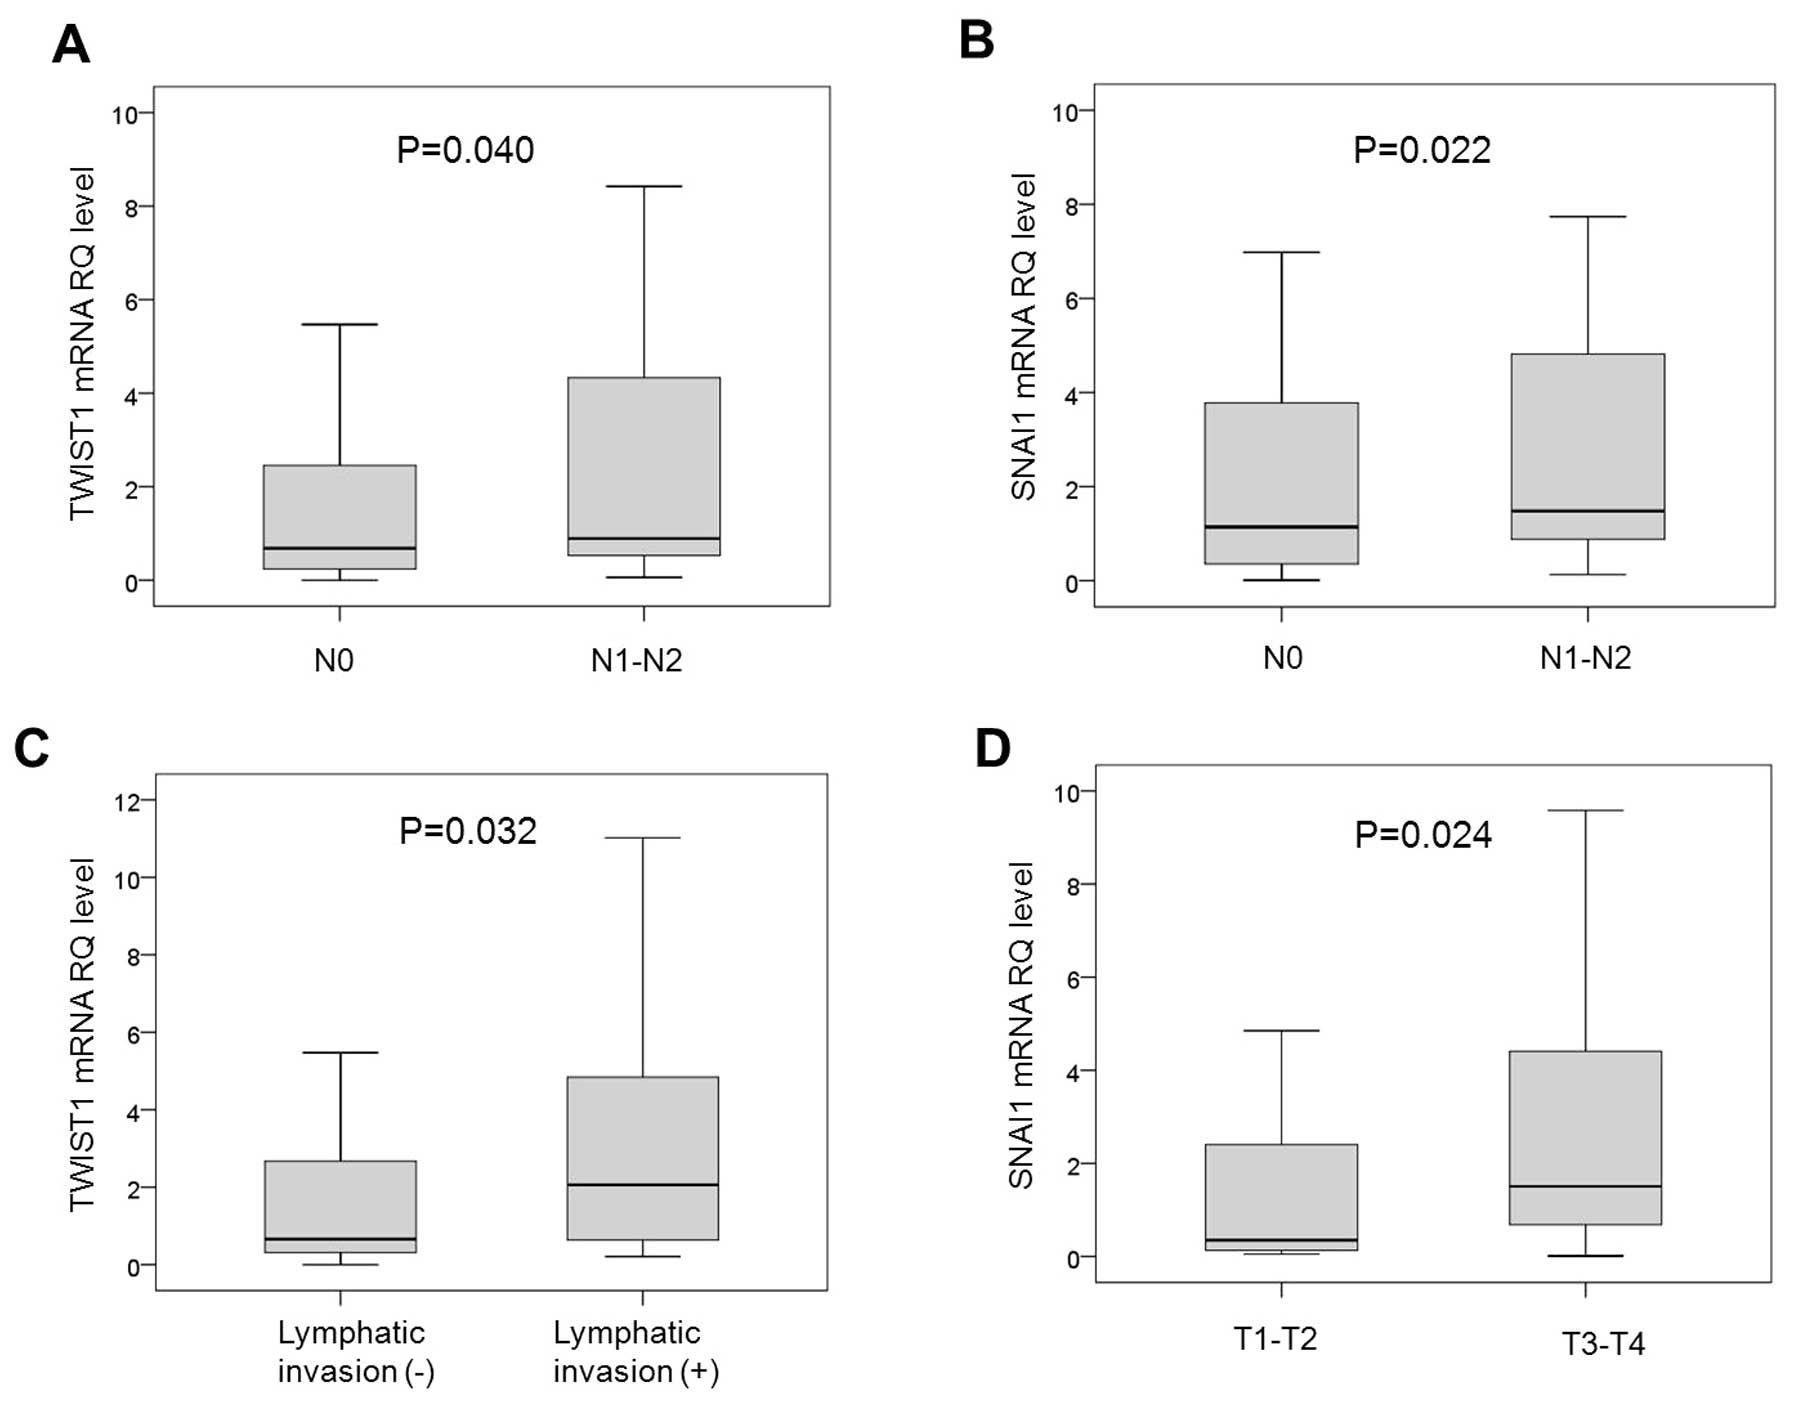
values of RQ for each marker. The mean values of RQ for TWIST1 and
SNAI1 were significantly higher in the subgroup without nodal
invasion (N0) when compared to that with nodal invasion (N1-3)
(P=0.040 and P=0.022, respectively) (Fig. 1A and B, respectively). The mean
value of RQ for TWIST1, but not for those of E-cadherin and SNAI1,
was significantly high in the presence of lymphatic invasion
(P=0.032) (Fig. 1C). SNAI1 showed a
higher mean value of RQ in T3-4 stage than in T1-2 stage cases
(P=0.024) (Fig. 1D), and the mean
values of RQ for E-cadherin, TWIST1 and SNAI1 were not
significantly different depending on whether vascular invasion or
neural invasion was present or not.
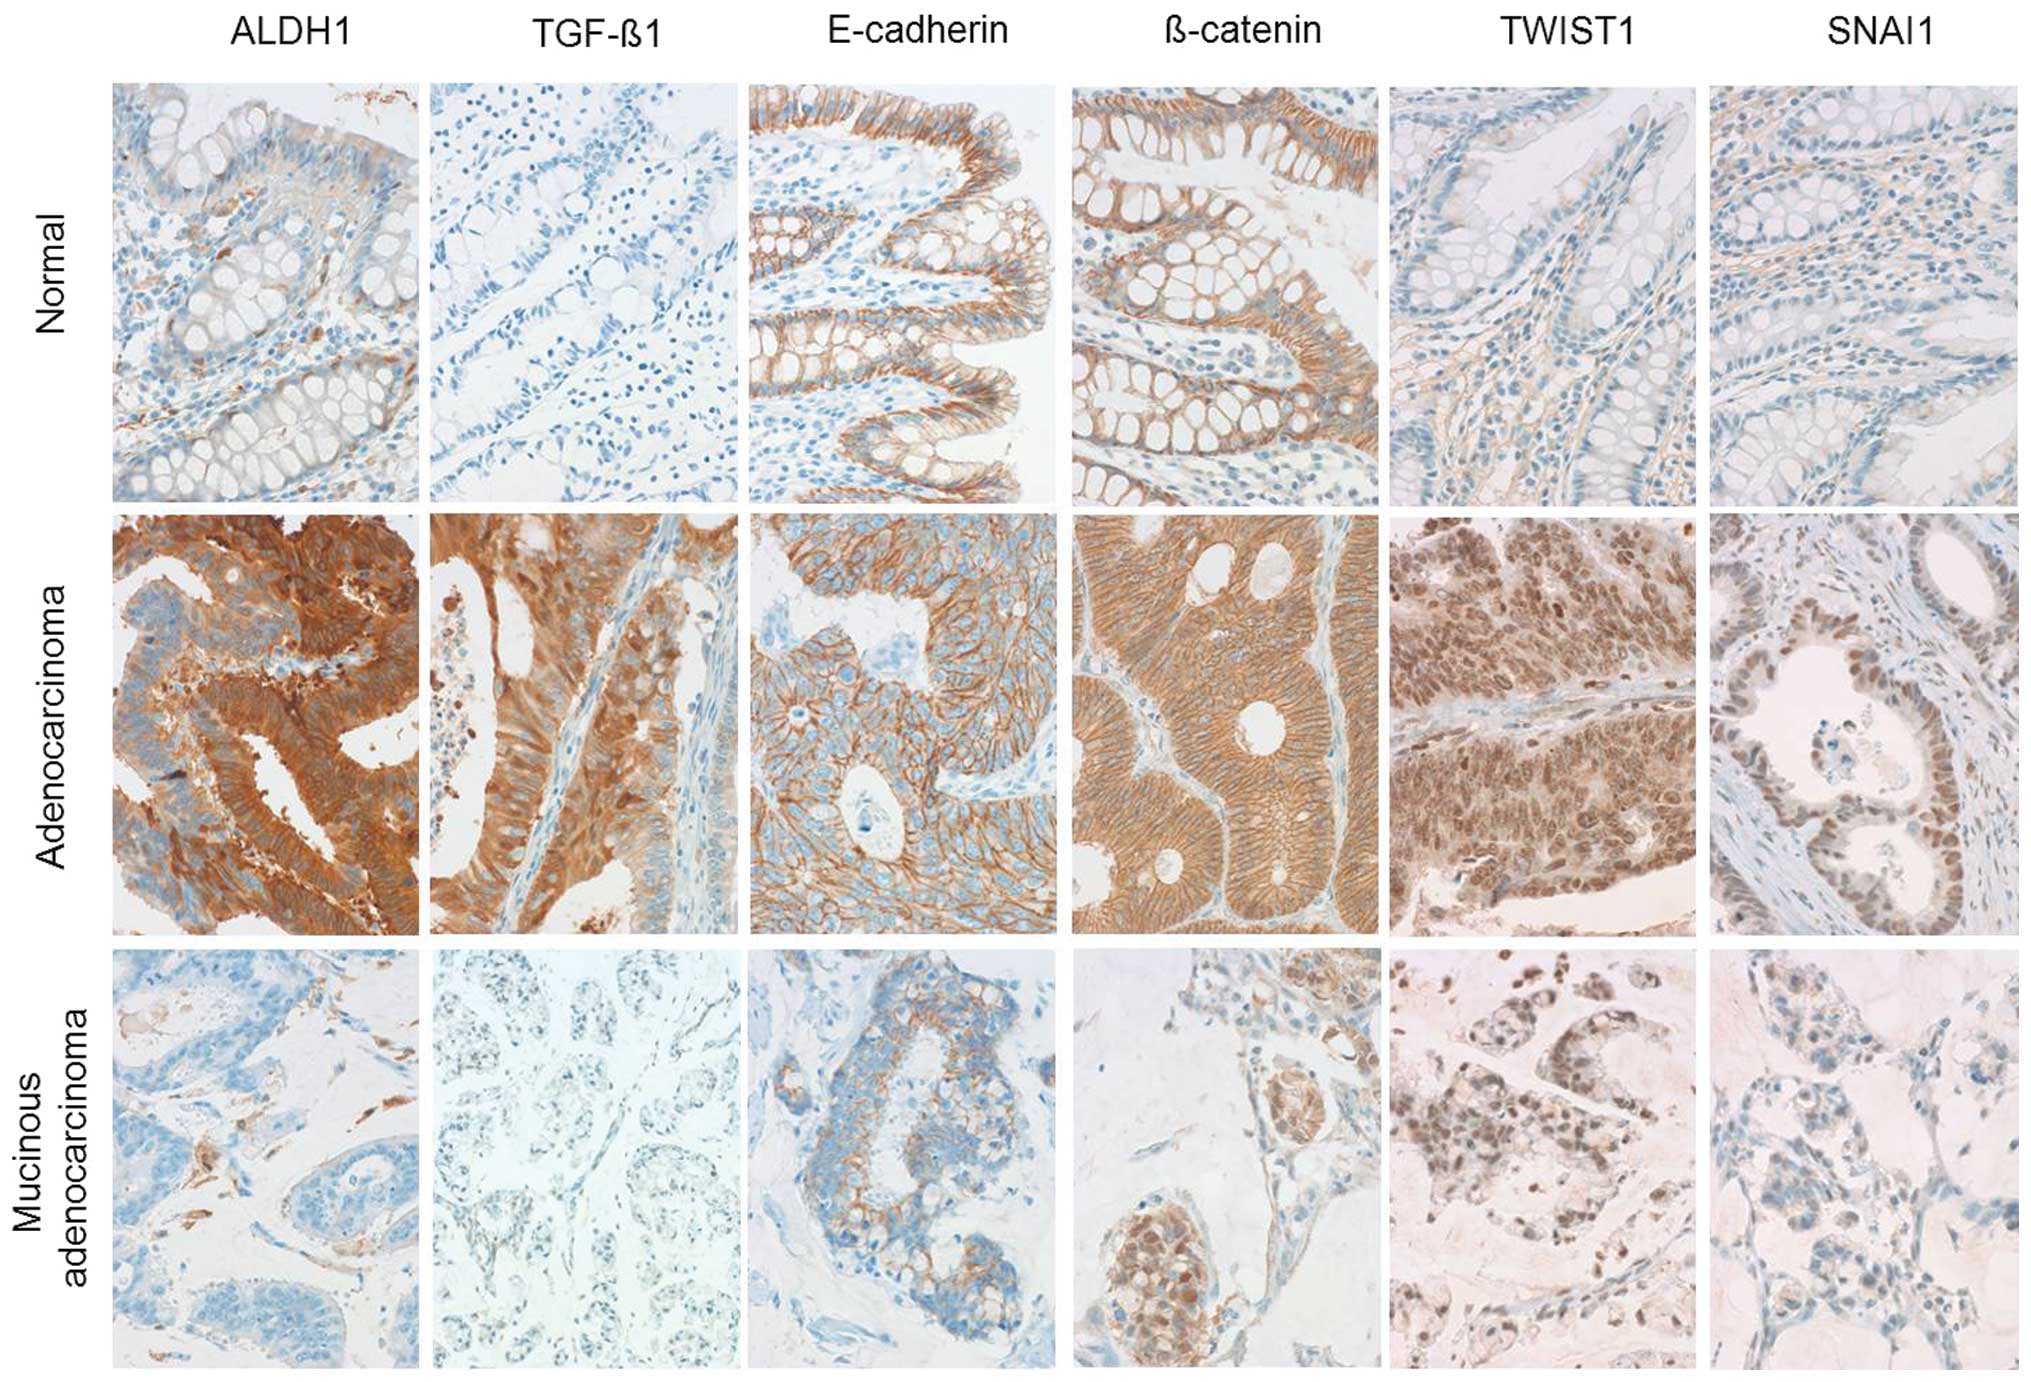
Immunohistochemical staining for EMT and
stem cell markers
qRT-PCR was performed for mRNAs of EMT and stem cell
markers, and immunohistochemical staining was conducted to validate
the possibility of EMT marker expression in the surrounding
mesenchymal cells of the tumor cells. Representative images of the
immunohistochemical staining for each marker are presented in
Fig. 2. ALDH1 was positive in ~5%
of cells at the crypt of the normal colon epithelium. E-cadherin
and β-catenin were strongly expressed along the cell membranes of
normal epithelium. TGF-β1, TWIST1 and SNAI1 were not expressed in
normal epithelial cells. The relationship between
immunohistochemical staining and the clinicopathological
characteristics of our 231 cases is summarized in Table II. ALDH1, TGF-β1, E-cadherin,
nuclear β-catenin, SNAI1 and TWSIT1 were not significantly
different in terms of immunohistochemical staining according to
gender, age, location of the lesion and number of primary lesions.
The extent of nuclear β-catenin expression was significantly higher
in the mucinous adenocarcinoma than in the adenocarcinoma cases
(P=0.046). When carcinomas excluding mucinous adenocarcinoma were
divided into a well to moderately differentiated group and a poor
to undifferentiated group, the former was observed to express
nuclear β-catenin and TWIST1 significantly at a higher extent
(P=0.042 and P=0.022, respectively). Nuclear β-catenin expression
was higher in T1-2 stage than in T3-4 stage cases (p=0.033), and
ALDH1 and TGF-β1 were expressed at a higher extent in N1-3 stage
than in N0 stage cases (P=0.010 and P=0.032, respectively). In
terms of lymphatic invasion, vascular invasion and neural invasion
analysis, ALDH1 was highly expressed in the presence of lymphatic
invasion (P=0.045) and SNAI1 in the presence of vascular invasion
(P=0.017).
Correlation analysis of EMT and stem cell
markers
Spearman’s rank correlation was used to test the
correlation between EMT and stemness markers (Table III). The mRNA expression levels of
E-cadherin and TWIST1 were negatively correlated, while E-cadherin
mRNA expression and immunohistochemical staining were positively
correlated (P=0.045 and P=0.012, respectively). The mRNA expression
of TWIST1 was positively correlated with the extent of expression
of ALDH1, TGF-β1 and TWIST1 according to immunohistochemical
staining (P=0.001, P=0.010 and P=0.004, respectively).
Immunohistochemical staining of ALDH1 was significantly associated
with that of TGF-β1 and nuclear β-catenin (P=0.018 and P=0.010,
respectively), and immunochemical staining of TGF-β1 was positively
correlated with that of TWIST1 (P=0.017).
| Table IIICorrelation between mRNA expression,
immunohistochemical staining of EMT and stemness markers in the
colorectal cancer cases. |
Table III
Correlation between mRNA expression,
immunohistochemical staining of EMT and stemness markers in the
colorectal cancer cases.
| mRNA
expression | Immunochemical
staining |
|---|
|
|
|
|---|
| Rho value | E-cadherin | TWIST1 | SNAI1 | ALDH1 | TGF-β1 | E-cadherin | β-catenin | TWIST1 | SNAI1 |
|---|
| E-cadherin | 1 | −1.93 | 0.05 | 0.01 | −0.13 | 0.24 | 0.01 | 0.05 | 0.16 |
| P-value | | 0.045a | 0.636 | 0.960 | 0.181 | 0.012a | 0.928 | 0.636 | 0.101 |
| TWIST1 | | 1 | 0.14 | 0.31 | 0.25 | 0.03 | 0.14 | 0.27 | −0.01 |
| P-value | | | 0.153 | 0.001a | 0.010a | 0.788 | 0.152 | 0.004a | 0.940 |
| SNAI1 | | | 1 | 0.18 | 0.07 | −0.06 | 0.12 | −0.7 | 0.16 |
| P-value | | | | 0.058 | 0.504 | 0.509 | 0.218 | 0.450 | 0.101 |
| ALDH1 | | | | 1 | 0.23 | 0.05 | 0.25 | 0.07 | 0.13 |
| P-value | | | | | 0.018a | 0.628 | 0.010a | 0.455 | 0.195 |
| TGF-β1 | | | | | 1 | −0.04 | 0.09 | 0.23 | −0.010 |
| P-value | | | | | | 0.655 | 0.346 | 0.017a | 0.916 |
| E-cadherin | | | | | | 1 | 0.14 | 0.03 | 0.11 |
| P-value | | | | | | | 0.162 | 0.739 | 0.260 |
| β-catenin | | | | | | | 1 | −0.89 | 0.15 |
| P-value | | | | | | | | 0.363 | 0.121 |
| TWIST1 | | | | | | | | 1 | −0.09 |
| P-value | | | | | | | | | 0.377 |
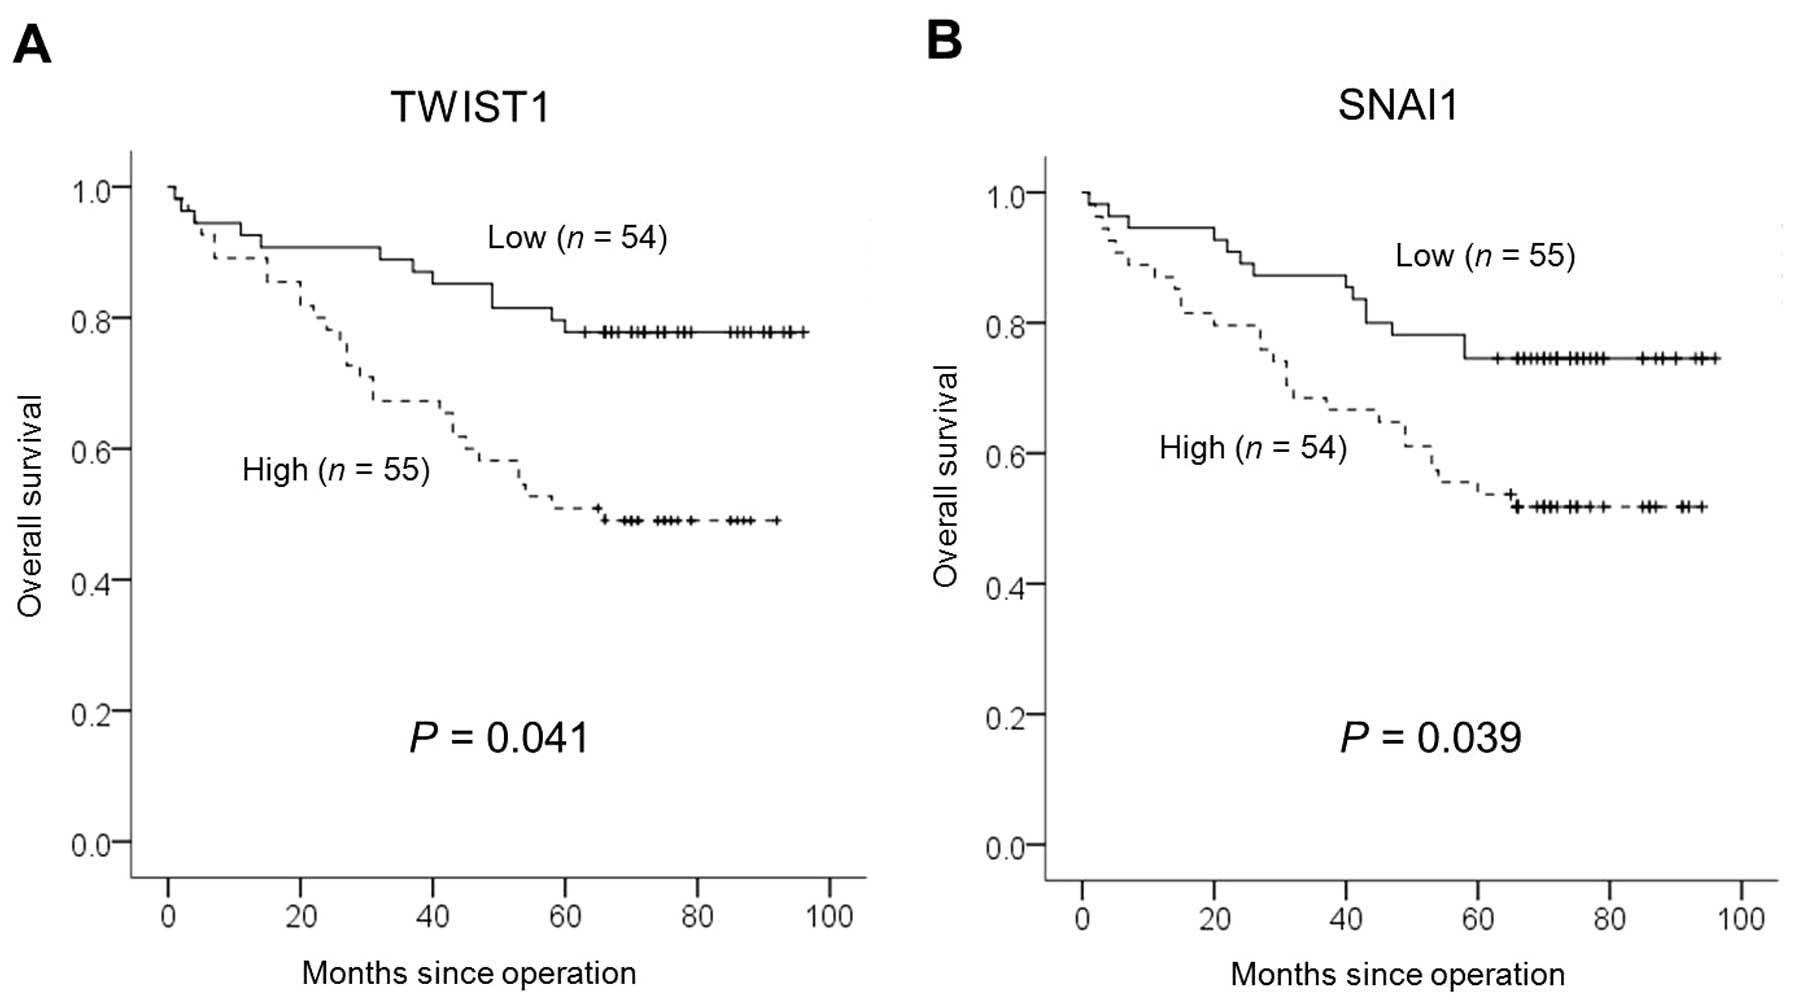
Correlation between patient survival and
EMT and stemness markers
EMT and stemness markers and overall survival were
tested using univariate and multivariate analyses. Kaplan-Meier
univariate analysis was performed according to the median values of
RQ as cut-offs (i.e. high vs. low RQ) for E-cadherin, TWIST1 and
SNAI1 mRNAs and overall survival. Cases that had high RQ for TWIST1
and SNAI1 mRNAs showed significantly lower overall survival. The
mean survival of the group with high RQ of TWIST1 mRNAs was 45.1
months, which was significantly different from the mean survival of
the group with a low mean RQ of TWIST1 mRNAs (53.5 months, P=0.014,
log-rank test) (Fig. 3A); the mean
survival of the group with a high mean RQ of SNAI1 mRNAs was 45.1
months, which was significantly different from 53.5 months in the
lower group (P=0.002, log-rank test) (Fig. 3B). In the multivariate analysis,
TWIST1 and SNAI1 were found to be independent significant
prognostic factors for poor overall survival (P=0.041 and P=0.039,
respectively; Cox’s proportional hazards regression model)
(Table IV). In the Kaplan-Meier
univariate analysis of overall survival and immunohistochemical
staining of ALDH1, TGF-β1, E-cadherin, β-catenin, TWIST1 and SNAI1,
overall survival was significantly different only for ALDH1
expression (P=0.003, log-rank test), but the significance was lost
in the multivariate analysis (P=0.232, Cox’s proportional hazards
regression model).
| Table IVCorrelation of patient survival and
EMT and stem cell markers in the colorectal cancer cases. |
Table IV
Correlation of patient survival and
EMT and stem cell markers in the colorectal cancer cases.
| Variables | Univariate
analysisb | Multivariate
analysisc | Hazard ratio | 95% CI |
|---|
| E-cadherin | 0.859 | 0.897 | 0.95 | 0.46–1.97 |
| TWIST1 | 0.002a | 0.039a | 2.29 | 1.04–5.00 |
| SNAI1 | 0.014a | 0.041a | 2.11 | 1.03–4.33 |
|
Differentiation | 0.023a | 0.193 | 2.12 | 0.68–6.59 |
| Stage (I, II vs.
III+IV) | <0.0001a | 0.001a | 3.65 | 1.66–8.00 |
Discussion
EMT and cancer stem cells are important
pathophysiological concepts for tumorigenesis and metastasis of
cancer. Mani et al confirmed the role of TWIST1 and SNAI1 as
EMT regulators by demonstrating EMT induction and stem cell
properties when TWIST1 and SNAI1 were overexpressed in immortalized
human mammary epithelial cells (9).
TWIST1 and SNAI1 are known to be controlled independently and to
promote EMT through collaboration as well (19,20).
In previous studies, TWIST1 overexpression was observed not only in
breast, prostate, lung, uterine and skin cancers but also in upper
gastrointestinal tract cancers of the esophagus and stomach, with
significant outcomes in terms of invasiveness (21–24).
However, the role of TWIST1 overexpression is not yet clear in
colorectal types of cancers, and there has been only a limited
number of studies investigating the association between the degree
of TWIST1 expression and survival in human colon cancer cases.
Valdés-Mora et al suggested that TWIST1 overexpression in
colon cancer is associated with nodal invasion, but unlike our
study they did not confirm the association with overall survival
(22). In addition, they concluded
that TWIST1 expression was significantly higher in males and did
not lead to a difference in lymphovascular invasion. They only
determined the mRNA level of TWIST1 by using real-time PCR without
validation of protein expression. In addition, they used a
relatively small sample size of 54 colon cancer patients which
included twice as many men as women. We found that higher
expression of TWIST1 mRNA was associated with lymph node metastasis
and poor overall survival in the 109 patients with colorectal
carcinomas and their mRNA expression was validated by
immunohistochemical staining in an expanded population of 231
colorectal carcinoma cases.
The Snail family, a group of zinc-finger
transcription repressors, is known to play an important role in EMT
by inhibiting the same cell junction component as E-cadherin
(25). Shioiri et al
suggested that the expression of SLUG (SNAI2), one of the Snail
family members, was an independent prognostic factor of colon
cancer (26). SNAI1, with higher
affinity to E-cadherin and other target genes than SNAI2, is a
candidate prognostic factor of colon cancer and is known to be
significantly associated with colon cancer invasiveness and
metastasis (27,28). Although the association between
SNAI1 and E-cadherin was not found in the present study, we found
that higher expression of SNAI1 mRNA was associated with lymph node
metastasis and higher T stages. Moreover, we confirmed that
overexpression of SNAI1 mRNA is a poor prognostic factor in terms
of patient overall survival.
Taken together, our results support the hypothesis
that TWIST1 and SNAI1 overexpression in colon cancer stimulates the
process of EMT, and the resultant lymphatic and nodal invasion
affects the progression of the tumors and patient survival. Since
previous studies suggest that EMT is induced by cancer stem cells
(9), we analyzed the association of
various EMT markers and putative colorectal cancer stem cell
markers. The cancer stem cell hypothesis, first introduced by
Rudolf Virchow, was confirmed by Al-Hajj et al (14) in breast cancer, which is an
epithelium-derived tumor, and then by O’Brien et al
(29) who confirmed the presence of
colon cancer stem cells by transplanting CD133+ human
colon cancer-initiating cells to immunodeficient mice. However,
later reports of the non-specificity of CD133 expression in stem
cells motivated us to focus on ALDH1 (30). Highly active ALDH1 increases the
resistance to oxidative insults, thereby increasing the resistance
to chemotherapies, and is suspected to play an important role in
the recurrence and survival of carcinomas. In the present study,
higher expression of ALDH1 immunostaining in colorectal cancer
tissues was significantly associated with higher clinical and nodal
stages, lymphatic invasion and worse overall survival. However, the
association between ALDH1 expression and overall survival was
significant only in the univariate analysis (P=0.003). One of the
possible reason is that the expression of ALDH1 was highly
correlated with and dependent on the expression of TWIST1 as shown
in Table III. Our results showed
that TWIST1 expression had a better association with expression of
other EMT and stem cell markers than SNAI1. This may be because
SNAI1 is less stable inside the cell nucleus when compared with
TWIST1, although the exact half-life is unknown (31). Furthermore, in previous in
vitro studies, TWIST1 was found to induce SNAI1 and other EMT
regulators; Weinberg et al even suggested TWIST1 as the
master transcription factor related to EMT (32,33).
In order to explain the association between EMT and
cancer stem cells, we examined known EMT-related cytokines and the
stem cell pathway. TGF-β is known as a cytokine that plays an
important role in transcriptional activation of the Snail family,
TWIST and others as well as in the regulation of cancer stem cells
(34). We observed a positive
correlation between TGF-β1 and ALDH1 in the immunohistochemical
staining. Yet, TGF-β1 expression was not associated with the
prognosis of the colorectal cancer. Increased nuclear β-catenin,
the key effector of the Wnt pathway, affects EMT, cell to cell
adhesion and stem cell phenotype (35). In the present study, nuclear
β-catenin was expressed to a significantly higher extent in well to
moderately differentiated carcinomas. Although nuclear β-catenin
was identified to a greater extent in tumors with lower T-stage and
higher ALDH1 expression, it was not associated with patient
survival. Accordingly, our results suggest that TWIST1 is activated
in human colon cancer by TGF-β, which is known to induce pro-EMT
signaling stimulus and a stemness phenotype, and that activated
TWIST1 regulates the initiation of EMT by suppressing E-cadherin,
activates the EMT process by inducing SNAI1, and causes a stemness
phenotype by inducing the expression of ALDH1. In addition, we
propose that ALDH1 induces colon cancer proliferation by means of
increasing nuclear translocation of β-catenin.
The present study had some limitation as functional
experiments revealing causal relationship among factors were not
performed. One more limitation was that the identification of EMT
and stem cell markers in metastatic lesions was not shown.
Nevertheless, the possibility of controlling TWIST1 and SNAI1 is an
appropriate strategy in the treatment of colorectal cancers. In
prostate cancer, downregulation of TWIST1 activates apoptosis and
promotes chemosensitization to Taxol by downregulating the
BCl-2/Bax ratio, while overexpression of TWIST1 inhibits
paclitaxel-induced apoptosis in nasopharyngeal cancer (36,37).
SNAI1 overexpression is also known to induce chemoresistance to
oxaliplatin in colon cancer (38).
TGF-β-mediated control of EMT markers and the stemness phenotype
affect cancer metastasis and invasiveness. Clinical studies on
ligand trap, antisense oligonucleotide and small molecule receptor
kinase inhibitors, which inhibit TGF-β, are currently underway, and
further studies are expected to determine the role of such agents
in the inhibition of TWIST1 and SNAI1 expression and inhibition of
EMT (39).
In conclusion, we demonstrated that overexpression
of TWIST1 and SNAI1, both as EMT markers, is associated with poor
overall survival in patients with colorectal cancers. Moreover,
their expression was correlated with the expression of TGF-β1 and
the cancer stem cell phenotype. Our results suggest that
controlling the EMT process through TWIST1, SNAI1 or TGF-β1 in
colorectal cancers can be a possible therapeutic target of cancer
stem cells. Further studies concerning the regulation of the
process of EMT with functional experiments are warranted.
References
|
1
|
McDermott U, Longley DB and Johnston PG:
Molecular and biochemical markers in colorectal cancer. Ann Oncol.
13(Suppl 4): 235–245. 2002. View Article : Google Scholar
|
|
2
|
Jemal A, Murray T, Ward E, et al: Cancer
statistics, 2005. CA Cancer J Clin. 55:10–30. 2005. View Article : Google Scholar
|
|
3
|
Sporn MB: The war on cancer. Lancet.
347:1377–1381. 1996. View Article : Google Scholar : PubMed/NCBI
|
|
4
|
Voulgari A and Pintzas A:
Epithelial-mesenchymal transition in cancer metastasis: mechanisms,
markers and strategies to overcome drug resistance in the clinic.
Biochim Biophys Acta. 1796:75–90. 2009.PubMed/NCBI
|
|
5
|
Kalluri R and Weinberg RA: The basics of
epithelial-mesenchymal transition. J Clin Invest. 119:1420–1428.
2009. View
Article : Google Scholar : PubMed/NCBI
|
|
6
|
Thiery JP, Acloque H, Huang RY and Nieto
MA: Epithelial-mesenchymal transitions in development and disease.
Cell. 139:871–890. 2009. View Article : Google Scholar : PubMed/NCBI
|
|
7
|
Yang J and Weinberg RA:
Epithelial-mesenchymal transition: at the crossroads of development
and tumor metastasis. Dev Cell. 14:818–829. 2008. View Article : Google Scholar : PubMed/NCBI
|
|
8
|
Rosivatz E, Becker I, Specht K, et al:
Differential expression of the epithelial-mesenchymal transition
regulators snail, SIP1, and twist in gastric cancer. Am J Pathol.
161:1881–1891. 2002. View Article : Google Scholar : PubMed/NCBI
|
|
9
|
Mani SA, Guo W, Liao MJ, et al: The
epithelial-mesenchymal transition generates cells with properties
of stem cells. Cell. 133:704–715. 2008. View Article : Google Scholar : PubMed/NCBI
|
|
10
|
Roy S and Majumdar AP: Signaling in colon
cancer stem cells. J Mol Signal. 7:112012. View Article : Google Scholar
|
|
11
|
Reya T, Morrison SJ, Clarke MF and
Weissman IL: Stem cell, cancer, and cancer stem cells. Nature.
414:105–111. 2001. View
Article : Google Scholar : PubMed/NCBI
|
|
12
|
Bhat-Nakshatri P, Appaiah H, Ballas C, et
al: SLUG/SNAI2 and tumor necrosis factor generate breast cells with
CD44+/CD24− phenotype. BMC Cancer.
10:4112010. View Article : Google Scholar : PubMed/NCBI
|
|
13
|
Giannoni E, Bianchini F, Masieri L, et al:
Reciprocal activation of prostate cancer cells and
cancer-associated fibroblasts stimulates epithelial-mesenchymal
transition and cancer stemness. Cancer Res. 70:6945–6956. 2010.
View Article : Google Scholar
|
|
14
|
Al-Hajj M, Wicha MS, Benito-Hernandez A,
Morrison SJ and Clarke MF: Prospective identification of
tumorigenic breast cancer cells. Proc Natl Acad Sci USA.
100:3983–3988. 2003. View Article : Google Scholar : PubMed/NCBI
|
|
15
|
Ginestier C, Hur MH, Charafe-Jauffret E,
et al: ALDH1 is a marker of normal and malignant human mammary stem
cells and a predictor of poor clinical outcome. Cell Stem Cell.
1:555–567. 2007. View Article : Google Scholar : PubMed/NCBI
|
|
16
|
Huang EH, Hynes MJ, Zhang T, et al:
Aldehyde dehydrogenase 1 is a marker for normal and malignant human
colonic stem cells (SC) and tracks SC overpopulation during colon
tumorigenesis. Cancer Res. 69:3382–3389. 2009. View Article : Google Scholar : PubMed/NCBI
|
|
17
|
Edge SB, Byrd DR, Compton CC, Fritz AG,
Greene FL and Trotti A III: AJCC Cancer Staging Manual. 7th
edition. Springer; Chicago, IL: 2010
|
|
18
|
Qiao Q, Ramadani M, Gansauge S, Gansauge
F, Leder G and Beger HG: Reduced membranous and ectopic cytoplasmic
expression of β-catenin correlate with cyclin D1 overexpression and
poor prognosis in pancreatic cancer. Int J Cancer. 95:194–197.
2001.
|
|
19
|
Yang MH, Chen CL, Chau GY, et al:
Comprehensive analysis of the independent effect of twist and snail
in promoting metastasis of hepatocellular carcinoma. Hepatology.
50:1464–1474. 2009. View Article : Google Scholar : PubMed/NCBI
|
|
20
|
Schwock J, Bradley G, Ho JC, et al: SNAI1
expression and the mesenchymal phenotype: an immunohistochemical
study performed on 46 cases of oral squamous cell carcinoma. BMC
Clin Pathol. 10:12010. View Article : Google Scholar : PubMed/NCBI
|
|
21
|
Lee TK, Poon RT, Yuen AP, et al: Twist
overexpression correlates with hepatocellular carcinoma metastasis
through induction of epithelial-mesenchymal transition. Clin Cancer
Res. 12:5369–5376. 2006. View Article : Google Scholar
|
|
22
|
Valdés-Mora F, Gómez del Pulgar T, Bandrés
E, et al: TWIST1 overexpression is associated with nodal invasion
and male sex in primary colorectal cancer. Ann Surg Oncol.
16:78–87. 2009.PubMed/NCBI
|
|
23
|
Gomez I, Peña C, Herrera M, et al:
TWIST1 is expressed in colorectal carcinomas and predicts
patient survival. PLoS One. 6:e180232011. View Article : Google Scholar
|
|
24
|
Natalwala A, Spychal R and Tselepis C:
Epithelial-mesenchymal transition mediated tumourigenesis in the
gastrointestinal tract. World J Gastroenterol. 14:3792–3797. 2008.
View Article : Google Scholar : PubMed/NCBI
|
|
25
|
Nieto MA: The snail superfamily of
zinc-finger transcription factors. Nat Rev Mol Cell Biol.
3:155–166. 2002. View
Article : Google Scholar : PubMed/NCBI
|
|
26
|
Shioiri M, Shida T, Koda K, et al: Slug
expression is an independent prognostic parameter for poor survival
in colorectal carcinoma patients. Br J Cancer. 94:1816–1822. 2006.
View Article : Google Scholar : PubMed/NCBI
|
|
27
|
Bolós V, Peinado H, Pérez-Moreno MA, Fraga
MF, Esteller M and Cano A: The transcription factor Slug represses
E-cadherin expression and induces epithelial to mesenchymal
transitions: a comparison with Snail and E47 repressors. J Cell
Sci. 116:499–511. 2003.
|
|
28
|
Fan F, Samuel S, Evans KW, Lu J, Xia L,
Zhou Y, Sceusi E, Tozzi F, Ye XC, Mani SA and Ellis LM:
Overexpression of Snail induces epithelial-mesenchymal transition
and a cancer stem cell-like phenotype in human colorectal cancer
cells. Cancer Med. 1:5–16. 2012. View
Article : Google Scholar : PubMed/NCBI
|
|
29
|
O’Brien CA, Pollett A, Gallinger S and
Dick JE: A human colon cancer cell capable of initiating tumour
growth in immunodeficient mice. Nature. 445:106–110.
2007.PubMed/NCBI
|
|
30
|
Shmelkov SV, Butler JM, Hooper AT, et al:
CD133 expression is not restricted to stem cells, and both
CD133+ and CD133− metastatic colon cancer
cells initiate tumors. J Clin Invest. 118:2111–2120.
2008.PubMed/NCBI
|
|
31
|
Zhou BP, Deng J, Xia W, et al: Dual
regulation of Snail by GSK-3β-mediated phosphorylation in control
of epithelial-mesenchymal transition. Nat Cell Biol. 6:931–940.
2004.PubMed/NCBI
|
|
32
|
Smit MA, Geiger TR, Song JY, Gitelman I
and Peeper DS: A Twist-Snail axis critical for TrkB-induced
epithelial-mesenchymal transition-like transformation, anoikis
resistance, and metastasis. Mol Cell Biol. 29:3722–3737. 2009.
View Article : Google Scholar : PubMed/NCBI
|
|
33
|
Yang J, Mani SA, Donaher JL, et al: Twist,
a master regulator of morphogenesis, plays an essential role in
tumor metastasis. Cell. 117:927–939. 2004. View Article : Google Scholar : PubMed/NCBI
|
|
34
|
Imammura T, Hikita A and Inoue Y: The
roles of the TGF-β signaling in carcinogenesis and breast cancer
metastasis. Breast Cancer. 19:118–124. 2012.
|
|
35
|
Huang D and Du X: Crosstalk between tumor
cells and microenviroment via Wnt pathway in colorectal cancer
dissemination. World J Gastroenterol. 14:1823–1827. 2008.
View Article : Google Scholar : PubMed/NCBI
|
|
36
|
Kwok WK, Ling MT, Lee TW, et al:
Up-regulation of TWIST in prostate cancer and its implication as a
therapeutic target. Cancer Res. 65:5153–5162. 2005. View Article : Google Scholar : PubMed/NCBI
|
|
37
|
Yu L, Li HZ, Lu SM, et al: Alteration in
TWIST expression: possible role in paclitaxel-induced apoptosis in
human laryngeal carcinoma Hep-2 cell line. Croat Med J. 50:536–542.
2009. View Article : Google Scholar : PubMed/NCBI
|
|
38
|
Yang AD, Fan F, Camp ER, et al: Chronic
oxaliplatin resistance induces epithelial-to-mesenchymal transition
in colorectal cancer cell lines. Clin Cancer Res. 12:4147–4153.
2006. View Article : Google Scholar : PubMed/NCBI
|
|
39
|
Connolly EC, Freimuth J and Akhurst RJ:
Complexities of TGF-β targeted cancer therapy. Int J Biol Sci.
8:964–978. 2012.
|