Introduction
microRNAs (miRNAs) are ~22 nt long, non-coding,
single-stranded RNAs that regulate gene expression. They are
essential regulators of cellular processes such as proliferation,
apoptosis, differentiation and motility (1). miRNAs are aberrantly expressed in a
number of different tumor tissues including oral squamous cell
carcinoma (OSCC) (2–7). Alterations in miRNA expression levels
have been shown to be associated with tumor progression,
recurrence, development of metastases and chemoresistance (2,8–11).
miRNAs circulate in blood and are stable in this
environment. Studies regarding different tumor entities have shown
altered miRNA expression patterns in the blood of affected patients
when compared to healthy volunteers (12–16).
These differential miRNA expression profiles in
blood have also been observed when head and neck cancer patients
were compared to healthy controls (17–21).
Unfortunately, head and neck squamous cell carcinoma (HNSCC)
comprises a heterogeneous group of tumors that are located in the
oral cavity, the nasal cavity, nasopharynx, pharynx and larynx.
Based on tumor localization, the biology of SCC can vary
significantly. Consequently, expression patterns of miRNAs also
differ in relation to tumor region (7). To date, only a few studies on a small
number of circulating miRNAs have been performed exclusively in
OSCC patients (17–20,22,23).
Hence, the first step in identifying more miRNA candidates is
expression analysis by miRNA microarrays which allows investigation
of a large number of different miRNAs simultaneously. A further
shortcoming of previous studies is that the selection of analyzed
miRNAs was based on miRNA expression in cancer tissue samples.
However, it is well known that miRNAs that exhibit altered
expression levels in the blood of cancer patients are not
necessarily identical to miRNAs that are differentially expressed
in cancer tissue samples (17,18,23,24).
Furthermore, only one of the blood components, either plasma or
serum, was obtained for the investigations, although miRNA
profiling based on whole blood appears to be the most reliable
(25).
The present study aimed to evaluate the difference
in miRNA expression patterns in whole blood samples of OSCC
patients compared to healthy volunteers who served as controls in
order to evaluate the usefulness of these biomarkers for detection
of OSCC using a minimally invasive method based on whole blood
samples.
Materials and methods
Patients and sample collection
The present study was approved by the Ethics
Committee of the University of Erlangen-Nuremberg, Erlangen,
Germany. Whole blood samples of 57 OSCC patients (test group) and
33 healthy volunteers (control group) were collected. Patient
informed consent was obtained. Patients were included in the
present study if OSCC occurred for the first time and whole blood
samples were able to be collected before surgical removal of the
tumor or radiotherapy and/or chemotherapy. Healthy volunteers were
selected based on the absence of general disease and acute or
chronic inflammation.
After the collection of whole blood, tissue samples
of the OSCC (test group) and normal oral mucosa (control group)
were harvested. All tissue samples were examined by two experienced
pathologists.
Age and gender of the patients were compiled.
Grading (G1–G3), staging (I–IV) and TNM classification of the OSCC
cases were carried out according to the guidelines of the World
Health Organization and the International Union Against Cancer
(26). Subsequently, tumors were
grouped as early (including stage I and II) and late (including
stage III and IV) clinical stages and as N=0 and N>0 in order to
indicate cases with negative and positive lymph node status,
respectively. Furthermore, subgroups were established based on
tumor size dividing the samples into small (T1/T2) and large
(T3/T4) malignancies.
Sampling of whole blood and miRNA
isolation
Two samples consisting of 2.5 ml of whole blood of
the OSCC patients and healthy volunteers were collected in a
PAXgene Blood RNA Tube (PreAnalytiX GmbH, Hombrechtikon,
Switzerland) before tumor removal. The samples were carefully
inverted, incubated at room temperature for 2 h and stored at −80°C
until miRNA isolation.
Whole RNA was extracted using the PAXgene Blood
miRNA Kit (PreAnalytiX GmbH). RNA concentration was measured with a
NanoDrop spectrometer (PEQLAB, Erlangen, Germany). The integrity
and size distribution of total RNA were checked using the Agilent
2100 Bioanalyzer (Agilent Technologies, Inc., Santa Clara, CA, USA)
and the RNA 6000 Nano kit (Agilent Technologies, Waldbronn,
Germany). Subsequently, the RNA samples were stored at −80°C.
Gene expression analysis by miRNA
microarray
Twenty blood samples of the test and the control
group were analyzed. miRNA microarrays were performed on the
GeniomH real-time analyzer (GRTA; Febit GmbH, Heidelberg, Germany)
using Agilent’s SurePrint G3 human v16 miRNA Array Kit, 8×60K
(release 16.0) microarrays (Agilent Technologies, Inc.) which were
updated from the Sanger miRBase 16.0. The miRNA microarrays
included 1,205 human and 144 human viral miRNAs. The study was
focused on the miRNA expression differences between whole blood
samples of the patients compared to those of the normal controls.
By comparison of the normalized and background subtracted median
intensity values which were received after microarray analyses
using the Geniom Wizard Software, miRNAs showing a different
behavior between the two groups were identified. To this end, the
following different statistical measures were applied: parametric
t-test (unpaired, two-tailed), Wilcoxon Mann-Whitney test (WMW,
unpaired, two-tailed), a linear model with p-values computed by an
empirical Bayes approach (Limma), the area under the receiver
operator characteristic curve (AUC) and determination of the
fold-change quotients. All p-values were adjusted for multiple
testing by Benjamini-Hochberg (27)
adjustment.
Expression signals showing at least a 2-fold
difference in abundance between the tumor and normal samples and
p-values of Limma <0.05 were identified as differentially
regulated. AUC values can range from 0 to 1. A value of 0.5
indicated equal distribution among the healthy and diseased
subjects and indicated that the intensity values generated by RNA
from the blood of patients and healthy subjects could not be used
to make a distinction between the groups. An AUC value >0.5
indicated higher expression intensities of the respective miRNA in
OSCC samples (upregulated miRNA) whereas an AUC <0.5 indicated
higher expression values of the miRNA in the controls
(downregulated miRNA). An AUC of 1 and 0 corresponded to a perfect
separation.
Real-time quantitative reverse
transcription-PCR (RT-qPCR) analysis
miR-186, miR-494 and miR-3651 which were identified
to be differentially expressed by miRNA microarray analysis between
the groups were analyzed in the test group (n=57) as well as in the
control group (n=33) by RT-qPCR. These analyses were conducted
using 500 ng of total RNA. In the first step, miRNA was reverse
transcribed using the miScrip II RT Kit according to the
manufacturer’s recommendations (Qiagen, Hilden, Germany). Detection
of amplification was performed on 2.5 ng of cDNA on an ABI 7300
Sequence Detection System (Applied Biosystems, Foster City, CA,
USA) using the miScript SYBR-Green PCR Kit and miRNA-specific
quantitative RT-PCR primer sets for the miRNA of interest (Qiagen).
The features of the miRNAs are summarized in Table I.
 | Table IList of miRNAs, snRNAs (endogenous
controls) and the miScript Primer assay (Qiagen) used in the
RT-qPCR analyses. |
Table I
List of miRNAs, snRNAs (endogenous
controls) and the miScript Primer assay (Qiagen) used in the
RT-qPCR analyses.
| Sanger ID | Sanger accession
mature miRNA | Sequence | Ref. no.
(Qiagen) |
|---|
| miRNAs |
|
hsa-miR-186-5p | MIMAT0000456 |
CAAAGAAUUCUCCUUUUGGGCU | MS 00008883 |
| hsa-miR-3651 | MIMAT0018071 |
CAUAGCCCGGUCGCUGGUACAUGA | MS 00023121 |
|
hsa-miR-494-5p | MIMAT0026607 |
AGGUUGUCCGUGUUGUCUUCUC | MSC 0002535 |
|
| Ref. seq. | | |
|
| Endogenous
controls |
| RNU6-2 | NR_002752 | | MS 00033740 |
| SNORD44 | NR_002750 | | MS 00007518 |
Normalization and relative quantification
of whole blood miRNA expression
The values of RT-qPCR analyses were normalized by
the ΔCT method. For that purpose the primer sets RNU6-2 (U6 snRNA,
RNA U6 small nuclear 2) and SNORD44 (small nucleolar RNA, C/D box
44), which are known to be stably expressed in whole blood across
normal and cancer patients, were taken as internal controls
(Qiagen) (Table I). The mean value
of both controls was applied as the normalization value. Relative
quantification of differences in expression (RQ =
2−ΔΔCT) between the two groups was carried out by the
ΔΔCT method using Microsoft Excel® 2003 for Windows
(Microsoft Corporation, Redmond, WA, USA).
Statistical analyses of RT-qPCR
For statistical evaluation of the RT-qPCR analysis,
the program IBM® SPSS Statistics 19 (Chicago, IL, USA)
was applied. In addition, relative expression (RQ) of the examined
genes between the two groups was determined by the ΔΔCT method
taking into account the mean values of all ΔCT within a group.
Two-fold changes in miRNA expression rates (2≤ RQ ≤0.5) between the
two groups were defined as statistically relevant.
The mean value of duplicate ΔCT values of each
sample was used for the data results. Expression data were
controlled for normal distribution by Shapiro-Wilk test. Data
derived from RT-qPCR and presented as ΔCT values were expressed as
the median (ME), the interquartile range (IQR), standard deviation
(SD) and range. Graphical diagrams are plotted as Box-Whisker plots
which represent the median, the interquartile range, and minimum
and maximum values of determined miRNA expression. Statistical
relevance of the apparent expression between the two groups was
analyzed by Mann-Whitney U test. A p-value ≤0.05 was considered to
indicate a statistically significant result.
Furthermore the expression profile of each
differentially expressed miRNA was used for creation of receiver
operator characteristic (ROC) curves. This method displays the
discriminatory accuracy of the marker for distinguishing between
two groups. It is a plot of the sensitivity (true-positive rate)
vs. 1-specificity (false-positive rate) over all possible threshold
values of the marker. The area under the ROC curve (AUC) value of
miRNAs defines the usefulness of an miRNA with respect to its
ability to separate the two different groups of blood donors.
Additionally, by using the ROC curve, the highest
Youdan index was calculated. This value is associated with the
critical expression point or the optimal threshold value,
respectively, cut-off point (COP) for the biological marker. The
COP indicates which value of increased or decreased expression is
relevant for the discrimination between malignant and normal
samples and allows assigning a particular sample to a certain group
(28).
Based on these COPs, the two groups were divided
into two subgroups which showed an expression rate over or under
the COP. Afterwards, associations between altered miRNA expression
and malignancy, clinical features and histopathological parameters
were calculated by the Chi-square test.
Results
Clinical and histopathological parameters
of the study participants
Whole blood samples of 57 OSCC patients (test group)
and 33 healthy volunteers (control group) were collected.
Demographic characteristics of all participants are documented in
Table II. Histopathological
parameters of all patients with OSCC are shown in Table III.
| Table IIDemographic characteristics of the
test group (OSCC patients) and the control group (healthy
volunteers). |
Table II
Demographic characteristics of the
test group (OSCC patients) and the control group (healthy
volunteers).
| Characteristic | Test group | Control group | Total |
|---|
| No. of cases | 57 | 33 | 90 |
| Mean age ± SD
(years) | 64.4±11.01 | 60.5±20.68 | 60.5±15.29 |
| Age range
(years) | 35–93 | 15–88 | 15–93 |
| Gender n (%) |
| Male | 39 (68.4) | 23 (69.7) | 62 (68.9) |
| Female | 18 (31.6) | 10 (30.3) | 28 (31.1) |
| Table IIIAssociation between the miRNA
expression rates and the clinical and histopathological parameters
of all OSCC patients. |
Table III
Association between the miRNA
expression rates and the clinical and histopathological parameters
of all OSCC patients.
| | Total no. (%) of
positive cases for each miRNA |
|---|
| |
|
|---|
| Variables | No. of cases | hsa-miR-186 | hsa-miR-3651 | hsa-miR-494 |
|---|
| Total no. | 57 | 35 (61.4) | 48 (84.2) | 32 (56.1) |
| Tumor size (T) |
| 1 | 17 | 13 (76.5) | 14 (82.4) | 10 (58.8) |
| 2 | 18 | 10 (55.6) | 14 (77.8) | 9 (50.0) |
| 3 | 6 | 3 (50) | 6 (100) | 4 (66.7) |
| 4 | 16 | 9 (56.3) | 14 (87.5) | 9 (56.3) |
| T1/T2 | 35 | 23 (65.7) | 28 (80.0) | 19 (54.3) |
| T3/T4 | 22 | 12 (54.5) | 20 (90.9) | 13 (59.1) |
| Lymph node
status |
| N0 | 33 | 20 (60.6) | 25 (75.8) | 18 (54.5) |
| N+ | 24 | 15 (62.5) | 23 (95.8) | 14 (58.3) |
| | |
p=0.04a | |
| Tumor grade |
| G1 | 8 | 4 (50.0) | 4 (50.0) | 5 (62.5) |
| G2 | 36 | 24 (66.7) | 32 (88.9) | 19 (52.8) |
| G3 | 13 | 7 (53.8) | 12 (92.3) | 8 (61.5) |
| | |
p=0.016a | |
| Clinical stage |
| Early (I+II) | 26 | 17 (65.4) | 19 (73.1) | 15 (57.7) |
| Late (II+IV) | 31 | 18 (58.1) | 29 (93.5) | 17 (54.8) |
| | |
p=0.035a | |
Gene expression analysis by miRNA
microarrays
Expression patterns of 1,205 miRNAs were determined
by miRNA microarray in the test and the control group. In the
hierarchical cluster analysis, clusters of upregulated and
downregulated miRNAs in the blood of OSCC patients vs. healthy
volunteers were recognized which clearly separated the two groups
(data not shown). By determination of fold changes and statistical
evaluation by t-tests and empirical Bayes approaches (Limma)
followed by Benjamini-Hochberg adjustment, the 30 most prominently
deregulated miRNAs were identified. Out of these, three candidates
were chosen for further analyses. As shown in Table IV, miR-186 was downregulated
~2-fold in the test group, whereas the level of miR-494 was
4.7-fold and miR-3651 was 2.5-fold higher in the blood of OSCC
patients. The Limma p-values revealed that these changes were
statistically significant. The usefulness of the miRNAs with
respect to their ability to separate the two different groups of
blood donors was also demonstrated by the AUC values lying ~0.8 and
under 0.2 (miR-186), respectively.
| Table IVAberrant expression of the examined
miRNAs as determined by miRNA microarray analysis. |
Table IV
Aberrant expression of the examined
miRNAs as determined by miRNA microarray analysis.
| miRNA | Median C | Median T | FC | Limma raw p | Limma adjusted
p | AUC | Regulation |
|---|
| hsa-miR-186 | 8.98 | 8.17 | 0.45 | 0.000150 | 0.012 | 0.18 | Down |
| hsa-miR-3651 | 4.60 | 5.53 | 2.53 | 0.000262 | 0.02 | 0.80 | Up |
| hsa-miR-494 | 4.99 | 6.53 | 4.66 | 0.000379 | 0.02 | 0.82 | Up |
RT-qPCR screening for miRNA expression
differences
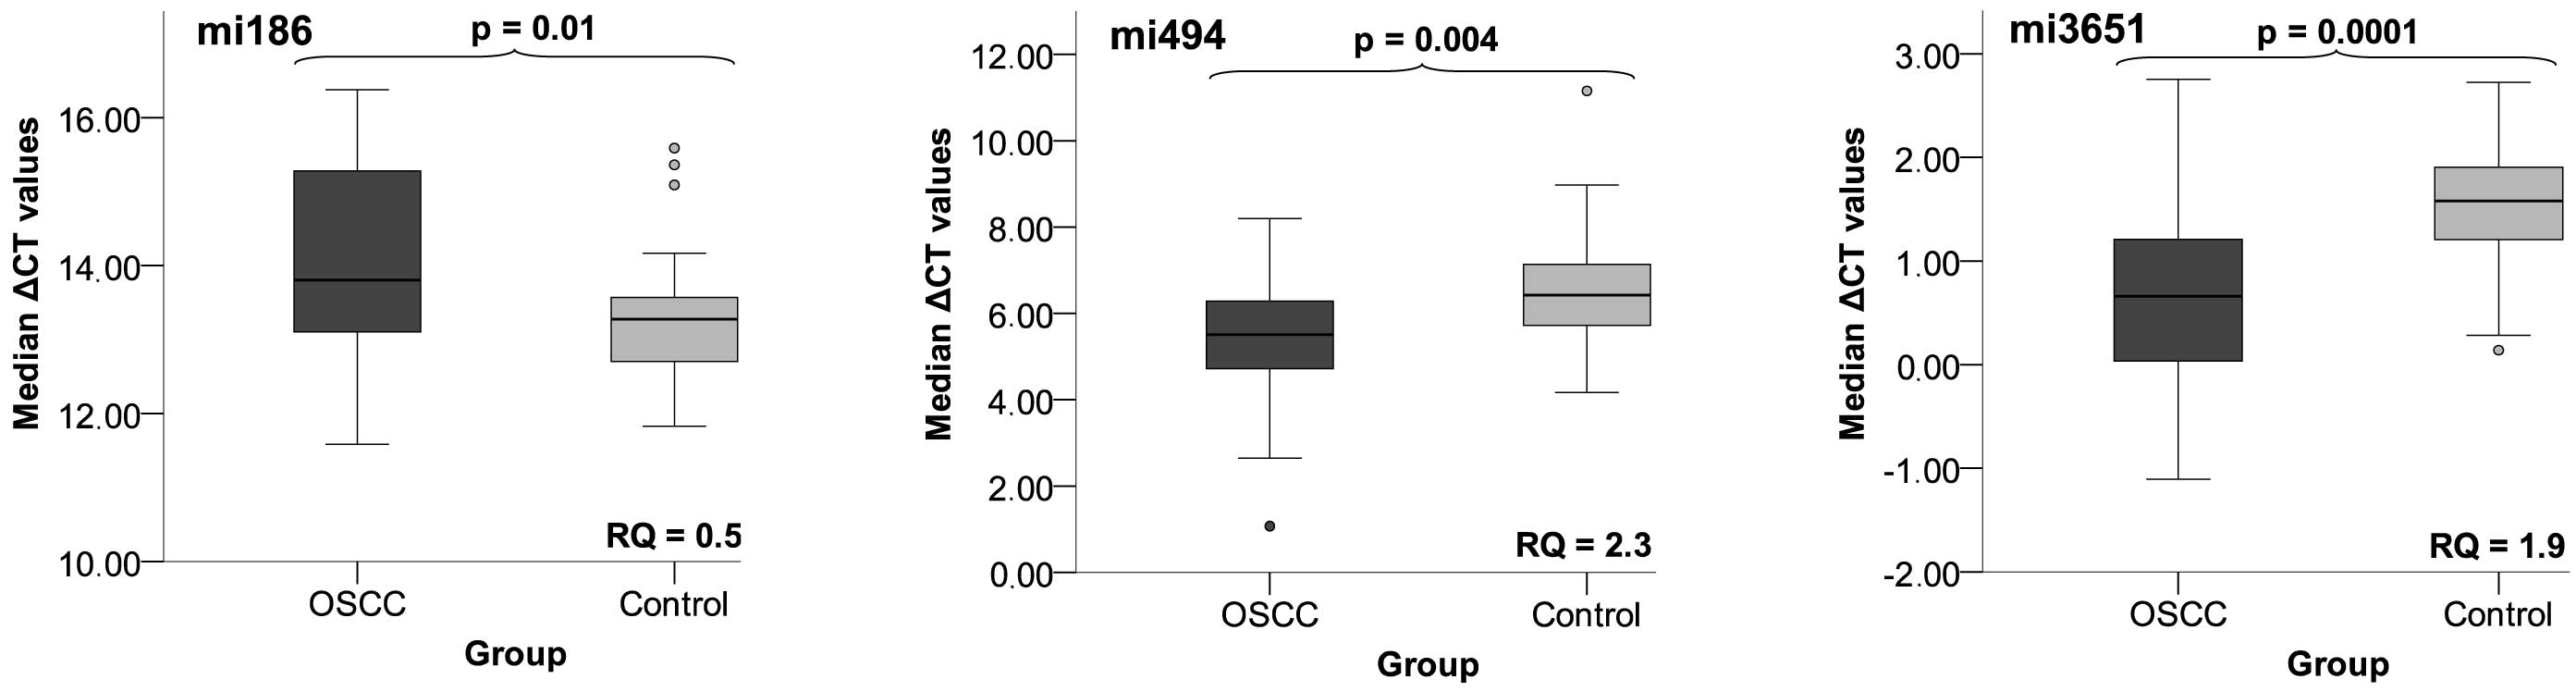
Data were derived from RT-qPCR and are presented as
ΔCT values. The results are graphically plotted as Box-Whisker
plots which represent the median (ME), the interquartile range
(IQR), standard deviation (SD) and range as well as the minimum and
maximum ΔCT values (Fig. 1). Using
Mann-Whitney U test, a significantly differential expression was
determined between the test group and the control group for
miR-186, miR-3651 and miR-494 with higher ΔCT values standing for
lower miRNA expression. miR-186 was significantly reduced in the
patient group. It was downregulated 2-fold and the p-value for
differential expression was 0.01. The expression of the two other
miRNAs was significantly increased. The fold-change for miR-3651
was 2-fold whereas this value amounted to 2.3 for miR-494. The
p-values were 0.0001 and 0.004, respectively (Fig. 1, Table
V).
| Table VStatistical results of the comparison
between the patient vs. the control group for the investigated
miRNAs based on their ΔCT values. |
Table V
Statistical results of the comparison
between the patient vs. the control group for the investigated
miRNAs based on their ΔCT values.
| miRNA | FC | AUC | Y-index | COP (ΔCT) | P-valuea |
|---|
| hsa-miR-186-5p | −2.1 | 0.69 | 0.368 | 13.64 | 0.01 |
| hsa-miR-3651 | 1.95 | 0.824 | 0.528 | 1.479 | 0.0001 |
| hsa-miR-494-5p | 2.3 | 0.715 | 0.388 | 5.608 | 0.004 |
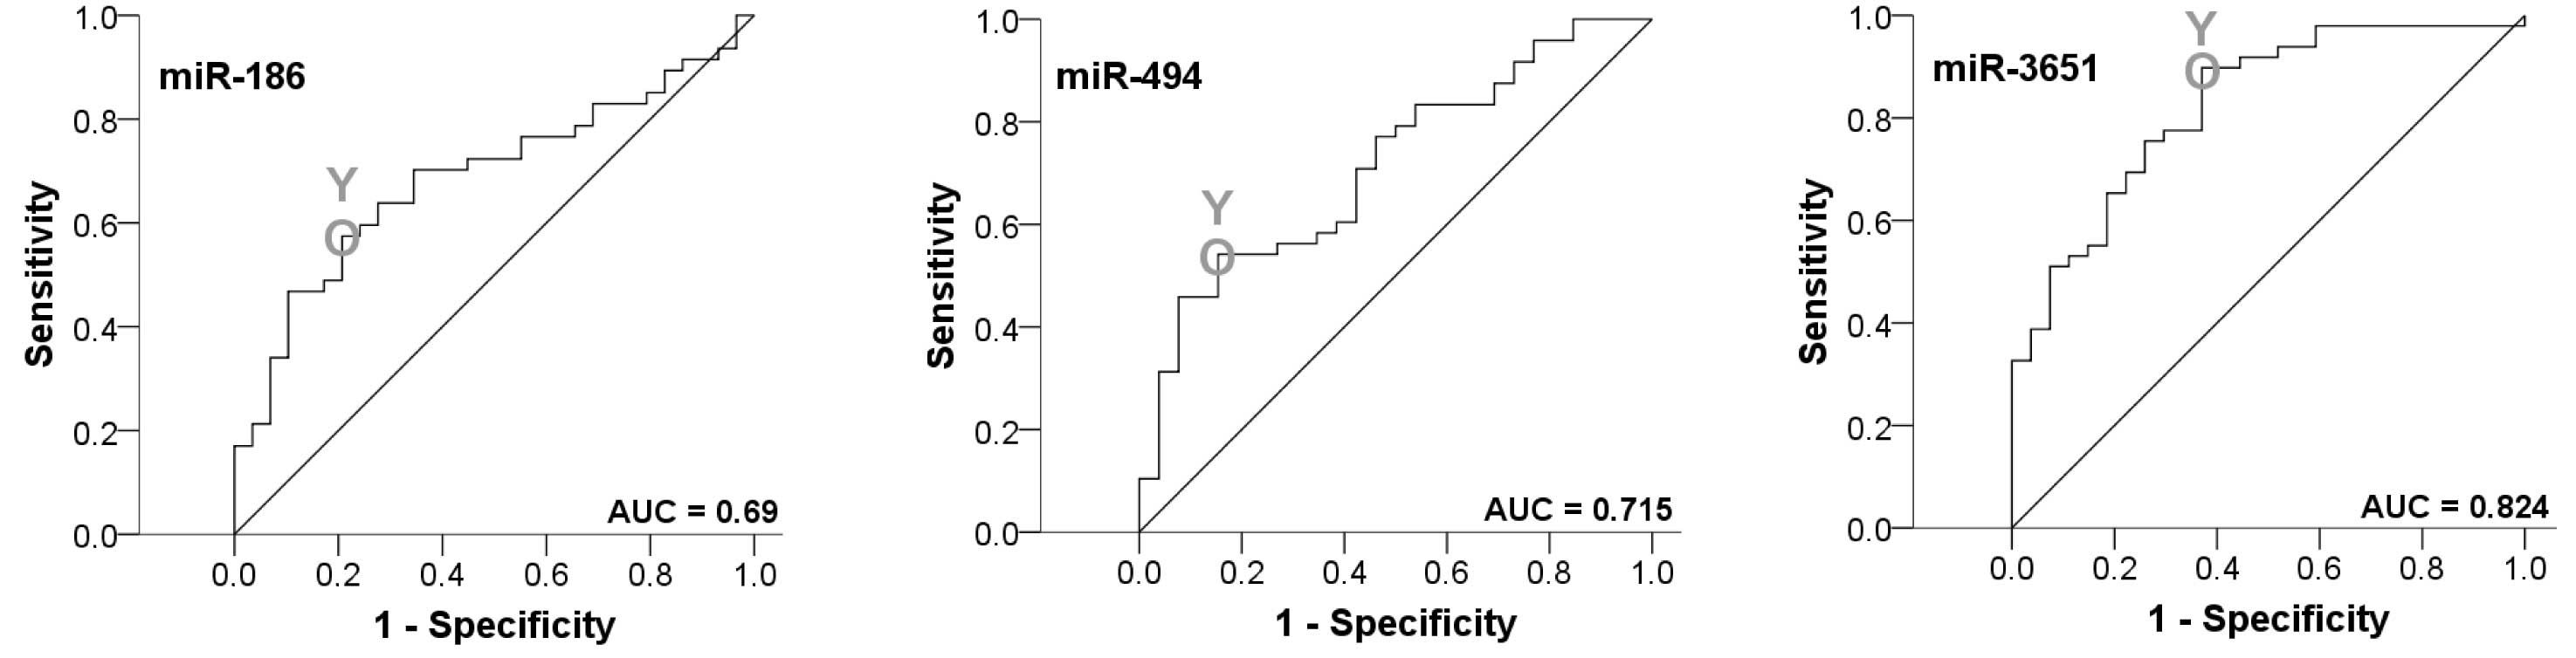
In order to confirm the statistical relevance of the
markers, a ROC curve was established and AUC was determined. All
markers yielded a significant AUC value. The upregulated miRNAs
yielded an AUC of 0.82 and 0.72, respectively. The AUC value of the
downregulated miR-186 was 0.69. Thus, this analysis confirmed that
all three miRNAs were of significant diagnostic value for
discrimination between healthy volunteers and OSCC patients
(Fig. 2, Table V).
The highest Youden indices were 0.388 for miR-494,
0.528 for miR-3651 and 0.368 for miR-186 (Fig. 2, Table
V). The optimal threshold values (COPs) expressed in ΔCT
standards for distinguishing the patients from the healthy control
were 5.61 for miR-494, 1.48 for miR-3651 and 13.64 for miR-186. For
the miRNAs miR-494 and miR-3651, a ΔCT under the COP (upregulated)
was considered to be positive for malignancy corresponding to an
increased level of the marker in whole blood. For miR-186, a ΔCT
value over the COP was positive for the OSCC test group
(downregulated). Using the determined COPs, the two groups were
divided into positive and negative lesions in order to confirm
whether the parameters allowed the detection of malignancy in a
certain sample.
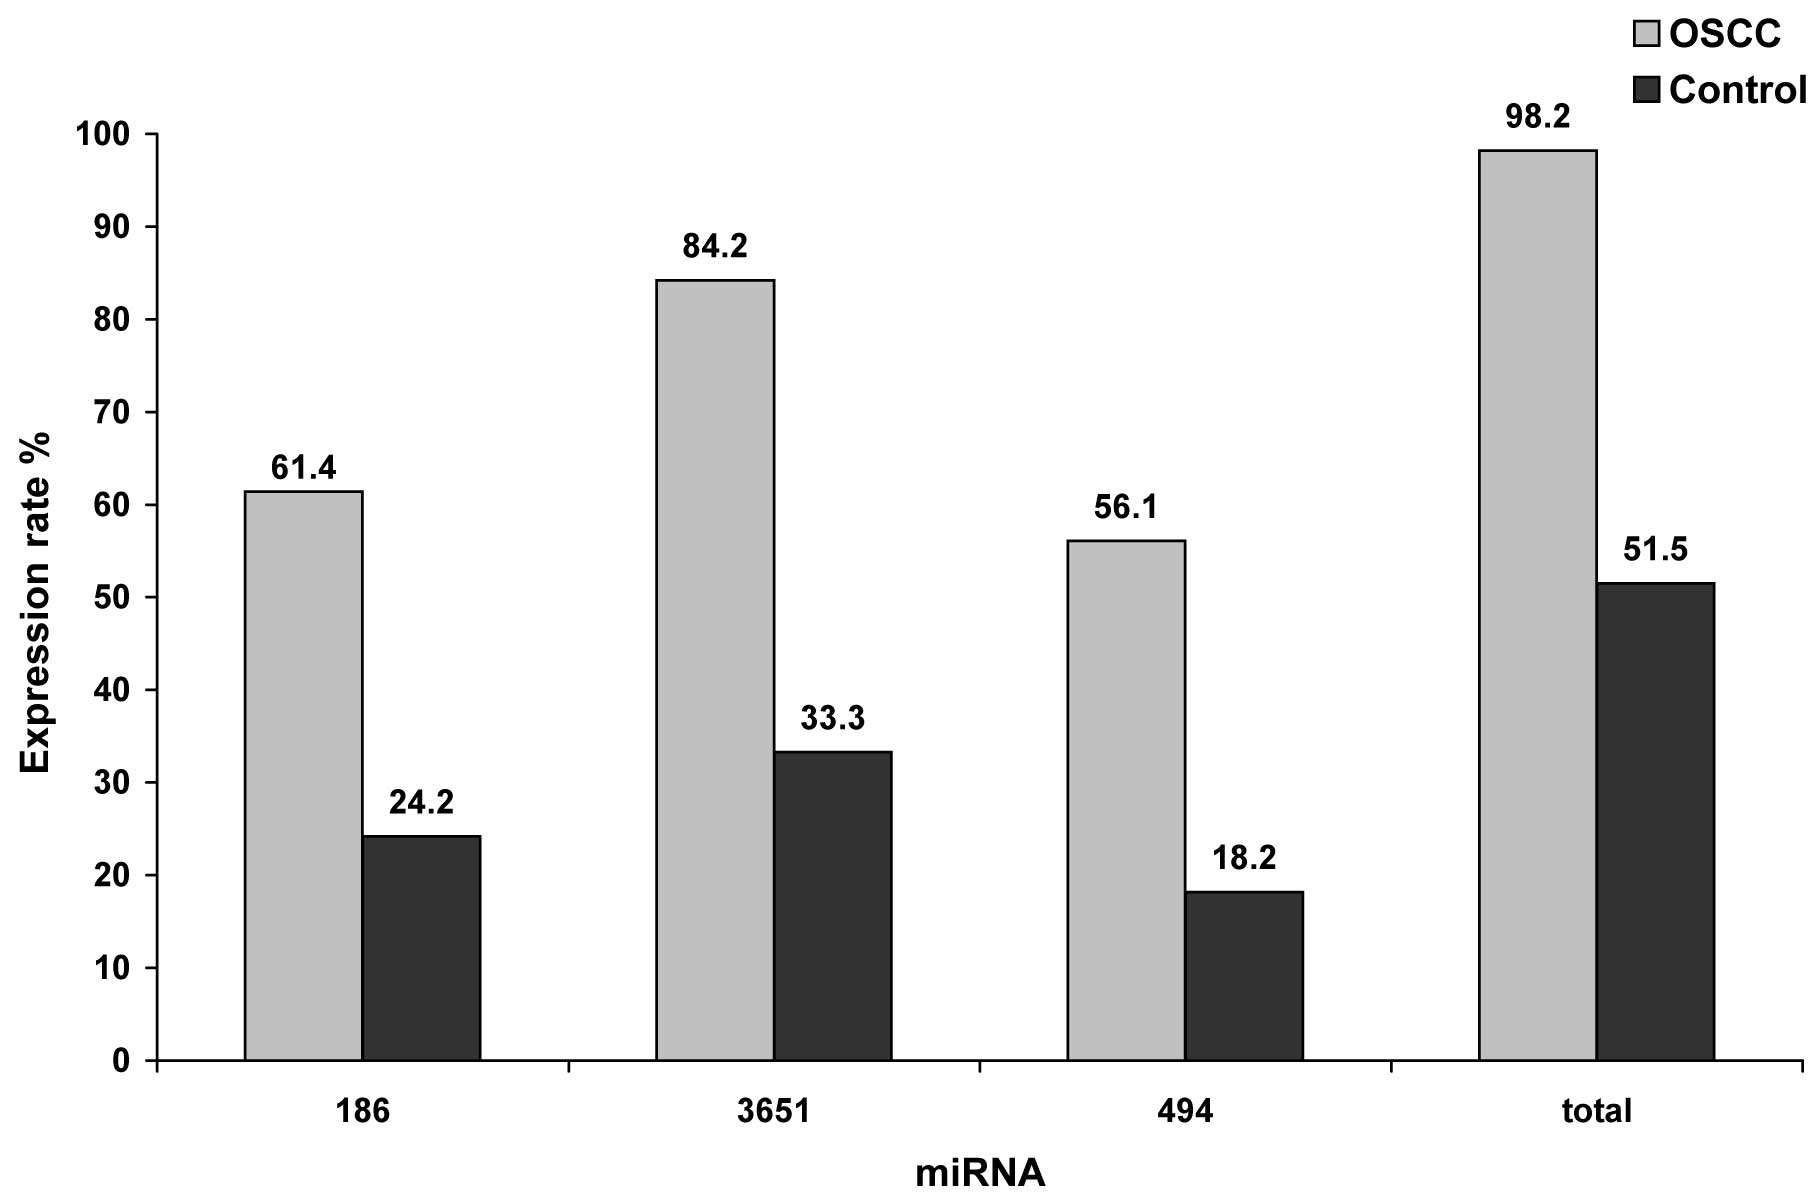
The statistical evaluation by the Chi-square test
revealed that the changes in the expression rates of the miRNAs
were statistically relevantly associated with malignancy. The
results are illustrated in Fig. 3
and summarized in Table VI. Of the
OSCC patients, 61.4% (35/57) exhibited decreased levels of miR-186;
84.2% (48/57) and 56.1% (32/57) showed increased values of miR-3651
and miR-494, respectively. In contrast, only 24.2% of the whole
blood samples from the control group showed decreased levels of
miR-186. Positive levels for miR-3651 and miR-494 were found in the
blood of healthy persons in 33.3% and 18.2% of the samples,
respectively. The correlation between malignancy and the detection
of altered expression rates were significant for all investigated
miRNAs (p<0.01). Thus, aberrant expression of all miRNAs was
statistically relevantly associated with malignancy and may
indicate the existence of OSCC. Moreover 98.2% of the blood samples
of patients suffering from OSCC exhibited altered expression of at
least one of the examined miRNAs whereas only in 51.5% of the
healthy volunteers such an altered abundance was evident. The
association to malignancy was statistically relevant (p=0.0001,
Table VI).
| Table VIAssociation between apparent
expression rates of the particular miRNAs and malignancy. |
Table VI
Association between apparent
expression rates of the particular miRNAs and malignancy.
| Test group
(n=57) | Control group
(n=33) | P-valuea |
|---|
|
|---|
| Sanger ID of
miRNA | Positive cases, n
(%) | Positive cases, n
(%) | |
|---|
| hsa-miR-186-5p | 35 (61.4) | 8 (24.2) | 0.001 |
| hsa-miR-3651 | 48 (84.2) | 11 (33.3) | 0.0001 |
| hsa-miR-494-5p | 32 (56.1) | 6 (18.2) | 0.001 |
| At least one | 56 (98.2) | 17 (51.5) | 0.0001 |
Statistical analysis of the comparison between
altered miRNA values in whole blood of OSCC patients and clinical
and histopathological parameters revealed that there was no
statistically relevant association between the altered expression
of any miRNA to tumor size. In addition, subdivision of the tumors
into T1/T2 and T3/T4 categories of size yielded no statistically
significant association between this parameter and altered
expression (p>0.05). Moreover, no significance was shown between
the changes in expression rate of miR-186 and miR-494 and lymph
node status, tumor grade and clinical stage. Only evaluated levels
of miR-3651 were weakly statistically related to tumor grade
(p=0.043), lymph node status (p=0.035) and clinical stage
(p=0.016). The results of statistical assessment are summarized in
Table III.
Discussion
miRNAs influence a number of cellular pathways and
are responsible for malignant transformation and tumor progression
of different cancer entities. A number of these pathways may also
be important for the development and progression of oral squamous
cell carcinoma (OSCC) (2,8,11,29).
Since the discovery of stable miRNAs in whole blood, serum and
plasma and their aberrant expression in tumor patients vs. healthy
individuals, circulating miRNAs have been shown to be valuable
biomarkers for diagnostic investigation and even for cancer
management and direct monitoring of disease using a minimally
invasive method (5,12,13,16,21).
The present study aimed to evaluate the difference in miRNA
expression in whole blood samples of OSCC patients compared to
healthy volunteers who served as controls.
We demonstrated that the expression patterns of
miR-186, miR-3651 and miR-494 were significantly altered in the
whole blood of patients suffering from OSCC when compared to these
patterns in healthy volunteers. Upregulation of miR-3651 and
miR-494 and the downregulation of miR-186 were significantly
correlated with the absence and presence of OSCC. It appears that
these three miRNAs are relevant biomarkers for discrimination of
OSCC patients from healthy individuals and may be useful for the
establishment of a minimally invasive blood-based diagnostic
method.
The relevance of miRNAs for the evaluation of
prognosis of OSCC seems to be less pronounced. The changes in the
expression of miR-494 and miR-186 were statistically independent of
the clinical stage of disease and TNM classification. Therefore,
detection of these miRNAs in whole blood may only be an additional
method for the identification of OSCC lesions. However, it is
postulated that miR-186 and miR-494 are conserved across species
and they have been reported to be disease-associated. Thus, miR-186
appears to be involved in inhibition of invasion when overexpressed
in cancer lesions and has been shown to be an anti-invasion target
for therapeutic development for non-small cell lung cancer
(30). Furthermore, downregulation
of miR-186 in esophageal cancer and lung adenocarcinoma was
associated with poor prognosis independent of TNM stage by
interference of the miRNA with cell cycle regulation (31,32).
Moreover, miR-186 may induce cellular senescence and regulate the
cell cycle and apoptotic response (33,34).
Hence, on the basis of the identified functions, one may conclude
that the altered expression of miR-186 may play a critical role in
oral carcinogenesis and progression. However, all of the reported
results are based on expression analyses in tissue samples, and the
expression patterns of miRNA may not be reflected in blood
(17,18,23,24).
miR-494 has also been reported to be a tumor suppressor by inducing
cell cycle arrest, cell senescence and apoptosis, and by
suppressing cell proliferation. Moreover, miR-494 is downregulated
in different types of cancer tissues (35–37).
However, we found that this miRNA was increased in the blood of
patients. This seems to be contradictory. However, the result may
be due to selective exosome-mediated release of the miRNA into the
extracellular environment. The exclusion of this miRNA from the
cellular matrix leads to loss of its tumor-suppressive function and
consequently to cancer cell phenotypes (19). On the other hand, increased levels
of the human-specific miR-3651 showed a weak correlation with lymph
node metastasis and clinical stage and strong association with more
dedifferentiated tumors. Thus, this miRNA may be useful in
prognostic applications. Yet, further studies including a larger
number of patients and controls are urgently needed to confirm this
hypothesis. Additionally, its overexpression may be involved in
dedifferentiation and development of metastases. However, its
function and its involvement in cancer development and progression
have not been investigated to date. Thus the impact of this
molecule in OSCC must be elucidated in the future.
Previously, a number of differentially expressed
miRNAs in the blood of patients suffering from head and neck
carcinomas including OSCC have been identified as potential blood
biomarkers (19). Circulating
miRNAs, miR-184, miR-31 and miR-24, have been intensely studied,
and their power in the clinical monitoring of disease is suggested
(17,18,20).
Unfortunately, we did not find any deregulation of these miRNAs in
our study. This may be due to several reasons. Firstly, in the
previous studies, only a small number of patients were included.
Secondly, only a small collection of circulating miRNAs which were
preselected by their deregulation in cancer tissues was evaluated.
However, miRNAs showing disease-associated expression changes in
blood are not necessarily the same ones that are differentially
expressed in cancer tissues. Consequently, aberrant expression may
not be correlated (24).
Additionally the differential miRNA expression was evaluated either
in plasma or serum of OSCC patients and not in whole blood.
However, differential miRNA expression was recently reported in
patient-matched serum and plasma samples. Furthermore, significant
differences between cell-free and cellular blood miRNA profiles
were shown (15,38). At present, isolation of miRNAs and
miRNA-profiling based on whole blood appear to be the most reliable
(25). Using this method, the major
advantage appears to be the higher miRNA content and the increased
chance for detection of the disease since not only tumor-secreted
oncogenic miRNAs are measured, but also changes in the miRNA
profile as a consequence of ‘host-reaction’ based upon the reaction
of the immune system in response to cancer are determined (14,25,39).
Therefore, the whole blood approach offers the potential to
diagnose cancer at a very early stage when the concentration of
tumor-secreted miRNAs is still low. Nevertheless, reports using
serum or plasma for RT-qPCR-based miRNA profiling are also
promising for OSCC. Thus, evaluated postsurgical concentrations of
different miRNAs in plasma samples of OSCC patients have been
associated with recurrence and can predict worse clinical outcome
(17,18,20,22).
Recently, one study showed that the markers may also be applied to
risk assessment of precancerous lesions (19). Additionally, recent studies using
various tumors may encourage further research on evaluation of
blood miRNAs as biomarkers for OSCC management (40–42).
Consequently, although the research of circulating miRNAs as
blood-based biomarkers for OSCC is still in the beginning, this
approach may allow the establishment of a minimally invasive,
sensitive and specific method for OSCC detection, screening and
monitoring. However, due to the relatively small number of samples
used in this study, further validation using a larger cohort is
needed to fully assess the utility of particular miRNAs as oral
cancer biomarkers. Additionally, in the future their impact in
clinical monitoring and prognosis must be evaluated by follow-up
studies as described for other malignancies.
Although miRNA-based therapeutics have not yet
reached clinical trials for cancer, due to their function as
oncogenes and tumor-suppressor genes and their involvement in many
cellular processes, miRNAs may be a valuable novel emerging class
of targets for disease gene therapy as novel therapeutic targets.
Furthermore, promising results in animal models of related diseases
have shown their usefulness as potential therapeutic drugs for
personalized treatment strategies (43–45).
In conclusion, the aberrant expression of miR-186,
miR-494 and miR-3651 in the whole blood of OSCC patients identified
in the present study may serve as the basis for establishing these
miRNAs as minimally invasive biomarkers for the detection and
monitoring of OSCC.
Acknowledgements
The authors would like to thank Mrs. A.
Krautheim-Zenk, Mrs. S. Schönherr and Mrs. E. Diebel for their
valuable technical support.
References
|
1
|
Bartel DP: MicroRNAs: genomics,
biogenesis, mechanism, and function. Cell. 116:281–297. 2004.
View Article : Google Scholar : PubMed/NCBI
|
|
2
|
Gomes CC, de Sousa SF and Gomez RS:
microRNAs: small molecules with a potential role in oral squamous
cell carcinoma. Curr Pharm Des. 19:1285–1291. 2013.PubMed/NCBI
|
|
3
|
Gomes CC and Gomez RS: MicroRNA and oral
cancer: future perspectives. Oral Oncol. 44:910–914. 2008.
View Article : Google Scholar : PubMed/NCBI
|
|
4
|
Calin GA and Croce CM: MicroRNA signatures
in human cancers. Nat Rev Cancer. 6:857–866. 2006. View Article : Google Scholar : PubMed/NCBI
|
|
5
|
Lu J, Getz G, Miska EA, et al: MicroRNA
expression profiles classify human cancers. Nature. 435:834–838.
2005. View Article : Google Scholar : PubMed/NCBI
|
|
6
|
Wu BH, Xiong XP, Jia J and Zhang WF:
MicroRNAs: new actors in the oral cancer scene. Oral Oncol.
47:314–319. 2011. View Article : Google Scholar : PubMed/NCBI
|
|
7
|
Lajer CB, Nielsen FC, Friis-Hansen L, et
al: Different miRNA signatures of oral and pharyngeal squamous cell
carcinomas: a prospective translational study. Br J Cancer.
104:830–840. 2011. View Article : Google Scholar : PubMed/NCBI
|
|
8
|
Scapoli L, Palmieri A, Lo Muzio L, et al:
MicroRNA expression profiling of oral carcinoma identifies new
markers of tumor progression. Int J Immunopathol Pharmacol.
23:1229–1234. 2010.PubMed/NCBI
|
|
9
|
Chang SS, Jiang WW, Smith I, et al:
MicroRNA alterations in head and neck squamous cell carcinoma. Int
J Cancer. 123:2791–2797. 2008. View Article : Google Scholar : PubMed/NCBI
|
|
10
|
Zhang B, Pan X, Cobb GP and Anderson TA:
microRNAs as oncogenes and tumor suppressors. Dev Biol. 302:1–12.
2007. View Article : Google Scholar : PubMed/NCBI
|
|
11
|
Soga D, Yoshiba S, Shiogama S, et al:
microRNA expression profiles in oral squamous cell carcinoma. Oncol
Rep. 30:579–583. 2013.PubMed/NCBI
|
|
12
|
Mitchell PS, Parkin RK, Kroh EM, et al:
Circulating microRNAs as stable blood-based markers for cancer
detection. Proc Natl Acad Sci USA. 105:10513–10518. 2008.
View Article : Google Scholar : PubMed/NCBI
|
|
13
|
Chen X, Ba Y, Ma L, et al:
Characterization of microRNAs in serum: a novel class of biomarkers
for diagnosis of cancer and other diseases. Cell Res. 18:997–1006.
2008. View Article : Google Scholar : PubMed/NCBI
|
|
14
|
Häusler SF, Keller A, Chandran PA, et al:
Whole blood-derived miRNA profiles as potential new tools for
ovarian cancer screening. Br J Cancer. 103:693–700. 2010.PubMed/NCBI
|
|
15
|
Heegaard NH, Schetter AJ, Welsh JA, et al:
Circulating micro-RNA expression profiles in early stage nonsmall
cell lung cancer. Int J Cancer. 130:1378–1386. 2012. View Article : Google Scholar : PubMed/NCBI
|
|
16
|
Kosaka N, Iguchi H and Ochiya T:
Circulating microRNA in body fluid: a new potential biomarker for
cancer diagnosis and prognosis. Cancer Sci. 101:2087–2092. 2010.
View Article : Google Scholar : PubMed/NCBI
|
|
17
|
Lin SC, Liu CJ, Lin JA, et al:
miR-24 up-regulation in oral carcinoma: positive association
from clinical and in vitro analysis. Oral Oncol. 46:204–208. 2010.
View Article : Google Scholar
|
|
18
|
Liu CJ, Kao SY, Tu HF, et al: Increase of
microRNA miR-31 level in plasma could be a potential marker
of oral cancer. Oral Dis. 16:360–364. 2010.
|
|
19
|
Maclellan SA, Lawson J, Baik J, et al:
Differential expression of miRNAs in the serum of patients with
high-risk oral lesions. Cancer Med. 1:268–274. 2012. View Article : Google Scholar : PubMed/NCBI
|
|
20
|
Wong TS, Liu XB, Wong BY, et al: Mature
miR-184 as potential oncogenic microRNA of squamous cell carcinoma
of tongue. Clin Cancer Res. 14:2588–2592. 2008. View Article : Google Scholar : PubMed/NCBI
|
|
21
|
Wittmann J and Jäck HM: Serum microRNAs as
powerful cancer biomarkers. Biochim Biophys Acta. 1806:200–207.
2010.PubMed/NCBI
|
|
22
|
Liu CJ, Lin SC, Yang CC, et al: Exploiting
salivary miR-31 as a clinical biomarker of oral squamous
cell carcinoma. Head Neck. 34:219–224. 2012.PubMed/NCBI
|
|
23
|
Yang CC, Hung PS, Wang PW, et al:
miR-181 as a putative biomarker for lymph-node metastasis of
oral squamous cell carcinoma. J Oral Pathol Med. 40:397–404. 2011.
View Article : Google Scholar
|
|
24
|
Kosaka N, Iguchi H, Yoshioka Y, et al:
Competitive interactions of cancer cells and normal cells via
secretory microRNAs. J Biol Chem. 287:1397–1405. 2012. View Article : Google Scholar : PubMed/NCBI
|
|
25
|
Heneghan HM, Miller N, Lowery AJ, et al:
Circulating microRNAs as novel minimally invasive biomarkers for
breast cancer. Ann Surg. 251:499–505. 2010. View Article : Google Scholar : PubMed/NCBI
|
|
26
|
Patel SG and Shah JP: TNM staging of
cancers of the head and neck: striving for uniformity among
diversity. CA Cancer J Clin. 55:242–258. 2005. View Article : Google Scholar : PubMed/NCBI
|
|
27
|
Benjamini Y, Drai D, Elmer G, et al:
Controlling the false discovery rate in behavior genetics research.
Behav Brain Res. 125:279–284. 2001. View Article : Google Scholar : PubMed/NCBI
|
|
28
|
Fluss R, Faraggi D and Reiser B:
Estimation of the Youden Index and its associated cutoff point.
Biom J. 47:458–472. 2005. View Article : Google Scholar : PubMed/NCBI
|
|
29
|
Gorenchtein M, Poh CF, Saini R and Garnis
C: MicroRNAs in an oral cancer context - from basic biology to
clinical utility. J Dent Res. 91:440–446. 2012. View Article : Google Scholar : PubMed/NCBI
|
|
30
|
Li H, Yin C, Zhang B, et al: PTTG1
promotes migration and invasion of human non-small cell lung cancer
cells and is modulated by miR-186. Carcinogenesis. 34:2145–2155.
2013. View Article : Google Scholar : PubMed/NCBI
|
|
31
|
Zhao BS, Liu SG, Wang TY, et al: Screening
of microRNA in patients with esophageal cancer at same tumor node
metastasis stage with different prognoses. Asian Pac J Cancer Prev.
14:139–143. 2013. View Article : Google Scholar : PubMed/NCBI
|
|
32
|
Cai J, Wu J, Zhang H, et al: miR-186
downregulation correlates with poor survival in lung
adenocarcinoma, where it interferes with cell-cycle regulation.
Cancer Res. 73:756–766. 2013. View Article : Google Scholar : PubMed/NCBI
|
|
33
|
Kim SY, Lee YH and Bae YS: MiR-186,
miR-216b, miR-337-3p, and miR-760 cooperatively induce cellular
senescence by targeting alpha subunit of protein kinase CKII in
human colorectal cancer cells. Biochem Biophys Res Commun.
429:173–179. 2012. View Article : Google Scholar : PubMed/NCBI
|
|
34
|
Myatt SS, Wang J, Monteiro LJ, et al:
Definition of microRNAs that repress expression of the tumor
suppressor gene FOXO1 in endometrial cancer. Cancer Res.
70:367–377. 2010. View Article : Google Scholar : PubMed/NCBI
|
|
35
|
Diakos C, Zhong S, Xiao Y, et al: TEL-AML1
regulation of survivin and apoptosis via miRNA-494 and miRNA-320a.
Blood. 116:4885–4893. 2010. View Article : Google Scholar : PubMed/NCBI
|
|
36
|
Yamanaka S, Campbell NR, An F, et al:
Coordinated effects of microRNA-494 induce G2/M arrest
in human cholangiocarcinoma. Cell Cycle. 11:2729–2738. 2012.
View Article : Google Scholar : PubMed/NCBI
|
|
37
|
Ohdaira H, Sekiguchi M, Miyata K and
Yoshida K: MicroRNA-494 suppresses cell proliferation and induces
senescence in A549 lung cancer cells. Cell Prolif. 45:32–38. 2012.
View Article : Google Scholar : PubMed/NCBI
|
|
38
|
Duttagupta R, Jiang R, Gollub J, et al:
Impact of cellular miRNAs on circulating miRNA biomarker
signatures. PLoS One. 6:e207692011. View Article : Google Scholar : PubMed/NCBI
|
|
39
|
Heneghan HM, Miller N and Kerin MJ:
Circulating microRNAs: promising breast cancer biomarkers. Breast
Cancer Res. 13:402–403. 2011. View Article : Google Scholar : PubMed/NCBI
|
|
40
|
Friedman EB, Shang S, de Miera EV, et al:
Serum microRNAs as biomarkers for recurrence in melanoma. J Transl
Med. 10:1552012. View Article : Google Scholar : PubMed/NCBI
|
|
41
|
Schwarzenbach H, Hoon DS and Pantel K:
Cell-free nucleic acids as biomarkers in cancer patients. Nat Rev
Cancer. 11:426–437. 2011. View Article : Google Scholar : PubMed/NCBI
|
|
42
|
Zen K and Zhang CY: Circulating microRNAs:
a novel class of biomarkers to diagnose and monitor human cancers.
Med Res Rev. 32:326–348. 2012. View Article : Google Scholar : PubMed/NCBI
|
|
43
|
Osaki M, Takeshita F and Ochiya T:
MicroRNAs as biomarkers and therapeutic drugs in human cancer.
Biomarkers. 13:658–670. 2008. View Article : Google Scholar : PubMed/NCBI
|
|
44
|
Tong AW and Nemunaitis J: Modulation of
miRNA activity in human cancer: a new paradigm for cancer gene
therapy? Cancer Gene Ther. 15:341–355. 2008. View Article : Google Scholar : PubMed/NCBI
|
|
45
|
Zhang B and Farwell MA: microRNAs: a new
emerging class of players for disease diagnostics and gene therapy.
J Cell Mol Med. 12:3–21. 2008. View Article : Google Scholar : PubMed/NCBI
|