Introduction
Every year, more than one million individuals
worldwide develop colorectal cancer for which the disease-specific
mortality rate is nearly 33% in the developed world (1). Recent clinical trials of adjuvant
chemotherapy following surgical resection have shown significant
survival benefits in patients with locally advanced colon cancer
(2). In addition to the variety of
clinical and pathological risk factors, various prognostic genetic
and molecular biomarkers have been investigated to assess
individual therapeutic intervention (3,4).
Although several prognostic molecular markers have
been reported, the results have been contradictory or inconclusive
(5,6). Recent microarray analyses provided
simultaneous whole-genome screening, and recent studies identified
a set of specific gene expression profiles that could predict the
risk of recurrence using tests such as the Oncotype DX Colon Cancer
Assay (7) and ColoPrint (8). Notably, compared with these prognostic
gene-profiling series, the gene sets differ considerably, with
little overlap. The lack of concordant genes could be related to
several issues, including different microarray platforms and the
type of samples selected for analyses. RNA instability is well
known, and gene expression in tissue biosamples can be changed by
various factors, including surgical manipulation with vessel
occlusion, warm ex vivo ischemia between surgical
extirpation and sample freezing, the preservation method used, and
the length of storage time (9,10).
However, how the expression profiles of genes change in surgically
resected specimens remains unclear. Some stress-responsive genes,
such as FBJ murine osteosarcoma viral oncogene homolog (FOS) and
jun B proto-oncogene (JUNB), may actively increase their expression
levels in hypoxic circumstances, whereas others, including keratine
20 (KRT20) and cyclin A, may decrease their expression levels in
such environments (11,12). These can be critical confounding
factors for quantitative comparisons among studies. These
observations led us to hypothesize that genes profiled in resected
specimens are altered in a time-dependent manner. In the present
study, we investigated time-dependent changes in gene profiling as
well as in RNA quality in surgically resected colorectal tumor
tissues that were obtained using standard surgical procedures.
Materials and methods
Patients, sample collection and RNA
isolation
Tumor and normal tissues from 18 patients with
locally advanced colorectal cancer who underwent curative surgery
at the Department of Surgery, Nippon Medical School Hospital, from
June 2011 to May 2013 were analyzed. The patients all provided
written informed consent. The study protocol was approved by the
Gene Institutional Review Board of Nippon Medical School.
Normal and tumor samples were extracted directly
from each resected tissue punctually at 0, 30, 60 and 120 min after
their removal in the operating room, following routine tissue
handling protocols of our department. Inclusion criteria were stage
II/III (13) colorectal cancer
patients with tumors >3 cm in diameter. Using a surgical
procedure with a no-touch isolation technique (14) and preserving the blood supply from
the marginal artery just before resection may have minimized the
in vivo ischemic effect. The time of completion of the
colorectal resection was set to 0 min. Tumor tissue samples were
obtained from non-ulcerated but elevated lesions, and normal tissue
samples were obtained from normal mucosa >10 cm away from the
tumor margin. Each sample, ~5 mm3 in size, was placed
immediately into 5 ml of RNAlater RNA Stabilization reagent
(Ambion, Inc., Austin, TX, USA). After stabilization overnight at
4°C, all samples were stored at −20°C until RNA extraction.
Following homogenization using Precellys 24 (Bertin
Technologies, Saint-Quentin-en-Yvelines Cedex, France) in
microcentrifuge tubes, total RNA was extracted using RNeasy kits
(Qiagen, Valencia, CA, USA) according to the manufacturer’s
instructions. Total RNA concentrations (ng/μl) determined at
absorbances 260 nm (A260) and 280 nm (A280) using a NanoDrop
ND-2000 spectrophotometer (Thermo Fisher Scientific, Wilmington,
DE, USA) were used to calculate total RNA yield (μg).
RNA integrity evaluation
RNA integrity was analyzed using an Agilent 2100
Bioanalyzer RNA 6000 NanoLabChip (Agilent Technologies, Palo Alto,
CA, USA) to produce an electrophoresis trace, from which the RNA
integrity number (RIN) (15) was
calculated using 2100 Expert Software (Agilent Technologies). RIN
is the new standard in RNA integrity assessment and the best
predictor of microarray quality (16). Total RNA degradation was calculated
automatically from the RIN score based on decreases in 28S and 18S
ribosomal RNA peak areas (peaks correspond to degradation
fragments). RIN values range from 10 for intact RNA to 1 for
totally degraded RNA (15).
Microarray hybridization, image
acquisition and data analyses
Total RNA (200 ng) was converted into labeled
complementary RNA (cRNA) with nucleotides coupled to cyanine 3-CTP
(Cy3) using the Agilent Low Input Quick Amp (one-color) labeling
kit (Agilent Technologies). Then, 1.65 μg of Cy3-labeled cRNA was
hybridized to an Agilent Human GE 4x44K v2 Microarray kit for 17 h
at 65°C with SurePrint technology. The Human Microarray carries
34,127 probes to more than 21,756 human Entrez genes. Each array
was scanned using the Agilent G2565CA Microarray Scanner.
Microarray data sets were normalized by GeneSpring GX software
(version 11.5; Agilent Technologies) using the Agilent FE one-color
scenario. Spots that did not pass quality control procedures were
flagged as ‘Not Detected’ and ‘Compromised’. Data were normalized
using the quantile method.
The MIAME-compliant microarray data are available at
http://www.ncbi.nlm.nih.gov.geo/ under
accession number GEO: GSE50746.
Quantitative RT-PCR
TaqMan Gene Expression assays (Applied Biosystems,
Foster City, CA, USA) were used to validate the microarray results
and gene expression levels. We selected the following four genes
for validation: interleukin 8 (IL8, Hs01553824_g1), granzyme B
(also known as granzyme 2 or cytotoxic T-lymphocyte-associated
esterase 1; GZMB, Hs00188051_m1), carbonic anhydrase II (CA2,
Hs00163869_m1), and regenerating islet-derived 3 α (REG3A,
Hs010555563_gH). IL8, GZMB and CA2 were reported as prognostic
molecular biomarkers in colorectal cancer (3,5,6,17)
and the expression level of REG3A decreased by >2-fold at 120
min (compared with its expression at 0 min) in microarray-examined
cases. First-strand complementary DNA (cDNA) was synthesized from 4
μg of total RNA using a SuperScript II First-Strand Synthesis
System (Invitrogen, Carlsbad, CA, USA) according to the
manufacturer’s instructions. Quantitative reverse transcription PCR
(qRT-PCR) was performed using 15 ng of cDNA and the TaqMan
Universal PCR Master Mix (Applied Biosystems) with gene-specific
primers on an Applied Biosystems Prism 7500 Fast sequence detector
(Applied Biosystems). All assays were performed in triplicate, and
the results were normalized against glyceraldehyde-3-phosphate
dehydrogenase (GAPDH) (Hs99999905_m1). The standard curve-based
method was used to calculate relative expressions.
Statistical analyses
The RIN score results in the present study were
analyzed using SPSS Statistics Base 20 (IBM, Chicago, IL, USA),
with data presented as mean ± SD. Paired t-tests were used to
compare values of two related groups. Differences were considered
statistically significant if P<0.05.
Results
Clinical and pathological characteristics
of the study population
The clinical and pathological characteristics of the
18 patients are shown in Table I.
The mean age of the patients was 72.4 years (range, 53–85 years),
and the male to female ratio was 10:8. The mean diameter size of
the tumors was 47.8 mm. Pathologically, half of the tumors were
well-differentiated adenocarcinoma, and half were moderately
differentiated adenocarcinoma. Ten patients had stage II disease
and eight patients had stage III disease. None of the patients had
distant metastases.
 | Table IClinical and pathological
characteristics of the 18 patients with colorectal cancer. |
Table I
Clinical and pathological
characteristics of the 18 patients with colorectal cancer.
| Characteristics | N |
|---|
| Gender |
| Male | 10 |
| Female | 8 |
| Age (years) |
| Mean (range) | 72.4 (53–85) |
| Tumor location |
| Right side | 2 |
| Left side | 13 |
| Rectum | 3 |
| Histologic type |
| Well
differentiated | 9 |
| Moderately
differentiated | 9 |
| Others | 0 |
| Tumor size (mm) |
| Mean (±SD) | 47.8 (±15.0) |
| T status |
| T1/T4 | 2 |
| T2 | 13 |
| T3 | 3 |
| N status |
| N0 | 10 |
| N1/2 | 8 |
| M status |
| M0 | 18 |
| M1 | 0 |
| Stage |
| I | 0 |
| II | 10 |
| III | 8 |
| IV | 0 |
| Surgical
procedure |
| Open | 7 |
| Laparoscopic | 11 |
| Blood loss
(ml) |
| Mean (±SD) | 340.0 (±315.4) |
| Operative time
(min) |
| Mean (±SD) | 278.8 (±111.5) |
RNA integrity is preserved for 120 min in
resected colorectal specimens
The most common problem for quantitative analyses
using surgically resected tissues is RNA degradation. Therefore, we
sought to evaluate RNA degradation in all 18 cases using RIN
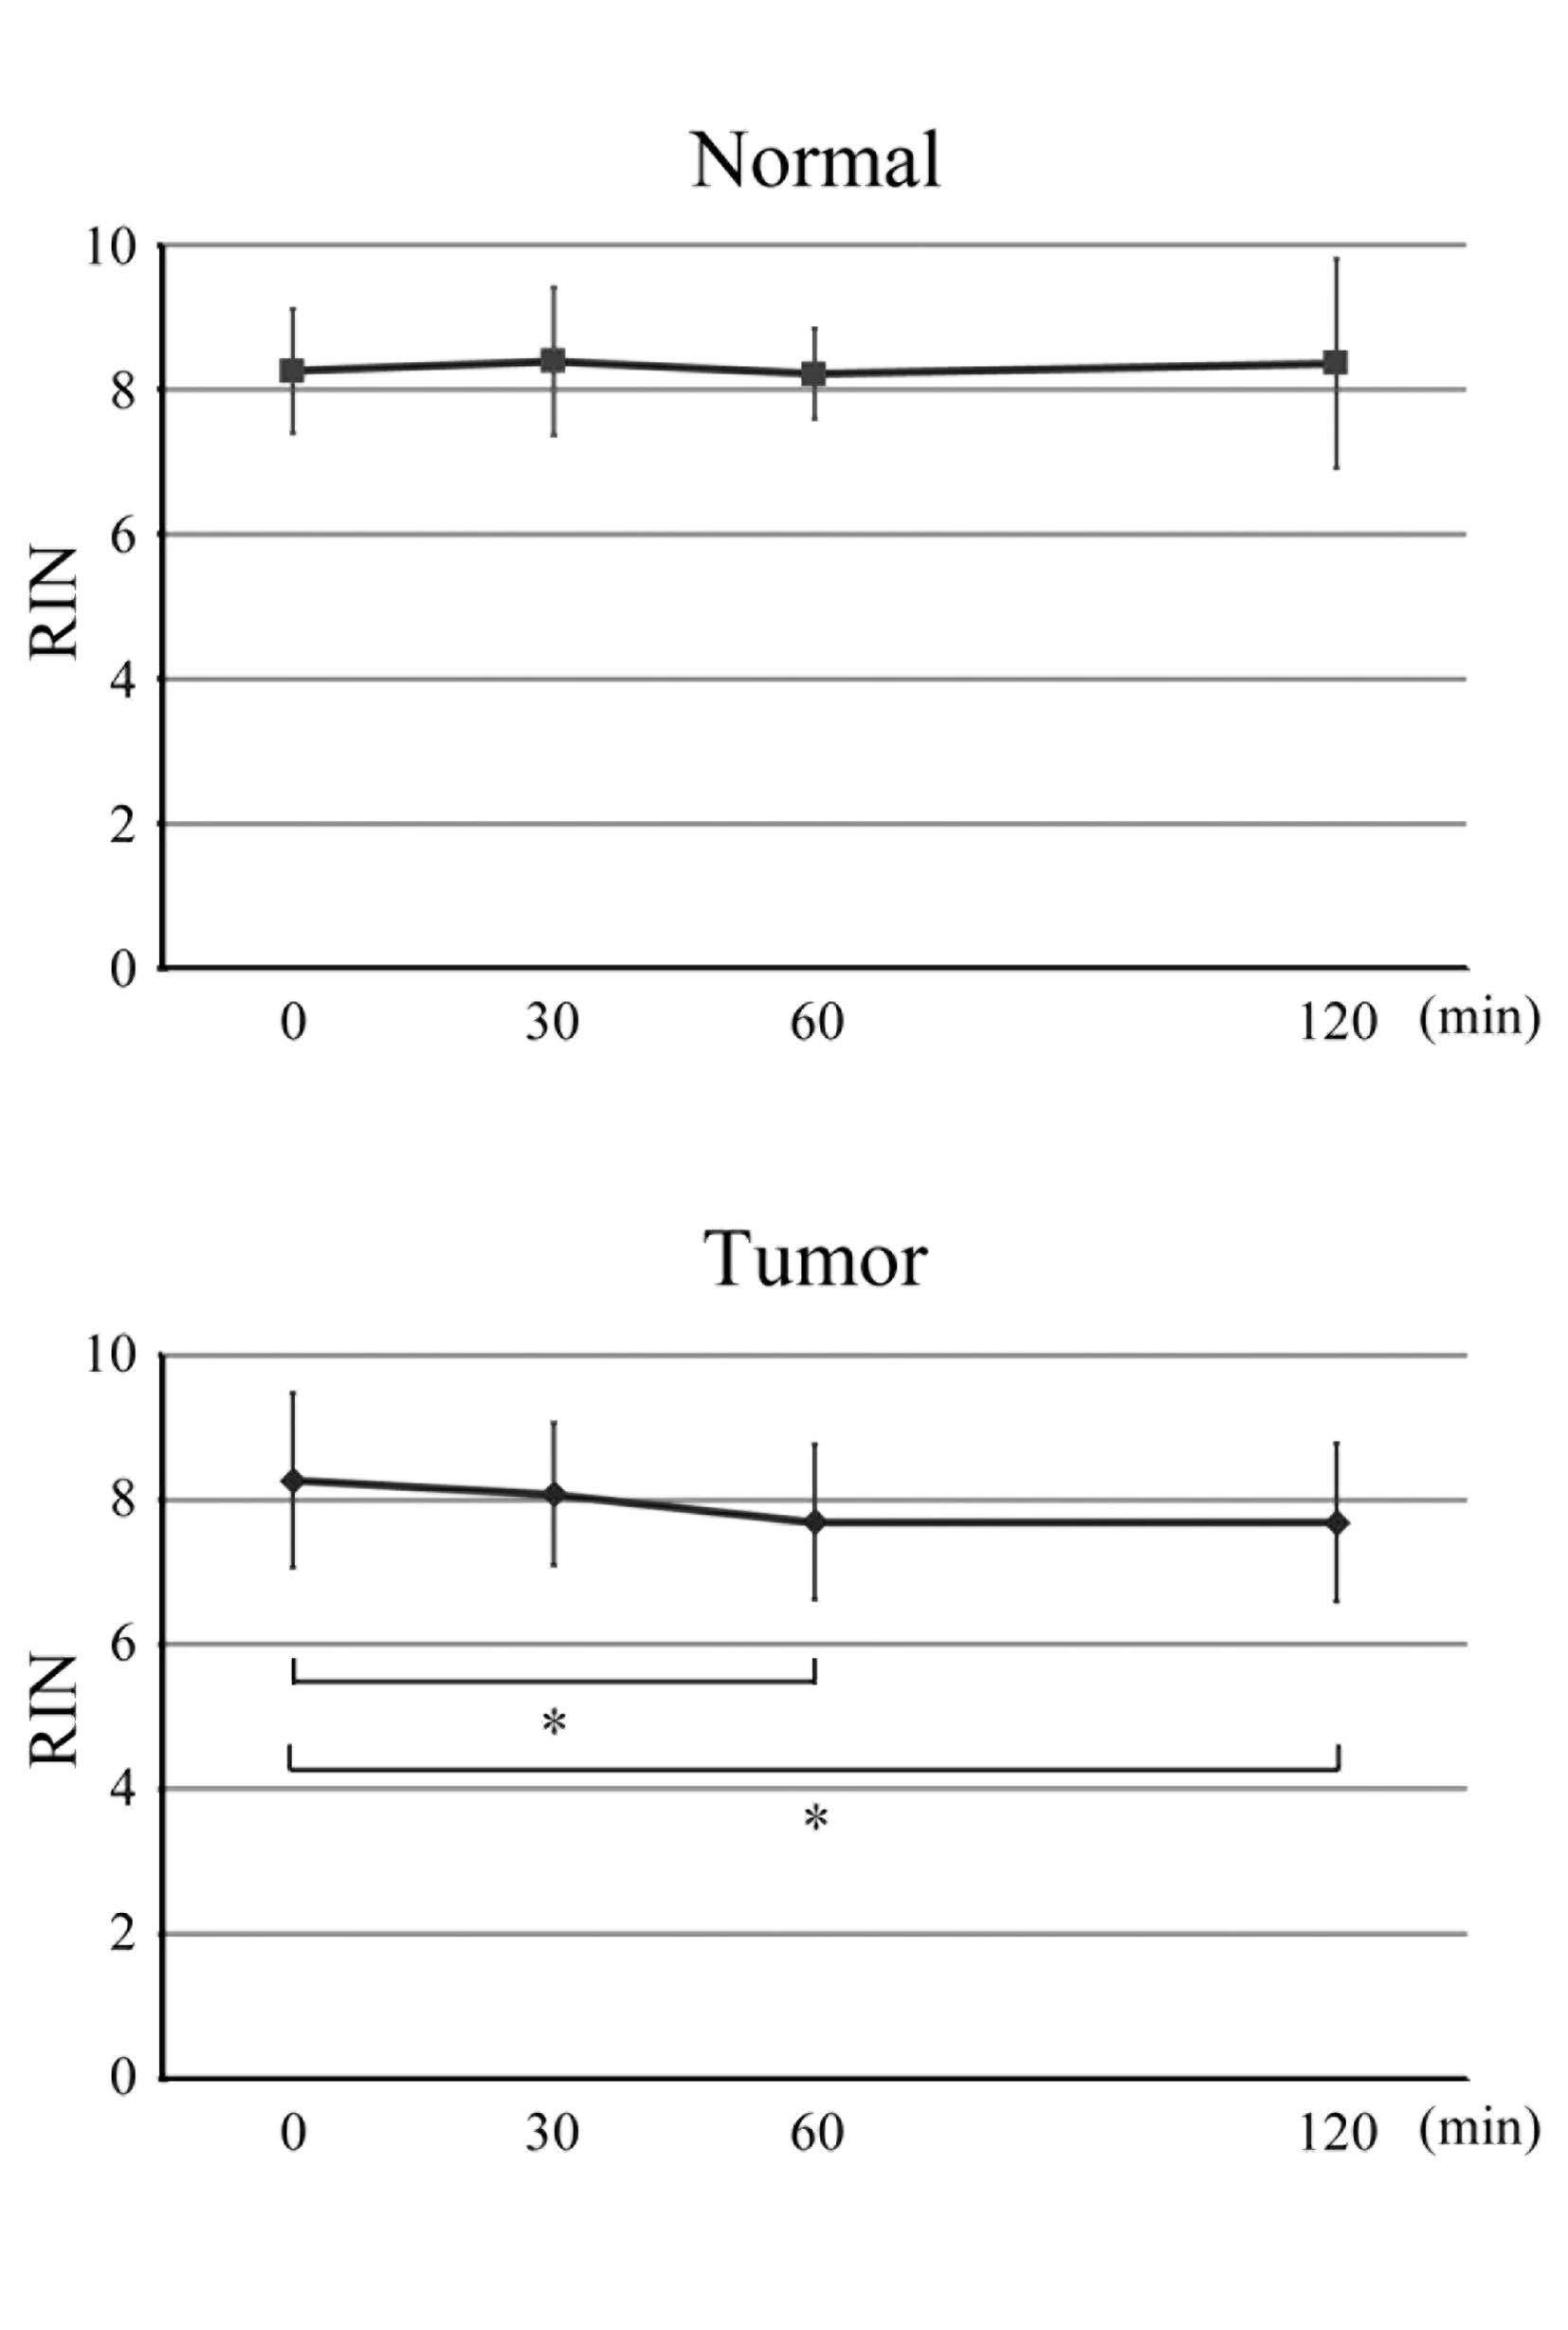
scores. The mean RIN scores at 0, 30, 60 and 120 min in the normal
and tumor samples are shown in Fig.
1. At room temperature, no statistically significant RNA
degradation was found in the normal samples and, at each
time-point, no significant differences in mean RIN scores between
the normal and tumor samples were observed. Although in the tumor
samples, mean RIN scores decreased at 60 and 120 min (P=0.029 and
0.041, respectively), which might be a source of bias in
quantitative analyses, the mean RIN scores of both the normal and
tumor samples were >7 at all time-points, indicating that RNA
quality was maintained in all the samples and that RNA was not
degraded 120 min after surgical resection.
Microarray analyses and gene profiling at
different time-points
To assess gene profiling changes among the different
time-points, we comprehensively examined the microarray data. For
the initial microarray analyses, we selected seven cases with high
RIN values at all time-points to eliminate possible bias from RNA
degradation. The expression profiles of all the samples passed the
microarray quality control, and the differential expression of the
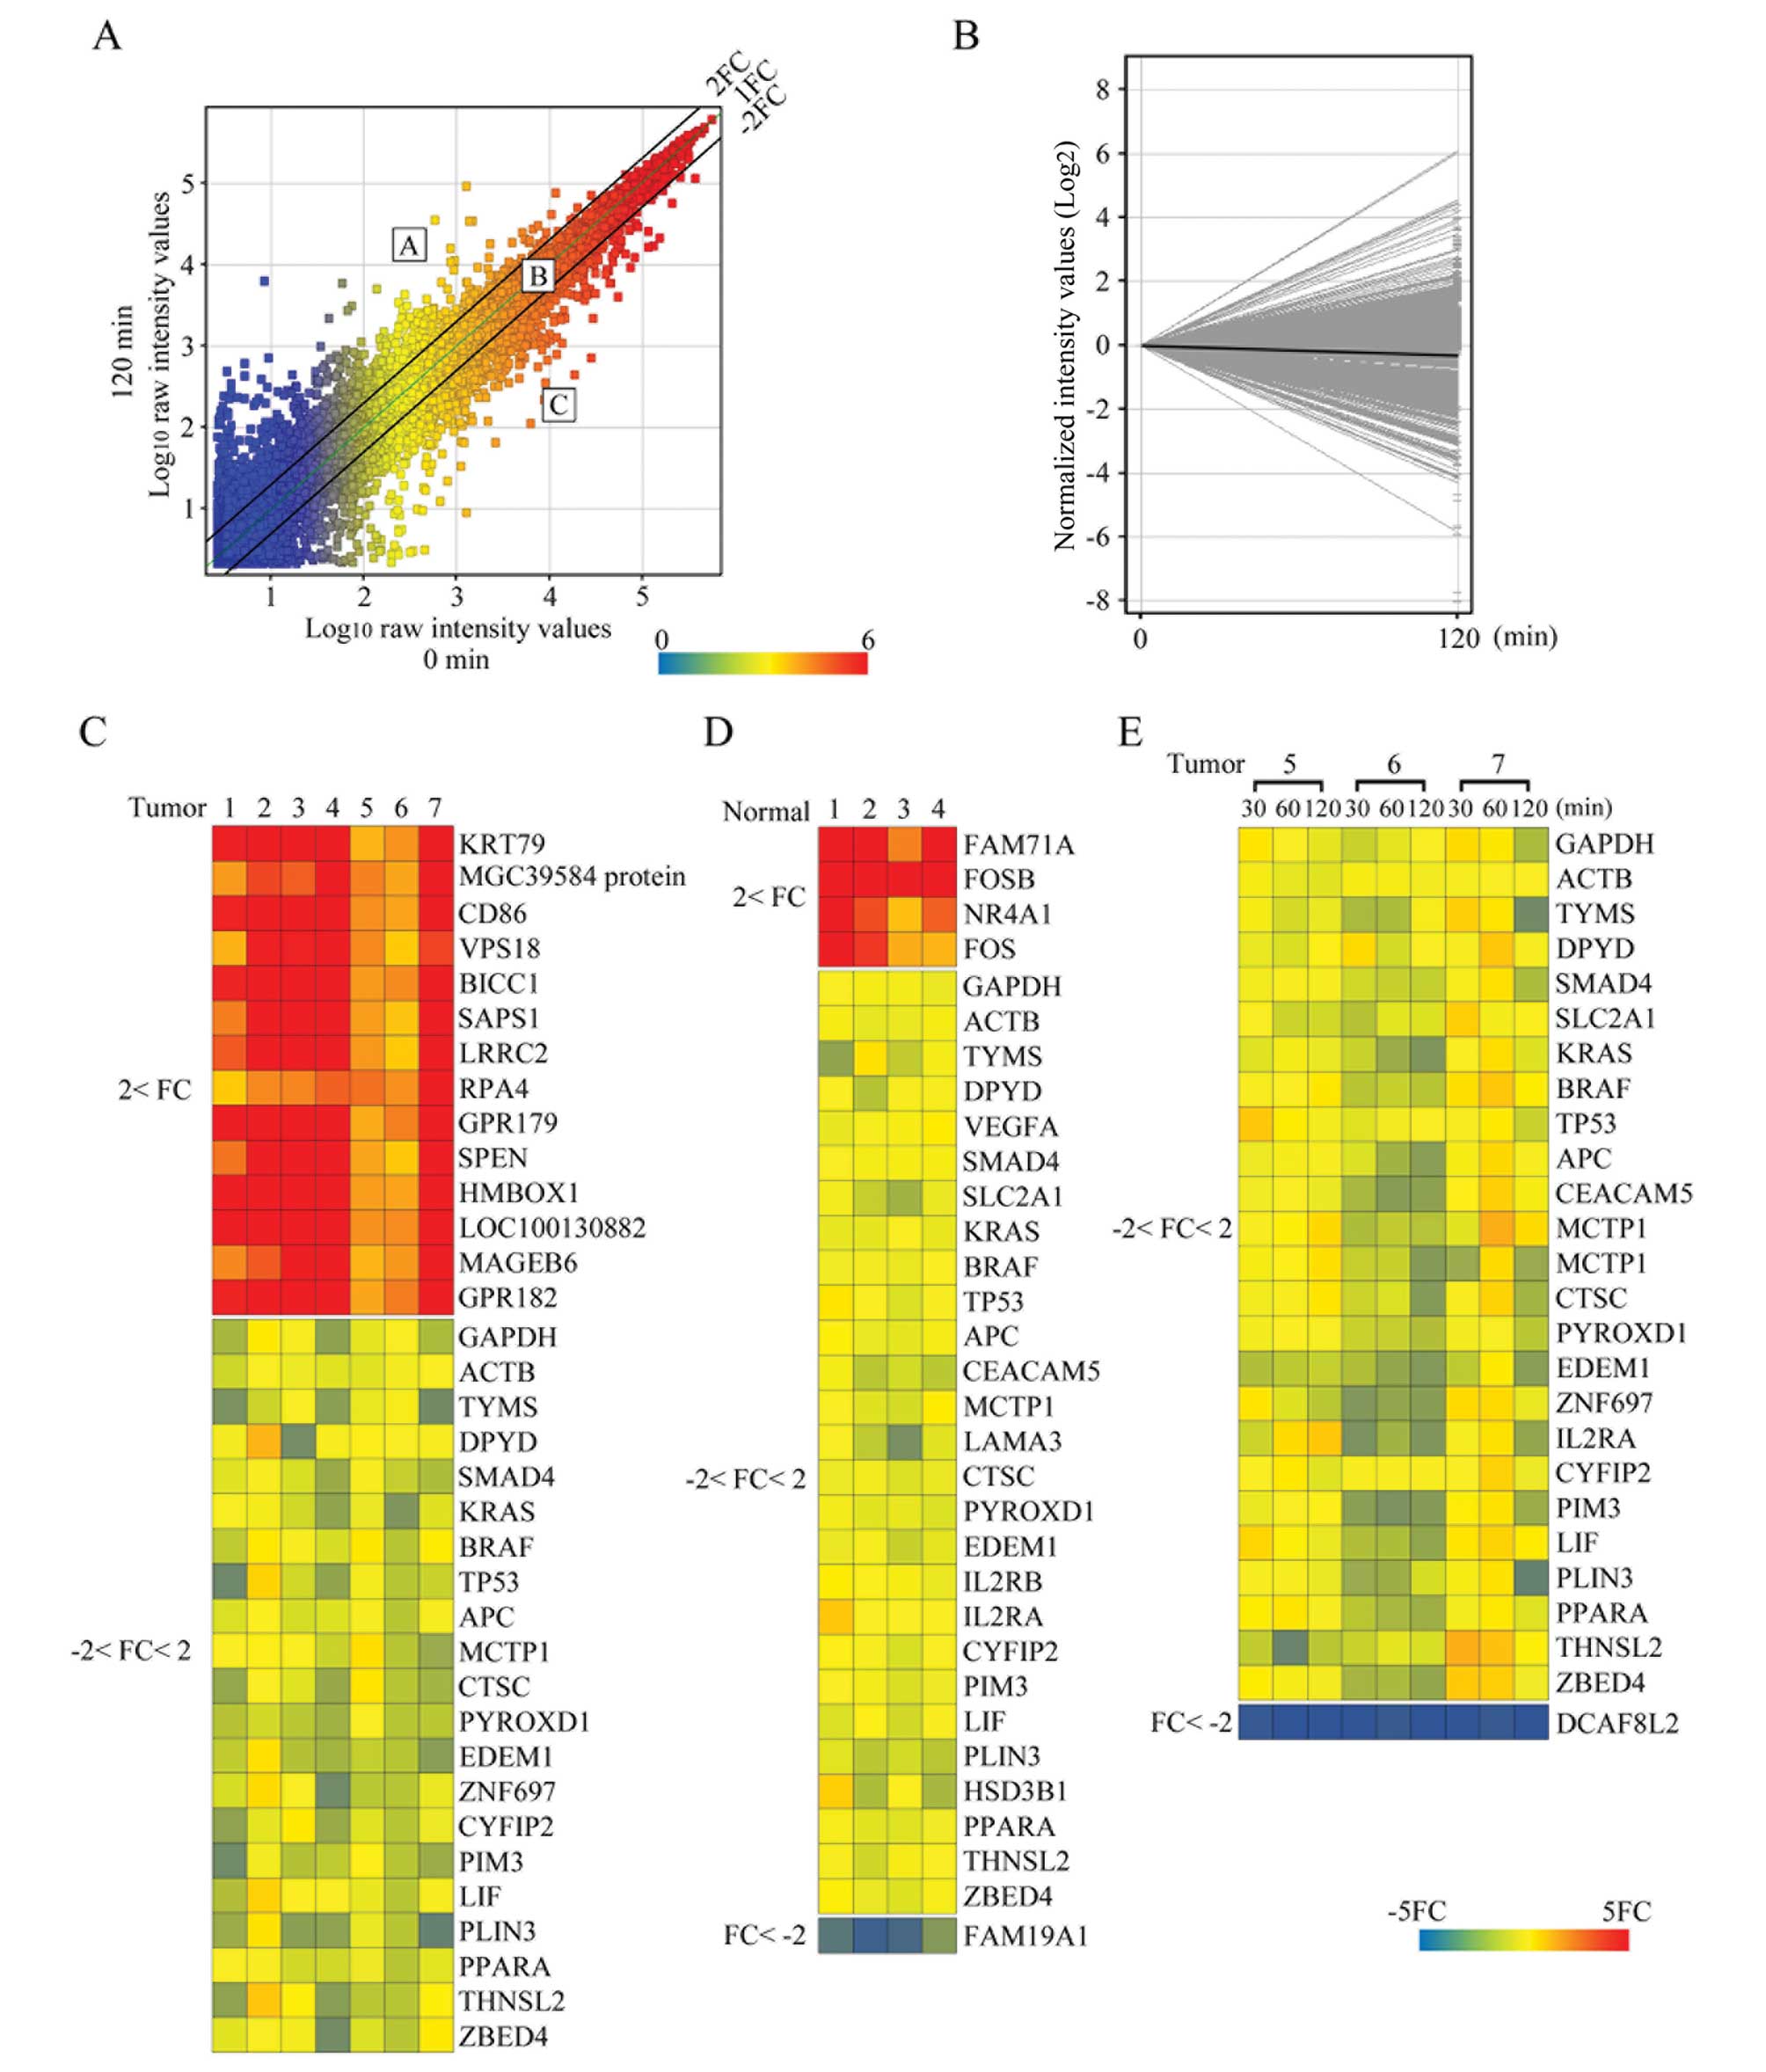
genes between 0 and 120 min was examined. A representative scatter
plot shows the observed changes in gene expression levels between 0
and 120 min in a tumor case (Fig.
2A). Fig. 2B shows the
expression profile plot analyses for representative case with high
RIN values at the 0- to 120-min time-points. In Fig. 2A, the points above the central
diagonal line represent increased gene expression, and the points
below the central diagonal line represent decreased gene expression
at 120 min. The two parallel lines, one above and one below the
central diagonal line, allowed us to classify gene expression
levels into three groups: group A, a >2-fold increase in gene
expression; group B, gene expression levels within a 2-fold change;
and group C, a >2-fold decrease in gene expression. Group B
contained most of the genes (28,055 or 88%) in the tumor samples.
The mean number of probes in group A and group C was 1,964 (6.2%)
and 1,862 (5.9%), respectively. Genes (n=17,537) (55% of the total)
in all tumor samples from seven cases were classified in group B.
These genes included some housekeeping genes, as well as genes that
are important in colon cancer biology [including GAPDH, thymidylate
synthase (TS) and dihydropyrimidine dehydrogenase (DPD)]; (Fig. 2C). Additionally, several colorectal
biomarkers, including Kirsten rat sarcoma viral oncogene homolog
(KRAS), v-raf murine sarcoma viral oncogene homolog B (BRAF)
(17), TS, DPD (18), SMAD family member 4 (SMAD4)
(19) and most ColoPrint reference
genes (8), including multiple C2
domains, transmembrane 1 (MCTP1), cathepsin C (CTSC) and pyridine
nucleotide-disulphide oxidoreductase domain 1 (PYROXD1), were in
group B, indicating the reliability and reproducibility of these
genes for molecular analyses in colorectal cancer. Of note,
however, one ColoPrint-related gene, hydroxy-δ-5-steroid
dehydrogenase, 3β- and steroid δ-isomerase 1 (HSD3B1), had a wide
expression distribution among the time-points. Fifteen genes
belonged to group A in all seven tumor cases. They included genes
that were reported to be colorectal cancer-related genes [including
CD86 molecule (CD86) (20),
vacuolar protein sorting 18 homolog (VPS18) (21) and protein phosphatase 6, regulatory
subunit 1 (SAPS1) (22)]. None of
the genes detected in the tumor samples from all seven cases
belonged to group C. A comparison of normal samples from four cases
at 0 min and 120 min showed that 22,000 genes belonged to group B,
4 genes belonged to group A and 1 gene belonged to group C
(Fig. 2D). To examine differential
gene profiling in more detail, we selected three tumor cases that
showed high RIN values at every time-point and performed additional
microarray analyses at the 30- and 60-min time-points. We found
that overall ~90% of all the genes belonged to group B, and ~10%
were in groups A or C at the 30- and 60-min time-points. The mean
numbers (%) at 30 min were 1,611 (5%), 28,761 (90%) and 1,405 (4%)
and at 60 min they were 1,324 (4.2%), 28,915 (91%) and 1,533 (5%)
for groups A, B and C, respectively. Genes (n=19,070) (60% of the
total) in all tumor samples from three cases and at all time-points
belonged to group B. Of these, some housekeeping genes, such as
GAPDH, actin β (ACTB), β-2-microglobulin (B2M), and 18S ribosomal
RNA, showed high stable expression patterns (Fig. 2E). In contrast, none of the genes
commonly belonged to group A, and only DDB1 and CUL4 associated
factor 8-like 2 (DCAF8L2) commonly belonged to group C at all
time-points.
Quantitative RT-PCR detects random
expression alterations
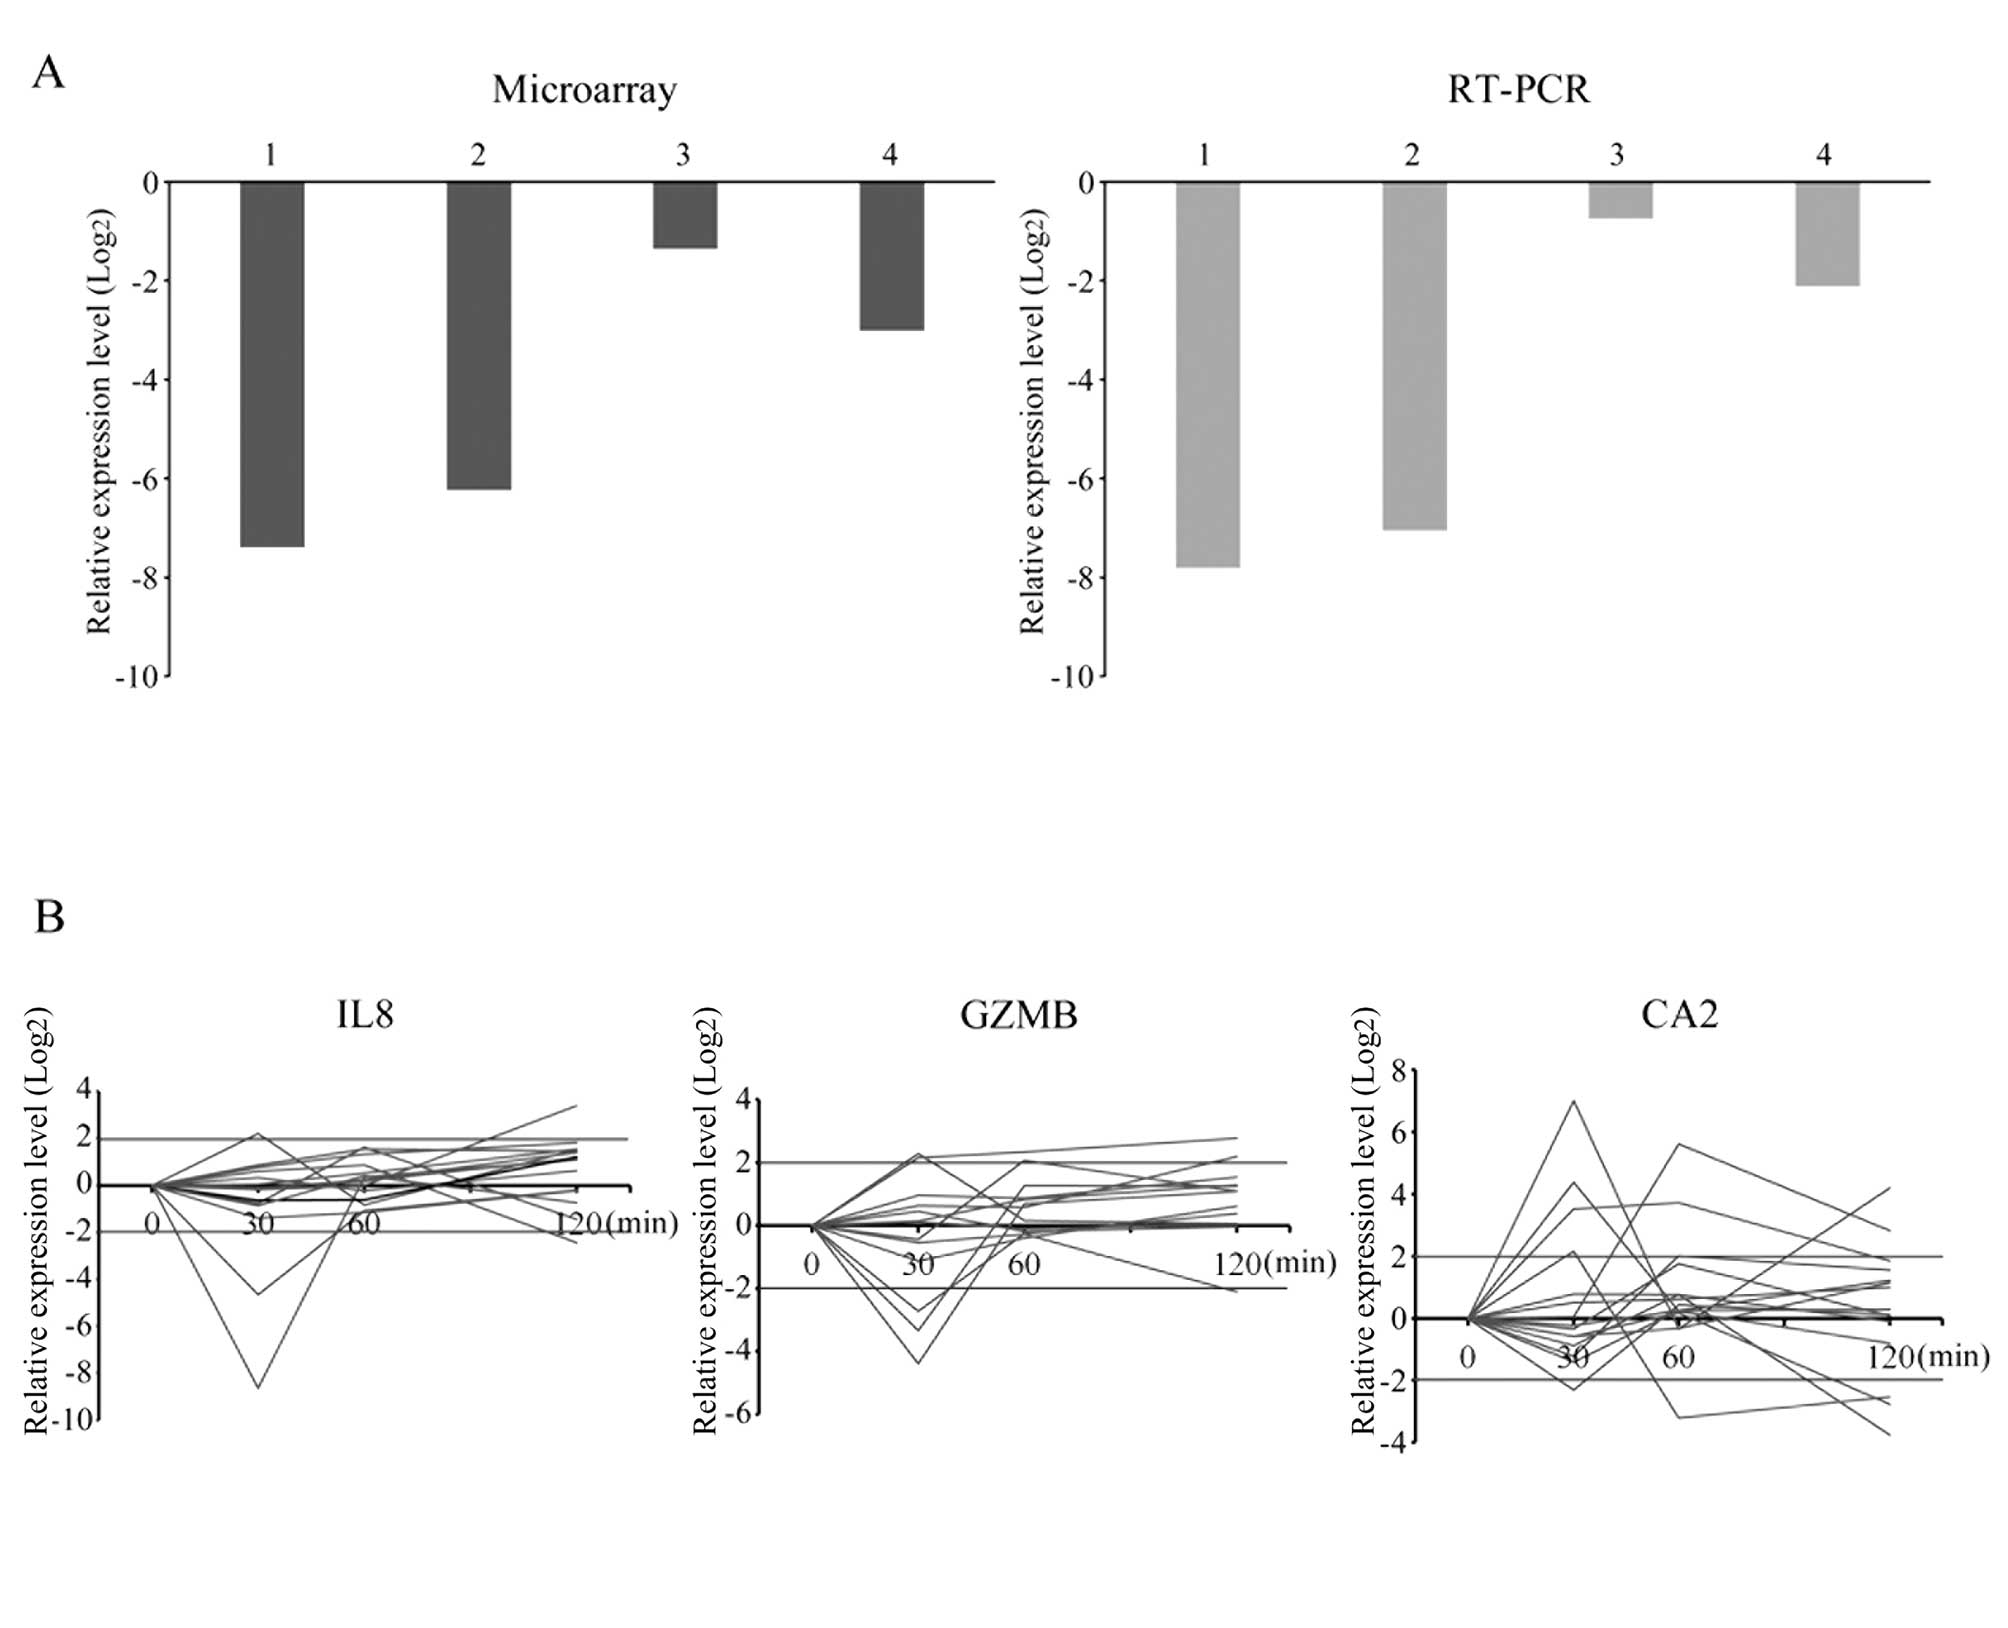
To validate the microarray results, we performed
qRT-PCR of REG3A, a gene that belonged to group C at the 120-min
time-point. The expression levels of REG3A determined using qRT-PCR
agreed with the microarray data in tumor samples (Fig. 3A). Furthermore, we investigated gene
expression changes in IL8, GZMB and CA2, which have been reported
to be associated with colorectal cancer progression, at all
time-points in the 15 tumor cases (Fig.
3B). The expression levels of these genes were observed from
the 30-min time-point, and the pattern of changes appeared to be
incoherent.
Bioinformatics clustering analyses of
gene profiling fail to predict cases
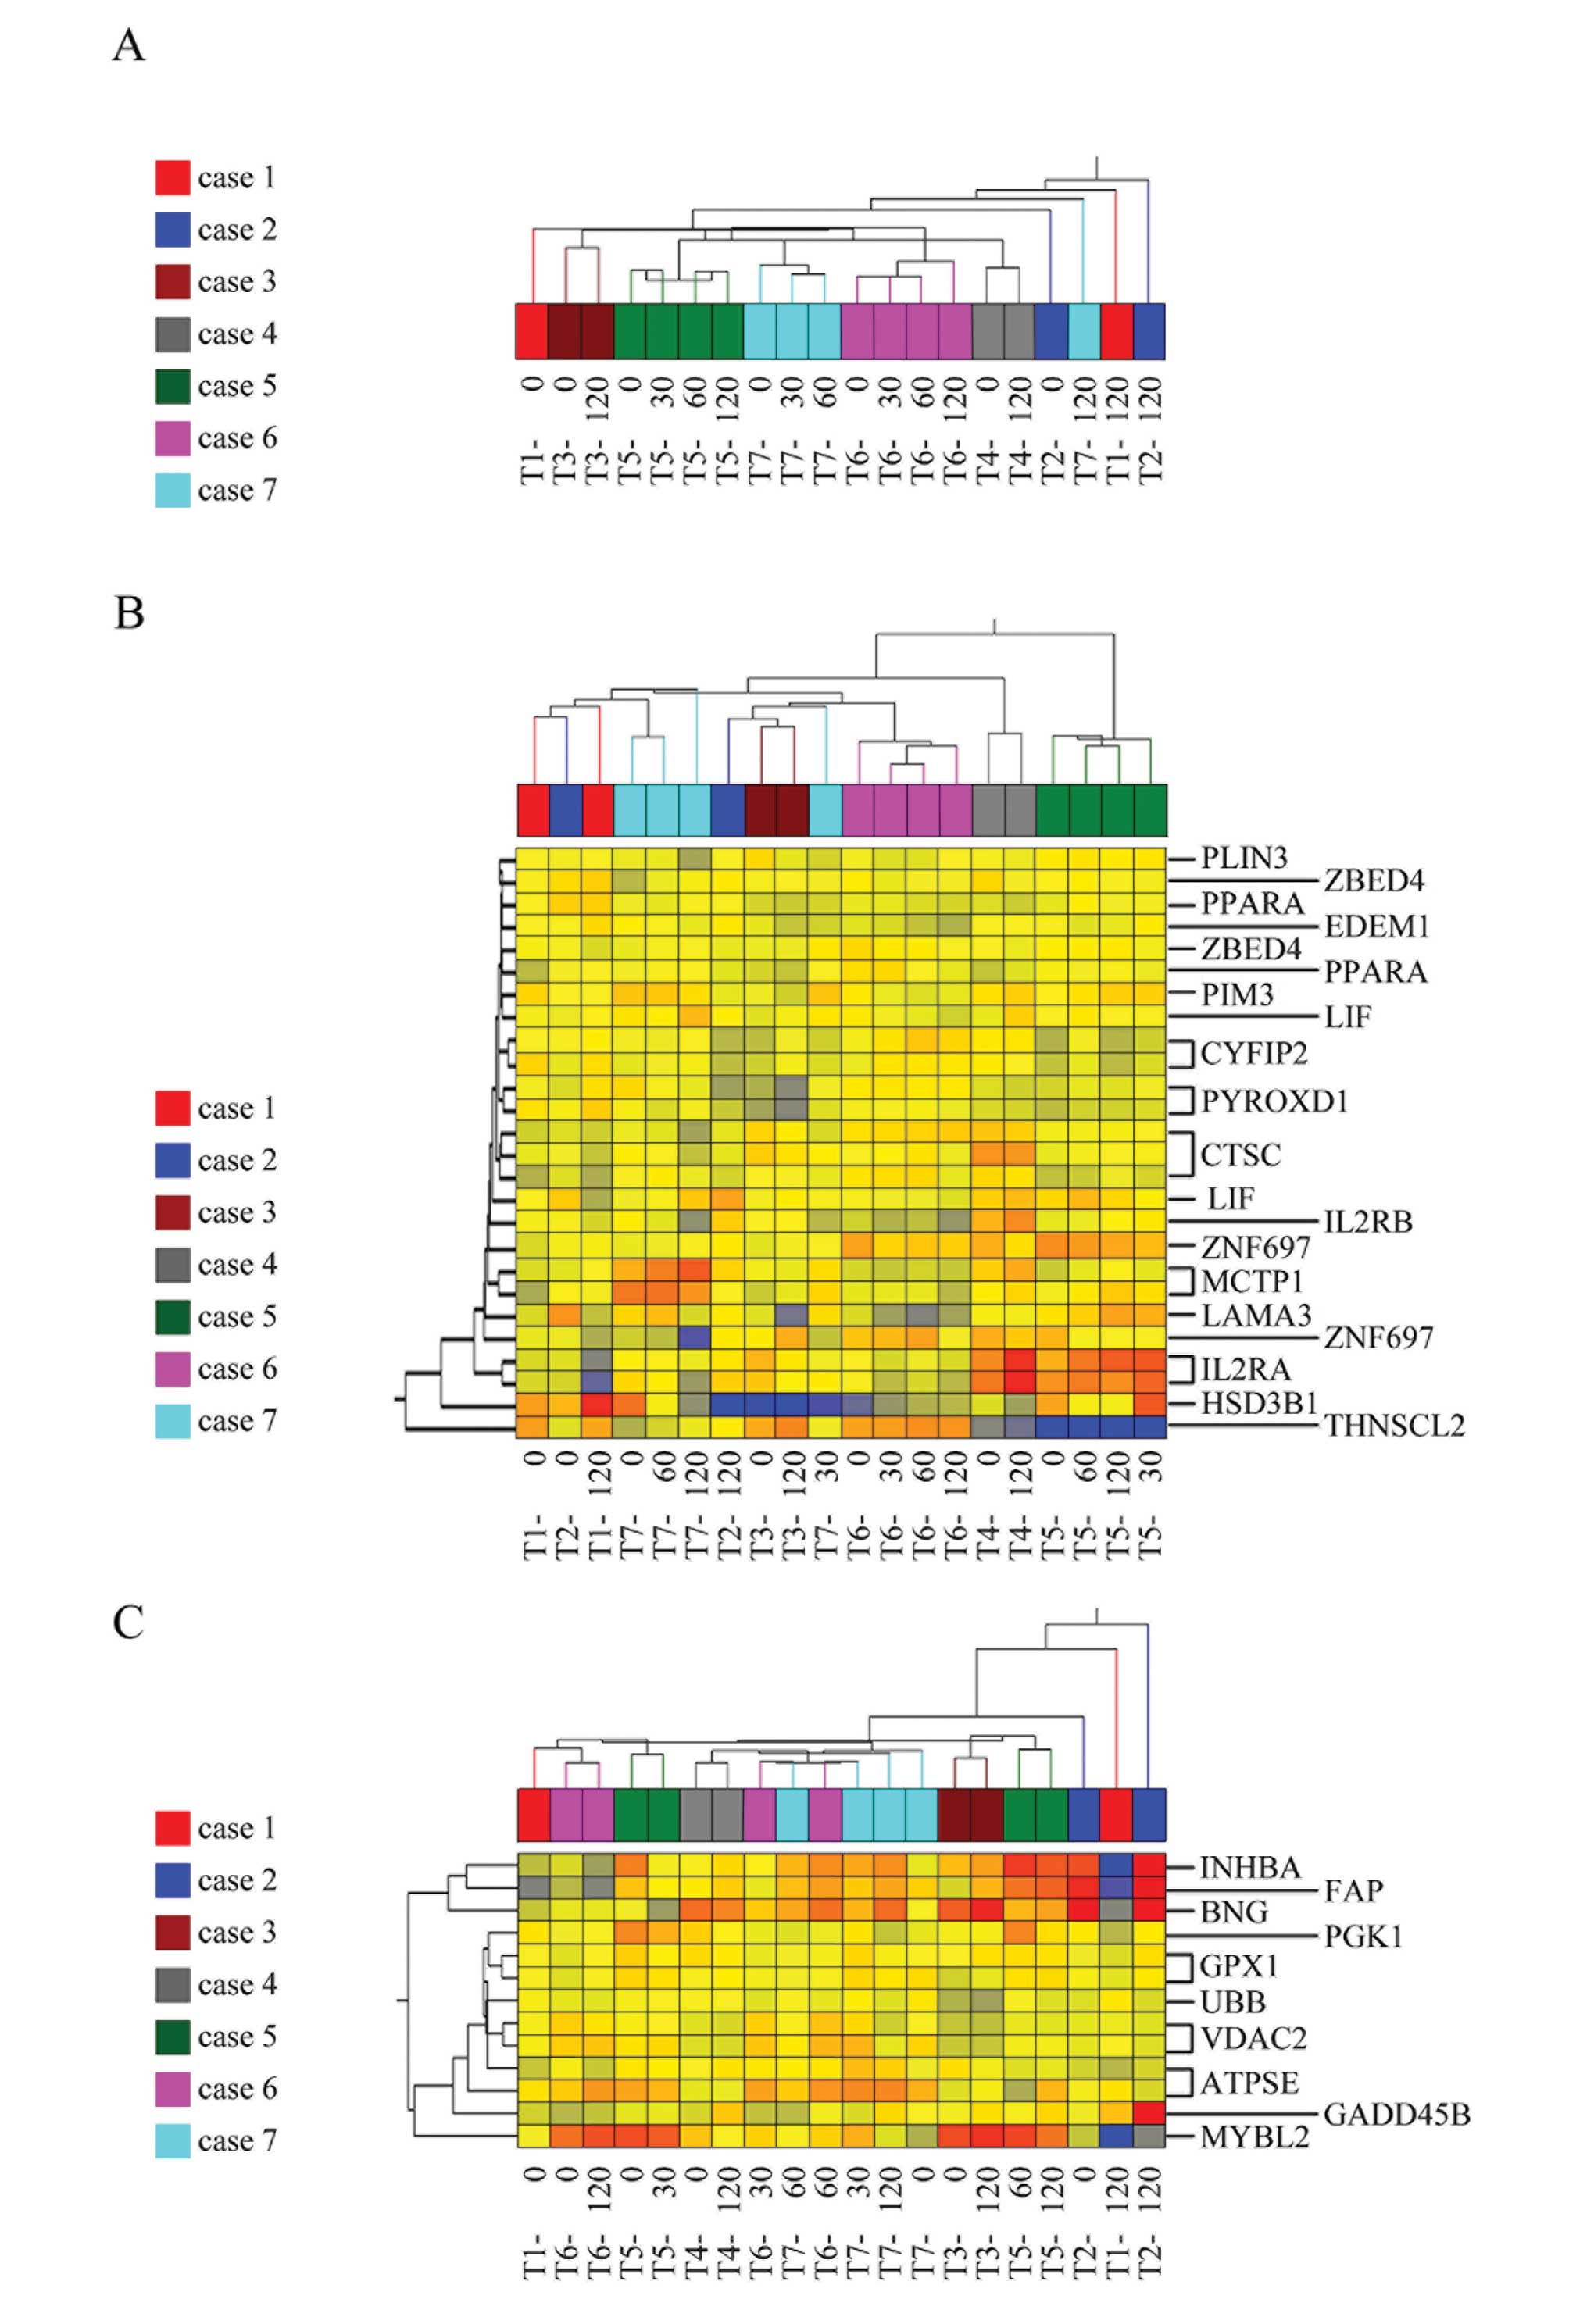
The results of these previous studies prompted us to
investigate whether the alteration of gene expression might cause
critical bias in the quantitative analyses. Clustering analyses was
applied to tumor samples from seven cases and four time-points. The
analyses demonstrated that computer-based bioinformatics was unable
to classify the samples according to cases, even using all the
genes on the array chip (Fig. 4A).
These data indicate that alterations in gene expression patterns
that depend on the time-point could be a potential confounding
factor for analyses. Moreover, we applied clustering analyses to
the same samples using sets of genes identified by Oncotype
(Fig. 4B) and ColoPrint (Fig. 4C). The analysis showed that samples
that originated from the same case were classified into different
clusters, indicating that computer-based bioinformatics could not
distinguish samples case-by-case, even when well-established gene
sets were used, possibly due to a timing-related bias.
Discussion
For quantitative analyses using surgically resected
tissues, the most probable bias is RNA degradation. Previous
studies have shown that tissue degradation was limited in all types
of human tissue except colorectal cancer at room temperature
(23,24). Additionally, other studies have
found significant degradation by measuring the RIN of human colon
and rectal tissue with increasing ischemia time (25–27).
In the present study, the samples showed high RIN values (above 7),
indicating high RNA integrity. The differences between our results
and these earlier reports in terms of RNA integrity likely resulted
from different tissue manipulations (RNAlater reagent vs. liquid
nitrogen). Other mechanisms that may decrease RNA integrity in
colorectal tissue with increasing delay time could be the presence
of normal gut flora, the increased rate of tissue turnover, and/or
the presence of digestive enzymes in the gut (28). Using seven samples that had
excellent RNA quality, we demonstrated that a set of genes could
change expression levels among time-points, indicating that
extraction timing is a crucial confounding factor for quantitative
assessment of gene expression. We found that approximately 90% of
genes did not change expression levels (within 2-fold) up to 120
min after surgical resection, which is in agreement with a report
by Spruessel et al (11).
Housekeeping genes such as GAPDH, 18S and ACTB were among the
stably expressing genes across cases and time-points (group B)
(Fig. 2B) and this is in accordance
with previous results (29). This
result is noteworthy as most qualitative experiments have been
performed using these housekeeping genes as internal controls.
Additionally, several colorectal biomarkers, including TS, DPD
(18) and vascular endothelial
growth factor (VEGF) (30) and most
ColoPrint reference genes (8),
including MCTP1, CTSC and PYROXD1, were in group B, indicating the
reliability and reproducibility of these genes for molecular
analyses in colorectal cancer. Of note, however, one
ColoPrint-related gene, HSD3B1, had wide expression distribution
among time-points. This is an alarming possible bias if it is used
in quantitative analyses as it is a well-established biomarker. In
contrast, 10% of genes belonged to groups A or C at each time-point
in the present study. It has been reported that 15–30 min after
surgery, 10–20% of genes differed significantly from baseline
values (11). We suggest that these
gene expression changes in the tumor are related to activity in
response to ischemia, perhaps to allow the tumor cells to survive
and participate in many complicated signaling pathways.
Additionally, there is increasing awareness that colorectal tumors
have to survive and grow in a poor microenvironment with low oxygen
and glucose availability due to inadequacies of the
tumor-associated vasculature (31,32).
Musella et al (26)
described that the genes that changed at 180 min in tumor samples
were all oncogenes, and the expression levels over time
increased.
Regarding the result of the qRT-PCR analysis, IL8,
GZMB and CA2 constitute a set of specific gene-expression profiles
that predict prognosis or recurrence. In the present study, we
found that these biomarker genes had incoherently altered
expression at all time-points, indicating the impact of ischemia
time on changes in prognostic or predictive molecular biomarkers
after surgical resection.
There are potential drawbacks to the present study.
First, the potential for bias as a result of the surgical procedure
remains. We used standard laparotomic or laparoscopic colorectal
surgery that maintained tumor vascularity until just before
surgical resection to minimize surgical stress, and we extracted
the tissue samples at room temperature under clinical surgical
conditions. Some studies have a profound clinical relevance as
their results are subject to procedural effects rather than tumor
biology (9). Second, considering
the heterogeneity of tumorigenesis, we removed pieces of tumor
tissue from the near part of the tumor lesion; however, the
influence of inherent heterogeneity when using frozen tissue
samples cannot be avoided (33).
Nevertheless, our data demonstrated the impact of
timing on quantitative gene-expression profiles using the most
robust microarray procedures. The impact of alterations of the gene
expression pattern over time on biomarker analysis should be
considered, as these time-dependent results could potentially
mislead, and this could have immediate effects on decisions
regarding patient treatment.
Acknowledgements
The authors thank Yuki Takagi for the technical
support in the GeneSpring analysis.
References
|
1
|
Parkin DM, Bray F, Ferlay J and Pisani P:
Global cancer statistics, 2002. CA Cancer J Clin. 55:74–108. 2005.
View Article : Google Scholar
|
|
2
|
Andre T, Boni C, Navarro M, et al:
Improved overall survival with oxaliplatin, fluorouracil, and
leucovorin as adjuvant treatment in stage II or III colon cancer in
the MOSAIC trial. J Clin Oncol. 27:3109–3116. 2009. View Article : Google Scholar : PubMed/NCBI
|
|
3
|
Grone J, Lenze D, Jurinovic V, et al:
Molecular profiles and clinical outcome of stage UICC II colon
cancer patients. Int J Colorectal Dis. 26:847–858. 2011. View Article : Google Scholar : PubMed/NCBI
|
|
4
|
Saigusa S, Tanaka K, Toiyama Y, et al:
Gene expression profiles of tumor regression grade in locally
advanced rectal cancer after neoadjuvant chemoradiotherapy. Oncol
Rep. 28:855–861. 2012.PubMed/NCBI
|
|
5
|
Lin YH, Friederichs J, Black MA, et al:
Multiple gene expression classifiers from different array platforms
predict poor prognosis of colorectal cancer. Clin Cancer Res.
13:498–507. 2007. View Article : Google Scholar : PubMed/NCBI
|
|
6
|
Nastase A, Paslaru L, Niculescu AM, et al:
Prognostic and predictive potential molecular biomarkers in colon
cancer. Chirurgia (Bucur). 106:177–185. 2011.PubMed/NCBI
|
|
7
|
O’Connell MJ, Lavery I, Yothers G, et al:
Relationship between tumor gene expression and recurrence in four
independent studies of patients with stage II/III colon cancer
treated with surgery alone or surgery plus adjuvant fluorouracil
plus leucovorin. J Clin Oncol. 28:3937–3944. 2010.
|
|
8
|
Salazar R, Roepman P, Capella G, et al:
Gene expression signature to improve prognosis prediction of stage
II and III colorectal cancer. J Clin Oncol. 29:17–24. 2011.
View Article : Google Scholar : PubMed/NCBI
|
|
9
|
Ma Y, Dai H and Kong X: Impact of warm
ischemia on gene expression analysis in surgically removed
biosamples. Anal Biochem. 423:229–235. 2012. View Article : Google Scholar : PubMed/NCBI
|
|
10
|
Liu NW, Sanford T, Srinivasan R, et al:
Impact of ischemia and procurement conditions on gene expression in
renal cell carcinoma. Clin Cancer Res. 19:42–49. 2013. View Article : Google Scholar : PubMed/NCBI
|
|
11
|
Spruessel A, Steimann G, Jung M, et al:
Tissue ischemia time affects gene and protein expression patterns
within minutes following surgical tumor excision. Biotechniques.
36:1030–1037. 2004.
|
|
12
|
Atkin G, Daley FM, Bourne S, Glynne-Jones
R, Northover J and Wilson GD: The effect of surgically induced
ischaemia on gene expression in a colorectal cancer xenograft
model. Br J Cancer. 94:121–127. 2006. View Article : Google Scholar : PubMed/NCBI
|
|
13
|
Leslie HS, Mary KG and Christian W: TNM
classification of malignant tumours. 7th edition. Willey Blackwell;
NJ: 2010
|
|
14
|
Kanemitsu Y, Komori K, Kimura K and Kato
T: D3 Lymph node dissection in right hemicolectomy with a no-touch
isolation technique in patients with colon cancer. Dis Colon
Rectum. 56:815–824. 2013. View Article : Google Scholar : PubMed/NCBI
|
|
15
|
Schroeder A, Mueller O, Stocker S, et al:
The RIN: an RNA integrity number for assigning integrity values to
RNA measurements. BMC Mol Biol. 7:32006. View Article : Google Scholar : PubMed/NCBI
|
|
16
|
Kiewe P, Gueller S, Komor M, Stroux A,
Thiel E and Hofmann WK: Prediction of qualitative outcome of
oligonucleotide microarray hybridization by measurement of RNA
integrity using the 2100 Bioanalyzer capillary electrophoresis
system. Ann Hematol. 88:1177–1183. 2009. View Article : Google Scholar
|
|
17
|
Cunningham D, Atkin W, Lenz HJ, et al:
Colorectal cancer. Lancet. 375:1030–1047. 2010. View Article : Google Scholar
|
|
18
|
Ren DN, Kim IY, Koh SB, et al: Comparative
analysis of thymidylate synthase at the protein, mRNA, and DNA
levels as prognostic markers in colorectal adenocarcinoma. J Surg
Oncol. 100:546–552. 2009. View Article : Google Scholar : PubMed/NCBI
|
|
19
|
Tian X, Du H, Fu X, Li K, Li A and Zhang
Y: Smad4 restoration leads to a suppression of Wnt/β-catenin
signaling activity and migration capacity in human colon carcinoma
cells. Biochem Biophys Res Commun. 380:478–483. 2009.PubMed/NCBI
|
|
20
|
Garufi A, Pistritto G, Ceci C, et al:
Targeting COX-2/PGE2 pathway in HIPK2 knockdown cancer
cells: impact on dendritic cell maturation. PLoS One.
7:e483422012.
|
|
21
|
Peterson MR and Emr SD: The class C Vps
complex functions at multiple stages of the vacuolar transport
pathway. Traffic. 2:476–486. 2001. View Article : Google Scholar : PubMed/NCBI
|
|
22
|
Hong BS, Cho JH, Kim H, et al: Colorectal
cancer cell-derived microvesicles are enriched in cell
cycle-related mRNAs that promote proliferation of endothelial
cells. BMC Genomics. 10:5562009. View Article : Google Scholar : PubMed/NCBI
|
|
23
|
Blackhall FH, Pintilie M, Wigle DA, et al:
Stability and heterogeneity of expression profiles in lung cancer
specimens harvested following surgical resection. Neoplasia.
6:761–767. 2004. View Article : Google Scholar : PubMed/NCBI
|
|
24
|
Heinrich M, Matt K, Lutz-Bonengel S and
Schmidt U: Successful RNA extraction from various human postmortem
tissues. Int J Legal Med. 121:136–142. 2007. View Article : Google Scholar : PubMed/NCBI
|
|
25
|
Bray SE, Paulin FE, Fong SC, et al: Gene
expression in colorectal neoplasia: modifications induced by tissue
ischaemic time and tissue handling protocol. Histopathology.
56:240–250. 2010. View Article : Google Scholar : PubMed/NCBI
|
|
26
|
Musella V, Verderio P, Reid JF, et al:
Effects of warm ischemic time on gene expression profiling in
colorectal cancer tissues and normal mucosa. PLoS One.
8:e534062013. View Article : Google Scholar : PubMed/NCBI
|
|
27
|
Huang J, Qi R, Quackenbush J, et al:
Effects of ischemia on gene expression. J Surg Res. 99:222–227.
2001. View Article : Google Scholar : PubMed/NCBI
|
|
28
|
Lee J, Hever A, Willhite D, Zlotnik A and
Hevezi P: Effects of RNA degradation on gene expression analysis of
human postmortem tissues. FASEB J. 19:1356–1358. 2005.PubMed/NCBI
|
|
29
|
Ohashi Y, Creek KE, Pirisi L, Kalus R and
Young SR: RNA degradation in human breast tissue after surgical
removal: a time-course study. Exp Mol Pathol. 77:98–103. 2004.
View Article : Google Scholar : PubMed/NCBI
|
|
30
|
Bertrand C, Kowalski-Chauvel A, Do C, et
al: A gastrin precursor, gastrin-gly, upregulates VEGF expression
in colonic epithelial cells through an HIF-1-independent mechanism.
Int J Cancer. 126:2847–2857. 2010.PubMed/NCBI
|
|
31
|
Gatenby RA and Gillies RJ: A
microenvironmental model of carcinogenesis. Nat Rev Cancer.
8:56–61. 2008. View
Article : Google Scholar : PubMed/NCBI
|
|
32
|
Warburg O: On the origin of cancer cells.
Science. 123:309–314. 1956. View Article : Google Scholar : PubMed/NCBI
|
|
33
|
Kuwai T, Nakamura T, Kim SJ, et al:
Intratumoral heterogeneity for expression of tyrosine kinase growth
factor receptors in human colon cancer surgical specimens and
orthotopic tumors. Am J Pathol. 172:358–366. 2008. View Article : Google Scholar
|