Introduction
Ovarian cancer (OC) arises from malignant
transformation of the female ovaries. In the US in 2009, there were
an estimated 21,880 newly diagnosed cases and 13,850 deaths
resulting from the disease (1). The
high rate of death may be attributed to late-stage diagnosis;
approximately two-thirds of patients are diagnosed with stage III
or IV disease (2). OC is the
leading cause of death among gynecological cancers with an overall
5-year survival rate of ~19–39% (3). Unfortunately, current treatment
strategies are lacking. Thus, a more comprehensive understanding of
OC is required to develop additional potentialy targeted therapies
that can increase the survival of those diagnosed with the
disease.
A number of studies have examined the genetic
alterations and signal transduction changes that occur upon
initiation and progression of OC (4). Despite these findings, there is still
much knowledge concerning the underlying mechanisms governing OC
growth that is unknown.
In the present study, we examined a possible role of
N-myc downstream regulated gene 1 (NDRG1) in OC. NDRG1 belongs to a
family of genes consisting of four members which all share ~57–65%
sequence identity (5). NDRG1 is
predominantly cytoplasmic, and the protein is ubiquitously
expressed both in normal and neoplastic tissues. Additionally, it
is highly conserved among multicellular organisms (6). NDRG1 has been implicated in
carcinogenesis, particularly in invasion and metastasis (7,8).
However, it may play distinct roles in different types of tumor.
NDRG1 has been reported to act as a tumor suppressor in a number of
cancers, including breast (9),
prostate (10–12), pancreatic (7,8,13),
cervical (14), highly metastatic
colon (15) and gastric cancer
(16). However, in hepatocellular
carcinoma, NDRG1 may actually promote growth (17,18).
The exact role of NDRG1 in OC has not been well studied. Thus, in
the present study, we examined the role of NDRG1 in four OC cell
lines. We both knocked down and overexpressed NDRG1 in the OC cell
line OVCAR3 and found that it exhibited a growth suppressive
function in this cell line. These studies provide evidence for
additional, more comprehensive, analyses of NDRG1 in OC.
Materials and methods
Reagents and cell culture
Human OC cell lines HO8910, OVCAR3, SKOV3 and A2780
were obtained from the Chinese Academy of Medical Sciences. HO8910
and SKOV3 cells were cultured in Dulbecco’s modified Eagle’s medium
(DMEM) (HyClone, Thermo Scientific, Waltham, MA, USA). OVCAR3 and
A2780 cells were cultured in RPMI-1640 medium (HyClone). All medium
was supplemented with 10% fetal bovine serum (FBS) (HyClone) and 1%
penicillin/streptomycin. Cells were maintained in a 37°C incubator
supplied with 5% CO2.
Construction of short hairpin RNA (shRNA)
plasmids
shRNA directed against human NDRG1 was purchased
from GenePharma Biotechnology (Shanghai, China); all sequences are
listed in Table I. The shRNA
effective target sequence for NDRG1 was 5′-TTCAAGAGA-3′. OVCAR3
cells were stably transfected with recombinant NDRG1-targeted shRNA
plasmids or a control shRNA vector using Lipofectamine 2000
(Invitrogen, Carlsbad, CA, USA). Stable clones were confirmed by
real-time RT-PCR and western blotting. The resulting cell lines
were designated as OVCAR3-shNDRG1 and OVCAR3-shNC (negative
control).
 | Table IShort hairpin RNA sequences designed
with the GenScript siRNA target finder. |
Table I
Short hairpin RNA sequences designed
with the GenScript siRNA target finder.
| Name | Sequence |
|---|
| F1 | F:
5′-gatccGCGTGAACCCTTGTGCGGAATTCAAGAGATTCCGCACAAGGGTTCACGTTTTTTg-3′
R:
5′-aattcAAAAAACGTGAACCCTTGTGCGGAATCTCTTGAATTCCGCACAAGGGTTCACGCg-3′ |
| F2 | F:
5′-gatccGCTGATCCAGTTTCCGGAATTCAAGAGATTCCGGAAACTGGATCAGCTTTTTTg-3′
R:
5′-aattcAAAAAAGCTGATCCAGTTTCCGGAATCTCTTGAATTCCGGAAACTGGATCAGCg-3′ |
| F3 | F:
5′-gatccGCCACAAAACCTGCTACAACTTCAAGAGAGTTGTAGCAGGTTTTGTGGTTTTTTg-3′
R:
5′-aattcAAAAAACCACAAAACCTGCTACAACTCTCTTGAAGTTGTAGCAGGTTTTGTGGCg-3′ |
| Control | F:
5′-GATCCGACGAGTTGACTGCGATTGTTCAAGAGACAATCGCAGTCAACTCGTCAGA-3′
R:
5′-AGCTTCTGACGAGTTGACTGCGATTGTCTCTTGAACAATCGCAGTCAACTCGTCG-3′ |
Quantitative real-time PCR
Total RNA was extracted with TRIzol reagent
(Invitrogen). A cDNA synthesis reaction (20 μl) was set up using
PrimeScript RT reagent kit (Takara, Otsu, Shiga, Japan) according
to the manufacturer’s instructions. Reaction conditions were as
follows: 25°C for 10 min, 42°C for 30 min and 85°C for 5 min. cDNA
was then amplified and detected using SYBR Premix Ex Taq™ Perfect
Real-Time PCR Master Mix kit (Takara). Real-time PCR was performed
as follows: stage 1, pre-denaturation at 95°C for 10 min; stage 2,
40 cycles of 95°C for 15 sec, 58°C for 20 sec and 72°C for 27 sec;
dissociation, 95°C for 15 sec, 60°C for 30 sec and 95°C for 15 sec.
The melting curve for each primer pair was analyzed to verify
specificity of the amplified product. Gene expression levels were
normalized to β-actin and relative gene expression was determined
as previously described (19).
Primer sequences and expected product sizes are as follows:
5′-CGCCAGCACATTGTGAATGAC-3′ (forward) and
5′-TTTGAGTTGCACTCCACCACG-3′ (reverse) for NDRG1;
5′-CATCCTCACCCTGAAGTACCC-3′ (forward) and
5′-AGCCTGGATAGCAACGTACATG-3′ (reverse) for β-actin.
Western blotting
Total cell lysates were prepared with RIPA buffer
containing phenylmethylsulfonyl fluoride (PMSF; Beyotime Institute
of Biotechnology, China). Equal amounts of protein were separated
by SDS-PAGE (10% polyacrylamide gels) and transferred to
nitrocellulose membranes. The membranes were blocked with 5% milk
in Tris-buffered saline containing 0.05% (v/v) Tween-20 for 1 h at
room temperature. This was followed by overnight incubation with
the appropriate antibody (rabbit anti-NDRG1 monoclonal antibody,
cat. no. ab32072, 1:10,000; Abcam, UK; mouse anti β-actin
monoclonal antibody, cat no. 600008-1-Ig, 1:1,000; ProteinTech,
USA) at 4°C. The protein signal was detected with an ECL system
(Millipore) and photographed with FluorChem E image system (Cell
Biosciences).
Morphological analysis of the cultured
cells
NDRG1-depleted cells (OVCAR3-shNDRG1) and control
cells (OVCAR3-shNC) were seeded onto chamber slides and left
overnight. The next day they were fixed with 4% paraformaldehyde,
stained with 1% crystal violet and examined by light
microscopy.
Cell proliferation assay
A
3-(4,5-dimethylthiazol-2-yl)-2,5-diphenyltetrazolium bromide (MTT)
cell proliferation assay kit (Beyotime, China) was used. Briefly,
OVCAR3 cells transfected with shRNA-NDRG1 or shRNA-NC were plated
in triplicate in 96-well plates and incubated for 24 h to allow
cells to attach. After 48 h, the MTT assay was performed using 20
μl of serum-free medium containing MTT (0.5 g/l) and incubating at
37°C for 4 h. Next, 150 μl DMSO was added to each well, and all
plates were shaken at room temperature for 10 min. Optical density
(OD) was measured at 490 nm using a spectrophotometer microplate
reader. Cellular proliferation graphs were plotted. Each experiment
was performed in triplicate wells and was repeated at least three
times.
Colony formation assay
Briefly, OVCAR3-shNDRG1 and OVCAR3-shNC cells were
plated in 6-well plates at a density of 1,000 cells/well. After 10
days of incubation in 10% FBS containing 200 μg/ml G418, the cells
were fixed with 4% paraformaldehyde and stained with 1% crystal
violet. Colonies were counted under a light microscope.
Cell migration and invasion assays
Invasion assays were performed using the BD BioCoat™
Matrigel chamber in 24-well plates (BD, USA). Resuspension solution
(100 μl) containing 1.5×10⁵ cells in DMEM with 1% FBS
was added to the upper chamber, and 600 μl DMEM supplemented with
20% FBS was added to the bottom chamber. After a 48-h incubation at
37°C in a 5% CO2 incubator, cells in the upper well were
wiped off using a cotton swab. Cells in the lower chamber were
fixed, stained with H&E, and counted under a light microscope.
The migration assay was performed in a similar manner except that
the chambers were covered without Matrigel.
Wound healing assay
Cells from each group (OVCAR3-shNDRG1 and
OVCAR3-shNC) were seeded into 6-well plates (5×10⁵
cells/well). The confluent monolayer was starved overnight, and
then a single, linear scratch was created using a 20 μl pipette
tip. After wounding, the cells were washed gently with PBS to
remove cell debris and placed in fresh DMEM supplemented with 0.1%
FBS to block cell proliferation. Images were captured using a phase
contrast microscope at ×200 magnification at 0, 24 and 48 h. The
wound size was measured and analyzed using ImagineJ software. Wound
closure was expressed as a percentage of the wound area at 0 h.
Xenograft experiments
Twenty nude mice (Balb/c athymic nude mice), aged
4–6 weeks (weighing ~20 g) were randomly divided into two groups.
OVCAR3 cells were suspended in sterile PBS at a concentration of
5×10⁸ cells/ml, and 100 μl was subcutaneously injected
into one flank of each mouse. Measurements were recorded every
week, and changes in the average tumor volume were noted. After 7
weeks, at which time the average tumor volume reached 200
mm3 in each group, the mice were given intratumoral
injections of 5 μg shNDRG1 or 5 μg shNC in 30 μl PBS every two
days. Growth curves were plotted using average tumor volume of each
experimental group at the set time points. The tumor size was
measured with calipers in two directions, and the tumor volume (V)
was calculated using the formula: V = (length × width)2
× 0.5.
Construction of the NDRG1 mammalian
expression vector pcDNA3.1(+)/NDRG1 and the effect of transient
transfection on cell proliferation and adhesion
The NDRG1 open reading frame was PCR amplified from
OVCAR3 cells. The primer sequences used were: forward primer
(NDRG1) 5′CGAAGCTTATGTCTCGGGAGATGCAG3′ and reverse primer
5′ATCTCGAGCTAGCAGGAGACCTCCAT3′. Real-time PCR was performed using
the following parameters: 98°C for 30 sec, followed by 35 cycles of
98°C for 10 sec, 68°C for 30 sec and 72°C for 90 sec. The final
primer extension at 72°C was performed for 10 min. The PCR product
was then cloned into pcDNA3.1(+) (Invitrogen) using standard
techniques. Either the obtained NDRG1 expression vector
pcDNA3.1(+)/NDRG1 or empty vector pcDNA3.1(+) was transiently
transfected into OVCAR3 cells using Lipofectamine 2000 (Invitrogen)
according to the manufacturer’s instructions. For the cell
proliferation assay, cells were seeded into a 96-well plate
(2×10⁴ cells/well), and positive colonies were selected
with G418 (Invitrogen) supplemented with growth medium. For the
adhesion assay, wells of the 96-well culture plate were coated with
Matrigel (BD Biosciences) at a concentration of 5 μg/well. Cells in
medium containing 0.1% FBS were added to the wells
(2×10⁴/well) and incubated at 37°C for 2 h. After the
unattached cells and medium were removed, normal medium with 10%
FBS was added. The plate was then incubated at 37°C for an
additional 12 h. The number of attached cells was reported as a
percentage of total cells at the end of the incubation period. Each
experiment was performed in triplicate wells and repeated three
times.
Flow cytometry for cell
proliferation
Cells were transfected with control or NDRG1
expression vectors. They were then trypsinized, centrifuged at
1,000 rpm, and resuspended in 0.5 ml PBS (1X). To fix the cells,
0.5 ml 100% cold ethanol was added to each sample and incubated for
20 min. After centrifugation at 1,000 rpm for 5 min, ethanol was
decanted. According to the manufacturer’s instructions, the cells
were incubated in the dark in 0.5 ml propidium iodide (PI) with
RNase A for 30 min at 4°C. Results were analyzed by flow cytometry.
Experiments were repeated three times.
Apoptosis assay
Annexin V-FITC apoptosis detection kit (Abcam) was
used according to the manufacturer’s instructions. Approximately
5×10⁵ cells were collected, washed twice with cold PBS,
and resuspended in 500 μl of 1X binding buffer. Both 5 μl Annexin
V-FITC and 5 μl PI were added, and samples were incubated in the
dark at room temperature for 15 min. Apoptosis was evaluated by
flow cytometry (LSR II; Becton-Dickinson, USA). The percentage of
apoptotic cells was calculated using software FCS 3.0.
Statistical analysis
Statistical analysis was carried out using SPSS 16.0
for Windows. The two-tailed Student’s t-test was used for analyzing
continuous variables. P<0.05 was considered to indicate a
statistically significant result.
Results
NDRG1 is expressed in the OC cell
lines
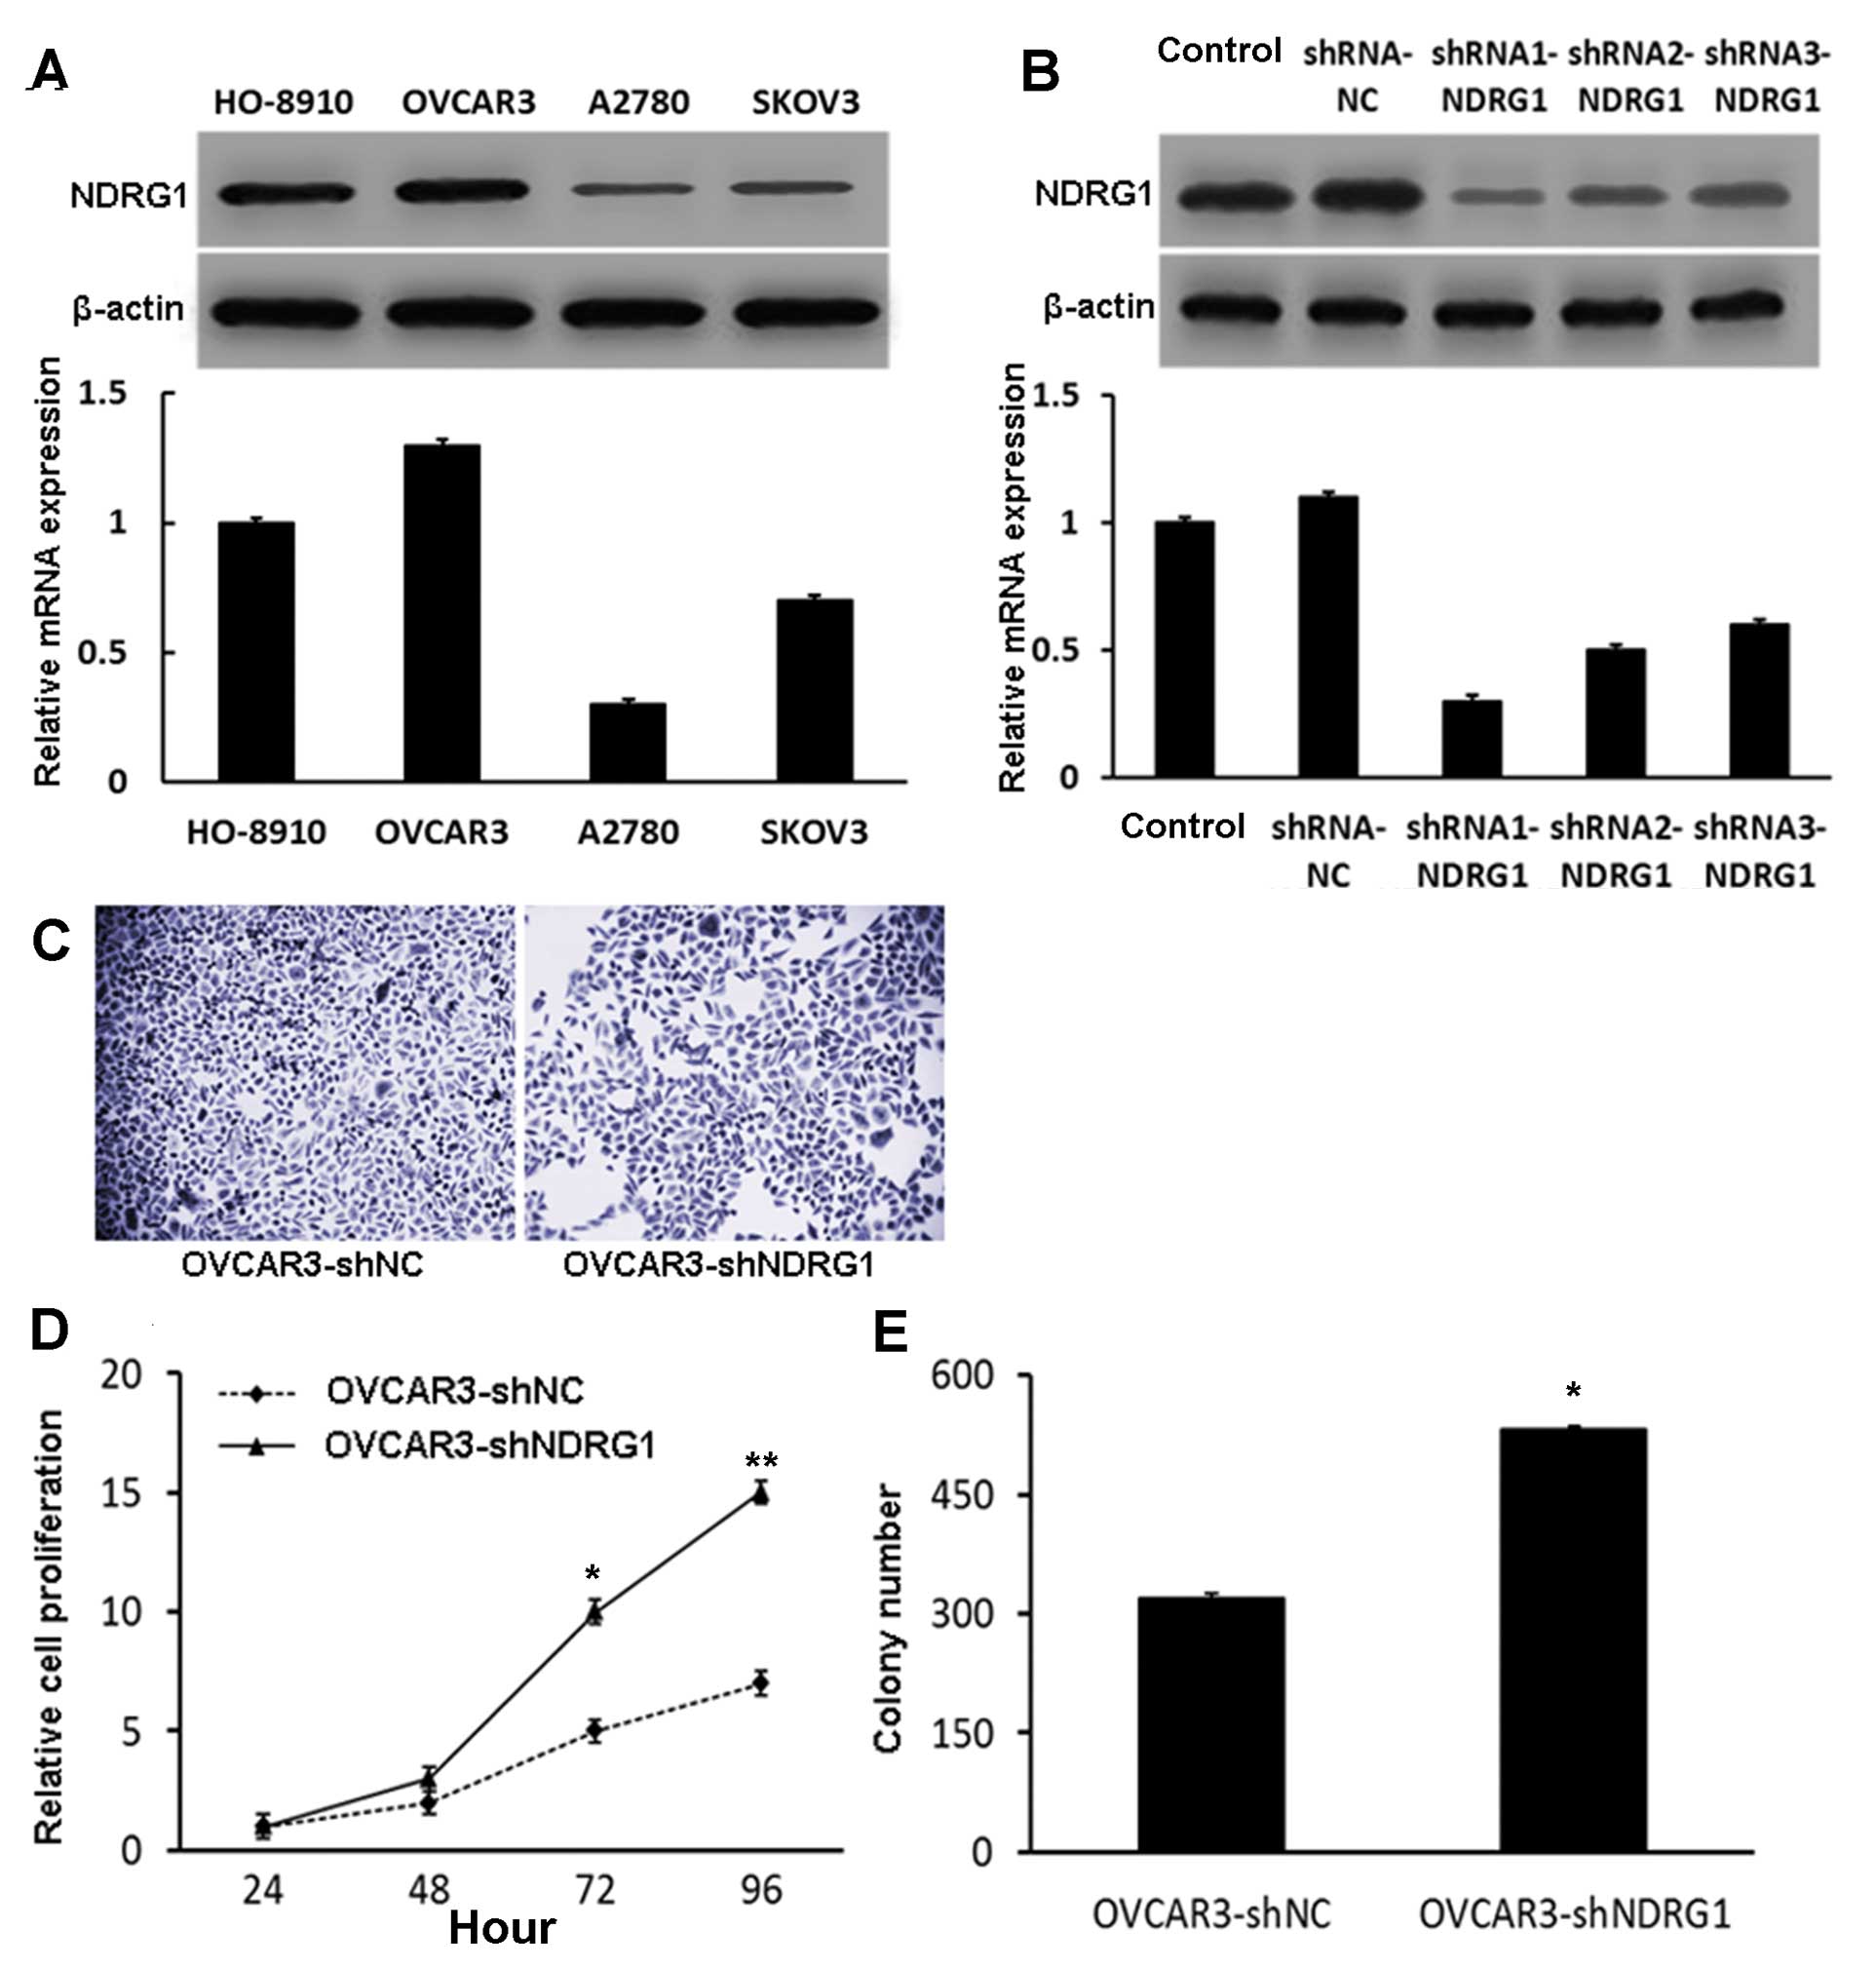
We examined NDRG1 expression by quantitative
real-time RT-PCR and western blot analysis in four well-established
OC cell lines. NDRG1 mRNA and protein were expressed at relatively
high levels in both the OVCAR3 and HO-8910 cells; they were
significantly lower in the SKOV3 and A2780 cells (Fig. 1A). We selected OVCAR3 cells for
subsequent knockdown experiments as this line expressed the highest
levels of endogenous NDRG1 in the four cell lines examined.
Depletion of NDRG1 in OVCAR3 cells
enhances proliferation
Three shRNA-NDRG1 expression vectors (shRNA1-NDRG1,
shRNA2-NDRG1 and shRNA3-NDRG1) were transfected into OVCAR3 cells
and the effects on biological processes were analyzed; transfection
of an empty shRNA-NC vector served as a control. Depletion of NDRG1
at both the mRNA and protein levels was verified by both
quantitative real-time RT-PCR and western blotting, respectively.
NDRG1 expression was most significantly reduced by shRNA1-NDRG1
(Fig. 1B). Therefore, we chose to
use shRNA1-NDRG1 for all subsequent experiments. We also generated
a stable cell line (OVCAR3-shNDRG1) using this construct. Depletion
of NDRG1 did not induce any observable morphological changes in the
OVCAR3 cells (Fig. 1C).
OVCAR3-shNDRG1 cells displayed enhanced growth
compared to OVCAR3-shNC cells at 72 h by MTT assay (P<0.05)
(Fig. 1D). Consistent with this,
OVCAR3-shNDRG1 cells formed more colonies than their OVCAR3-shNC
counterparts (P<0.05) (Fig. 1E).
These data indicate that NDRG1 plays a growth inhibitory role in
OC.
Cell migration and invasion are enhanced
following NDRG1 depletion
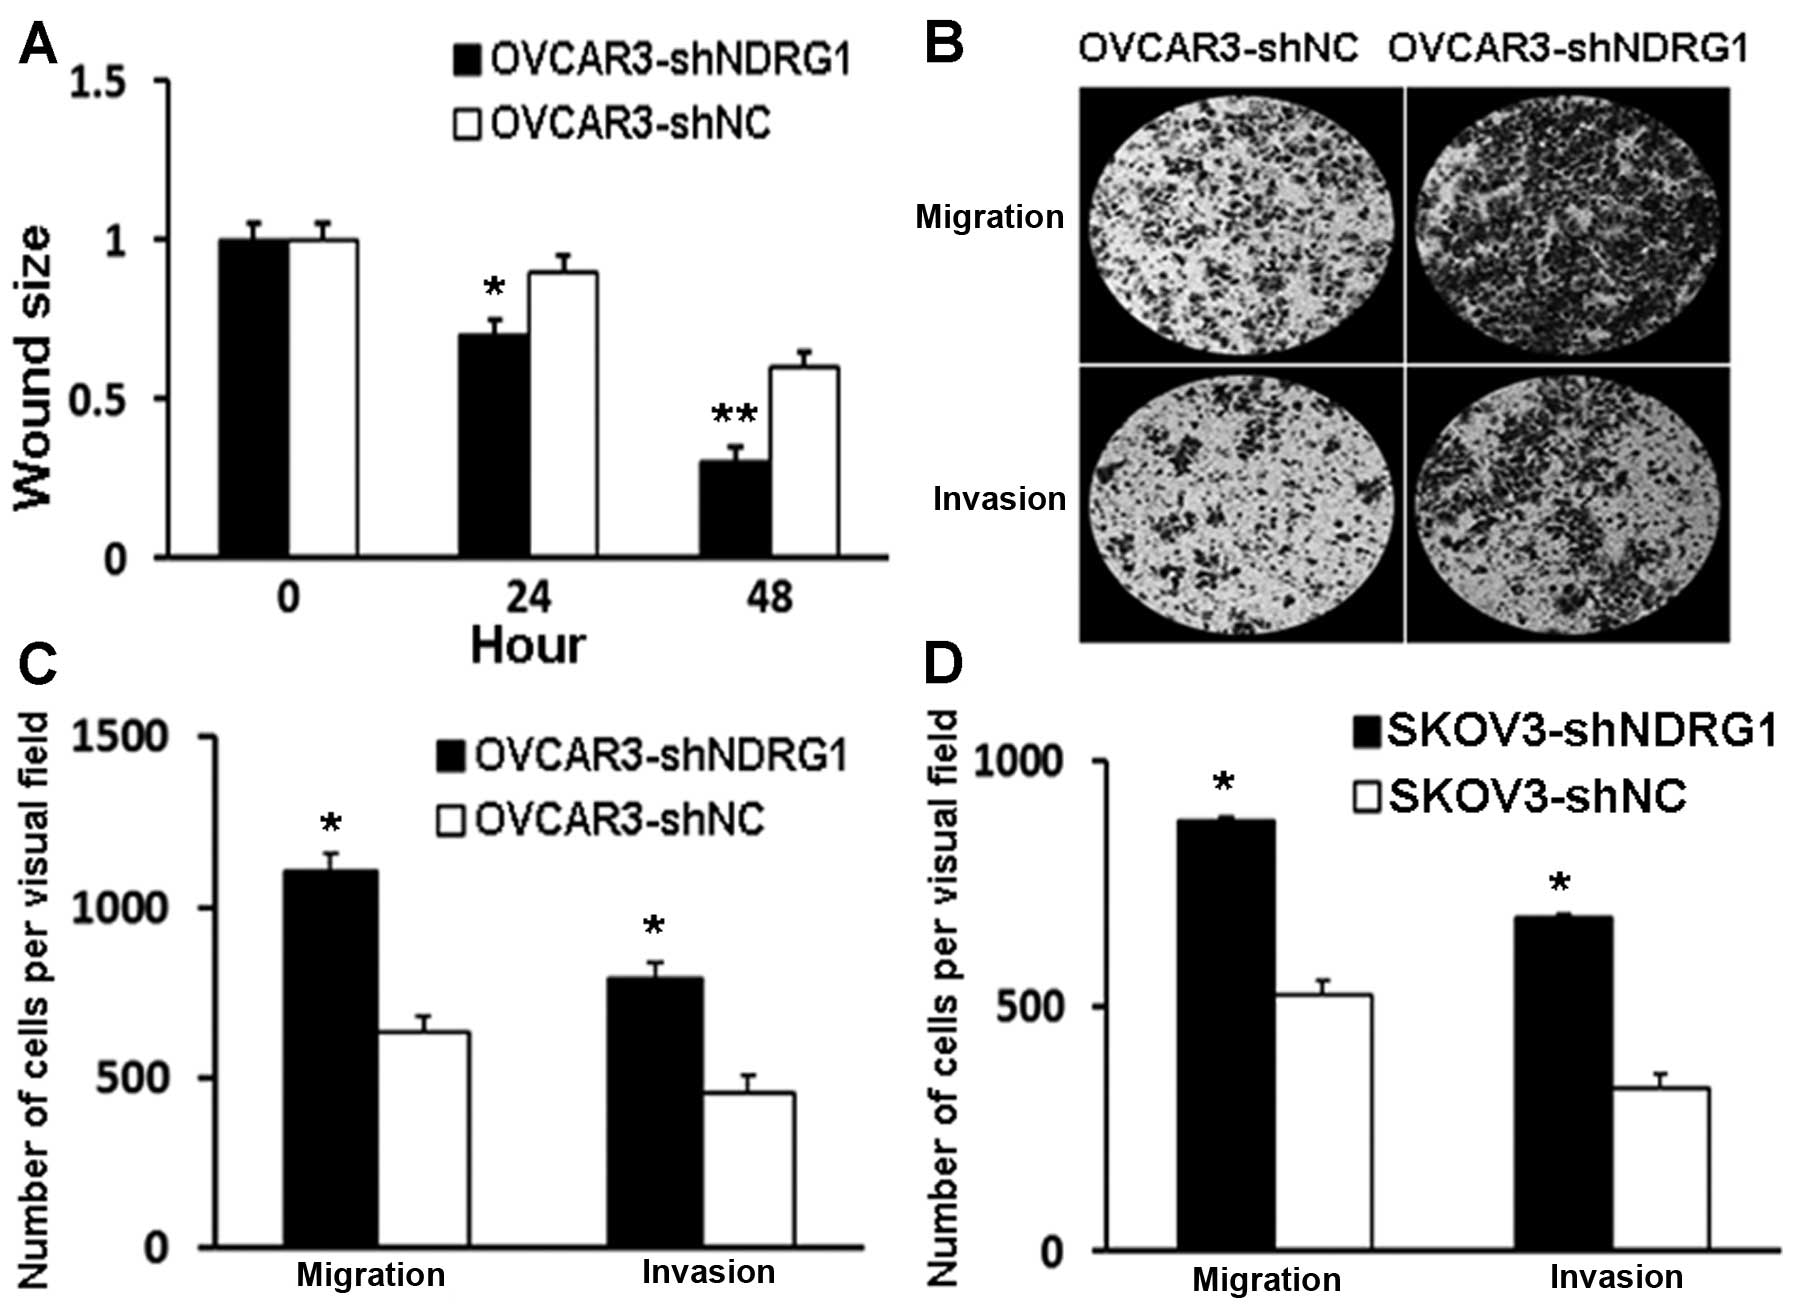
Previous studies have shown that NDRG1 likely plays
a role in cancer metastasis (9,15).
Here, we examined whether suppression of NDRG1 influences OVCAR3
cell migration and invasion. We performed wound healing assays to
assess the effects on cell migration. Wound sizes in the
OVCAR3-shNDRG1 cell group were significantly smaller than those in
the OVCAR3-shNC group at both 24 and 48 h (P<0.05) (Fig. 2A). These data suggest that the
NDRG1-depleted cells migrated faster than the control cells. These
findings were complemented by data obtained from a Transwell assay.
Significantly more OVCAR3-shNDRG1 cells migrated and invaded
through the Transwell inserts compared to the OVCAR3-shNC control
cells (P<0.05) (Fig. 2B and C).
We also examined cell migration and invasion in another OC cell
line, SKOV3. Similarly to what we found in OVCAR3 cells, NDRG1
knockdown in SKOV3 cells also resulted in enhanced migration and
invasion (Fig. 2D). These data
collectively indicate that suppression of NDRG1 promotes migration
and invasion of OC cells in vitro.
Suppression of NDRG1 promotes tumor
progression in a xenograft model
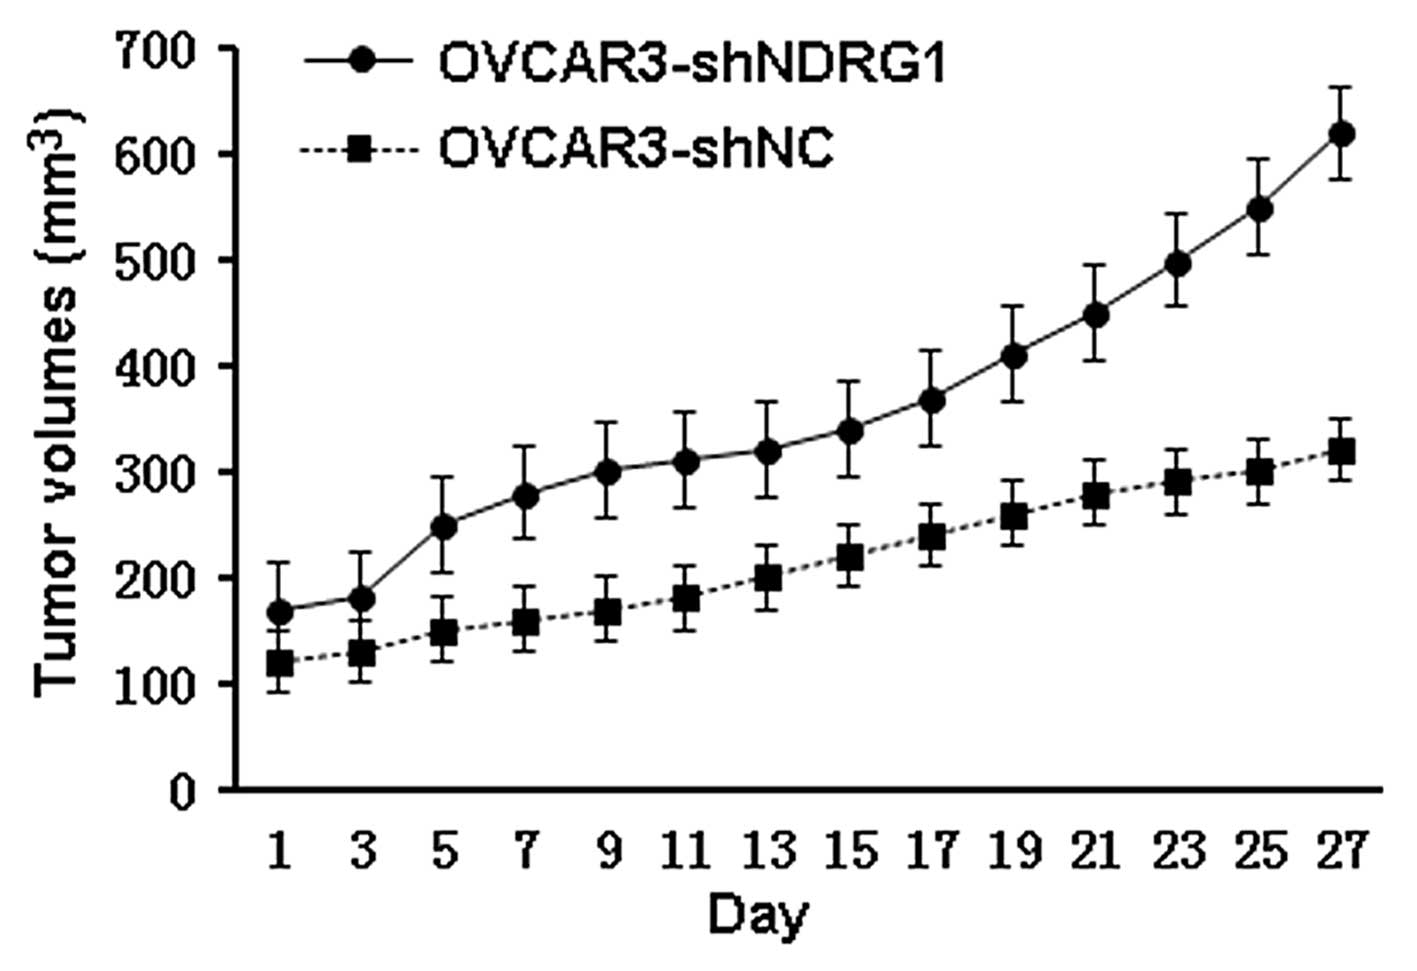
We next studied whether NDRG1 knockdown showed
similar effects in vivo by using an OVCAR3 xenograft model
in nude mice. Mice received intratumoral injections of
OVCAR3-shNDRG1 (n=10) or OVCAR3-shNC (n=10) every two days. All
mice in the OVCAR3-shNDRG1 group had significantly larger tumors
than those in the OVCAR3-shNC group (P<0.05 from day 5 onwards;
P<0.01 from day 13 onwards) (Fig.
3).
Overexpression of NDRG1 suppresses tumor
cell proliferation and adhesion
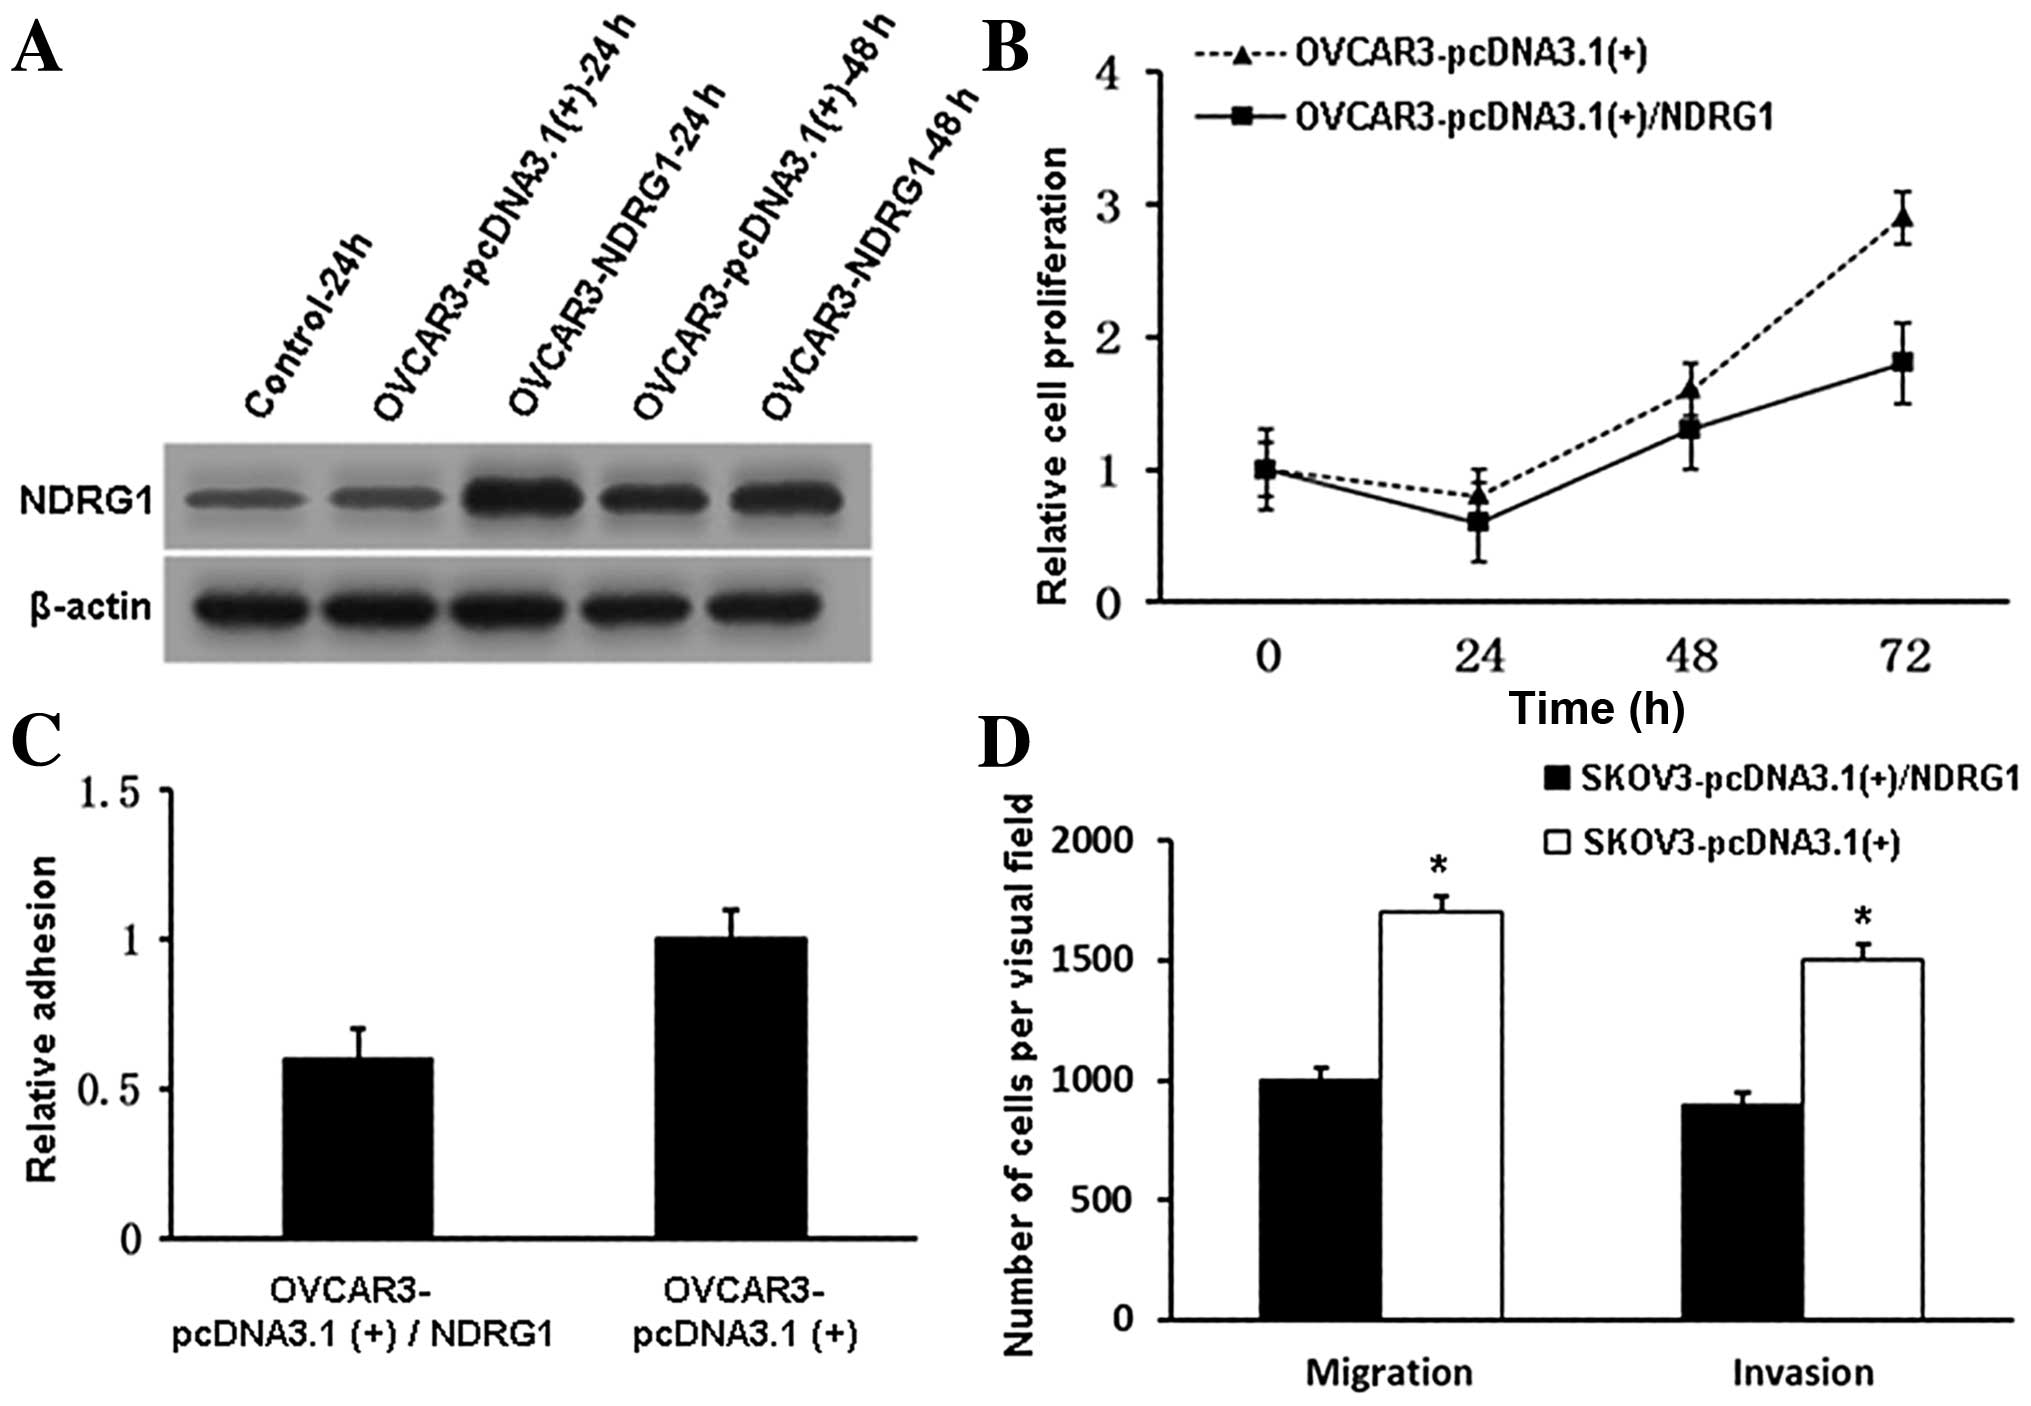
Overexpression of NDRG1 in OVCAR3 cells
significantly inhibited both cell proliferation (Fig. 4A and B) (P<0.05 at 48 h) and
tumor cell adhesion (Fig. 4C)
(P<0.05 at 48 h). We also induced NDRG1 overexpression in SKOV3
cells and found that this overexpression inhibited cell migration
and invasion (Fig. 4D). These
findings are consistent with our NDRG1 knockdown results. Taken
together, the data showed that NDRG1 plays a growth suppressive and
metastatic inhibitory role in OC.
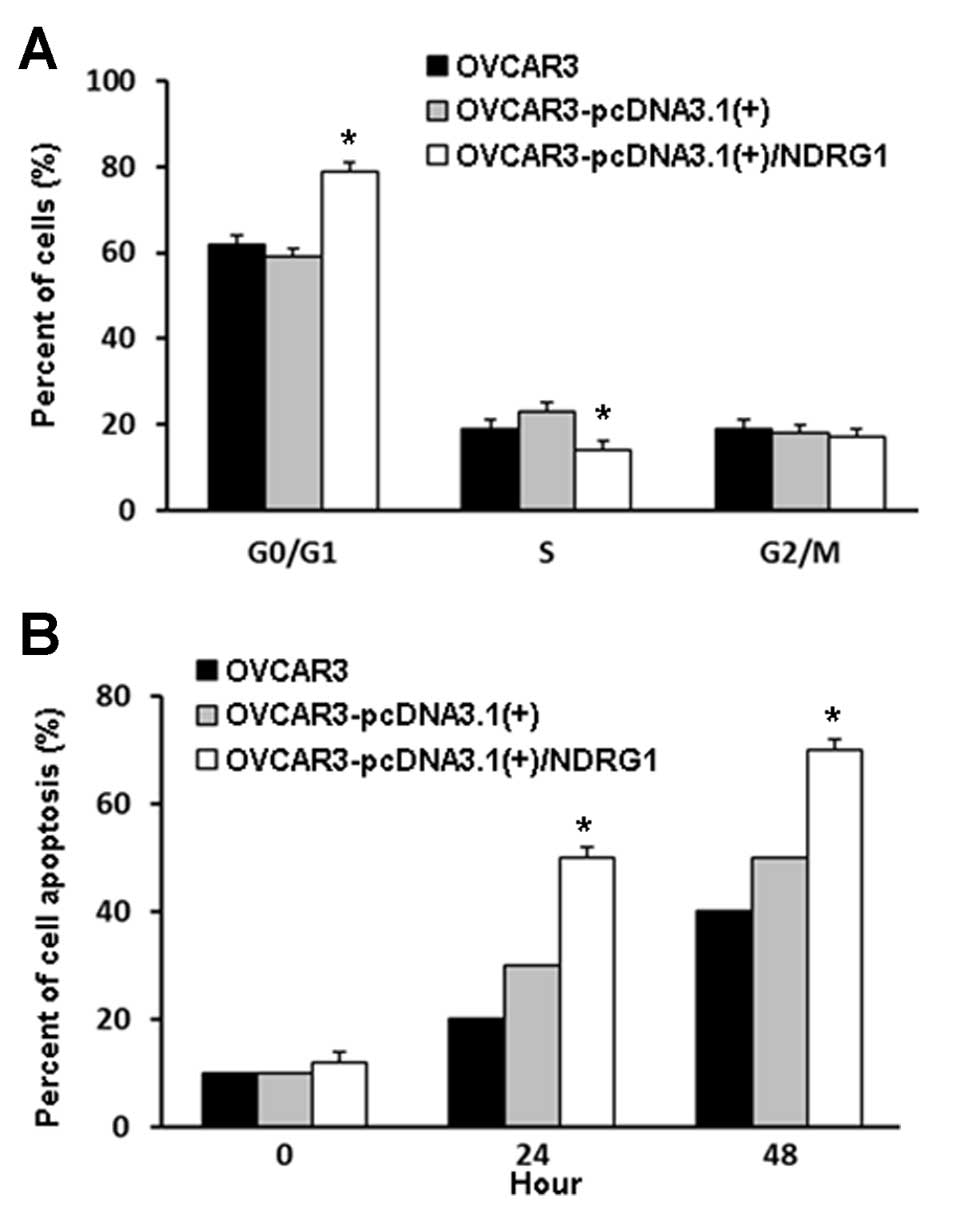
Analysis of the cell cycle and apoptosis
in NDRG1-overexpressing OVCAR3 cells
Cell cycle analysis showed that, compared to the
control cells, NDRG1-overexpressing OVCAR3 cells displayed a
significant increase in the percentage of cells in the G0/G1 phase
(P<0.05), accompanied by a decrease in the percentage of cells
in the S phase (P<0.05); there was no significant difference in
the proportion of cells in the G2/M phase between the two groups
(Fig. 5A).
Flow cytometry showed that apoptosis was increased
in OVCAR3 cells transfected with pcDNA3.1(+)/NDRG1 when compared to
control cells transfected with the empty vector (P<0.05)
(Fig. 5B).
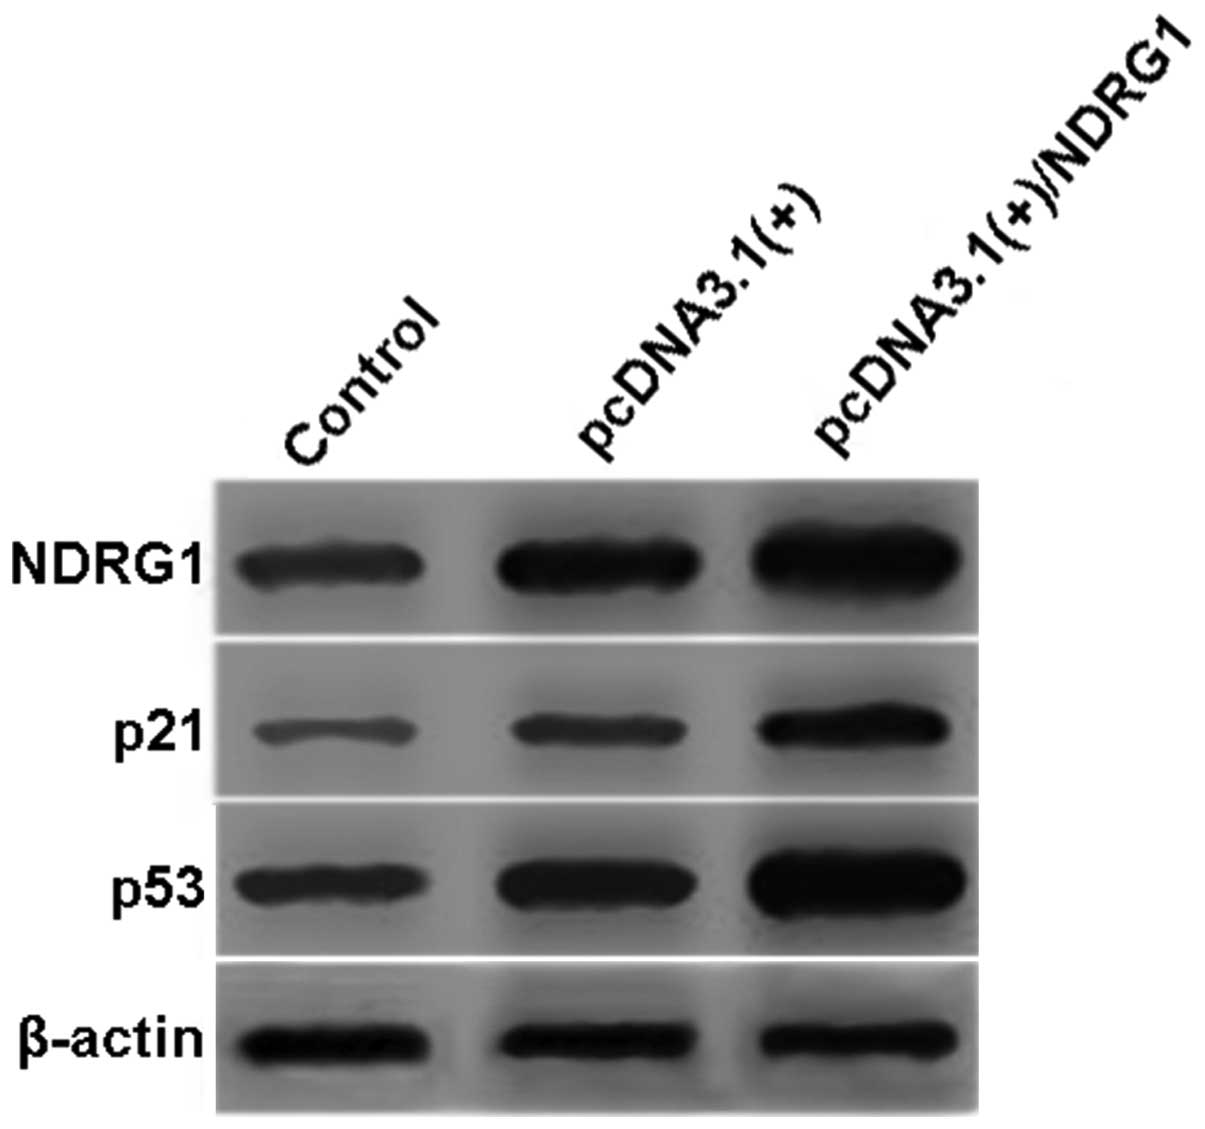
Overexpression of NDRG1 increases
expression of p21 and p53
To assess downstream changes, we examined protein
expression of NDRG1, p21 and p53 by western blotting following
overexpression of NDRG1 in OVCAR3 cells. Both p21 and p53 were
significantly increased in the pcDNA3.1(+)/NDRG1-transfected cells
when compared to the control cells (P<0.01) (Fig. 6).
Discussion
NDRG1 has been shown to play a role both in normal
biological processes, such as cell differentiation (20) and disease pathogenesis, including
hereditary motor and sensory neuropathy Lom (HMSNL) (21) and carcinogenesis (22). Importantly, functional studies in
tumor cells have yielded conflicting results concerning the role of
NDRG1 in modulating tumor growth and metastasis. Most current
reports indicate that it functions as a tumor suppressor in a
number of cancers, including breast (9), prostate (10–12),
pancreatic (7,8,13),
cervical and endometrial cancer (14,23).
However, in other types of tumors, for example, hepatocellular
carcinoma, NDRG1 may actually have a growth-promoting role
(17,18).
Knockdown of NDRG1 significantly enhanced cell
proliferation, colony formation, migration, invasion and
differentiation in most in vitro cell line studies. These
include studies in pancreatic (8),
cervical (24), prostate (11), lung (11), gastric (25) and colon cancer (15,26).
Consistent with this, finding, overexpression of NDRG1 has been
shown to inhibit proliferation, migration, invasion and
differentiation (7,26,27).
In the present study, we used a combination of
shRNA-mediated knockdown and overexpression to examine the function
of NDRG1 in OC both in vitro and in vivo. We found
that depletion of NDRG1 in OVCAR3 cells promoted xenograft growth
in nude mice. These findings are in line with overexpression
studies that found decreased xenograft growth when NDRG1 levels
were increased (7,26,28).
Additionally, we found that knockdown of NDRG1 significantly
enhanced cell proliferation, colony formation, migration and
invasion of OVCAR3 cells. Furthermore, overexpression of NDRG1 in
OVCAR3 cells significantly inhibited their proliferation, adhesion
and progression through cell cycle arrest and apoptosis. Our
findings in OVCAR3 cells were supported by similar data obtained in
SKOV3 cells (as presented in this study) as well as in HO8910-PM
cells (14). Taken together, these
data suggest that NDRG1 functions as a tumor suppressor in OC.
However, its exact role in this disease clearly requires further
investigation.
We also showed that p21 and p53 were induced
following NDRG1 overexpression. These data suggest that p21
transcription may be increased in a p53- and NDRG1-dependent manner
in OVCAR3 cells. Recent reports have shown that mutant p53 can
retain the ability to transactivate p21 (29,30),
which is in contrast to previous reports showing that only
wild-type p53 induces p21 expression (31,32).
Importantly, p21 expression does not necessarily reflect the status
of p53 in these cells.
In conclusion, we showed that NDRG1 suppresses OC
cell growth and migration. It may also suppress the metastasis of
OC, and further clinical investigation of its role in human tumors
is warranted.
References
|
1
|
American Cancer Society. Cancer Facts and
Figures. Atlanta, GA: American Cancer Society; 2009, http://www.cancer.org/research/cancerfactsstatistics/cancerfactsfigures2009/index.
|
|
2
|
Mandić A, Tešić M, Vujkov T, Novta N and
Rajović J: Ovarian cancer stage III/IV: poor prognostic factors.
Arch Oncol. 9:13–16. 2001.
|
|
3
|
Li Z, Zhao X, Yang J and Wei Y: Proteomics
profile changes in cisplatin-treated human ovarian cancer cell
strain. Sci China C Life Sci. 48:648–657. 2005. View Article : Google Scholar : PubMed/NCBI
|
|
4
|
De Marco C, Rinaldo N, Bruni P, et al:
Multiple genetic alterations within the PI3K pathway are
responsible for AKT activation in patients with ovarian carcinoma.
PLoS One. 8:e553622013.PubMed/NCBI
|
|
5
|
Okuda T and Kondoh H: Identification of
new genes Ndr2 and Ndr3 which are related to
Ndr1/RTP/Drg1 but show distinct tissue specificity and
response to N-myc. Biochem Biophys Res Commun. 266:208–215.
1999.
|
|
6
|
Zhou D, Salnikow K and Costa M:
Cap43, a novel gene specifically induced by Ni2+
compounds. Cancer Res. 58:2182–2189. 1998.
|
|
7
|
Angst E, Dawson DW, Stroka D, et al: N-myc
downstream regulated gene-1 expression correlates with reduced
pancreatic cancer growth and increased apoptosis in vitro and in
vivo. Surgery. 149:614–624. 2011. View Article : Google Scholar : PubMed/NCBI
|
|
8
|
Maruyama Y, Ono M, Kawahara A, et al:
Tumor growth suppression in pancreatic cancer by a putative
metastasis suppressor gene Cap43/NDRG1/Drg-1 through
modulation of angiogenesis. Cancer Res. 66:6233–6242. 2006.
View Article : Google Scholar : PubMed/NCBI
|
|
9
|
Bandyopadhyay S, Pai SK, Hirota S, et al:
Role of the putative tumor metastasis suppressor gene Drg-1 in
breast cancer progression. Oncogene. 23:5675–5681. 2004. View Article : Google Scholar : PubMed/NCBI
|
|
10
|
Bandyopadhyay S, Pai SK, Gross SC, et al:
The Drg-1 gene suppresses tumor metastasis in prostate
cancer. Cancer Res. 63:1731–1736. 2003.
|
|
11
|
Kovacevic Z, Sivagurunathan S, Mangs H,
Chikhani S, Zhang D and Richardson DR: The metastasis suppressor,
N-myc downstream regulated gene 1 (NDRG1), upregulates p21 via
p53-independent mechanisms. Carcinogenesis. 32:732–740. 2011.
View Article : Google Scholar : PubMed/NCBI
|
|
12
|
Liu W, Iiizumi-Gairani M, Okuda H, et al:
KAI1 gene is engaged in NDRG1 gene-mediated
metastasis suppression through the ATF3-NFκB complex in human
prostate cancer. J Biol Chem. 286:18949–18959. 2011. View Article : Google Scholar
|
|
13
|
Hosoi F, Izumi H, Kawahara A, et al: N-myc
downstream regulated gene 1/Cap43 suppresses tumor growth and
angiogenesis of pancreatic cancer through attenuation of inhibitor
of κB kinase β expression. Cancer Res. 69:4983–4991.
2009.PubMed/NCBI
|
|
14
|
Zhao G, Chen J, Deng Y, et al:
Identification of NDRG1-regulated genes associated with invasive
potential in cervical and ovarian cancer cells. Biochem Biophys Res
Commun. 408:154–159. 2011. View Article : Google Scholar : PubMed/NCBI
|
|
15
|
Li Q and Chen H: Transcriptional silencing
of N-Myc downstream-regulated gene 1 (NDRG1) in metastatic colon
cancer cell line SW620. Clin Exp Metastasis. 28:127–135. 2011.
View Article : Google Scholar : PubMed/NCBI
|
|
16
|
Jiang K, Shen Z, Ye Y, Yang X and Wang S:
A novel molecular marker for early detection and evaluating
prognosis of gastric cancer: N-myc downstream regulated gene-1
(NDRG1). Scand J Gastroenterol. 45:898–908. 2010. View Article : Google Scholar : PubMed/NCBI
|
|
17
|
Yan X, Chua MS, Sun H and So S: N-Myc
down-regulated gene 1 mediates proliferation, invasion, and
apoptosis of hepatocellular carcinoma cells. Cancer Lett.
262:133–142. 2008. View Article : Google Scholar : PubMed/NCBI
|
|
18
|
Cheng J, Xie HY, Xu X, et al: NDRG1 as a
biomarker for metastasis, recurrence and of poor prognosis in
hepatocellular carcinoma. Cancer Lett. 310:35–45. 2011. View Article : Google Scholar : PubMed/NCBI
|
|
19
|
Zou H, Wang D, Gan X, et al: Low TWEAK
expression is correlated to the progression of squamous cervical
carcinoma. Gynecol Oncol. 123:123–128. 2011. View Article : Google Scholar : PubMed/NCBI
|
|
20
|
Chen S, Han YH, Zheng Y, et al: NDRG1
contributes to retinoic acid-induced differentiation of leukemic
cells. Leuk Res. 33:1108–1113. 2009. View Article : Google Scholar : PubMed/NCBI
|
|
21
|
Kalaydjieva L, Gresham D, Gooding R, et
al: N-myc downstream-regulated gene 1 is mutated in
hereditary motor and sensory neuropathy-Lom. Am J Hum Genet.
67:47–58. 2000. View
Article : Google Scholar
|
|
22
|
Kovacevic Z and Richardson DR: The
metastasis suppressor, Ndrg-1: a new ally in the fight against
cancer. Carcinogenesis. 27:2355–2366. 2006. View Article : Google Scholar : PubMed/NCBI
|
|
23
|
Lv XH, Chen JW, Zhao G, et al: N-myc
downstream-regulated gene 1/Cap43 may function as tumor suppressor
in endometrial cancer. J Cancer Res Clin Oncol. 138:1703–1715.
2012. View Article : Google Scholar : PubMed/NCBI
|
|
24
|
Wang J, Cai J, Li Z, et al: Expression and
biological function of N-myc down-regulated gene 1 in human
cervical cancer. J Huazhong Univ Sci Technolog Med Sci. 30:771–776.
2010. View Article : Google Scholar : PubMed/NCBI
|
|
25
|
Liu YL, Bai WT, Luo W, et al:
Downregulation of NDRG1 promotes invasion of human gastric cancer
AGS cells through MMP-2. Tumour Biol. 32:99–105. 2011. View Article : Google Scholar : PubMed/NCBI
|
|
26
|
Fotovati A, Abu-Ali S, Kage M, Shirouzu K,
Yamana H and Kuwano M: N-myc downstream-regulated gene 1 (NDRG1) a
differentiation marker of human breast cancer. Pathol Oncol Res.
17:525–533. 2011. View Article : Google Scholar : PubMed/NCBI
|
|
27
|
Tsui KH, Chang YL, Feng TH, Chang PL and
Juang HH: Glycoprotein transmembrane nmb: an androgen-downregulated
gene attenuates cell invasion and tumorigenesis in prostate
carcinoma cells. Prostate. 72:1431–1442. 2012. View Article : Google Scholar : PubMed/NCBI
|
|
28
|
Akiba J, Murakami Y, Noda M, et al: N-myc
downstream regulated gene1/Cap43 overexpression suppresses tumor
growth by hepatic cancer cells through cell cycle arrest at the
G0/G1 phase. Cancer Lett. 310:25–34. 2011.
View Article : Google Scholar : PubMed/NCBI
|
|
29
|
Gurova KV, Rokhlin OW, Budanov AV, et al:
Cooperation of two mutant p53 alleles contributes to Fas
resistance of prostate carcinoma cells. Cancer Res. 63:2905–2912.
2003.PubMed/NCBI
|
|
30
|
Campomenosi P, Monti P, Aprile A, et al:
p53 mutants can often transactivate promoters containing a
p21 but not Bax or PIG3 responsive elements.
Oncogene. 20:3573–3579. 2001. View Article : Google Scholar : PubMed/NCBI
|
|
31
|
el-Deiry WS, Harper JW, O’Connor PM, et
al: WAF1/CIP1 is induced in p53-mediated
G1 arrest and apoptosis. Cancer Res. 54:1169–1174.
1994.
|
|
32
|
Elbendary AA, Cirisano FD, Evans AC Jr, et
al: Relationship between p21 expression and mutation of the p53
tumor suppressor gene in normal and malignant ovarian epithelial
cells. Clin Cancer Res. 2:1571–1575. 1996.PubMed/NCBI
|