Introduction
Gastric cancer (GC) has become a significant health
problem globally, with a total of 989,600 new cases and 738,000
deaths estimated to have occurred in 2008, accounting for 8% of the
total cases and 10% of all cancer-related deaths, respectively
(1). The geographical distribution
of GC exhibits wide international variation and >70% of new
cases and deaths occur in developing countries, including 42% in
China (2).
Secreted protein acidic and rich in cysteine (SPARC)
is a multi-faceted secreted glycoprotein, which is abnormally
expressed by different types of cancer. SPARC is silenced in many
types of cancer cells, but stromal fibroblasts adjacent to the
tumors frequently express SPARC. The role of SPARC is complicated
and appears to depend on diverse given microenvironments. In
certain types of cancer, such as melanoma, SPARC is associated with
a highly aggressive tumor phenotype. However, SPARC seemed to
function as a tumor suppressor, since hyper-methylation and loss of
SPARC gene expression had been detected in lung, ovarian,
pancreatic, colorectal and breast cancer (3). Colon cancer patients with low or
absent expressing SPARC had significantly poorer overall and
disease-free survival. SPARC expression was significantly different
in colon cancers with lymph node metastasis and differentiation
degree of tumor (4). Moreover, the
clonogenic and migratory capabilities were largely decreased in
SPARC-overexpressing hepatocellular carcinoma cells (5). Our previous studies showed that
endogenous SPARC inhibited the malignant phenotype in pancreatic
cancer (6). In GC, we found
endogenous SPARC inhibited the angiogenesis by suppressing
expression of vascular endothelial growth factor (VEGF) and MMP-7
(7). Increased SPARC expression is
associated with a better prognosis of these tumors (3,8,9).
Previous studies showed that SPARC antagonized the effect of bFGF
on the migration of aortic endothelial cells (10), and inhibited the proliferation and
migration of aortic endothelial cells (11). Mechanisms of SPARC action were also
examined in SPARC wild-type and SPARC knockout mice injected with
ovarian cancer cells. Wild-type mice had lower levels of matrix
metalloproteinases (MMPs) and VEGF (12).
Acquisition of metastatic phenotype of cancer cells
consists of multiple steps including epithelial mesenchymal
transition (EMT). Changes in cadherin expression patterns may play
a role in the process of EMT and cellular motility. Non-epithelial
cadherin, including N-cadherin, was found to induce a
mesenchymal-scattered phenotype associated with reduced E- cadherin
in tumors. The MMP family of enzymes contributes to both normal and
pathological tissue remodeling. It is believed that MMP expression
is highly correlated with invasion, metastasis and angiogenesis of
GC.
Previous immunohistochemistry (IHC) studies showed
that normal gastric mucosa tissues expressed low level of SPARC. In
GC tissues, SPARC expression disappeared in cancer cells but
localized in stromal cells surrounding the cancer (13,14).
However, the relationship between SPARC expression and
clinicopathological factors of GCs is controversial. Therefore, in
the present study, we examined the correlation between SPARC and
clinicopathological factors. Secondly, we assessed the effect of
SPARC overexpression on the growth and clonogenicity of GC cells.
In addition, the purpose of the present study was to investigate
whether SPARC overexpression is involved in the process of
metastasis via EMT.
Materials and methods
Antibodies and reagents
Antibodies against SPARC (Cell Signaling Technology,
Danvers, MA, USA) were used for western blotting (WB) and IHC.
E-cadherin, N-cadherin, Sp1, (p-)ERK1/2, p21, cyclin-D1 (Cell
Signaling Technology), (p)-VEGFR2 (Abcam, Cambridge, MA, USA) were
used for WB. CD44 (Cell Signaling Technology) was used in flow
cytometry (FCM). All other reagents were of analytical grade or
better.
Surgical samples
Between 2004 and 2008, a total of 65 patients with
GC participated in this study. Fresh samples of both tumor tissue
and adjacent normal mucosa were obtained and fixed in formalin
immediately after surgery. All the non-cancerous tissues were
obtained at a distance of >5 cm from GCs. The research was
approved by the Institutional Review Board of Peking University
First Hospital and informed consent was obtained from all
patients.
Immunohistochemistry
Sections (4 μm) from the paraffin-embedded,
formalin-fixed GC tissues were fixed on the charged slides for
immunohistochemical analysis using non-biotin detection system
(GTVision III Anti-Mouse/Rabbit-HRP; Gene Tech). Primary rabbit
monoclonal antibodies to SPARC (1:200) were used in the present
study. All slides were deparaffinized with xylene and rehydrated
through graded concentrations of ethanol ending with distilled
water. Then, endogenous peroxidase was blocked by 0.3%
H2O2 for 30 min. Sections for SPARC were
subjected to microwave antigen retrieval with 0.1 M EDTA buffer (pH
8.0) at 95°C for 15 min, and were then incubated with primary
antibodies overnight at 4°C, followed by GTVision detection
incubated for 30 min at 37°C. The staining was visualized by
incubating with DAB for 5 min, then counter-stained with
hematoxylin. Sections of known positive specimens were used as
positive controls. Sections incubated with phosphate-buffered
saline (PBS) instead of primary antibody were used as negative
controls. The intensity of immunostaining for SPARC was reviewed
and scored according to the location of cytoplasm. The results were
presented by two independent pathologists without knowledge of the
clinicopathological parameters of the patients. The proportion of
cells with SPARC expression was rated as follows: 0 point, ≤5%
positive cells; 1 point, 6–25% positive cells; 2 points, 26–50%
positive cells; 3 points, ≥51% positive cells. The intensity of
staining varied from weak to strong. The intensity was classified
as a scale of 0 (no staining); 1 (weak staining, light yellow); 2
(moderate staining, yellowish brown) and 3 (strong staining,
brown). Staining index was calculated as the product of staining
intensity score and the proportion of positive cells. We obtained
the staining index with scores of 0, 1, 2, 3, 4, 6 or 9; a staining
index score ≥4 was used to define cells with high SPARC expression,
and a staining index score ≤3 was used to indicate low SPARC
expression (14).
Cell culture
Human GC cell lines BGC-823, SGC-7901 were obtained
from the Cancer Institute of the Chinese Academy of Medical
Science. BGC-P (parental BGC-823), SGC-P (parental SGC-7901) cells
were grown in complete RPMI-1640. BGC-EV (transfected with empty
vector), BGC-SP (overexpressing SPARC cDNA); SGC-EV (transfected
with empty vector) and SGC-SP (overexpressing SPARC cDNA) cells
were grown in complete RPMI-1640 with G418 (50 μg/ml). All cells
were maintained in monolayer cultures at 37°C in humidified air
with 5% CO2.
Establishment of BGC-SP, SGC-SP
clones
Briefly, ~150,000 BGC-823 or SGC-7901 cells were
plated per well in a 6-well plate and allowed to attach overnight.
Equimolar amounts of pcDNA3.1 with full length SPARC cDNA vector or
the empty vector were incubated with Lipofectamine 2000
transfection reagent (both from Invitrogen, San Diego, CA, USA)
(7). Transfected cells were
selected with G418 (100 μg/ml for BGC-SP and SGC-SP clones) for 14
days before the isolation of individual clones.
Western blotting
Total cell lysates were prepared and analyzed by WB
as previously described (6,7). Protein expression in cell lysates were
normalized by the housekeeping protein GAPDH.
Cell proliferation assay
Cell proliferation was determined by an MTS assay
(Promega, Madison, WI, USA). Briefly, cells were incubated per well
in 100 μl media using 96-well plates and incubated. At different
time points, 20 μl MTS was added to the cells. Absorbance values at
490 nm were measured.
Cell cycle analysis by FCM analysis
The allocation of cells in the cell cycle phases was
determined using FCM analysis of DNA content. Cells were collected
and fixed in 70% ethanol, and stained with propidium iodide for 30
min and analyzed for DNA content by using FCM (Becton-Dickinson,
San Jose, CA, USA).
Matrigel colony assay
GC cells were infected with either SPARC cDNA or
empty vectors and parental cells were grown on Matrigel-coated (200
μl at 11.5 mg/ml) 14 mm microwell for 14 days, and then colonies
were monitored using phase-contrast light microscope. Five fields
per sample were captured using a digital camera. The number of the
colonies was assessed using ImageJ software. This experiment was
repeated thrice.
CD44 FCM
For FCM analysis, cells grown for 48 h were washed
and detached with 1.25 mM EDTA in PBS. After washing with ice-cold
medium, cells were incubated with a monoclonal CD44 antibody for 30
min, washed twice with PBS 0.1% BSA. After washings, samples were
incubated for 30 min with a secondary goat FITC-conjugated
anti-rabbit antibody at room temperature. Cells were washed,
resuspended in PBS and subjected to FCM. This experiment was
repeated thrice.
Cell invasion and migration assays
To detect cell invasion, a 24-well Transwell plate
consisting of Boyden chambers with pre-coated Matrigel membrane
filter was used (pore size, 8 μm). RPMI (500 μl) containing 10% FBS
was added to the lower chamber and 1×10⁴ cells in 200 μl
of serum-free RPMI were plated into the upper chamber. The chamber
was incubated for 36 h at 37°C. Then, the upper surface of the
filters was removed and the invaded cells were fixed with 4%
paraformaldehyde and stained with 0.1% crystal violet. The number
of invaded cells was quantified by counting five random fields per
filter. To detect cell migration, a 24-well Transwell plate
(Matrigel-uncoated) was used and the procedure was the same as for
the cell invasion assay. Both assays were performed in
triplicate.
Nude mice models
The studies were performed in accordance with a
protocol approved by the Animal Care and Use Committee of Peking
University (ethical application approval no. J201155). The athymic
nude mice were randomized to different groups (n=6/group). Lung
metastasis mouse models were established by tail vein injection
with human BGC-P, BGC-EV, BGC-SP cells (5×10⁵
cells/mouse). Mouse models were monitored for 30 days, which was
the termination point of the experiment. In order to assess the
metastases of cancer cells, lung samples of mice were fixed in
formalin at 4°C. Lung samples were then embedded in paraffin. Five
sections from different depths of lung samples were analyzed, and
the distance of adjacent depths was 100 μm. The slides were
deparaffinized and rehydrated as described above. Sections were
then stained with hematoxylin-eosin (H&E). Cell and colony
numbers of lung metastases were counted under a microscope.
Statistical analysis
Table 1 presents a
summary of the analyzed medical parameters in the form of frequency
distributions for discrete parameters, respectively. All SPARC
expression levels were analyzed by Pearson’s Chi-square or Fisher’s
exact tests. Other data are expressed as the means ± SD.
Statistical analysis was performed using one-way ANOVA followed by
Dunnett’s multiple comparison or a Student’s t-test. P<0.05 was
considered to indicate a statistically significant difference. All
tests were carried out with SPSS 13.0.
 | Table IPatient clinicopathological factors
and SPARC expression in gastric cancer tissues. |
Table I
Patient clinicopathological factors
and SPARC expression in gastric cancer tissues.
| Parameters | No. (%)
n=65 | SPARC IHC High score
(%)
n=23 | SPARC IHC Low score
(%)
n=42 | P-value |
|---|
| Gender | | | | 0.831a |
| Male | 47 (72.31) | 17 (36.2) | 30 (63.8) | |
| Female | 18 (27.69) | 6 (33.3) | 12 (66.7) | |
| Age (years) | | | | 0.384a |
| <65 | 32 (49.23) | 13 (40.4) | 19 (59.4) | |
| ≥65 | 33 (50.77) | 10 (30.3) | 23 (69.7) | |
| TNM stage | | | | 0.002a |
| I/II | 31 (47.69) | 17 (54.8) | 14 (45.2) | |
| III/IV | 34 (52.31) | 6 (17.6) | 28 (82.4) | |
| Histological
type | | | | 0.036b |
| Intestinal | 49 (75.38) | 21 (63.3) | 28 (36.7) | |
| Diffuse | 16 (24.62) | 2 (31.3) | 14 (68.8) | |
| Diameter | | | | 0.672a |
| <5 cm | 26 (40.0) | 10 (38.5) | 16 (61.5) | |
| ≥5 cm | 39 (60.0) | 13 (33.3) | 26 (66.7) | |
|
Differentiation | | | | 0.078a |
| Well/moderate | 30 (46.15) | 14 (46.7) | 16 (53.3) | |
| Poor | 35 (53.85) | 9 (25.7) | 26 (74.3) | |
| Location | | | | 0.590a |
| Upper third | 12 (18.46) | 3 (25.0) | 9 (75.0) | |
| Middle third | 42 (64.62) | 15 (35.7) | 27 (64.3) | |
| Lower third | 11 (16.92) | 5 (45.5) | 6 (54.5) | |
| Tumor
infiltration | | | | 0.013a |
| T1/T2 | 10 (15.38) | 7 (70.0) | 3 (30.0) | |
| T3/T4 | 55 (84.62) | 16 (29.1) | 39 (70.9) | |
| Local lymph node
metastasis | | | | 0.009a |
| N0 | 16 (24.62) | 10 (62.5) | 6 (37.5) | |
| N1–N3 | 49 (75.38) | 13 (26.5) | 36 (73.5) | |
| Distant
metastasis | | | | 0.941a |
| M0 | 54 (83.08) | 19 (23.8) | 35 (76.2) | |
| M1 | 11 (16.92) | 4 (9.1) | 7 (90.9) | |
Results
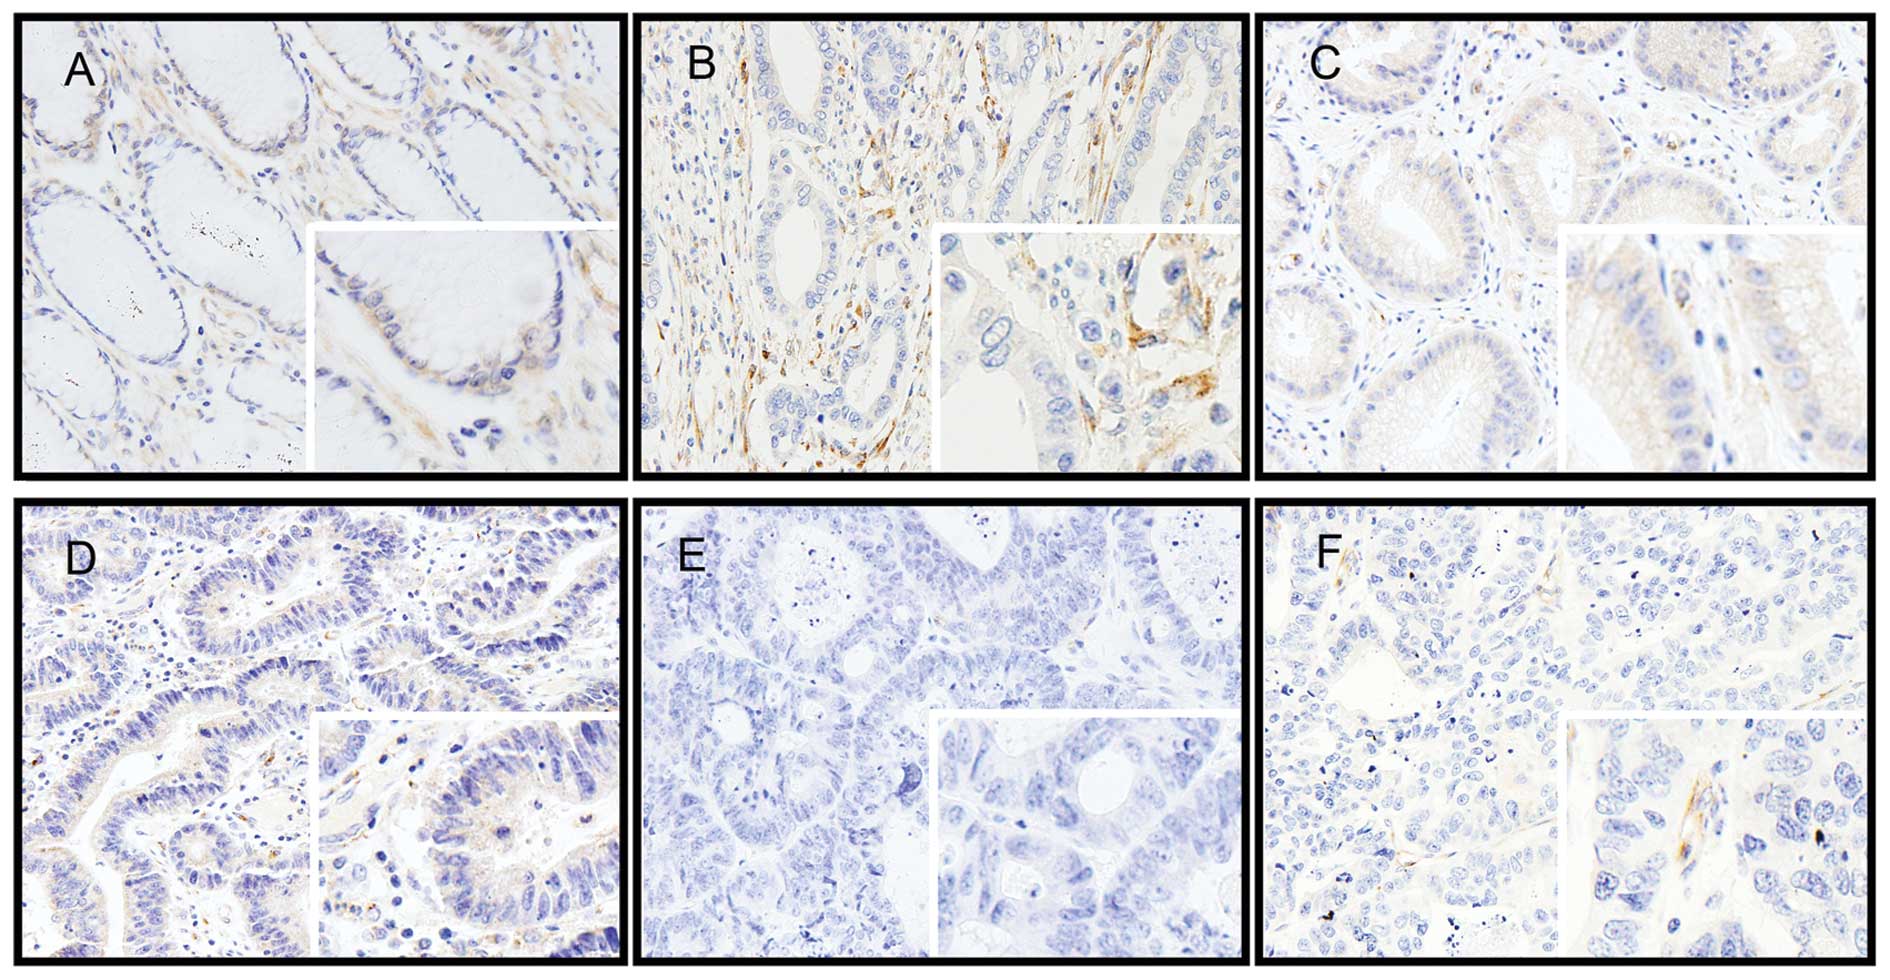
SPARC expression is negatively correlated
with clinicopathological factors of GCs
We tested SPARC expression using IHC in normal
gastric mucosa and in cancer tissues. In normal gastric tissues,
SPARC was expressed faintly in the cytoplasm of normal mucosal
epithelial and stromal cells. In GC tissues, immunostaining was
weak or absent in cancer cells. However, immunoreaction was
variable and common in the cells of the desmoplastic stroma
surrounding the cancer cells (Fig.
1). No statistically significant correlations were observed
between SPARC expression and gender, age at diagnosis, tumor
location, tumor size, tumor differentiation or metastases to
distant tissues. Decreased staining intensity of SPARC was found
with advanced TNM staging (P=0.002), degree of stomach wall
invasion (T staging, P=0.013), lymph node metastasis (N staging,
P=0.009). We found that SPARC expression significantly correlated
with tumor type, favoring the intestinal type but not the diffuse
type of GC. The immunoreactivity in the intestinal cancer was high
in 21 (42.86%) cases, and low in 28 (57.14%) cases. Diffuse GC
cells showed a high reaction in 2 (12.5%) and a low reaction in 14
(87.5%) cases; the difference was significant (P=0.036, Table I).
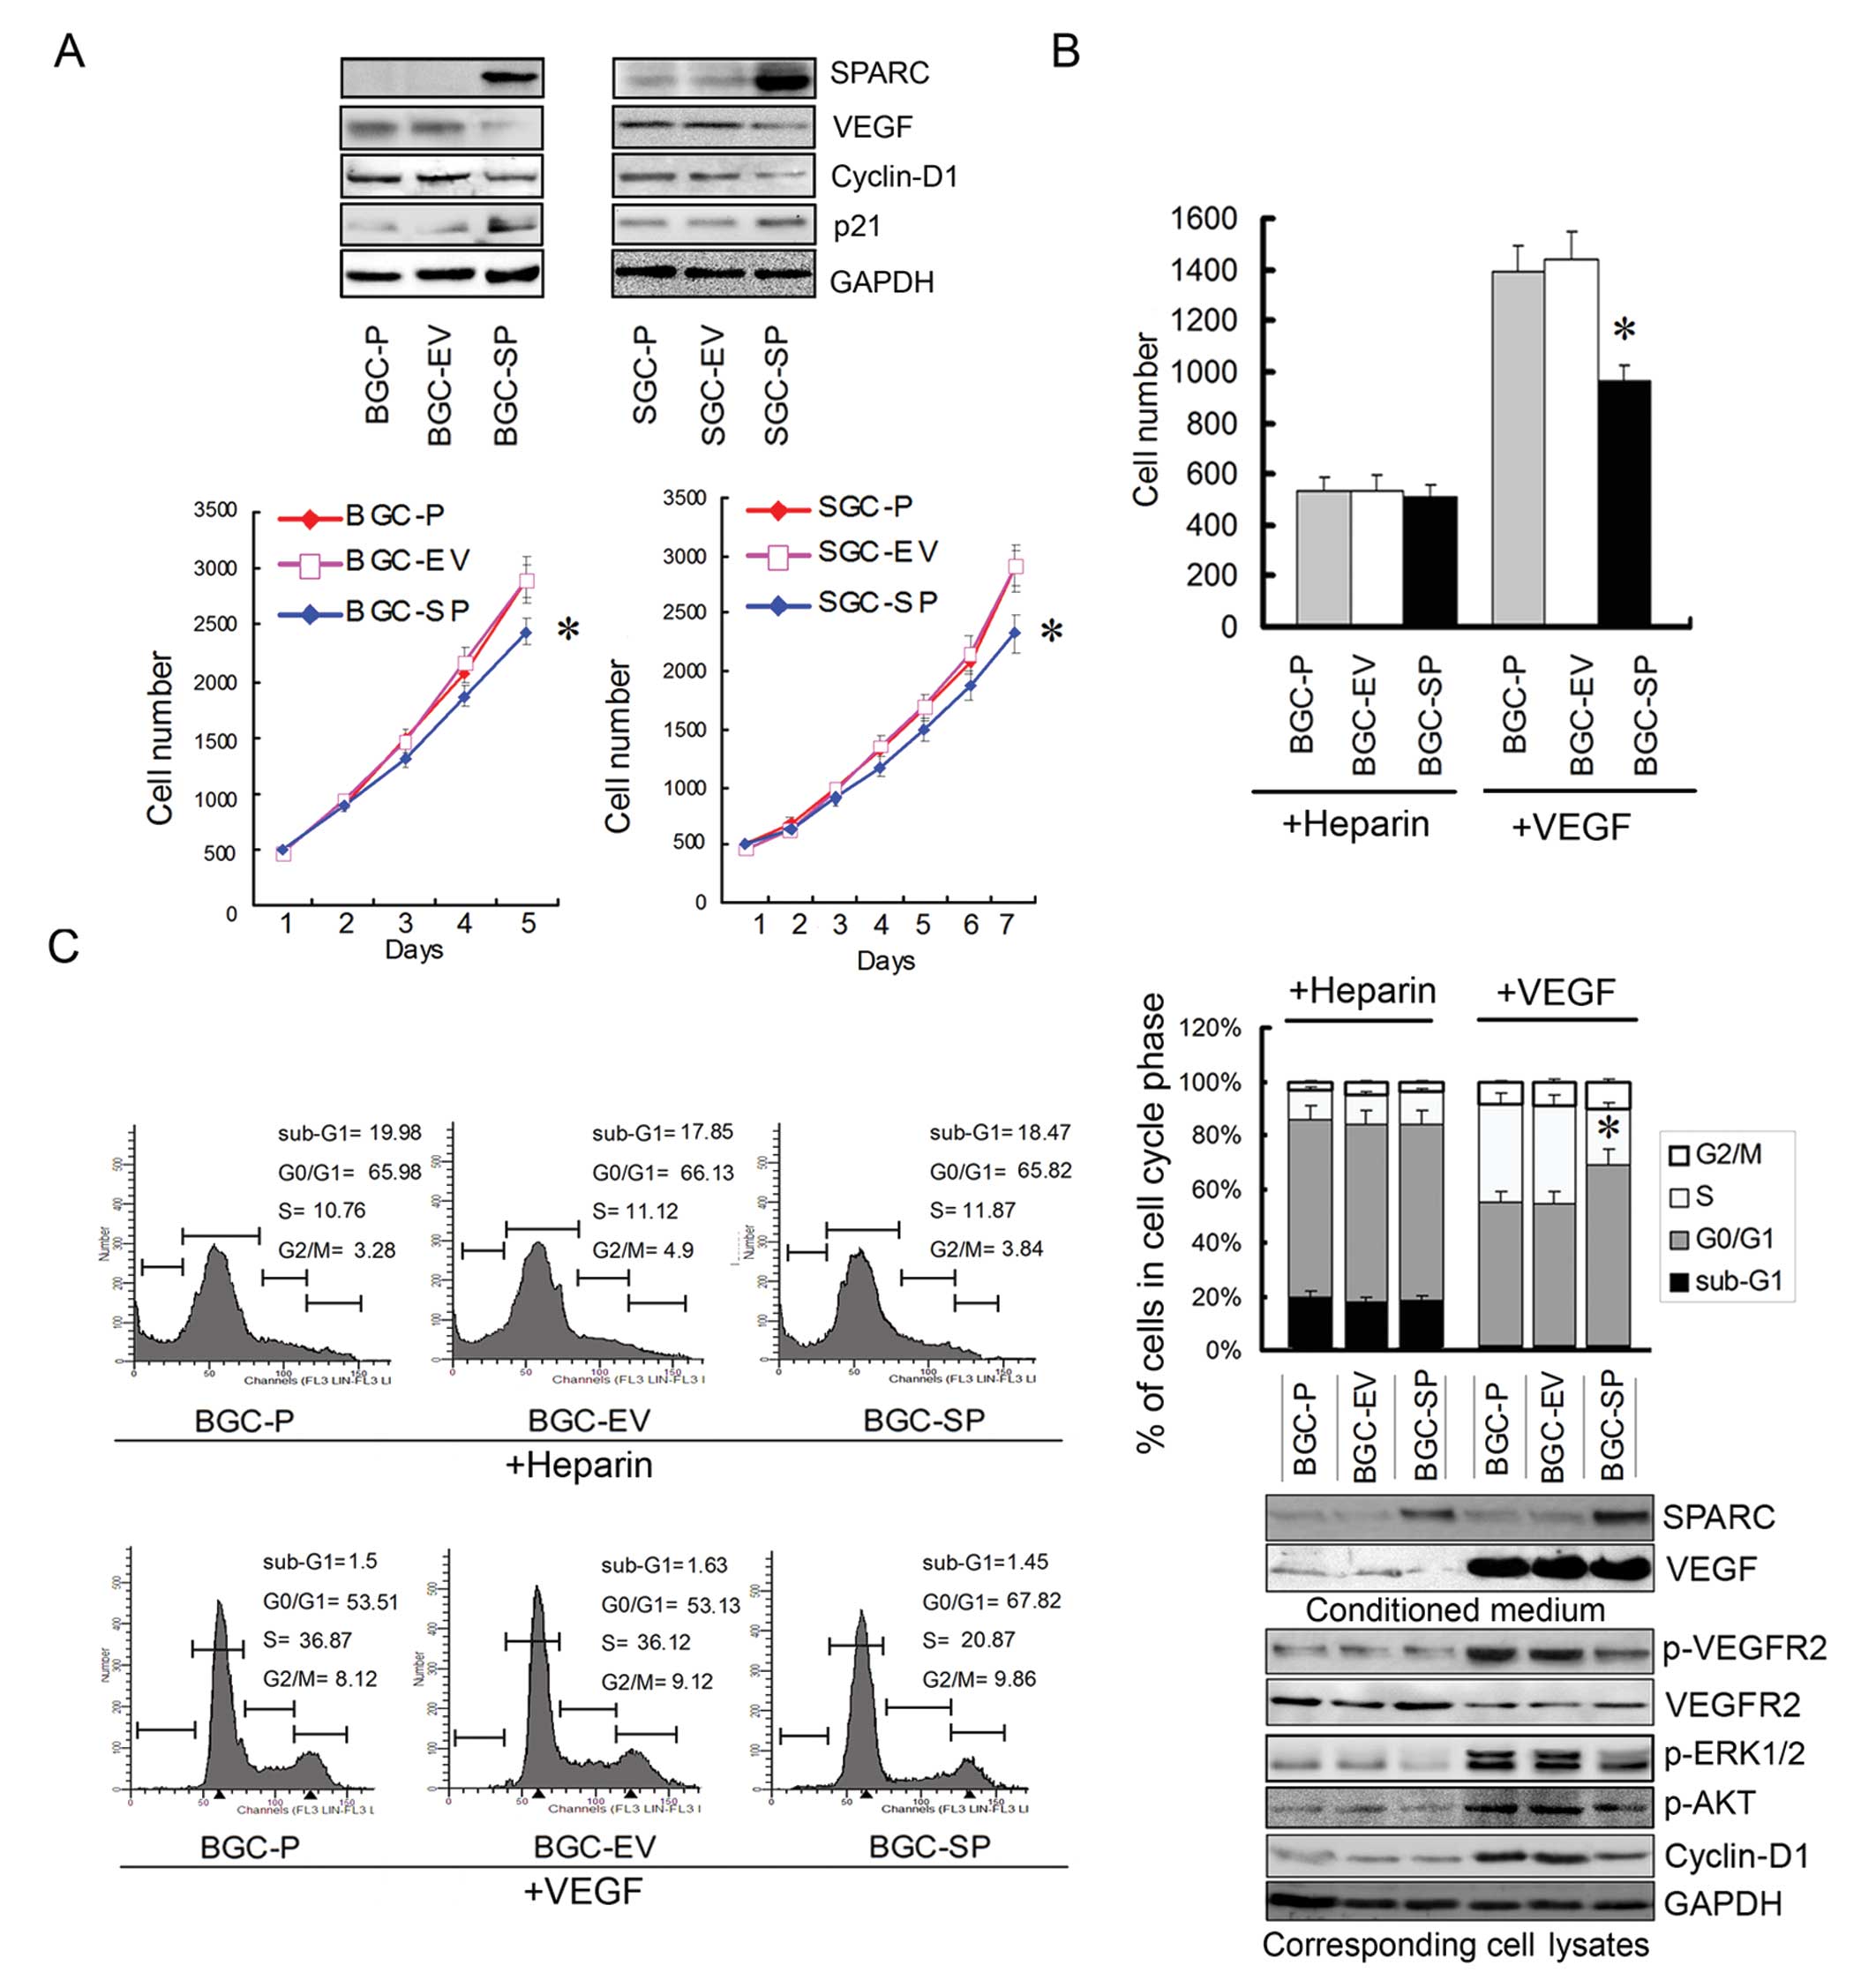
Endogenous SPARC overexpression
suppresses the growth rate, and the deactivation of VEGFR2 is
involved in the reduction of growth rate and cycle progression
When BGC-SP and SGC-SP cells were transduced with
pcDNA3.1 plasmid carrying the cDNAs encoding SPARC, a >20-fold
increase in the abundance of the protein was observed (Fig. 2A). MTS assays showed that SPARC
overexpression reduced the growth rate of GC cells significantly
(P<0.05; Fig. 2A). In our
previous study, we showed that endogenous SPARC overexpression
suppressed the expression of VEGF and deactivated the ERK1/2
signaling pathway (7). The
expression of cyclin-D1 and p21 was tested in the present study.
The results of WB showed that the cyclin-D1 expression was reduced
while p21 expression was increased (Fig. 2A). It is believed that VEGF plays an
important role in proliferative activity. In order to exclude the
effect of reduced endogenous VEGF expression induced by SPARC
overexpression and effects from other growth factors, exogenous
recombination human VEGF was added in serum-free media of cell
lines; heparin was used as control. The cell lines were cultured
for 48 h; the proliferation and cycle progression of cell lines
were tested and the phospho-VEGFR2 and ERK1/2 expressions were
tested.
By contrast, the proliferation of BGC-SP cells was
reduced by 30% when VEGF concentration in serum-free media was
equal to that of empty vector-transduced or parental cell lines
(P<0.05; Fig. 2B). To determine
whether endogenous SPARC expression results in cell cycle changes,
the cellular DNA content was measured by FCM. When cell lines were
treated by exogenous VEGF, the percentage of BGC-SP cells in the
G0/G1 phase was significantly increased when compared with the
control cell lines (P<0.05; Fig.
2C). By contrast, the percentage of BGC-SP cells in the S-phase
was significantly decreased (P<0.05; Fig. 2C). These data demonstrated that
SPARC overexpression induced a significant arrest of cell cycle
progression in the G0/G1 phase when the same concentration of VEGF
was used in the media. The proliferation and cycle progression of
the BGC-SP cell line were not affected significantly when heparin
was used as control. The activation of VEGFR2, ERK1/2, AKT and
expression of cyclin-D1 was decreased in cells overexpressing SPARC
(Fig. 2C). Presumably, SPARC
interfered with the binding between VEGF and VEGFR2, therefore, the
activation of VEGFR2 and downstream ERK1/2 was inhibited.
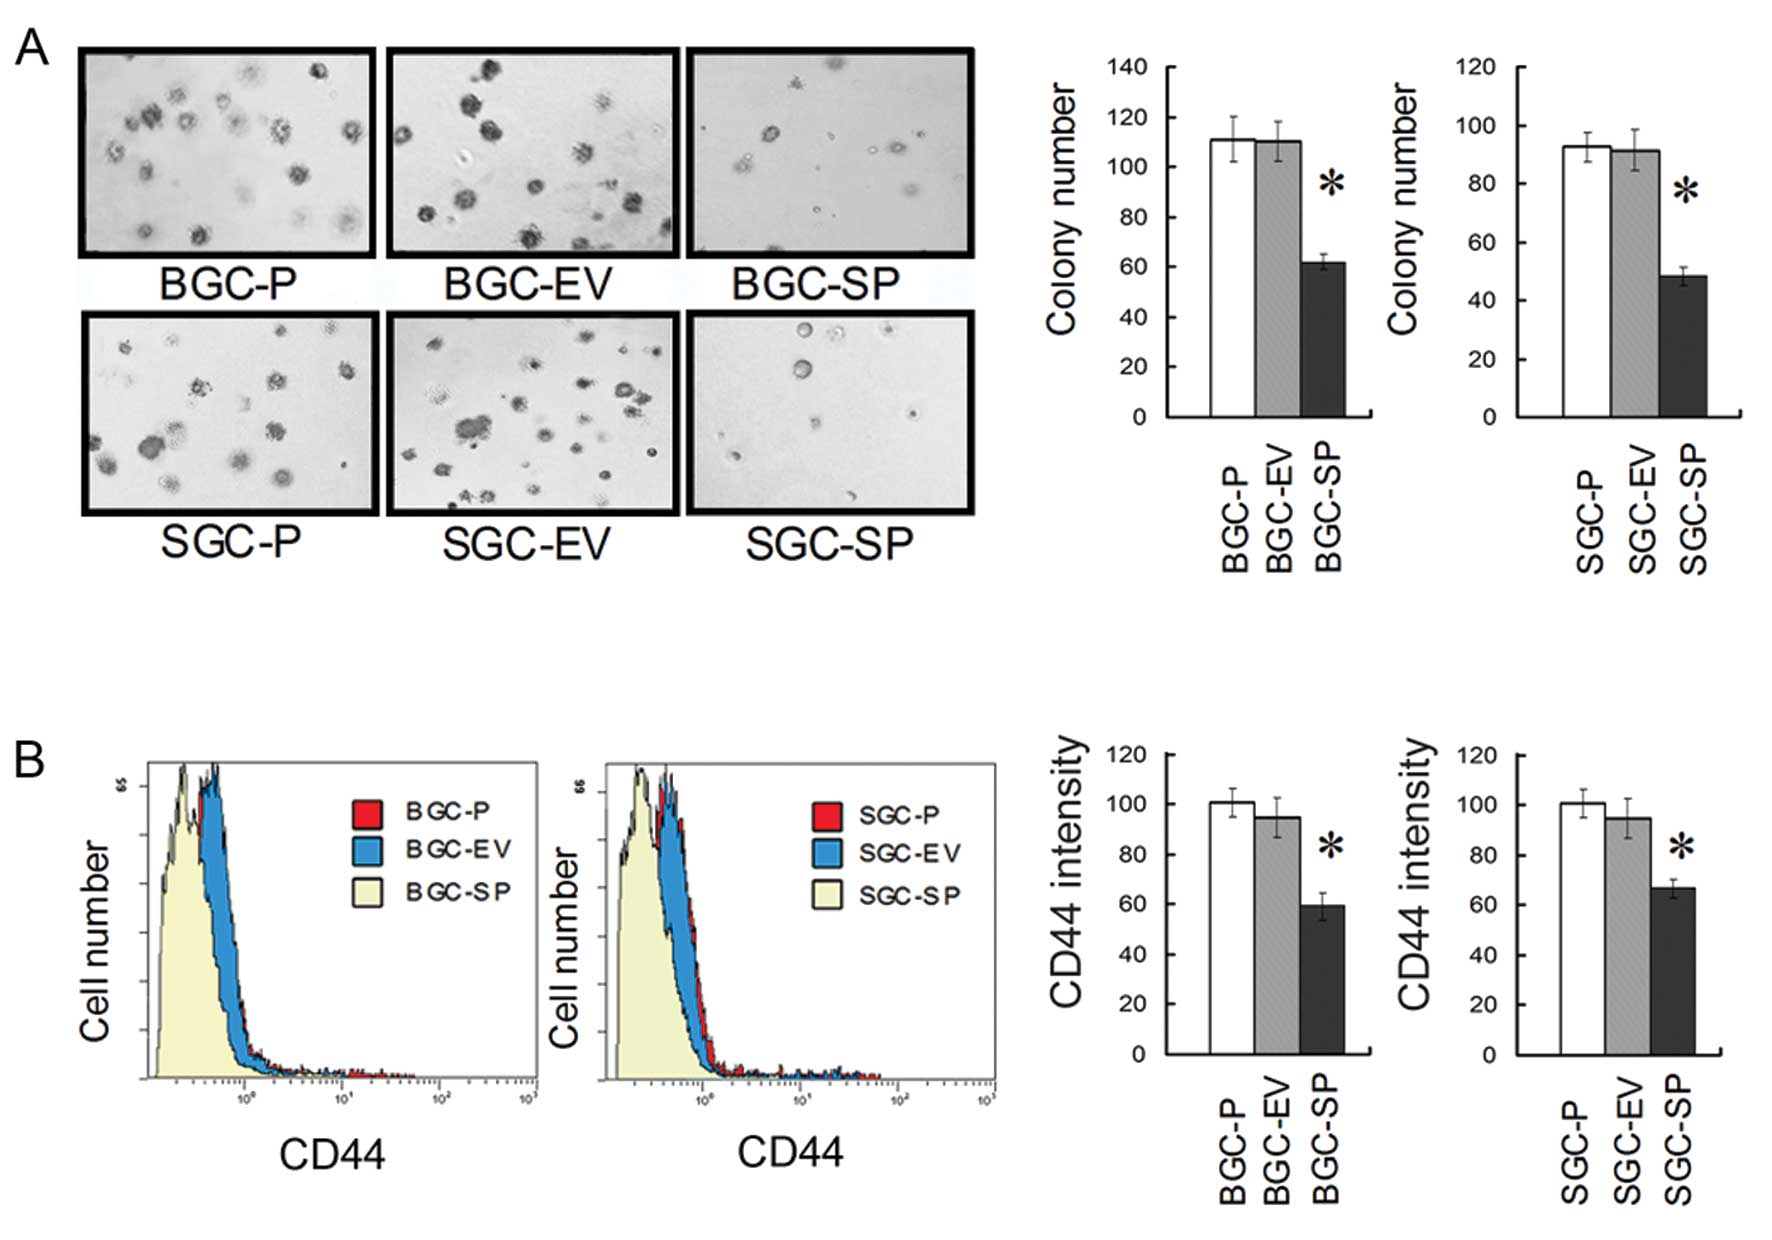
Endogenous SPARC overexpression
suppresses clonogenicity of GC cells by decreasing CD44
Clonogenic assay revealed that SPARC overexpression
reduced the clonogenicity of GC cells significantly (P<0.05;
Fig. 3A). The FCM assay showed an
~30–40% reduction in CD44 cell surface expression level in
SPARC-overexpressing cell lines when compared to empty
vector-transduced or parental cell lines, respectively (P<0.05;
Fig. 3B).
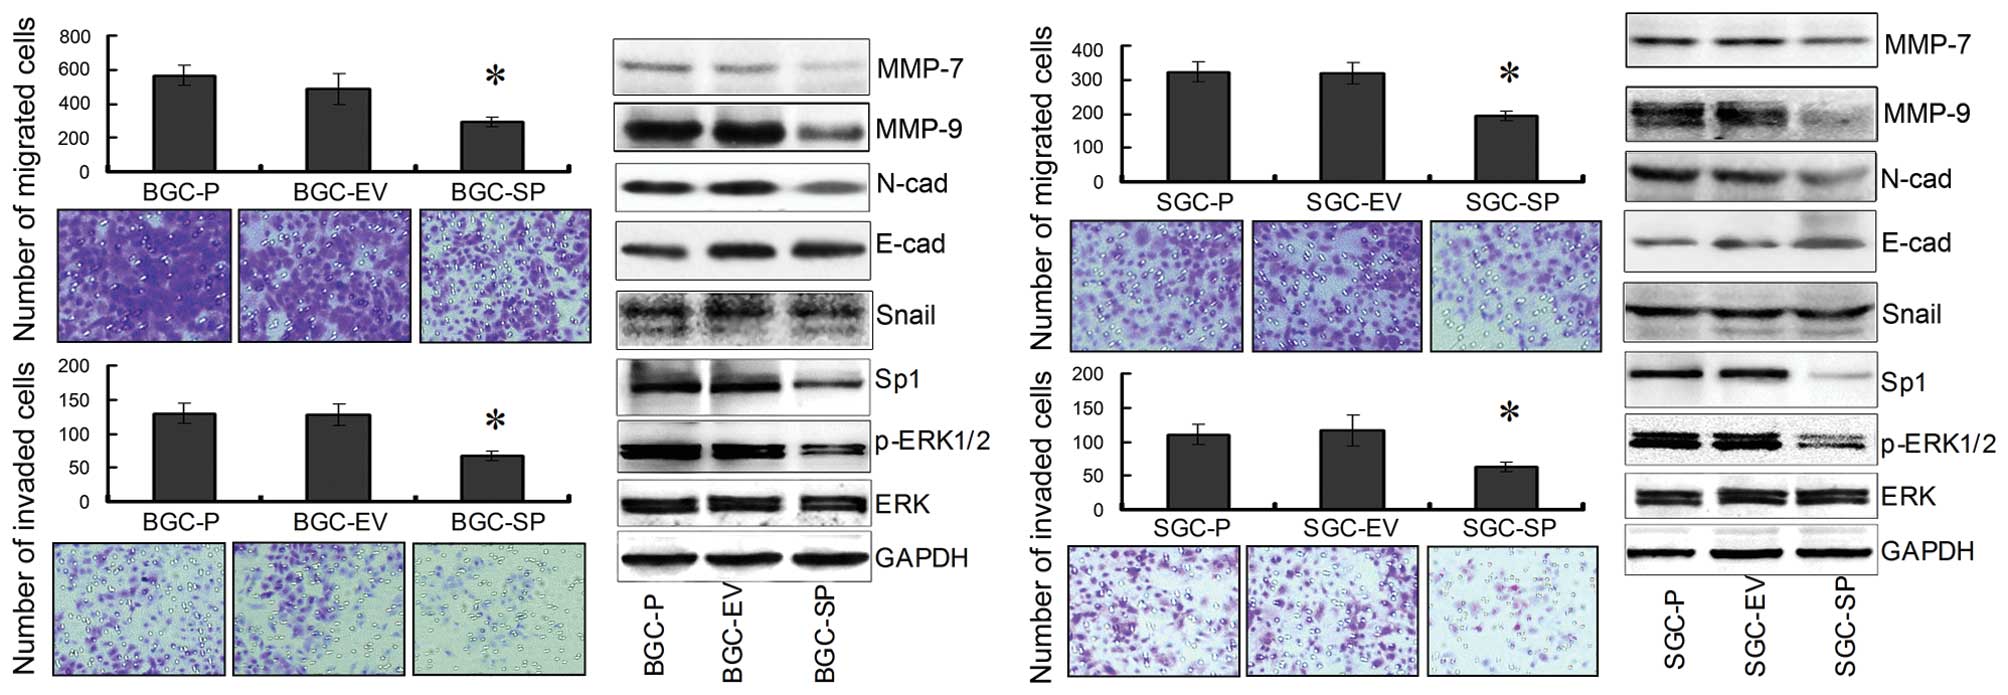
Endogenous SPARC overexpression
suppresses the invasion and migration of GC cells by decreasing the
expression of N-cadherin, MMP-7, MMP-9, Sp1 and p-ERK1/2
expression
To determine whether SPARC overexpression affects
migration and invasion of GCs, cell migration and invasion assays
were performed using Boyden chambers. We measured the capacity of
GC cells to invade through the chamber membrane coated or not
coated with Matrigel. At 36 h, there was a 40–50% decrease in
migration of SPARC cDNA-transfected GC cells, compared with empty
vector-transfected and parental cells, respectively (P<0.05;
Fig. 4). In addition, there was a
40–50% decrease in invasion of SPARC cDNA-transfected GC cells,
compared with empty vector-transfected and parental cells,
respectively (P<0.05; Fig. 4).
Collectively, these results clearly indicated that SPARC
overexpression led to the inhibition of invasion and migration
significantly, in both BGC-823 and SGC-7901 cells, respectively. By
contrast, WB revealed that the expression of MMP-7, MMP-9,
N-cadherin, Sp1 and p-ERK1/2 was significantly inhibited in BGC-SP
and SGC-SP cells compared with the control cell lines. However, the
expression of Snail and E-cadherin was not significantly affected
(Fig. 4).
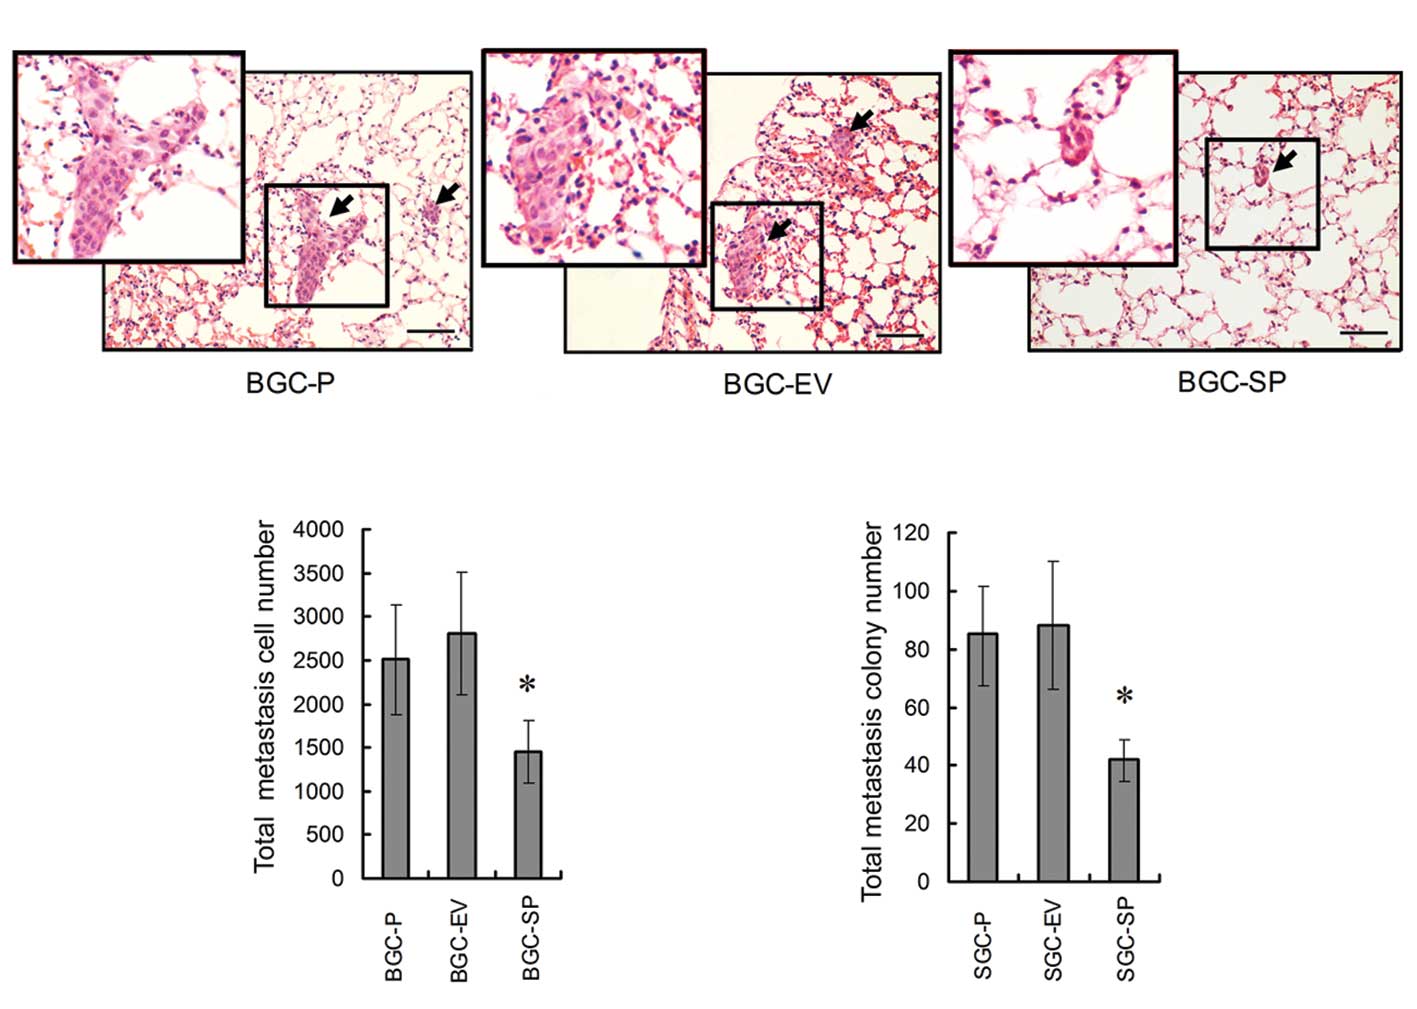
In vivo assay: lung metastases of GC are
suppressed by endogenous SPARC overexpression
In order to determine the capacity of GC cells to
form metastases in the lung, nude mice models were established by
tail vein injection with human BGC-P, BGC-EV, BGC-SP cells
(5×10⁵ cells/mouse). The lung samples were fixed in
formalin and embedded in the paraffin within 30 days. Five sections
from different depths of lung samples were stained and analyzed.
The statistical analysis revealed that there was no significant
difference in lung metastases between BGC-P cells (metastatic cell
no. 2508.56±623.69; colony no. 85.23±16.92) and BGC-EV cells
(metastatic cell no. 2714.21±646.92; colony no. 88.72±21.36).
Metastatic cell number and colony number were decreased
significantly in BGC-SP cells (metastatic cell no. 1485.68±243.19;
colony no. 41.73±7.22, P<0.05; Fig.
5).
Discussion
SPARC is known to be involved in diverse biological
processes, including collagen fibrinogenesis, wound repair,
apoptosis and in reducing proliferation, migration and angiogenesis
(3,15). High levels of SPARC expression
negatively correlate with the overall survival and disease-free
survival of patients with breast cancer (16). Our previous study showed that
exogenous SPARC significantly decreased the growth and migration of
pancreatic cancer cells (6,17). The present study, as well as other
studies, showed that SPARC inhibited the angiogenesis and VEGF
expression of different types of cancer (4,7,18–20).
To explore if SPARC promotes or suppresses the
development and progression of GC, in the present study, we tested
the expression of SPARC in GC tissues and non-cancerous normal
tissues from patients. Our IHC study showed that SPARC expression
was faint in normal epithelial and stromal cells. However, in most
GC tissues, SPARC was almost undetectable in epithelial cancer
cells, whereas variable SPARC expression was observed in the
cytoplasm of stromal cells surrounding the GC; these results are
consistent with results of other studies (13,21–23).
Statistical analysis showed that SPARC expression was negatively
correlated with clinicopathological parameters including TNM stage,
tumor infiltration and lymph node metastasis. SPARC expression did
not show a statistical correlation with tumor differentiation and
metastasis in distant sites. This may be due to the limited number
of patients included in the experiment. We found that SPARC
expression highly significantly correlated with tumor type,
favoring the intestinal type but not the diffuse type of GC. It is
believed that, in the diffuse type of GC, a reduced expression of
SPARC in stromal cells from GCs may support a decohesive phenotype
(13). It is widely accepted that
SPARC binds to several types of collagen, which are the major
structural proteins of the extracellular matrix (ECM) produced by
host stromal cells in response to the tumor cells. It is proposed
that SPARC inhibits proliferation of tumors in primary and
metastatic sites at least in part by increasing the collagen
content and mechanical stiffness of the fibers surrounding the
tumor, thus restricting the growth of the tumor (24). The results of Wang et al
(14) were similar to ours and
demonstrated that SPARC may be a potential tumor suppressor in
GC.
To address this possibility, we established BGC-823
and SGC-7901 cell lines which overexpressed SPARC. Our in
vitro assays revealed that endogenous SPARC overexpression
significantly inhibited the proliferation of GC. Our previous study
demonstrated that endogenous SPARC suppressed the proliferation and
expression of VEGF at the same time. It is believed that VEGF is a
considerable cause of promoting the growth of tumors. In order to
further investigate the mechanism of deproliferative function of
SPARC, 5 nM exogenous rhVEGF was used in the media of BGC-P, BGC-EV
and BGC-SP cells were identical. MTS and FCM showed that, in the
media with the same concentrations of VEGF, the proliferation and
cell cycle progression of SPARC overexpressing cells were
inhibited. Furthermore, the activation of VEGFR2, ERK1/2, AKT of
BGC-SP were suppressed, which meant SPARC suppressed the
proliferation at least in part by prohibiting the activation of
VEGFR2 induced by VEGF.
In addition to SPARC overexpression suppressing
proliferation of GC, our in vitro assays revealed that
endogenous SPARC overexpression significantly inhibited the
clonogenicity of GC on Matrigel. The declonogenic effect of SPARC
suggests that this factor may play a role in a stem-like population
of GC cells. CD44 was identified as a potential biomarker of stem
cells in GC. It is believed that the clonogenic capacity of cells
expressing high level of CD44 is much stronger than cells
expressing low level of CD44 (25).
The CD44 expression was tested by FCM. By contrast, the CD44
expression was reduced significantly in SPARC-overexpressing GC
cells.
In our clinical experiments, absence of SPARC
expression in GC tissues correlated with advanced stages of stomach
wall invasion, lymph node metastasis. According to these results
from clinical experiments, we hypothesized that SPARC played a key
role in invasion and migration of GC. To address this possibility,
Transwell assays were arranged. By contrast, the invasion and
migration were suppressed in SPARC-overexpressing GC cells. One of
the key processes providing cancer cells with the capacity to
migrate, invade and metastasize is their ability to undergo an EMT.
EMT is characterized by loss of intercellular adhesion (E-cadherin
to N-cadherin switch), upregulation of Snail and MMPs. The western
blotting showed that endogenous SPARC inhibited the expressions of
MMP-7, MMP-9, N-cadherin, Sp1 and the activation of ERK1/2
significantly, but did not affect the expression of Snail and
E-cadherin significantly. MMPs were thought to predominantly
degrade specific components of the ECM, thereby providing new
substrates facilitating migration and invasion. N-cadherin is an
important biomarker of EMT. In N-cadherin-transfected breast cancer
cells, N-cadherin promotes motility and invasion, but the reduction
in the expression of E-cadherin does not necessarily correlate with
either of these two (26). This
finding indicated that N-cadherin, functioning as adhesion
molecules, may be more important than E-cadherin for metastasis and
invasion. It is believed that Sp1 is one of the most important
transcription factors which promotes the invasion and metastasis of
different cancers.
In vivo assay showed that metastases in the
lungs of nude mice were suppressed by SPARC overexpression. This
result demonstrated that SPARC overexpression suppressed the
proliferation, clonogenicity and invasion of GC cells in nude
mice.
In summary, our results illustrated that SPARC
expression in GC tissues was negatively correlated with
clinicopathological parameters of patients. SPARC inhibited the
proliferation via decoction of VEGFR2, ERK, AKT and SPARC inhibited
invasion of GC via reduced expression of MMP-7, MMP-9, N-cadherin
and Sp1. We conclude that SPARC expression probably suppresses the
malignancy of GC, and the exploration aimed to regulate SPARC
expression may become a beneficial approach to improve GC
treatment.
Acknowledgements
This study was financially supported by grants from
the National Natural Science Foundation of China (no.
30901417/H1617).
References
|
1
|
Jemal A, Bray F, Center MM, Ferlay J, Ward
E and Forman D: Global cancer statistics. CA Cancer J Clin.
61:69–90. 2011. View Article : Google Scholar
|
|
2
|
Ferlay J, Shin HR, Bray F, Forman D,
Mathers C and Parkin DM: Estimates of worldwide burden of cancer in
2008: GLOBOCAN 2008. Int J Cancer. 127:2893–2917. 2010. View Article : Google Scholar : PubMed/NCBI
|
|
3
|
Tai IT and Tang MJ: SPARC in cancer
biology: its role in cancer progression and potential for therapy.
Drug Resist Updat. 11:231–246. 2008. View Article : Google Scholar : PubMed/NCBI
|
|
4
|
Liang JF, Wang HK, Xiao H, et al:
Relationship and prognostic significance of SPARC and VEGF protein
expression in colon cancer. J Exp Clin Cancer Res. 29:712010.
View Article : Google Scholar : PubMed/NCBI
|
|
5
|
Atorrasagasti C, Malvicini M, Aquino JB,
et al: Overexpression of SPARC obliterates the in vivo
tumorigenicity of human hepatocellular carcinoma cells. Int J
Cancer. 126:2726–2740. 2010.PubMed/NCBI
|
|
6
|
Chen G, Tian X, Liu Z, et al: Inhibition
of endogenous SPARC enhances pancreatic cancer cell growth:
modulation by FGFR1-III isoform expression. Br J Cancer.
102:188–195. 2010. View Article : Google Scholar : PubMed/NCBI
|
|
7
|
Zhang JL, Chen GW, Liu YC, et al: Secreted
protein acidic and rich in cysteine (SPARC) suppresses angiogenesis
by down-regulating the expression of VEGF and MMP-7 in gastric
cancer. PLoS One. 7:e446182012. View Article : Google Scholar : PubMed/NCBI
|
|
8
|
Chlenski A and Cohn SL: Modulation of
matrix remodeling by SPARC in neoplastic progression. Semin Cell
Dev Biol. 21:55–65. 2010. View Article : Google Scholar : PubMed/NCBI
|
|
9
|
Nagaraju GP and El-Rayes BF: SPARC and DNA
methylation: possible diagnostic and therapeutic implications in
gastrointestinal cancers. Cancer Lett. 328:10–17. 2013. View Article : Google Scholar : PubMed/NCBI
|
|
10
|
Hasselaar P and Sage EH: SPARC antagonizes
the effect of basic fibroblast growth factor on the migration of
bovine aortic endothelial cells. J Cell Biochem. 49:272–283. 1992.
View Article : Google Scholar : PubMed/NCBI
|
|
11
|
Funk SE and Sage EH: The
Ca2+-binding glycoprotein SPARC modulates cell cycle
progression in bovine aortic endothelial cells. Proc Natl Acad Sci
USA. 88:2648–2652. 1991.PubMed/NCBI
|
|
12
|
Said N and Motamed K: Absence of
host-secreted protein acidic and rich in cysteine (SPARC) augments
peritoneal ovarian carcinomatosis. Am J Pathol. 167:1739–1752.
2005. View Article : Google Scholar : PubMed/NCBI
|
|
13
|
Franke K, Carl-McGrath S, Röhl FW, et al:
Differential expression of SPARC in intestinal-type gastric cancer
correlates with tumor progression and nodal spread. Transl Oncol.
2:310–320. 2009. View Article : Google Scholar : PubMed/NCBI
|
|
14
|
Wang L, Yang M, Shan L, et al: The role of
SPARC protein expression in the progress of gastric cancer. Pathol
Oncol Res. 18:697–702. 2012. View Article : Google Scholar : PubMed/NCBI
|
|
15
|
Arnold SA and Brekken RA: SPARC: a
matricellular regulator of tumorigenesis. J Cell Commun Signal.
3:255–273. 2009. View Article : Google Scholar : PubMed/NCBI
|
|
16
|
Nagai MA, Gerhard R, Fregnani JH, et al:
Prognostic value of NDRG1 and SPARC protein expression in breast
cancer patients. Breast Cancer Res Treat. 126:1–14. 2011.
View Article : Google Scholar : PubMed/NCBI
|
|
17
|
Liu YP and Hsiao M: Exercise-induced SPARC
prevents tumorigenesis of colon cancer. Gut. 62:810–811. 2013.
View Article : Google Scholar : PubMed/NCBI
|
|
18
|
Yunker CK, Golembieski W, Lemke N, et al:
SPARC-induced increase in glioma matrix and decrease in vascularity
are associated with reduced VEGF expression and secretion. Int J
Cancer. 122:2735–2743. 2008. View Article : Google Scholar : PubMed/NCBI
|
|
19
|
Bhoopathi P, Chetty C, Gujrati M, Dinh DH,
Rao JS and Lakka SS: The role of MMP-9 in the anti-angiogenic
effect of secreted protein acidic and rich in cysteine. Br J
Cancer. 102:530–540. 2010. View Article : Google Scholar : PubMed/NCBI
|
|
20
|
Lau CP, Poon RT, Cheung ST, Yu WC and Fan
ST: SPARC and Hevin expression correlate with tumour angiogenesis
in hepatocellular carcinoma. J Pathol. 210:459–468. 2006.
View Article : Google Scholar : PubMed/NCBI
|
|
21
|
Takeno A, Takemasa I, Doki Y, et al:
Integrative approach for differentially overexpressed genes in
gastric cancer by combining large-scale gene expression profiling
and network analysis. Br J Cancer. 99:1307–1315. 2008. View Article : Google Scholar
|
|
22
|
Junnila S, Kokkola A, Mizuguchi T, et al:
Gene expression analysis identifies over-expression of
CXCL1, SPARC, SPP1, and SULF1 in
gastric cancer. Genes Chromosomes Cancer. 49:28–39. 2010.
View Article : Google Scholar : PubMed/NCBI
|
|
23
|
Wang CS, Lin KH, Chen SL, Chan YF and
Hsueh S: Overexpression of SPARC gene in human gastric carcinoma
and its clinic-pathologic significance. Br J Cancer. 91:1924–1930.
2004. View Article : Google Scholar : PubMed/NCBI
|
|
24
|
Chong HC, Tan CK, Huang RL and Tan NS:
Matricellular proteins: a sticky affair with cancers. J Oncol.
2012:3510892012. View Article : Google Scholar : PubMed/NCBI
|
|
25
|
Takaishi S, Okumura T, Tu S, et al:
Identification of gastric cancer stem cells using the cell surface
marker CD44. Stem Cells. 27:1006–1020. 2009. View Article : Google Scholar : PubMed/NCBI
|
|
26
|
Nieman MT, Prudoff RS, Johnson KR and
Wheelock MJ: N-cadherin promotes motility in human breast cancer
cells regardless of their E-cadherin expression. J Cell Biol.
147:631–644. 1999. View Article : Google Scholar : PubMed/NCBI
|