Introduction
Glioma is the most common primary brain tumor in
adults (1). For patients with
glioblastoma, the most aggressive glioma, the survival time after
diagnosis averages 10–14 months, despite improvements in available
treatments, such as surgery and radiotherapy with temozolomide
(TMZ) (1,2).
Glioma progression is caused by an accumulation of
genetic and epigenetic alterations; therefore, individualized
diagnosis and treatments that focus on specific genes are essential
(3). Previous studies have shown
that the expression of genes related to glioma progression include
COL4A2, FOXM1, MGP, TOP2A, CENPF, IGFBP4, VEGFA, ADD3, CAMK2G,
KI-67, YKL-40 and SMAD4, all of which are associated with the World
Health Organization (WHO) glioma grade (4–6).
Moreover, gene methylation is believed to play a crucial role in
tumor progression, partially by repressing tumor suppressor genes,
inhibiting their accumulation and inducing their mutation (7,8).
Conversely, prognostic markers with potential clinical significance
have been identified through genome-wide DNA methylation
microarrays and survival-associated gene expression profiling
studies (2,9–11).
In the present study, using microarray databases, we
identified that the human cyclic adenosine monophosphate
(cAMP)-specific phosphodiesterase 4C (PDE4C) promoter methylation
and expression levels were associated with glioma grade
progression. We screened out PDE4C from other genes due to its
better survival index.
PDE4C, localized to 19p13.1, belongs to the PDE
family. Cyclic nucleotide PDEs hydrolyze the second messengers cAMP
and cGMP, which are viewed as critical regulators of many important
physiological processes, such as intracellular cAMP levels, cAMP
signaling and signal compartmentalization (12). PDEs are grouped into seven enzyme
families according to their substrate specificity and sensitivity
to pharmacological inhibitors (13,14),
with the type 4 PDEs specific for cAMP. The distribution and
abundance of PDE4C mRNAs appear to be more restricted than the
other three isoforms (PDE4A, B, D) and are largely limited to cell
lines of neuronal origin. Pérez-Torres et al (15) compared the localization of each
isozyme in the human brain with that in the rat and monkey brain.
They found that the four PDE4 isoforms display a differential
expression pattern at both regional and cellular level in the three
species. PDE4A, PDE4B and PDE4D are widely distributed in the human
brain, with the two latter appearing more abundantly. In contrast,
PDE4C in the human brain presents a more restricted distribution,
limited to cortex, some thalamic nuclei and cerebellum. This is at
variance with the distribution of PDE4C in rat and monkey brain. To
date, there are no reports on PDE4C correlation with other tumors,
and its function remains unclear, except it hydrolyzes human
cAMP.
Our data showed that PDE4C which specifically
hydrolyzes human cAMP, may be a tumor suppressor gene that is
involved in glioma development. Furthermore, previous studies have
shown that activation of cAMP signaling inhibits DNA damage-induced
apoptosis in BCP-ALL cells through abrogation of p53 accumulation
and promotion of p53 and HDM2 interaction (8,16).
However, PDE4C remains a putative tumor suppressor, as it has not
been identified in gliomas. In the present study, we found that
PDE4C CpG island hypermethylation and low PDE4C expression in human
glioblastomas were associated with a poor prognosis. In addition,
PDE4C underwent CpG island promoter-associated silencing in glioma,
which upon reintroduction into glioblastoma cell lines, promoted
apoptosis and inhibited migration. Thus, our findings indicate that
PDE4C is a candidate tumor suppressor gene and may serve as a
prognostic biomarker with potential clinical significance in glioma
treatment.
Materials and methods
Patients and samples
Patients were from the Chinese Glioma Genome Atlas
(CGGA) database (http://www.cgga.org.cn). All patients in the present
study underwent surgical resection between January 2006 and
December 2010 and subsequently received TMZ and radiotherapy.
Clinical data, including patient age at diagnosis, gender, extent
of resection and preoperative Karnofsky Performance Status (KPS)
score were obtained from medical records. Overall survival (OS)
time, defined as the period from operation to mortality, was
collected mainly when patients visited the clinics or by phone
interview with patients and/or their relatives. Patients who died
of non-primary diseases were excluded (17). Tumor tissue samples were obtained by
surgical resection before treatment with radiation and
chemotherapy. Resected specimens were snap frozen in liquid
nitrogen and stored at −80°C until nucleic acid extraction. This
study was approved by the Ethics Committee of the Capital Medical
University, and written informed consent was obtained from all
patients. Two neuropathologists classified the samples according to
2007 WHO classification.
DNA extraction and genome-wide DNA
methylation profiling
Hematoxylin and eosin-stained frozen sections were
prepared for the assessment of the percentage of tumor cells before
DNA extraction. Only samples with >80% tumor cells were
selected. Genomic DNA was isolated from frozen tumor tissues using
the QIAamp DNA Mini kit (Qiagen, Hilden, Germany) according to the
manufacturer’s protocol. DNA concentration and quality were
measured using the NanoDrop ND-1000 spectrophotometer (NanoDrop
Technologies, Houston, TX, USA).
A series of 119 glioma samples (63 low-grade
gliomas, 33 anaplastic gliomas and 23 glioblastomas) were measured
by methylation microarray. We used the Illumina Infinium Human
Methylation 27K BeadChip (Illumina Inc., San Diego, CA, USA) as
described (18). The BeadChip
contains 27,578 highly informative CpG sites covering >14,475
human RefSeq genes. This allows researchers to interrogate all
sites per sample at single nucleotide resolution. Bisulfite
modification of DNA, chip processing and data analysis were
performed following the manufacturer’s instructions. Array results
were analyzed with the BeadStudio software (Illumina Inc.). The
methylation data were uploaded to the CGGA database (http://www.cgga.org.cn).
RNA extraction and gene expression
profiling
Frozen sections were stained with hematoxylin and
eosin following standard protocols and examined using light
microscopy. Samples were reviewed prior to RNA extraction and
confirmed to contain ≥80% tumor cells. Total RNA from frozen tumor
tissue was extracted using the mirVana miRNA isolation kit (Ambion,
Austin, TX, USA) according to the manufacturer’s protocol. RNA
quantity, quality and integrity were verified using the NanoDrop
ND-1000 spectrophotometer and the Agilent Bioanalyzer 2100
(Agilent, Santa Clara, CA, USA).
Microarray analysis was performed on the same cohort
of 119 glioma samples measured by methylation microarray using
Agilent Gene Expression Oligo Microarrays containing >41,000
probe sets for ~27,958 human genes. Processing was performed
according to the Agilent One-Color Microarray-Based Gene Expression
Analysis Protocol. Average values of replicate spots for each gene
were background subtracted, normalized,
log2-transformed, and subjected to further analysis. The
expression data were also uploaded to the CGGA database (http://www.cgga.org.cn).
Pyrosequencing analysis of PDE4C
Pyrosequencing was performed by Gene Tech (Shanghai,
China) using the PyroMark Q96 ID System (Qiagen), according to the
manufacturer’s protocol. Bisulfite modification of the DNA was
performed using the EpiTect kit (Qiagen). The primers 5′-GGG GTT
TTA TTA TGT TGG TTA GGA T-3′ and 5′-biotin-TCA AAA ACC CTC TCT AAT
CAT TAA-3′ were used for polymerase chain reaction (PCR)
amplification and the primer 5′-TTA TTA TGT TGG TTA GGA TG-3′ for
pyrosequencing. The PDE4C promoter was considered hypermethylated
when methylation was >80% and hypomethylated when methylation
was <20% (P<0.001).
Immunohistochemistry
Immunohistochemistry was performed as previously
described (19). Briefly, surgical
biopsies were fixed in formalin, processed and paraffin embedded.
Five micron-thick sections were prepared, and immunohistochemical
staining with streptavidin-biotin immunoperoxidase assay was
performed using a rabbit polyclonal antibody to PDE4C (OriGene,
Rockville, MD, USA). Negative controls were obtained by
substituting primary antibodies with non-immune serum. The degree
of immunostaining was viewed and scored separately by two
independent investigators. Scores were determined by the proportion
of positively stained tumor cells (2). Sections with <30% labeled cells
indicated low PDE4C expression, whereas sections with labeling of
≥30% indicated high PDE4C expression.
Gene ontology analysis of
PDE4C-associated genes
After Pearson correlation analysis, gene ontology
(GO) analysis of positively correlated genes (r>0.4, P<0.05)
was analyzed by DAVID (http://david.abcc.ncifcrf.gov/home.jsp).
Gene set variation analysis with PDE4C
expression
With the gene lists obtained from the GO terms
(GO:0043065 and GO:0030335), gene set variation analysis (GSVA) was
performed in R.
Cell lines and drug treatments
The glioblastoma cell lines U87MG, U251 and H4 were
purchased from the Chinese Academy of Sciences Cell Bank (Shanghai,
China), and were maintained in Dulbecco’s modified Eagle’s medium
(DMEM) supplemented with L-glutamine and 10% fetal bovine serum
(FBS) (both from HyClone, Waltham, MA, USA). Cells were treated
with 5 μM 5-Aza-2′-deoxycytidine (5-Aza-dC; Sigma, St. Louis, MO,
USA) for 4 days (a fresh drug was added every 24 h), where
indicated.
Transfection of small interfering RNA and
plasmids
The small interfering RNA (siRNA) duplexes for
targeted silencing of PDE4C were prepared using the Trilencer-27
siRNA kit (OriGene). Briefly, 1×10⁵ U87 cells were
plated and grown in 6-well plates 24 h before transfection. When
cells were at 70% confluence, 800 ml Opti-MEM (Life Technologies,
San Diego, CA, USA) were added per well, and cells were serum
starved for 40 min. siRNA1, the most efficient of the three siRNAs
screened, was used to knock down PDE4C (sequence,
5′-ACAAUCAAGCUCUUAGUUAUAGGTG-3′). A blast search of the human
genome database was carried out to ensure that the sequence would
not target other transcripts. For each well, 0.1 nM siRNA1 was
mixed with 5 μl of Lipofectamine 2000 (Invitrogen, Carlsbad, CA,
USA) in 250 μl of Opti-MEM. The mixture was incubated for 30 min at
room temperature and then added to cells. Serum was added 4 h later
to a final concentration of 10%. Total protein was collected for
western blot analysis after 48 h.
PDE4C2, as one of the transcripts of human PDE4C,
was chosen to carry out our experiments. Previous studies have
shown that PDE4C2 expressed by COSI cells have typical bioactivity
and bind to rolipram (20). The
PDE4C2 expression plasmid was constructed by cloning the
full-length PDE4C2 open reading frame into the eukaryotic
expression vector pCMV6-Entry, with SgfI and MluI
restriction enzyme sites (OriGene). Plasmid construct sequences
were confirmed by DNA sequencing. Cells were cultured in 6-well
plates for 24 h and transfected with pCMV6-Entry-PDE4C or empty
vector pCMV6-Entry, using Lipofectamine 2000. The primer pairs were
designed as previously described, and PCR and DNA sequencing
confirmed all constructs.
Reverse transcription-polymerase chain
reaction
PDE4C DNA fragments (−713 to −1,207) were amplified
by PCR using U87, U251 and H4 genomic DNA as the template. RNA was
isolated using TRIzol (Invitrogen). One microgram of RNA was
reverse transcribed using Moloney murine leukemia virus (M-MLV)
(Takara, Shiga, Japan) and amplified using specific primers. The
primer pairs were designed as follows: forward, 5′-GGC CTC CAA CAA
GTT CAA GCG G-3′ and reverse, 5′-CAC GTC GTG GAT GGC GCT TGC-3′.
PCR was carried out for 21 cycles (98°C for 10 sec, 68°C for 60
sec) in a final volume of 25 μl containing 5X PrimeSTAR GXL Buffer
(Mg2+ Plus), dNTP mixture (2.5 mM each), and 0.25 μl
PrimeSTAR GXL DNA Polymerase (1.25 U/μl). Random reverse
transcription-PCR (RT-PCR) primers contained a
nonadeoxyribonucleotide mixture; pd(N)9 (Takara).
Glyceraldehyde-3-phosphate dehydrogenase was used as an internal
control to ensure cDNA quality and loading accuracy. Amplification
products were resolved by 1.5% agarose gel electrophoresis and
visualized by ethidium bromide staining.
Western blotting
Cells were directly lysed in NP-40 buffer on
ice-containing protease inhibitors. Protein lysates were resolved
on 10% SDS polyacrylamide gel, and electrotransferred to PVDF
membranes (Millipore, Bedford, MA, USA), and blocked with 5% nonfat
dry milk in Tris-buffered saline, pH 7.5. Membranes were
immunoblotted overnight at 4°C with an anti-PDE4C polyclonal
antibody (OriGene), or a p53 antibody that selectively recognizes
WT p53 protein (Oncogene Research Products, Uniondale, NY, USA),
monoclonal anti-β-tubulin (Sigma) was used as a control. All
primary antibodies were followed by their respective HRP-conjugated
secondary antibodies.
Flow cytometric analysis of
apoptosis
Apoptosis was examined using a fluorescein
isothiocyanate (FITC) Annexin V apoptosis detection kit
(Becton-Dickinson, San Jose, CA, USA) according to the
manufacturer’s instructions. Briefly, 1×10⁴ U87 cells
were harvested and washed with cold PBS. The cells were resuspended
in 250 μl of 1X binding buffer, from which 195 μl were transferred
to a 1.5-ml culture tube and 5 μl of Annexin V-FITC and 10 μl
propidium iodide were added. Cells were vortexed and incubated for
10 min in the dark. Three hundred microliters of 1X binding buffer
was then added to each tube.
Flow cytometric analysis was performed immediately
after staining. Data acquisition and analysis were performed by
fluorescence-activated cell scanner flow cytometer
(Becton-Dickinson). Cells in the early stages of apoptosis were
Annexin V-positive and PI-negative, whereas cells in late-stage
apoptosis were positive for both Annexin V and PI.
Cell migration assay
The cell migration assay was carried out in 24-well
cell culture chambers using Transwell inserts (Corning Life
Sciences, Corning, NY, USA) with an 8-μ pore membrane precoated
with Matrigel (BD Biosciences, San Jose, CA, USA). U87 cells were
plated at a density of 5×10³ per upper well in 200 μl
culture medium (DMEM, no FBS), for the empty plasmid group and the
PDE4C group. The lower chamber was filled with 500 μl medium (DMEM,
12% FBS). The cells were allowed to invade for 24 h, after which
the non-migrating cells with Matrigel matrix were removed from the
upper surface of the membrane by scrubbing with a cotton-tipped
swab. Cells on the lower surface of the filter were fixed for 30
min in methanol and glacial acetic acid mixture (3:1), air-dried
briefly, and stained with crystal violet. The mean number of
invaded cells was counted from five preselected microscopic fields
at ×200 magnification. All experiments were performed in
triplicate.
Statistical analysis
Significance analysis of microarrays (SAM) was used
for genes differentially methylated and expressed between high- and
low-grade glioma. Cox regression analysis was performed using
Matlab (MathWorks, Natick, MA, USA). Kaplan-Meier survival curves
were obtained, and differences in OS were tested using the log-rank
test (GraphPad Prism 5). Differences of tumor cell apoptosis and
migration between treated and control groups were analyzed by a
t-test. Differences in promoter methylation in the control
experiment were evaluated using a Chi-square test. A P-value of
<0.05 was considered to indicate a statistically significant
difference.
Results
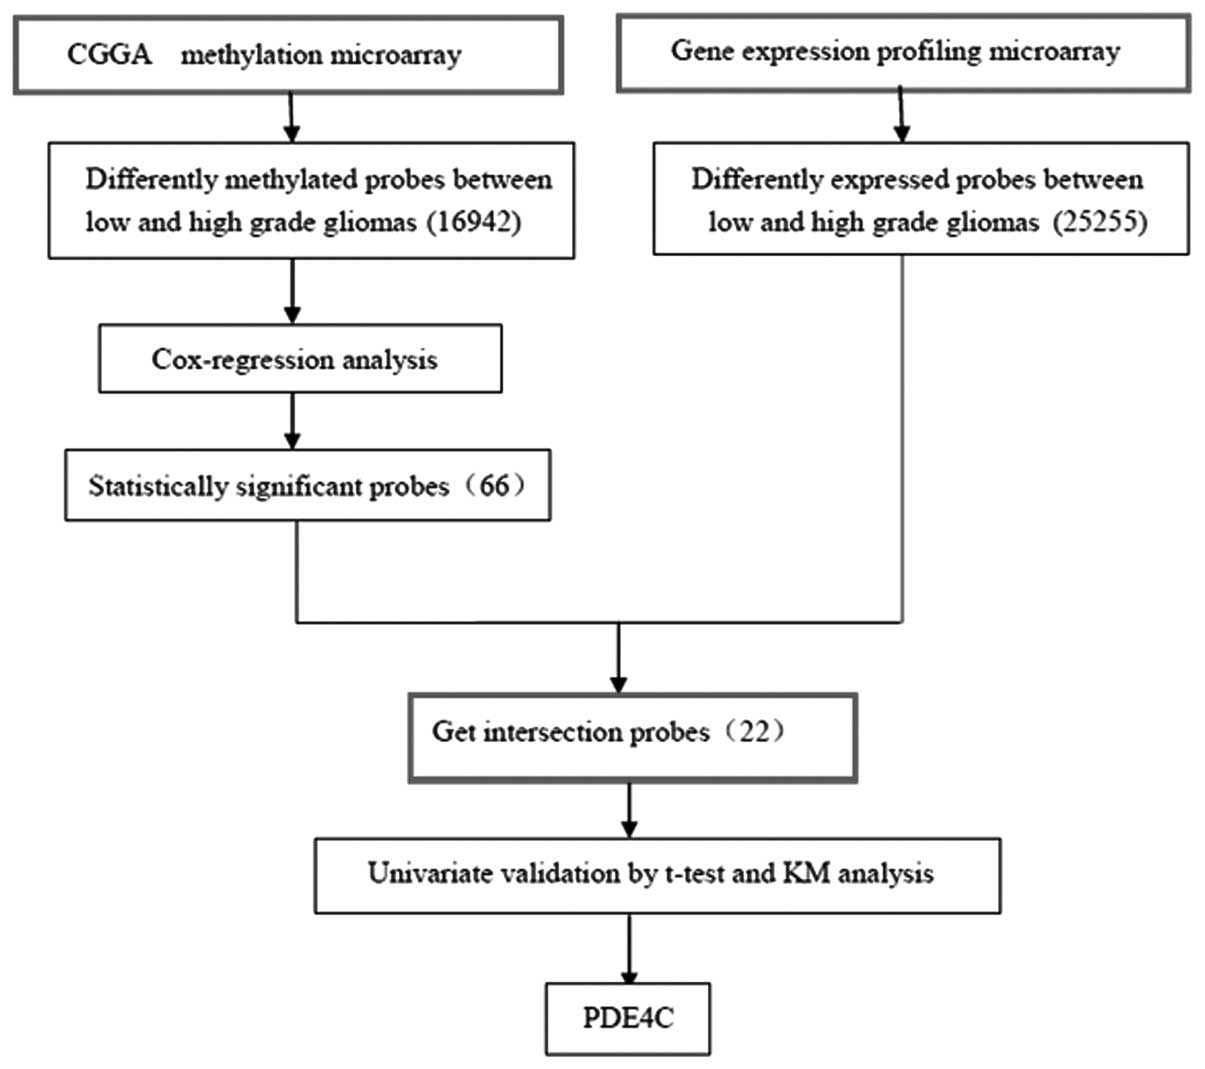
Gene screening
The methylation microarray from Illumina contains
27,578 highly informative CpG sites covering >14,475 human
RefSeq genes. After SAM between high- and low-grade gliomas, with
FDR of <0.2, 16,942 probes were eliminated. Cox regression
analysis left 66 probes. Gene expression profiling was used to
screen 25,255 probes for differential expression between high- and
low-grade gliomas by SAM. Intersection of the 66 probes set and the
differentially expressed genes yielded 22 probes of interest. After
univariate analysis validation using a t-test and Kaplan-Meier
survival curves (by log-rank), two genes remained, PDE4C and
CAMKK2. PDE4C was the gene we selected (Fig. 1).
Hypermethylation of PDE4C is associated
with grade progression in CGGA and The Cancer Genome Atlas (TCGA)
data
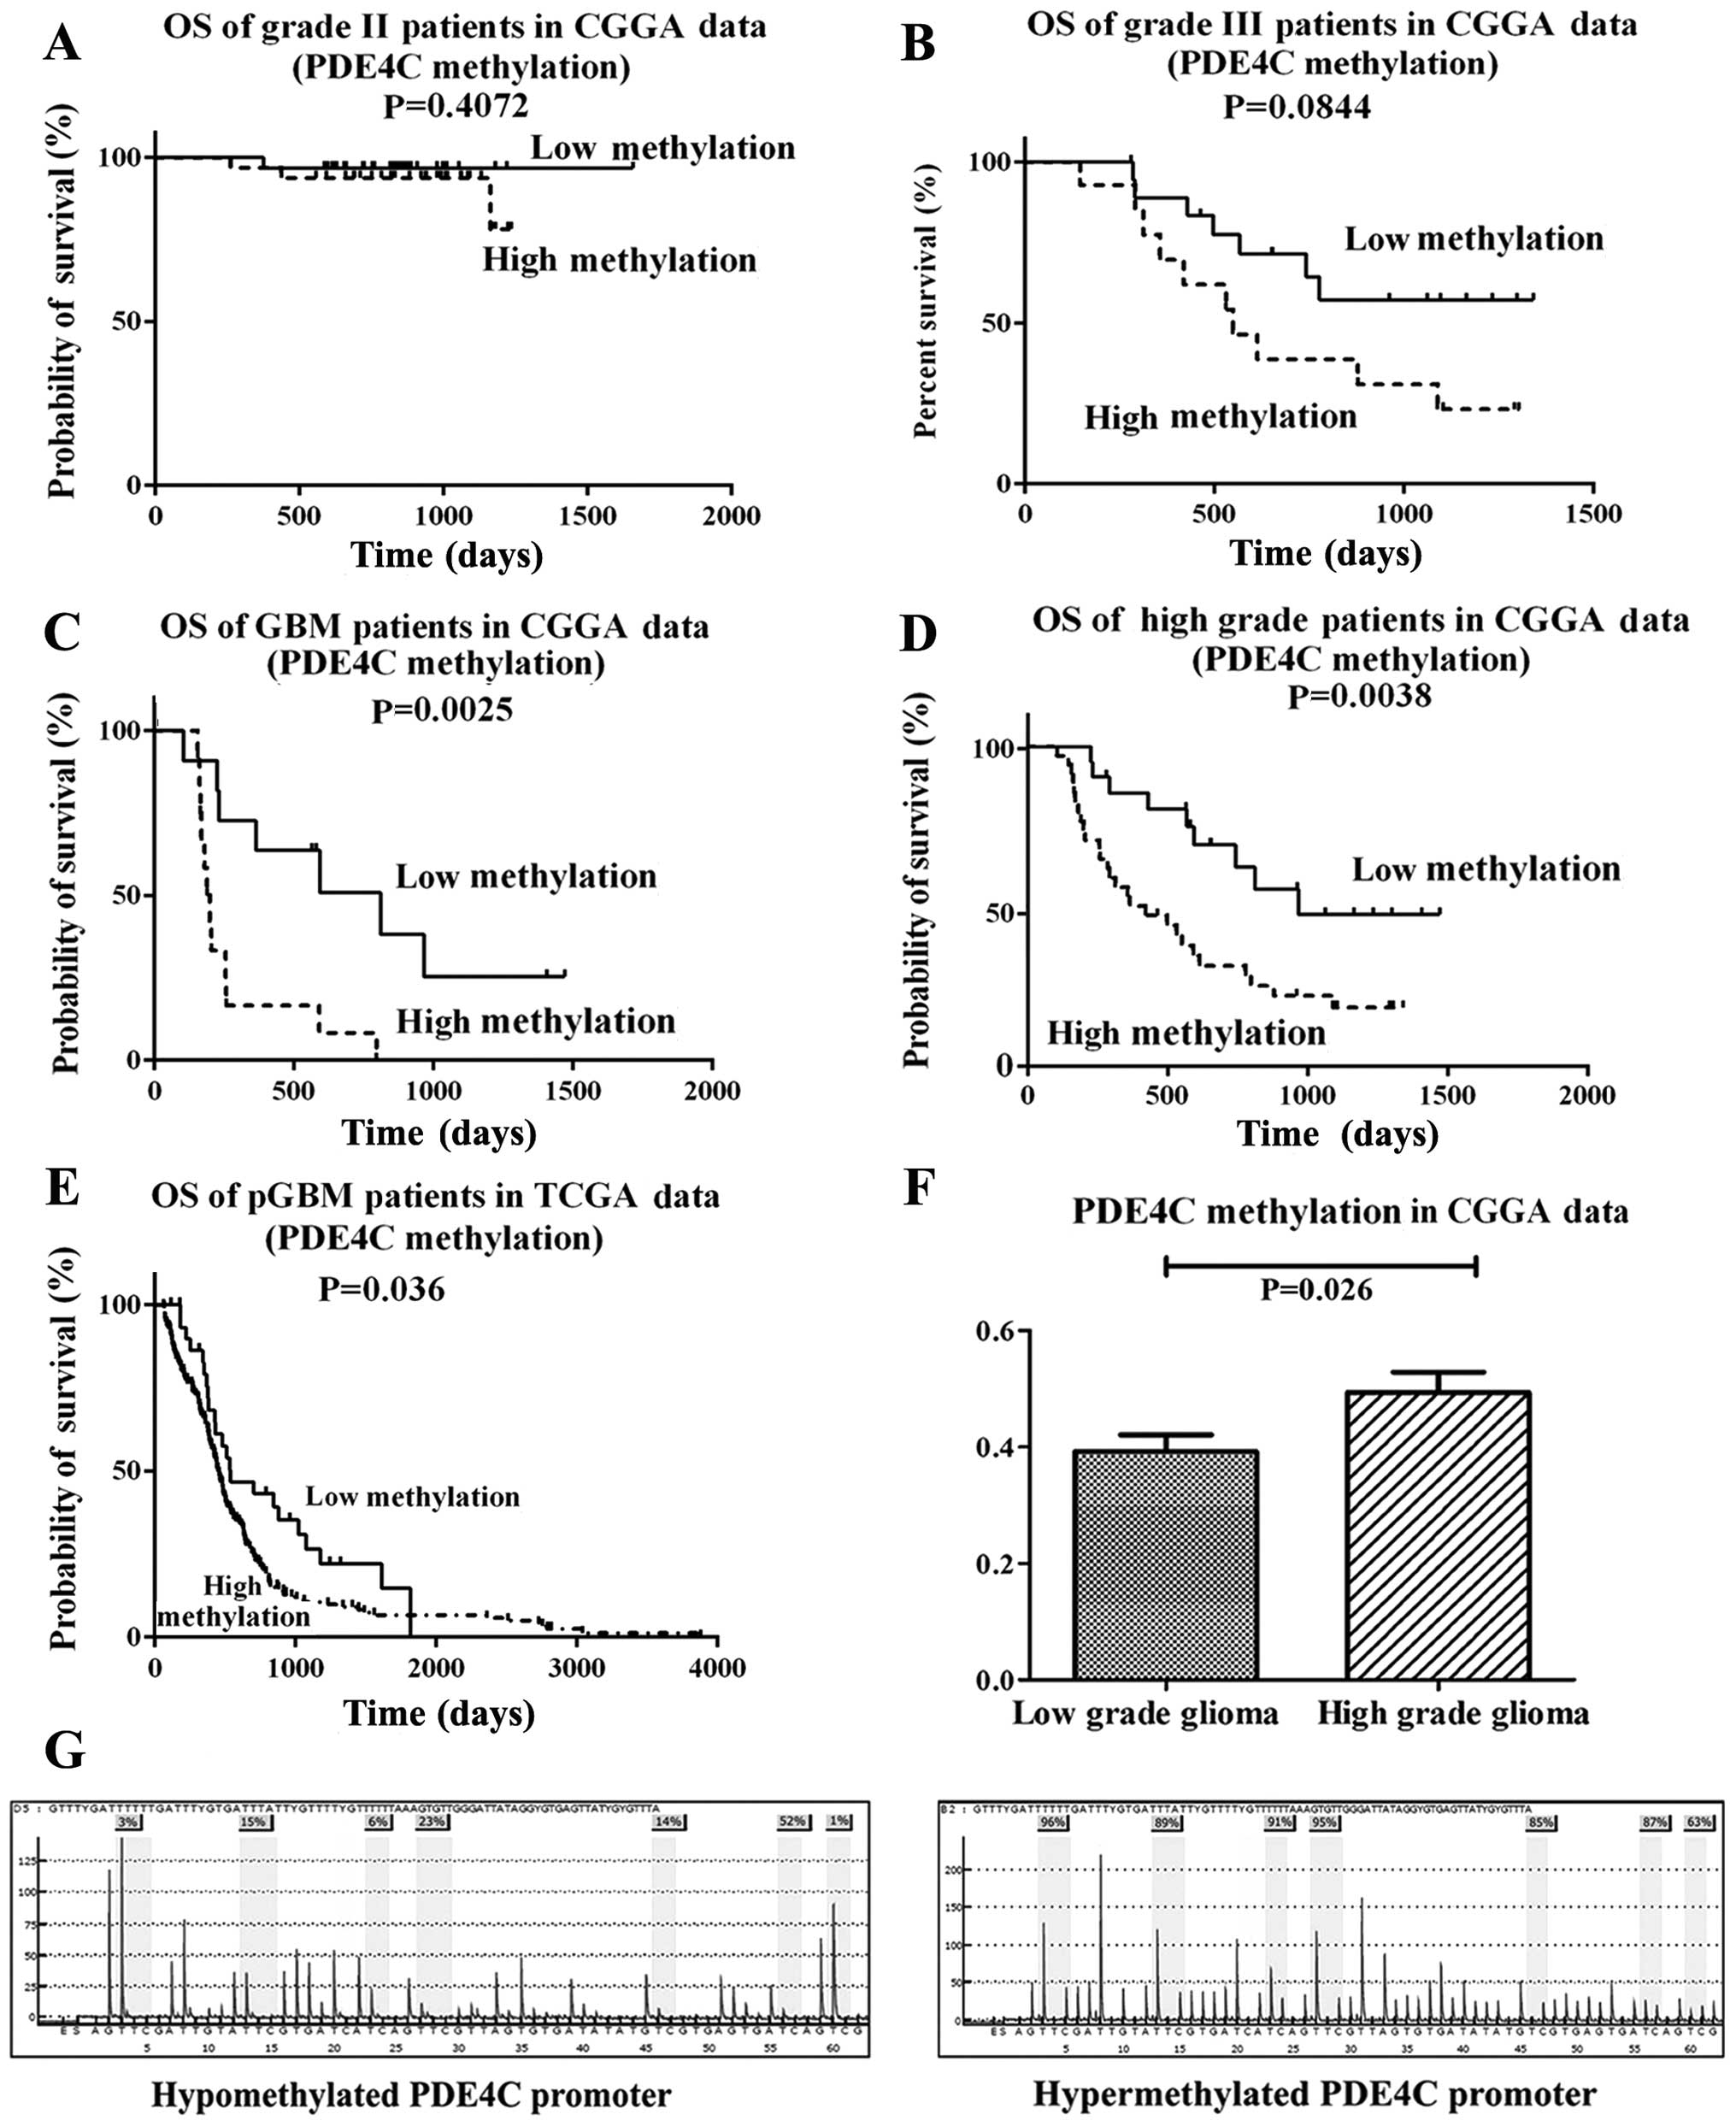
We measured the methylation level of PDE4C in 119
glioma samples (63 low-grade gliomas, 33 anaplastic gliomas and 23
glioblastomas) via microarray. PDE4C promoter methylation level in
the CGGA data had no significant difference on survival in grade II
patients (P=0.4072) (Fig. 2A).
Marginal P-value in grade III patients is shown in Fig. 2B (P=0.0844). Significant at
P<0.05 in GBM and high grade patients in CGGA data is shown in
Fig. 2C and D. When considering
TCGA data, significant at P=0.036 in pGBM patients is shown in
Fig. 2E. PDE4C was also found
markedly hypermethylated in high-grade gliomas (P=0.026) (Fig. 2F) Furthermore, we analyzed the
independent prognostic value of PDE4C methylation. Patients with
low PDE4C methylation levels had a longer median OS (not reached)
compared with patients with high methylation levels (419 days)
(Table I). Preoperative KPS score
(P=0.004) and extent of resection (P=0.034) also correlated with
OS. There were no significant associations between age, gender and
OS. The multivariate Cox proportional hazards model, after
adjusting for KPS score and extent of resection, identified PDE4C
hypermethylation as an independent unfavorable prognostic factor
(P=0.047).
 | Table IOS-related variables from 56
high-grade glioma methylation microarray univariate and
multivariate analyses. |
Table I
OS-related variables from 56
high-grade glioma methylation microarray univariate and
multivariate analyses.
| Univariate
analysis | Multivariate
analysis |
|---|
|
|
|
|---|
| Variable | No. of patients | Median OS (days) | 95% CI (days) | P-value | Relative risk | 95% CI | P-value |
|---|
| Gender |
| Male | 23 | 591 | 248–745 | | | | |
| Female | 33 | 497 | 317–865 | 0.528 | | | |
| Age (years) |
| ≤50 | 39 | 613 | 239–987 | | | | |
| >50 | 17 | 497 | 52–941 | 0.084 | | | |
| KPS |
| <80 | 19 | 290 | 135–445 | | | | |
| ≥80 | 37 | 878 | NR | 0.004 | 0.452 | 0.210–0.973 | 0.042 |
| Extent of
resection |
| Total | 17 | NR | NR | | | | |
| Subtotal | 37 | 147 | 241–819 | 0.034 | 2.424 | 0.981–5.993 | 0.055 |
|
PDE4C-methylation |
| Low | 21 | NR | NR | | | | |
| High | 35 | 419 | 160–678 | 0.003 | 2.418 | 1.011–5.785 | 0.047 |
Pyrosequencing analysis of PDE4C
Representative examples of PDE4C promoter
methylation in glioma patients is shown in Fig. 2G. PDE4C promoter hypermethylation
was detected in 29/37 high-grade cases (78.38%), whereas just 12/18
low-grade samples (66.67%) were hypermethylated. The methylation
level of PDE4C promoter in the training and validation group was
consistent (P=0.4905, Chi-square test).
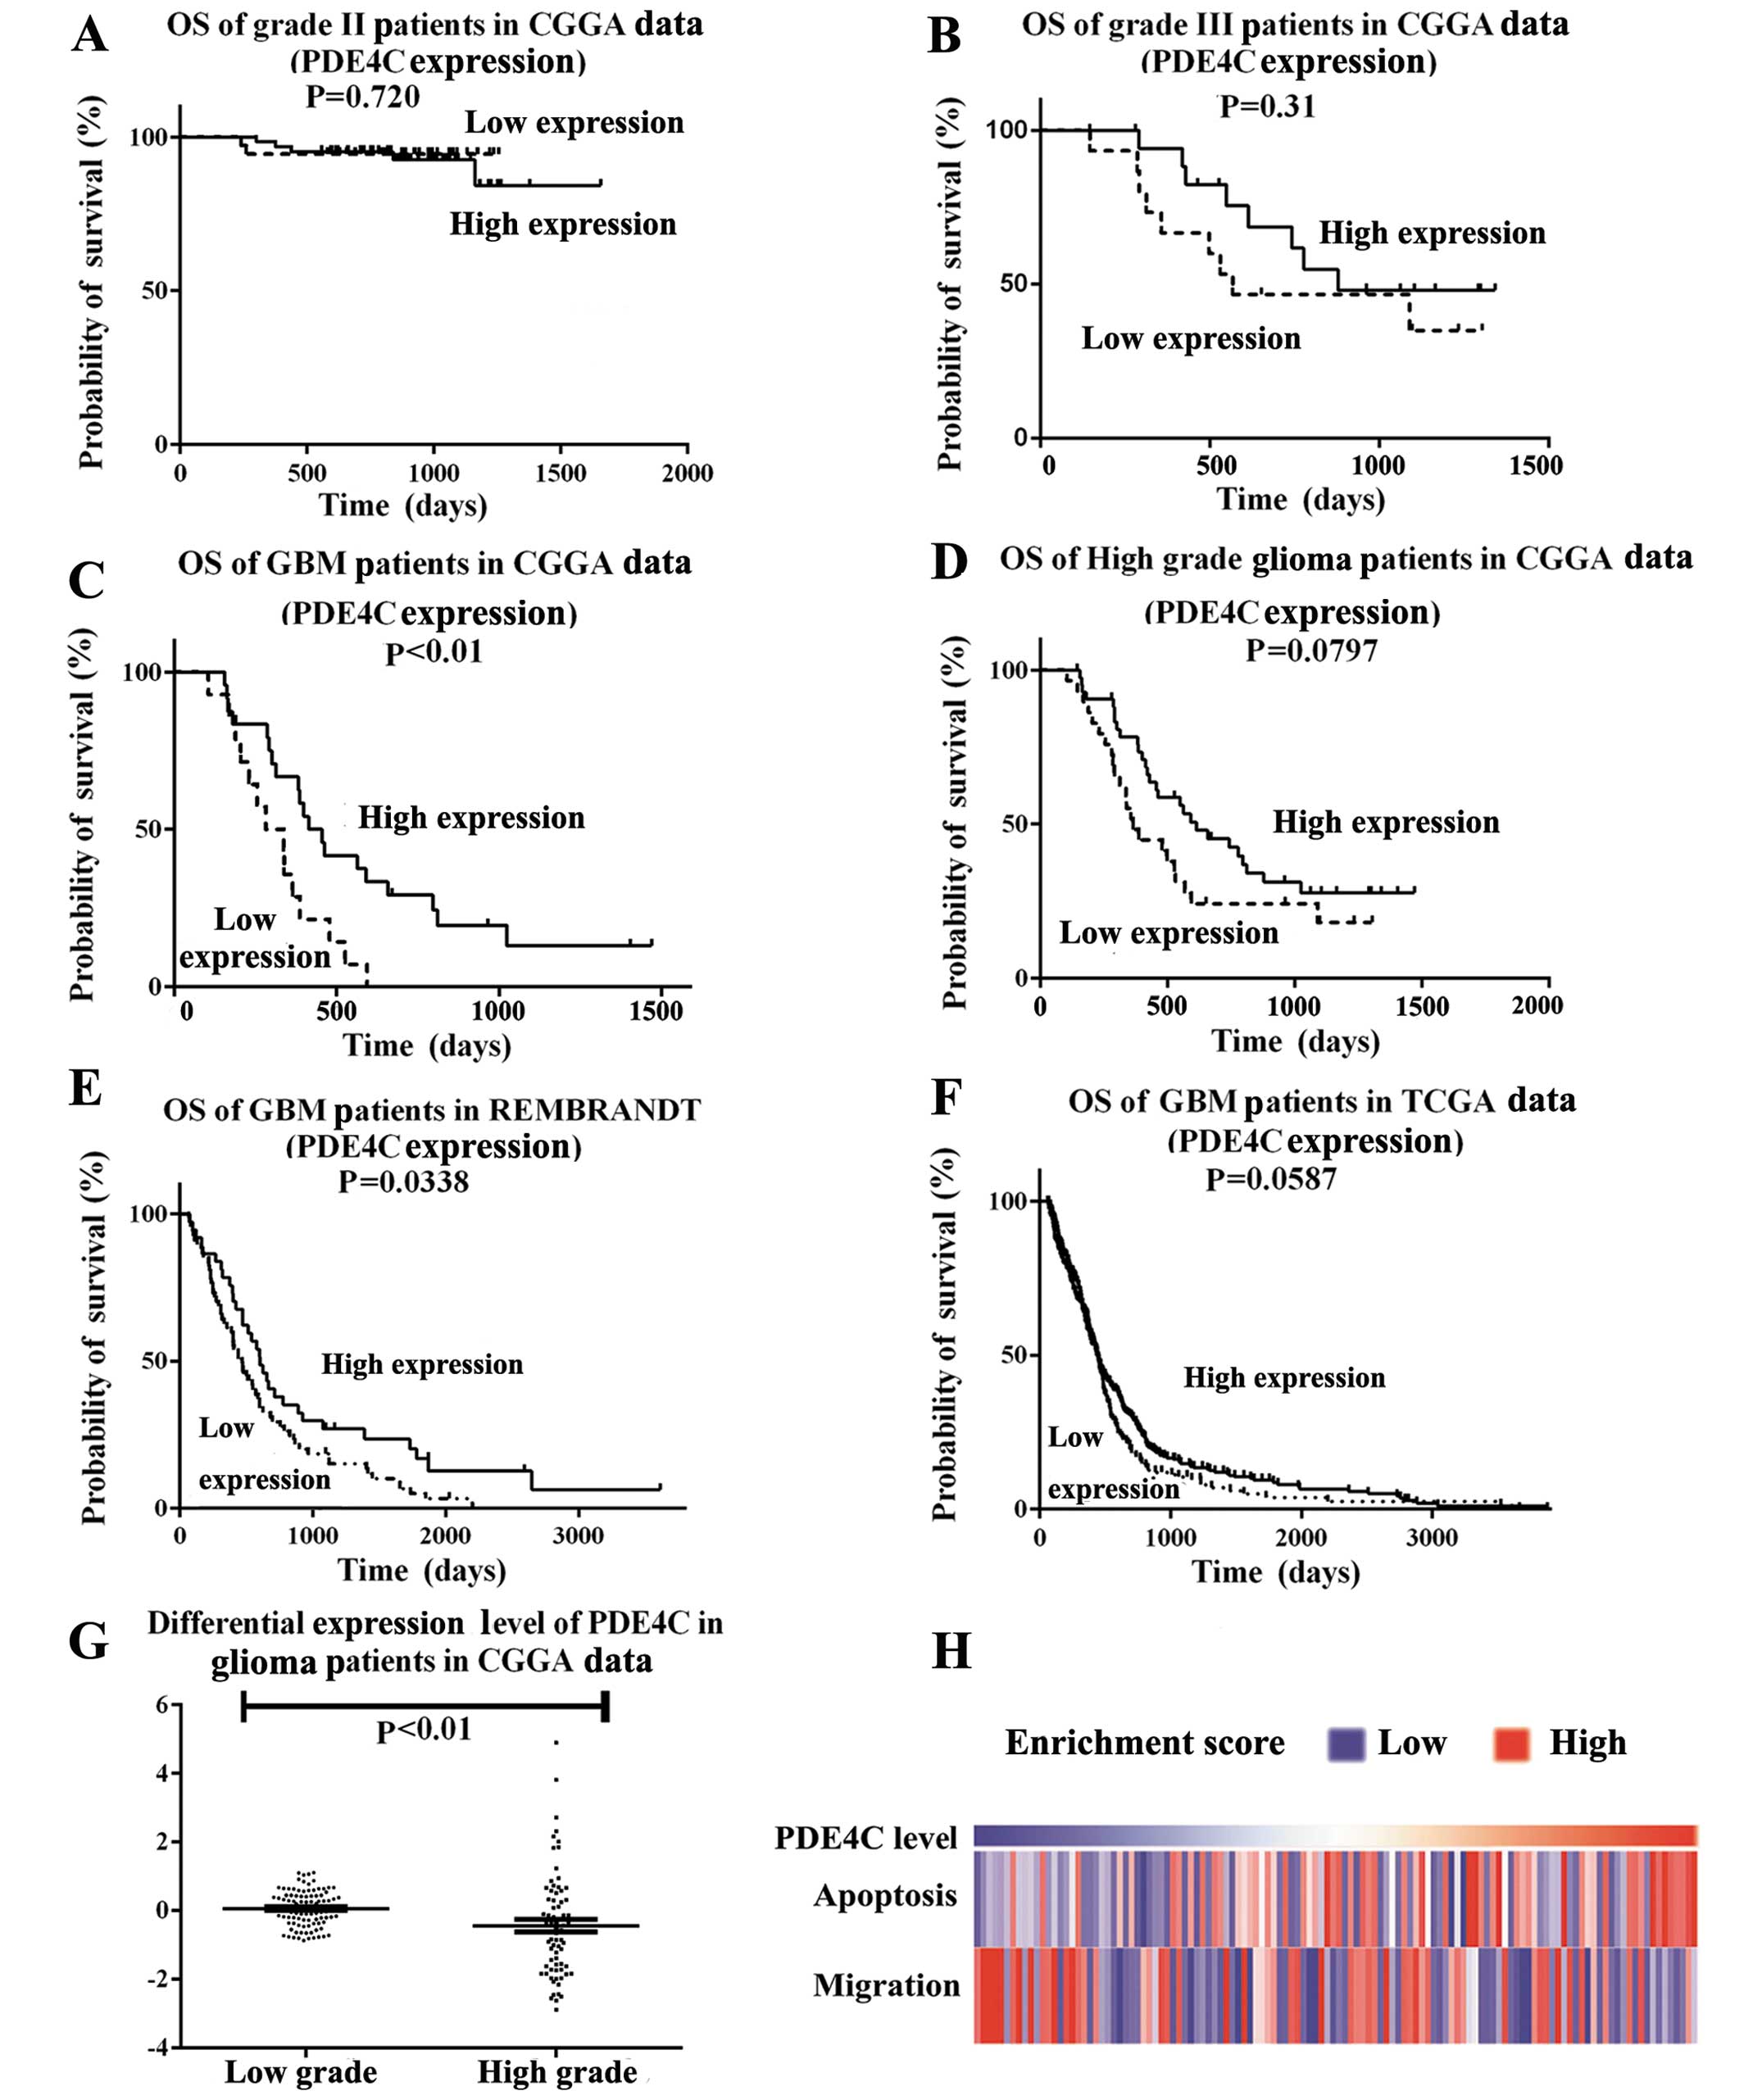
Expression of PDE4C is associated with
grade progression in CGGA, TCGA and REMBRANDT data
Expression profile analysis indicated PDE4C
expression was decreased progressively in higher-grade gliomas
compared with lower-grade gliomas. The CGGA patient cohort was the
same for the gene expression dataset and methylation dataset. We
found PDE4C expression level in the CGGA data had no significant
difference on survival in grade II and III patients, (P=0.720,
P=0.31) (Fig. 3A and B). However,
significant at P<0.05 was shown in GBM patients in CGGA data
(P<0.01) (Fig. 3C) and REMBRANDT
(P=0.0338) (Fig. 3E). In CGGA and
TCGA data, P-value was marginally significant in high grade
patients in CGGA (P=0.0797) (Fig.
3D) or GBM patients in TCGA (P=0.0587) (Fig. 3F). PDE4C expression levels were
lower in high- than in low-grade glioma patients (P<0.01)
(Fig. 3G). GSVA analysis also
showed that migration-related genes accumulated in patients with
lower PDE4C expression, and apoptosis-related genes indicated the
reverse (Fig. 3H).
Protein expression of PDE4C is inversely
correlated with glioma-grade progression and shows prognostic value
in high-grade glioma patients
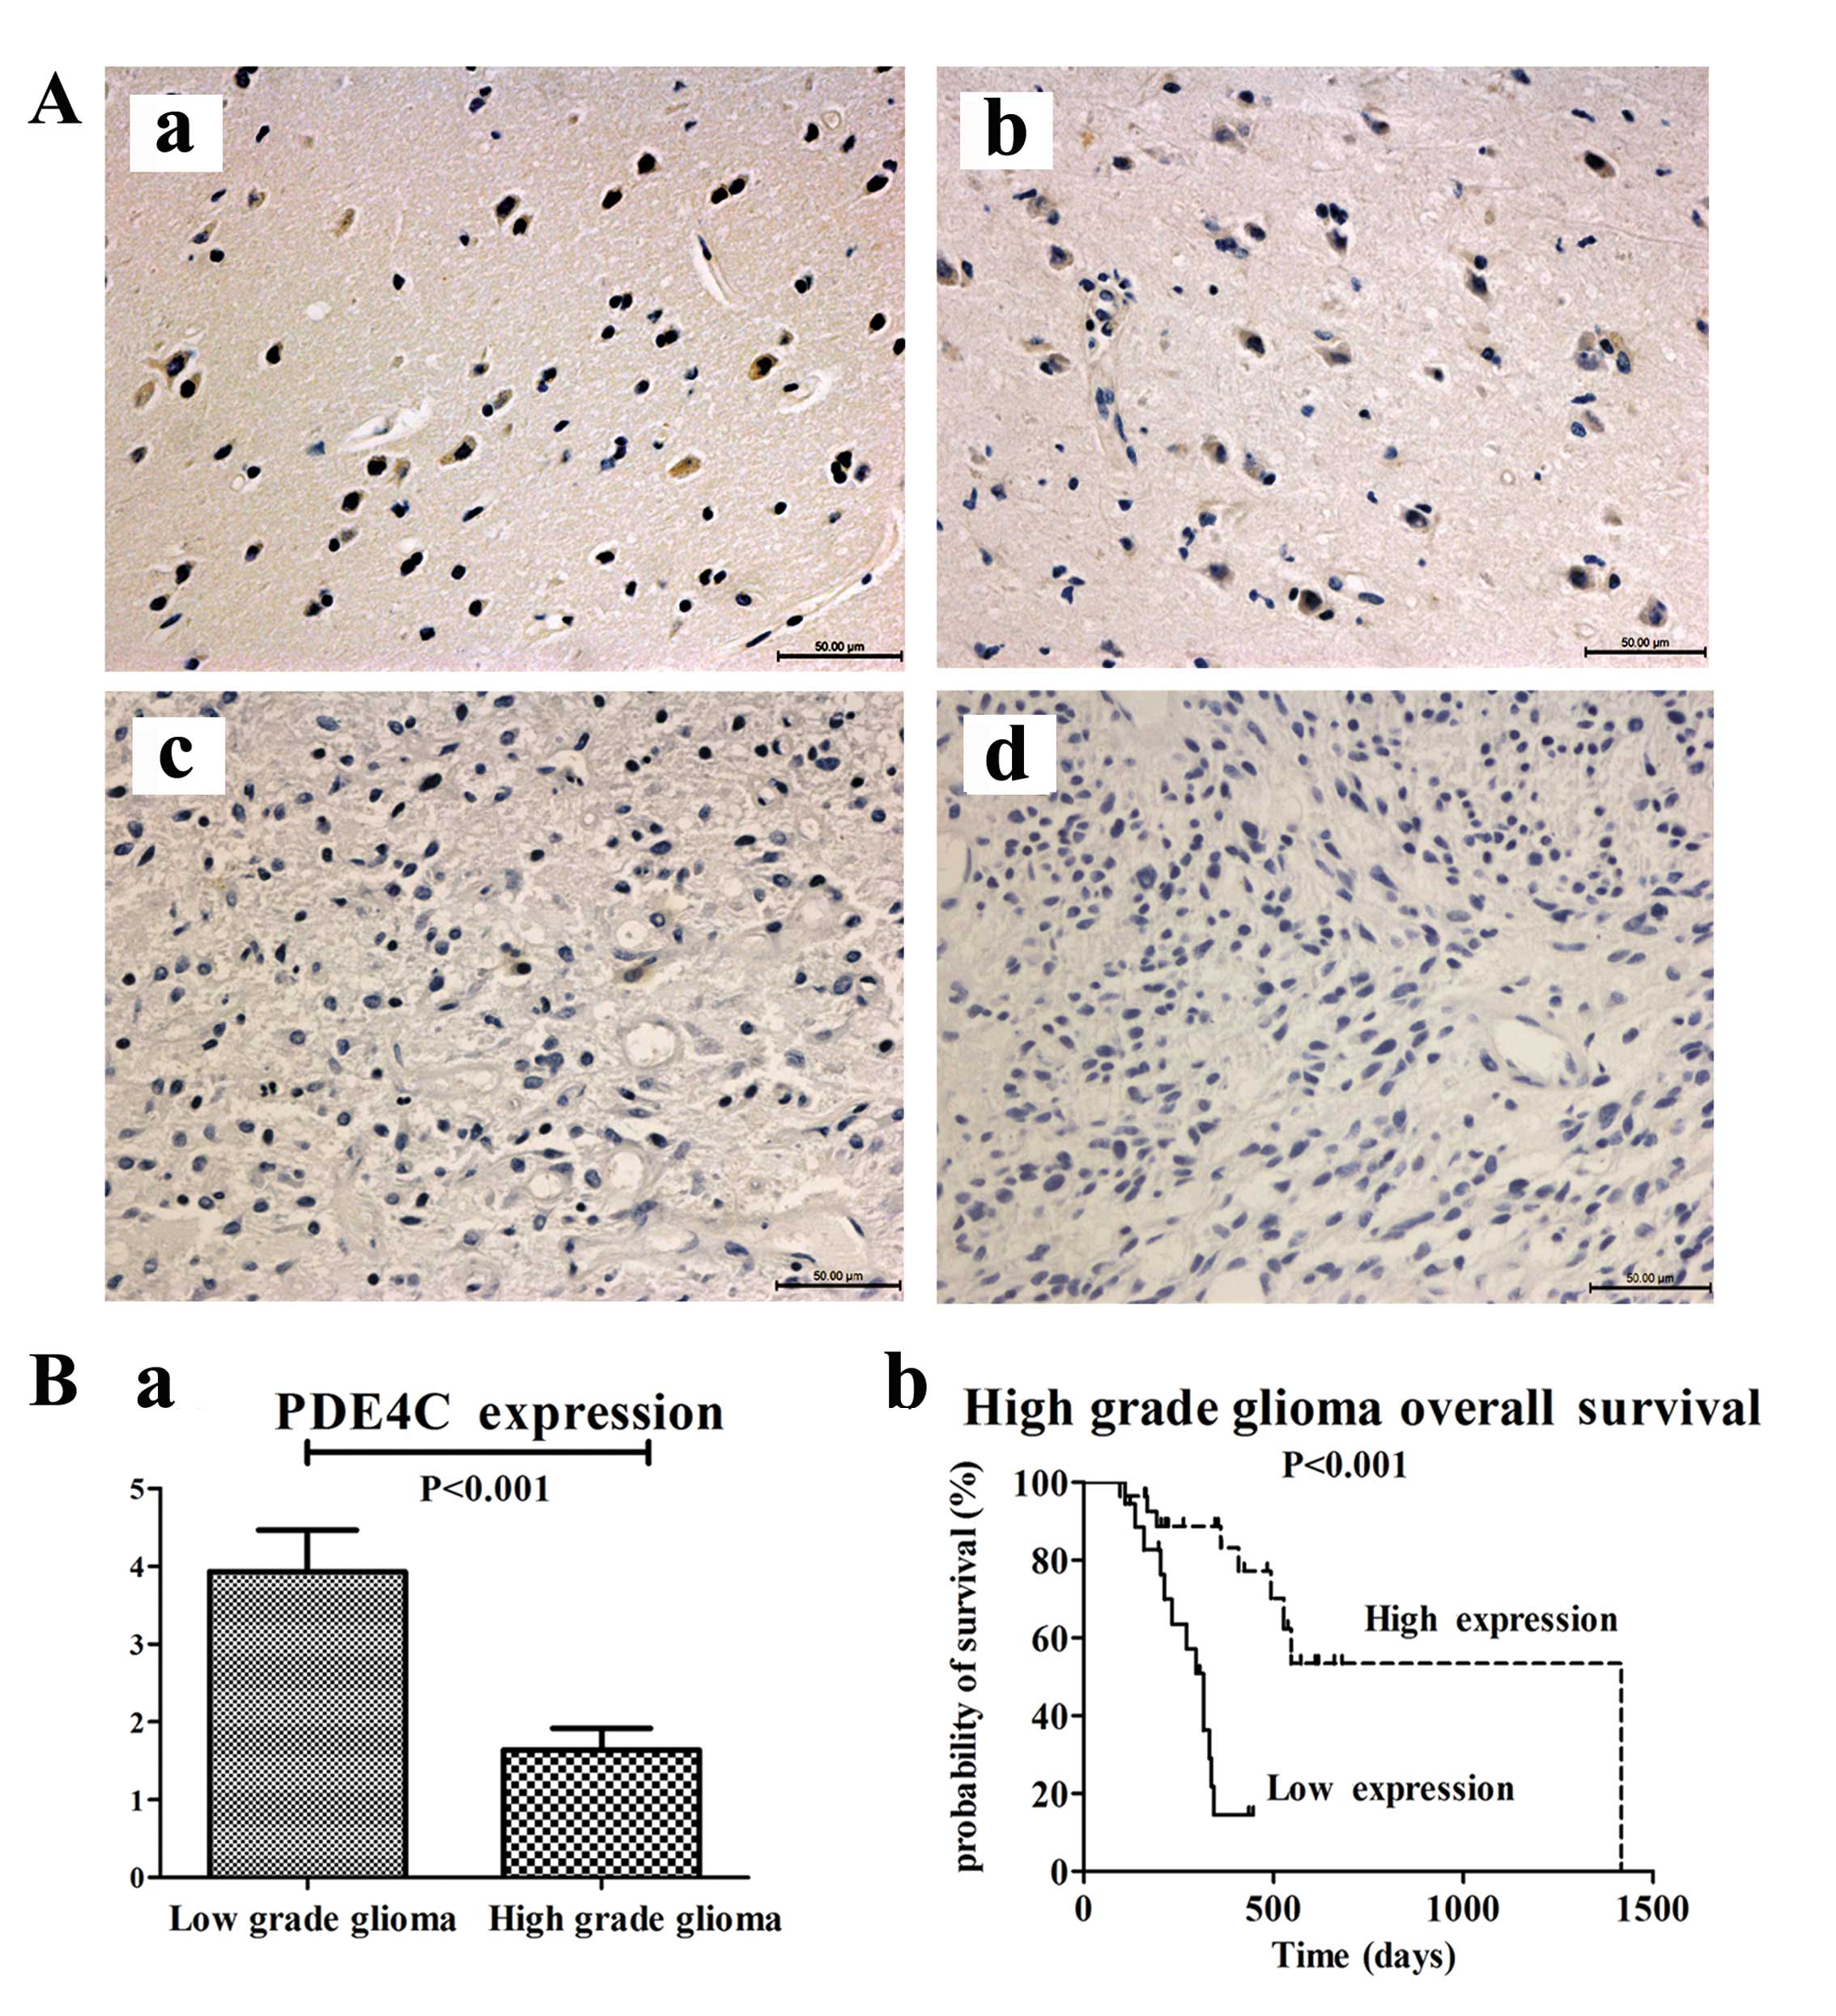
We measured PDE4C protein levels through
immunohistochemical staining in 87 paraffin-embedded glioma samples
and 5 normal brains from mainland Han Chinese glioma patients or
traumatic brain injury patients. The 92 patients consisted of 5
brain trauma patients, 29 patients with astrocytoma (A, WHO grade
II), 22 with anaplastic astrocytoma (AA, WHO grade III) and 36 with
GBM (WHO grade IV). We analyzed the association between PDE4C
protein expression and histological grade of gliomas. PDE4C protein
was highly expressed in normal brains and lower grade gliomas
compared with higher grade gliomas (P<0.001) (Fig. 4A and B). In normal brain, the
percentage of PDE4C+ cells/tot nuclei was 55%; in grade II glioma,
the percentage was 49.33%. In grade III glioma, the percentage was
6.25%. In GBM, the percentage was only 1%. In addition, survival
analysis showed that patients with low PDE4C expression had notably
poorer survival (P<0.001) than those with high expression in
high-grade glioma patients (Fig.
4B).
Patients with high PDE4C expression levels had a
longer median OS time (546 days) compared with those with low level
expression (331 days) (Table II).
Preoperative KPS score (P=0.025) and gender (P=0.028) also
correlated with OS. There were no significant associations with age
or extent of resection and OS. The multivariate Cox proportional
hazards model, after adjusting for gender and KPS score, identified
PDE4C expression as an independent prognostic factor for OS
(P=0.034).
| Table IIOS-related variables from 46 (45
survivors) high-grade glioma samples validated through univariate
and multivariate analyses. |
Table II
OS-related variables from 46 (45
survivors) high-grade glioma samples validated through univariate
and multivariate analyses.
| Univariate
analysis | Multivariate
analysis |
|---|
|
|
|
|---|
| Variable | No. of
patients | Median OS
(days) | 95% CI (days) | P-value | Relative risk | 95% CI | P-value |
|---|
| Gender |
| Male | 31 | 572 | 380–764 | | | | |
| Female | 14 | 345 | 238–451 | 0.028 | 0.544 | 0.224–1.323 | 0.179 |
| Age (years) |
| ≤50 | 22 | 572 | 387–757 | | | | |
| >50 | 24 | 354 | 320–388 | 0.273 | | | |
| Extent of
resection |
| Total | 16 | 345 | 207–483 | | | | |
| Untotal | 29 | 493 | 360–626 | 0.196 | | | |
| KPS |
| <80 | 28 | 362 | 189–535 | | | | |
| ≥80 | 17 | 572 | 389–755 | 0.025 | 0.510 | 0.181–1.432 | 0.201 |
|
PDE4C-expression |
| Low | 18 | 331 | 278–384 | | | | |
| High | 28 | 546 | 433–659 | 0.004 | 0.345 | 0.129–0.923 | 0.034 |
PDE4C is associated with cell migration
and cAMP-mediated signaling
Pearson correlation analysis of the CGGA mRNA
expression data identified positively correlated genes that were
then used for GO analysis. The top 10 GO terms indicated PDE4C is
associated with cell migration and cAMP-mediated signaling
(Table III).
| Table IIIGene sets enriched in high-grade
glioma samples with PDE4C expression. |
Table III
Gene sets enriched in high-grade
glioma samples with PDE4C expression.
| Name | Count | Fold
enrichment | P-value |
|---|
| GO:0005576 -
extracellular region | 804 | 1.390481 | 1.63E-32 |
| GO:0031226 -
intrinsic to plasma membrane | 517 | 1.479175 | 2.26E-27 |
| GO:0005887 -
integral to plasma membrane | 506 | 1.480605 | 6.92E-27 |
| GO:0016021 -
integral to membrane | 1789 | 1.174047 | 2.78E-26 |
| GO:0005886 - plasma
membrane | 1331 | 1.225 | 1.16E-25 |
| GO:0044421 -
extracellular region part | 374 | 1.354271 | 1.65E-12 |
| GO:0005615 -
extracellular space | 275 | 1.395556 | 5.71E-11 |
| hsa04630 - Jak-STAT
signaling pathway | 76 | 1.774584 | 1.88E-08 |
| GO:0019933 -
cAMP-mediated signaling | 50 | 1.89816 | 6.99E-07 |
| GO:0005230 -
extracellular ligand-gated ion channel activity | 41 | 2.038913 | 7.28E-07 |
| GO:0016338 -
calcium-independent cell-cell adhesion | 17 | 2.786845 | 1.46E-05 |
GSVA was also performed with PDE4C expression
(Fig. 3H). Migration-related genes
accumulated in patients with lower PDE4C expression. Based on
previous studies of cAMP-P53 (8,16), we
also examined apoptosis-related genes and found they accumulated in
patients with higher PDE4C expression.
Transcriptional silencing of PDE4C is
associated with promoter hypermethylation in glioma cells
To determine whether PDE4C promoter hypermethylation
in glioma is associated with PDE4C gene silencing, we measured
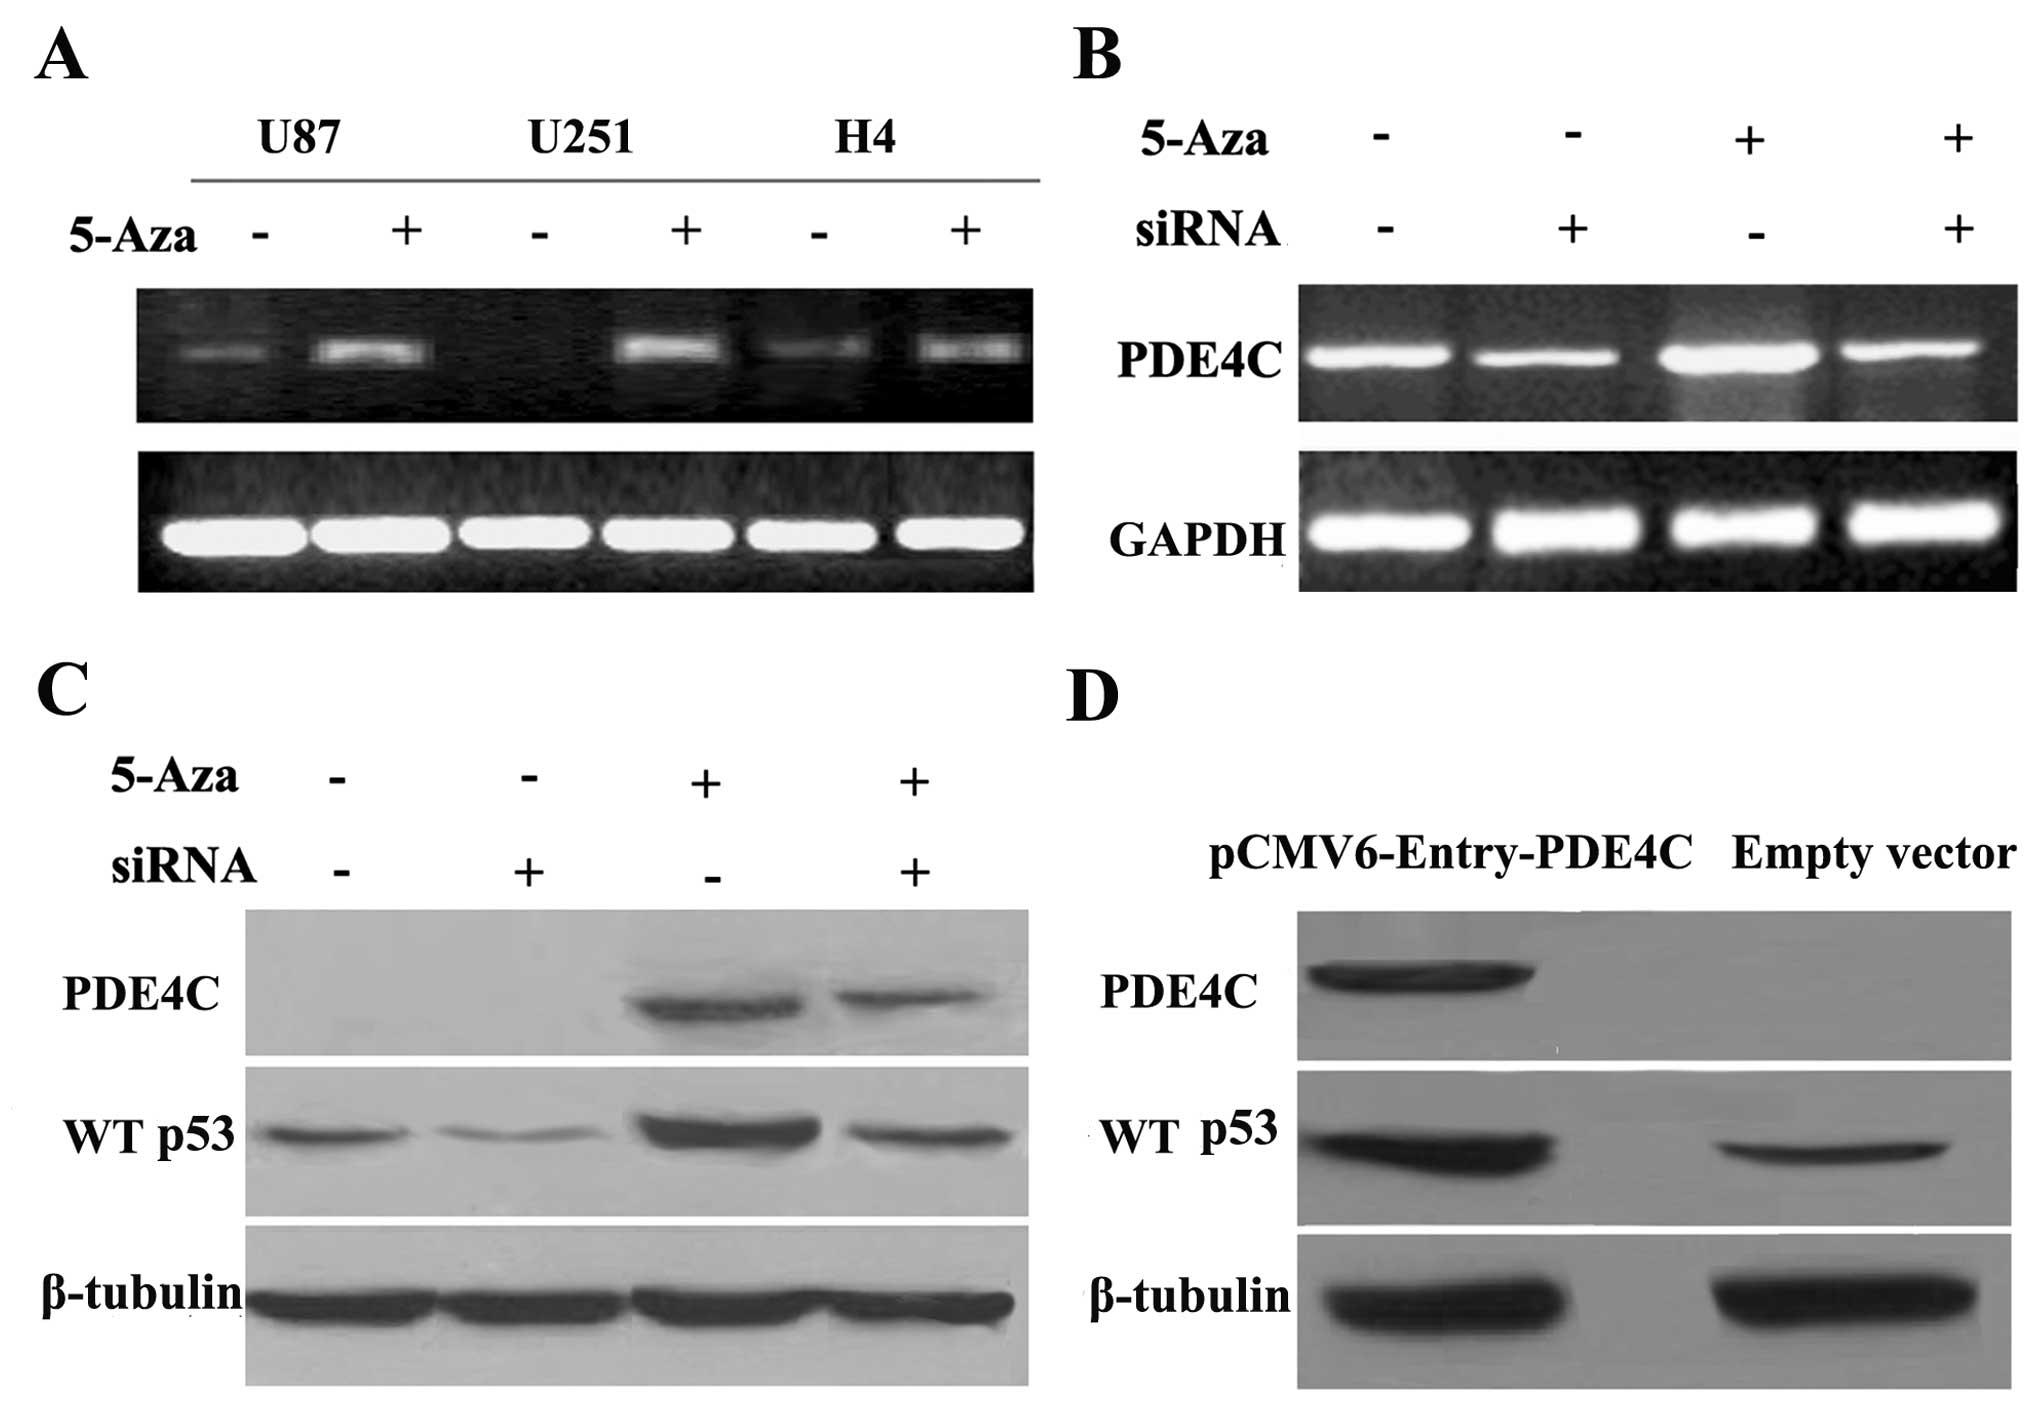
PDE4C mRNA expression in three glioma cell lines. Semi-quantitative
RT-PCR demonstrated that demethylation treatment by 5-Aza-2-dC
restored PDE4C mRNA expression in glioma cells (U87, U251 and H4)
(Fig. 5A), implicating DNA
methylation in the regulation of PDE4C expression. Thus, these
results indicate that transcriptional silencing of PDE4C in glioma
cell lines may be mediated by DNA promoter hypermethylation.
PDE4C methylation influences WT p53
expression
To examine the mechanism by which PDE4C expression
may regulate apoptosis through the WT p53 pathway, we knocked down
restored PDE4C using siRNA successfully (P=0.020 vs. restored
PDE4C) (Fig. 5B). We further
investigated in protein level and observed that WT p53
downregulation was associated with PDE4C expression levels in the
U87 cell line (P<0.01, vs. control) (Fig. 5C). To confirm that P53 is increased
due to the increase of PDE4C, we transfected pCMV6-Entry-PDE4C
plasmid and control vectors into U87. Then, we confirmed that WT
p53 upregulation is also dependent on PDE4C overexpression in the
U87 cell line (P<0.05) (Fig.
5D).
Ectopic expression of PDE4C induces U87
cell apoptosis and inhibits migration
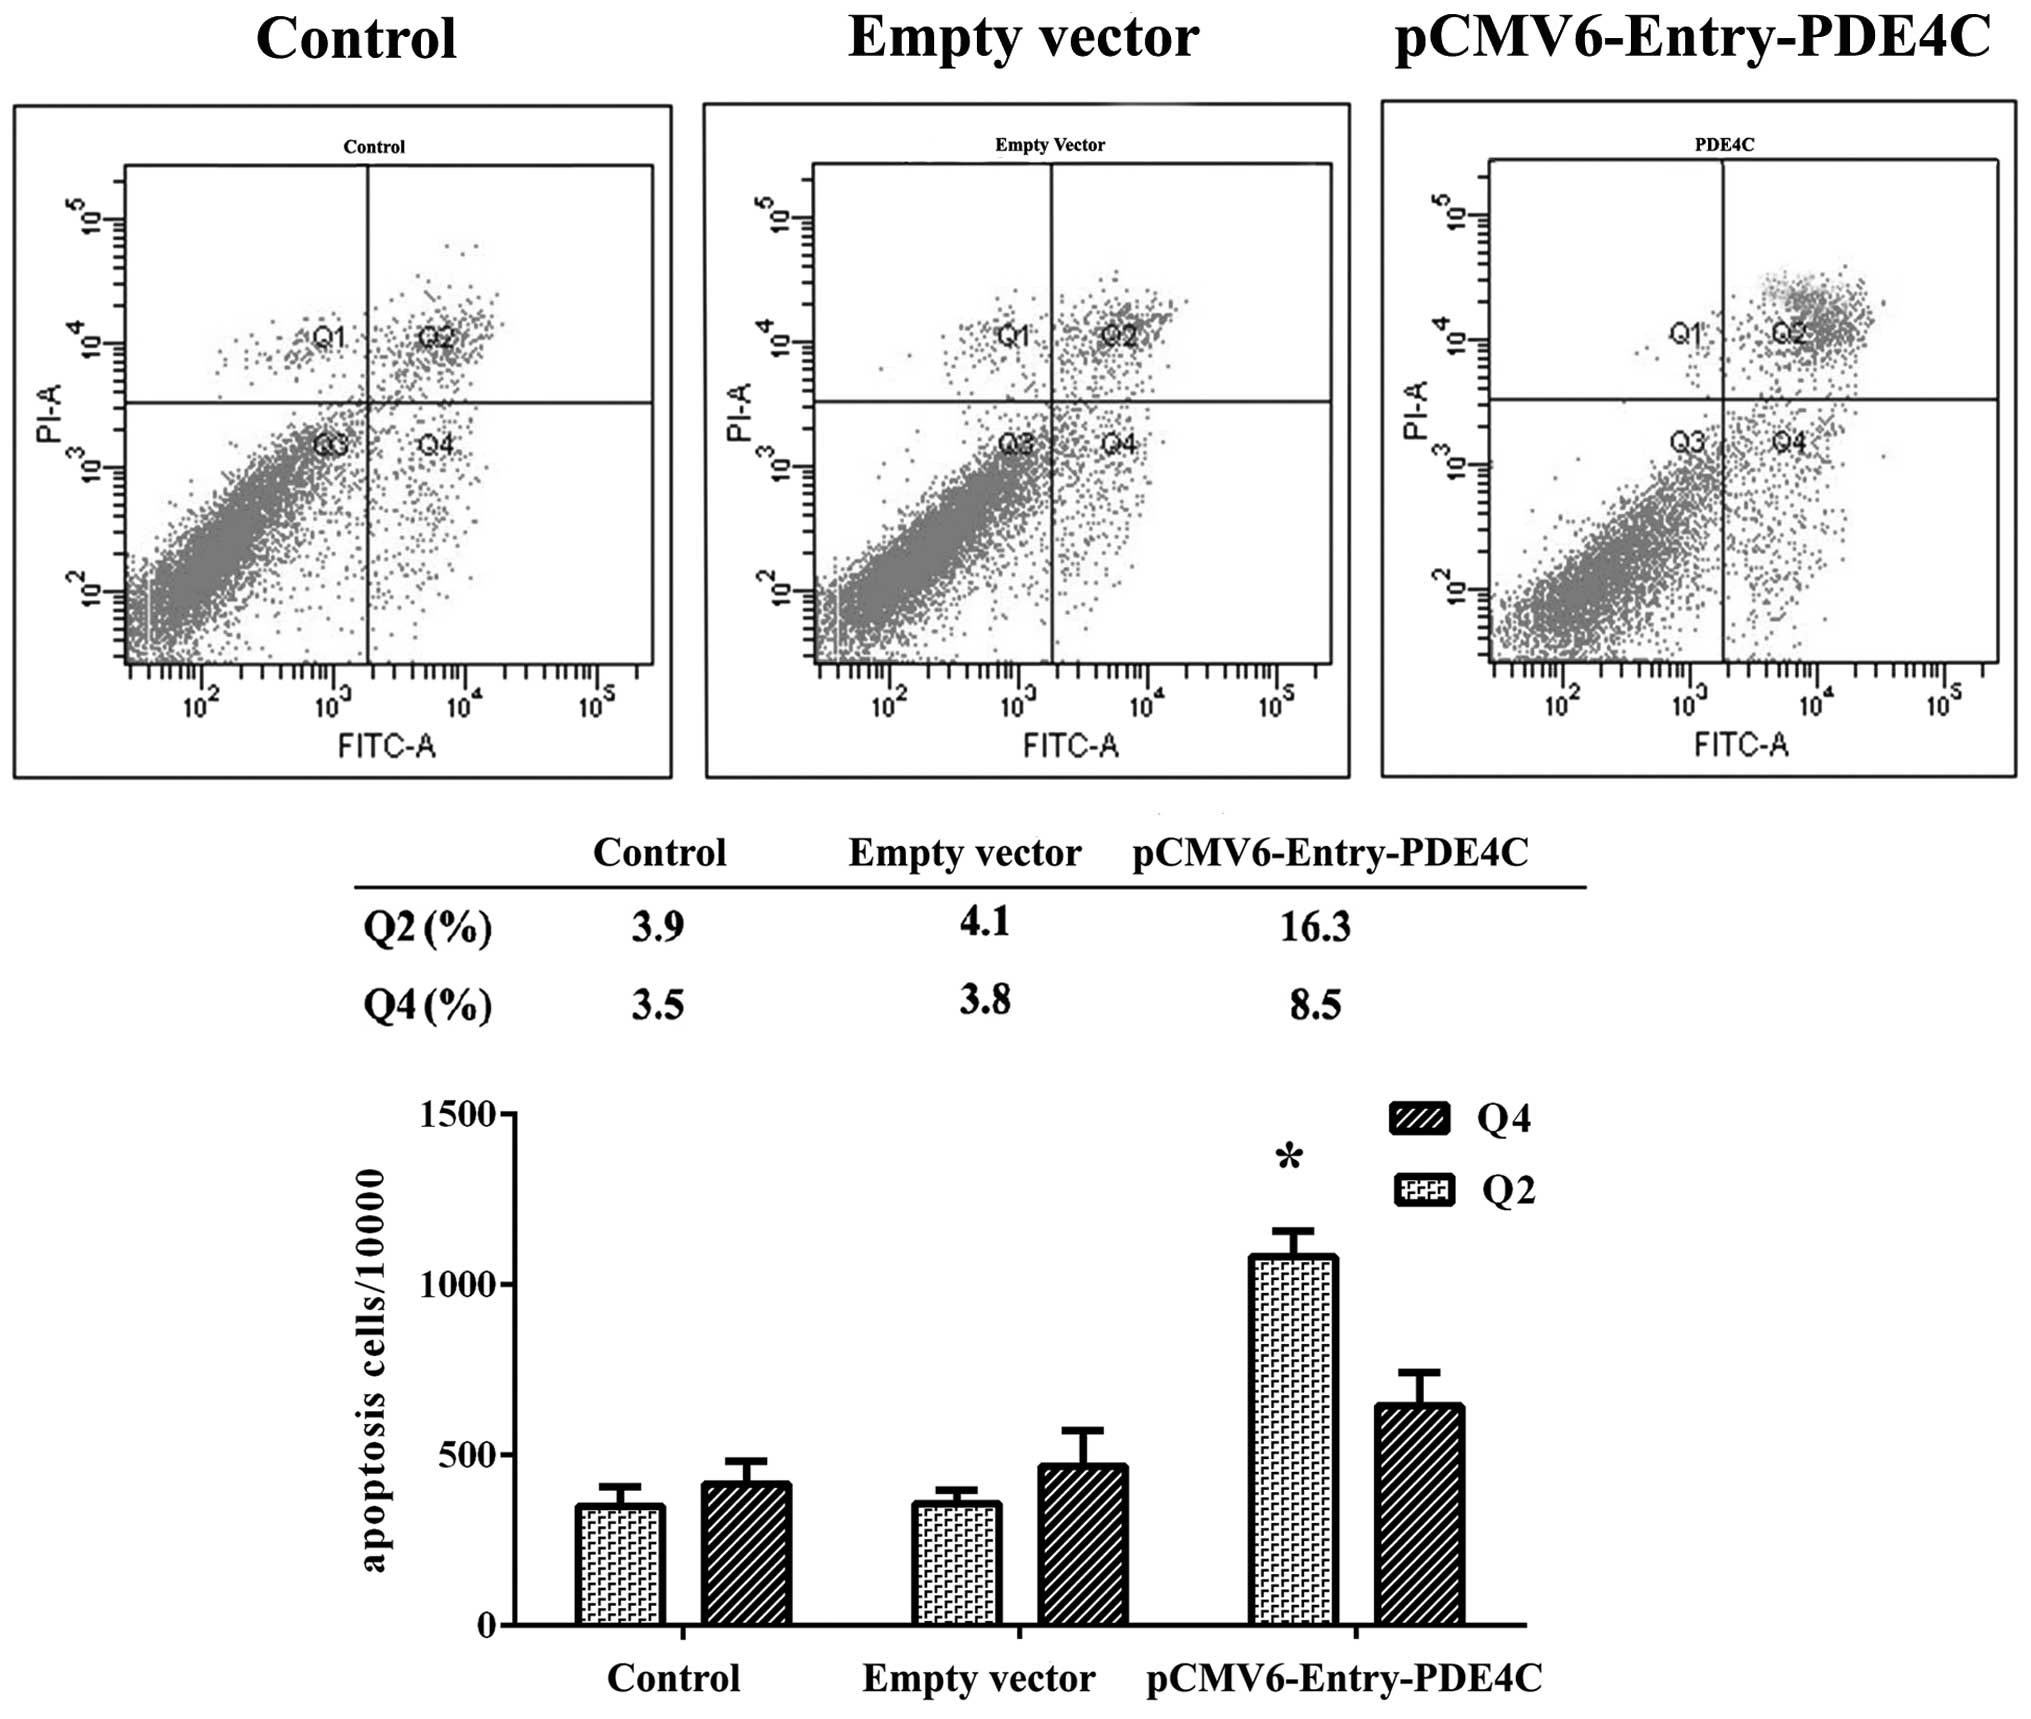
In the present study, we observed a difference in
U87 apoptosis 48 h following transient transfection with PDE4C and
control vectors using Annexin V-PI flow cytometry, and compared
with untreated U87 cells (P<0.05) (Fig. 6). Region Q2 indicates early-phase
apoptotic cells, whereas region Q4 indicates late-phase apoptotic
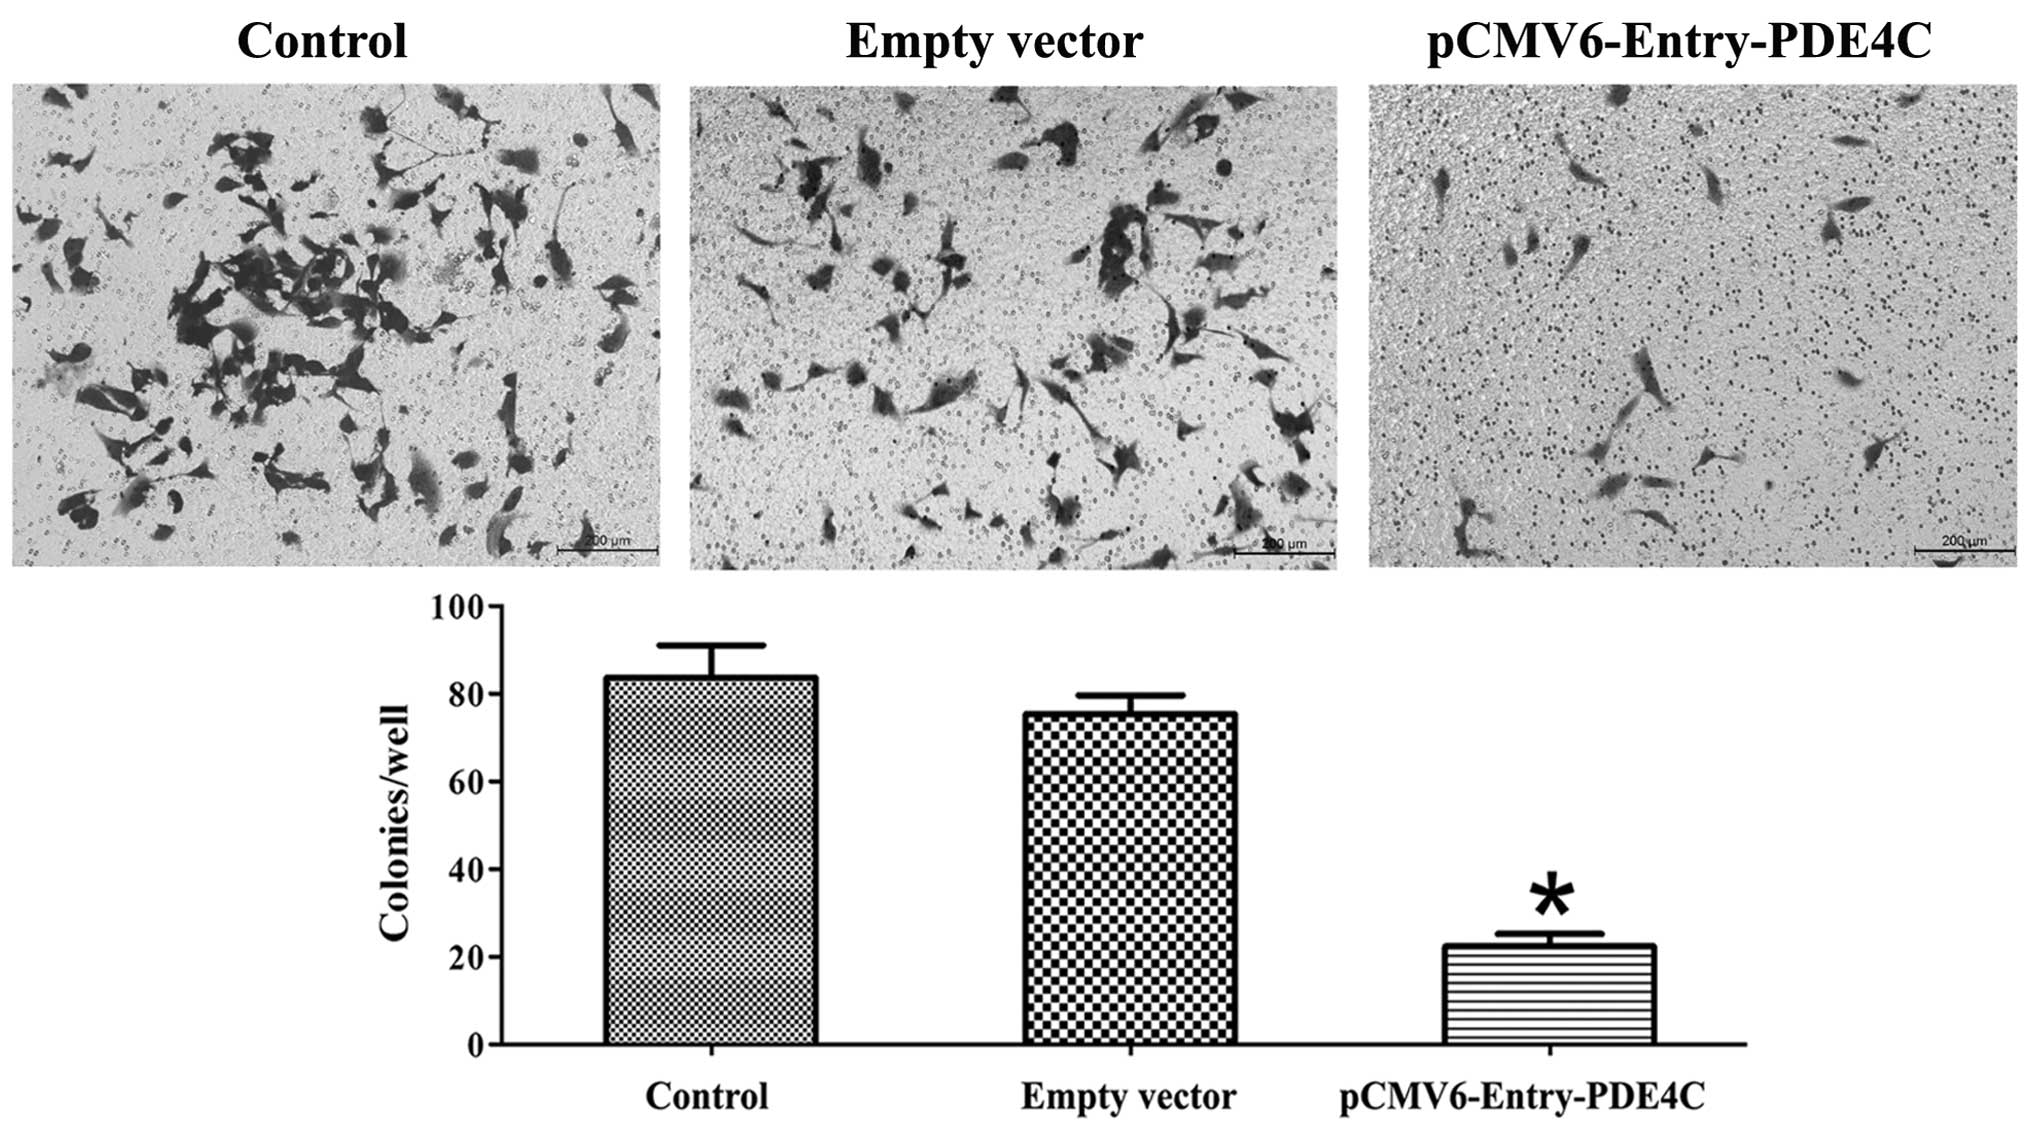
cells. Cells were further examined using the Transwell migration
assay, which showed that PDE4C inhibited U87 invasion (P<0.05)
(Fig. 7). All experiments were
performed in triplicate.
Discussion
Survival-associated genes in gliomas have been
reported in various studies (21–24).
Moreover, methylation microarray provides a more general,
prognostic, genome-wide methylation profiling, which may have a
role in individualized diagnosis and treatment. In addition, DNA
methylation is stable and can be detected using a number of
high-throughput and sensitive techniques with little patient
material (25).
In the present study, we identified an
epigenetically silenced gene, PDE4C, which may serve as a biomarker
for glioma progression and prognosis. Primarily, we carried out
genome-wide DNA profiling and found that PDE4C promoter methylation
levels are associated with glioma grade progression. When
correlated with data from gene expression profiling, we identified
PDE4C as differentially expressed in low- and high-grade gliomas.
We also found that promoter methylation and PDE4C expression levels
were consistently associated with glioma grade progression. To
confirm this finding, we showed that PDE4C transcription in glioma
was associated with promoter demethylation. We corroborated this
finding by pyrosequencing a large cohort of samples (total of
n=55), and showed that glioma PDE4C expression is negatively
associated with WHO grade classification. Protein expression was
examined in 87 glioma patient samples and five normal brain tissues
by immunohistochemical methods, which demonstrated a significant
decrease in PDE4C expression in low- and high-grade gliomas. The
results showed that both PDE4C promoter methylation and PDE4C
expression were independent prognostic factors in high-grade
gliomas, and revealed a correlation between PDE4C promoter
methylation, PDE4C expression and clinical outcome in glioma
patients.
Previous studies have shown that in malignant cells,
cAMP levels influence p53 function, potentially effecting WT p53
both as a tumor suppressor during cancer initiation and
maintenance, and as an effector of the apoptotic response to
DNA-damaging agents during anticancer treatment (8). PDE4s may be involved in this
progression. Our western blot analysis revealed that WT p53
expression is associated with PDE4C expression in U87 cell lines.
To show that WT p53 expression is regulated by PDE4C, we used PDE4C
knockdown using siRNA to restore WT p53 downregulation and
overexpression of PDE4C also influenced WT p53 expression. Our GO
and GSVA analysis, combined with PDE4C functional assays in U87
cell lines, strongly showed that PDE4C induces apoptosis and
inhibits glioma migration. To the best of our knowledge, this is
the first report on the methylation status, expression and function
of PDE4C in glioma.
In summary, PDE4C promoter hypermethylation is
associated with low PDE4C expression. Patients harboring
hypermethylation and low-level PDE4C expression have a poor
prognosis in high-grade glioma. On the basis of these observations
and subset analysis, it appears that PDE4C promoter methylation and
PDE4C expression can both serve as prognostic biomarkers for glioma
patients. PDE4C-induced apoptosis in glioma appears to involve the
cAMP-P53 pathway, although further research is required to fully
elucidate the role of PDE4C in cell migration.
Acknowledgements
The authors thank Dr Susan Furness for her critical
reading of the manuscript, Dr Wei Zhang and Dr Zheng Wang for their
help on microarray data analysis of this project. This study was
supported by grants from the National High Technology Research and
Development Program (no. 2012AA02A508), the International Science
and Technology Cooperation Program (no. 2012DFA30470), the National
973 Program (no. 2011CB707804), and the National Natural Science
Foundation of China nos. 91229121, 81201993 and 81071626.
References
|
1
|
Krex D, Klink B, Hartmann C, et al:
Long-term survival with glioblastoma multiforme. Brain.
130:2596–2606. 2007. View Article : Google Scholar : PubMed/NCBI
|
|
2
|
Zhang W, Yan W, You G, et al: Genome-wide
DNA methylation profiling identifies ALDH1A3 promoter methylation
as a prognostic predictor in G-CIMP- primary glioblastoma. Cancer
Lett. 328:120–125. 2013. View Article : Google Scholar : PubMed/NCBI
|
|
3
|
Maegawa S, Yoshioka H, Itaba N, et al:
Epigenetic silencing of PEG3 gene expression in human glioma
cell lines. Mol Carcinog. 31:1–9. 2001.
|
|
4
|
van den Boom J, Wolter M, Kuick R, et al:
Characterization of gene expression profiles associated with glioma
progression using oligonucleotide-based microarray analysis and
real-time reverse transcription-polymerase chain reaction. Am J
Pathol. 163:1033–1043. 2003.
|
|
5
|
Hu Y, Pioli PD, Siegel E, et al: EFEMP1
suppresses malignant glioma growth and exerts its action within the
tumor extracellular compartment. Mol Cancer. 10:1232011. View Article : Google Scholar : PubMed/NCBI
|
|
6
|
He SM, Zhao ZW, Wang Y, et al: Reduced
expression of SMAD4 in gliomas correlates with progression and
survival of patients. J Exp Clin Cancer Res. 30:702011. View Article : Google Scholar : PubMed/NCBI
|
|
7
|
Grønbaek K, Hother C and Jones PA:
Epigenetic changes in cancer. APMIS. 115:1039–1059. 2007.
|
|
8
|
Naderi EH, Findley HW, Ruud E, Blomhoff HK
and Naderi S: Activation of cAMP signaling inhibits DNA
damage-induced apoptosis in BCP-ALL cells through abrogation of p53
accumulation. Blood. 114:608–618. 2009. View Article : Google Scholar : PubMed/NCBI
|
|
9
|
Foltz G, Ryu GY, Yoon JG, et al:
Genome-wide analysis of epigenetic silencing identifies BEX1
and BEX2 as candidate tumor suppressor genes in malignant
glioma. Cancer Res. 66:6665–6674. 2006. View Article : Google Scholar : PubMed/NCBI
|
|
10
|
Kim YJ, Yoon HY, Kim JS, et al:
HOXA9, ISL1 and ALDH1A3 methylation patterns
as prognostic markers for nonmuscle invasive bladder cancer:
array-based DNA methylation and expression profiling. Int J Cancer.
133:1135–1142. 2013. View Article : Google Scholar
|
|
11
|
Berdasco M, Ropero S, Setien F, et al:
Epigenetic inactivation of the Sotos overgrowth syndrome gene
histone methyltransferase NSD1 in human neuroblastoma and glioma.
Proc Natl Acad Sci USA. 106:21830–21835. 2009. View Article : Google Scholar : PubMed/NCBI
|
|
12
|
Jin SL, Ding SL and Lin SC:
Phosphodiesterase 4 and its inhibitors in inflammatory diseases.
Chang Gung Med J. 35:197–210. 2012.PubMed/NCBI
|
|
13
|
Beavo JA and Reifsnyder DH: Primary
sequence of cyclic nucleotide phosphodiesterase isozymes and the
design of selective inhibitors. Trends Pharmacol Sci. 11:150–155.
1990. View Article : Google Scholar : PubMed/NCBI
|
|
14
|
Conti M, Jin SL, Monaco L, Repaske DR and
Swinnen JV: Hormonal regulation of cyclic nucleotide
phosphodiesterases. Endocr Rev. 12:218–234. 1991. View Article : Google Scholar : PubMed/NCBI
|
|
15
|
Pérez-Torres S1, Miró X, Palacios JM,
Cortés R, Puigdoménech P and Mengod G: Phosphodiesterase type 4
isozymes expression in human brain examined by in situ
hybridization histochemistry and[3H]rolipram binding
autoradiography. Comparison with monkey and rat brain. J Chem
Neuroanat. 20:349–374. 2000.PubMed/NCBI
|
|
16
|
Naderi EH, Jochemsen AG, Blomhoff HK and
Naderi S: Activation of cAMP signaling interferes with
stress-induced p53 accumulation in ALL-derived cells by promoting
the interaction between p53 and HDM2. Neoplasia. 13:653–663.
2011.PubMed/NCBI
|
|
17
|
Li S, Yan C, Huang L, Qiu X, Wang Z and
Jiang T: Molecular prognostic factors of anaplastic
oligodendroglial tumors and its relationship: a single
institutional review of 77 patients from China. Neuro Oncol.
14:109–116. 2012. View Article : Google Scholar : PubMed/NCBI
|
|
18
|
Hill VK, Ricketts C, Bieche I, et al:
Genome-wide DNA methylation profiling of CpG islands in breast
cancer identifies novel genes associated with tumorigenicity.
Cancer Res. 71:2988–2999. 2011. View Article : Google Scholar : PubMed/NCBI
|
|
19
|
Cadieux B, Ching TT, VandenBerg SR and
Costello JF: Genome-wide hypomethylation in human glioblastomas
associated with specific copy number alteration,
methylenetetrahydrofolate reductase allele status, and increased
proliferation. Cancer Res. 66:8469–8476. 2006. View Article : Google Scholar
|
|
20
|
Owens RJ, Lumb S, Rees-Milton K, et al:
Molecular cloning and expression of a human phosphodiesterase 4C.
Cell Signal. 9:575–585. 1997. View Article : Google Scholar : PubMed/NCBI
|
|
21
|
Czernicki T, Zegarska J, Paczek L, et al:
Gene expression profile as a prognostic factor in high-grade
gliomas. Int J Oncol. 30:55–64. 2007.PubMed/NCBI
|
|
22
|
Freije WA, Castro-Vargas FE, Fang Z, et
al: Gene expression profiling of gliomas strongly predicts
survival. Cancer Res. 64:6503–6510. 2004. View Article : Google Scholar : PubMed/NCBI
|
|
23
|
Takahashi H and Kouno J: Gene expression
profiling of malignant gliomas by cDNA microarrays. Nihon Rinsho.
63(Suppl 9): 515–519. 2005.(In Japanese).
|
|
24
|
Yoshino A, Ogino A, Yachi K, et al: Gene
expression profiling predicts response to temozolomide in malignant
gliomas. Int J Oncol. 36:1367–1377. 2010. View Article : Google Scholar : PubMed/NCBI
|
|
25
|
Schatz P, Distler J, Berlin K and Schuster
M: Novel method for high throughput DNA methylation marker
evaluation using PNA-probe library hybridization and MALDI-TOF
detection. Nucleic Acids Res. 34:e592006. View Article : Google Scholar : PubMed/NCBI
|