Introduction
During the last decade, several clinical studies
have confirmed that targeting the epidermal growth factor receptor
(EGFR) with specific monoclonal antibodies (MoAbs) may improve the
outcome of metastatic colorectal carcinoma (mCRC) patients
(1,2). Mutations of the KRAS oncogene,
an important intracellular signaling molecule downstream of EGFR,
have been identified as a strong negative predictor for response to
anti-EGFR-based therapies (3–5). As a
consequence, mutation testing of KRAS has become mandatory
for the approval for the use of cetuximab and panitumumab in the
treatment of mCRC by the US Food and Drug Administration (FDA), the
European Medicines Agency (EMA), and the Japanese Ministry of
Health, Labour and Welfare (MHLW) (3,6,7).
Hence, only mCRC patients with confirmed KRAS wild-type
status are currently eligible for therapies using anti-EGFR
antibodies in many countries.
On the other hand, reports indicate that, even in
KRAS-mutated colon cancer, there are subsets of patients who
benefit from anti-EGFR antibody treatment (8–10).
These studies suggest that all KRAS mutations are not
equivalent in their biological characteristics. First, an in
vitro study revealed that cells with KRAS codon-13
mutations (mainly the p.G13D mutation) exhibit weaker transforming
activity than those with codon-12 mutations (3,11).
Second, a subset of patients presenting with tumors with
KRAS mutations, particularly the p.G13D mutation, responded
to anti-EGFR treatment (8–10). Furthermore, in a recent
meta-analysis using a pooled data set of 579 patients with
chemotherapy-refractory colon carcinoma, the p.G13D mutation was
reported to have predictive value for the treatment of mCRC with
cetuximab (12). These findings
indicate that anti-EGFR antibodies may have a stronger effect on
tumors with the KRAS p.G13D mutation than those with other
KRAS mutations. However, several studies did not detect a
significant survival advantage in patients with p.G13D-mutated
tumors treated with cetuximab monotherapy (13,14).
Therefore, the impact of the subtype of KRAS mutation on
responsiveness to anti-EGFR therapies remains uncertain.
A second critical aspect of EGFR-targeted therapies
comes from the presence of other genetic abnormalities that can
affect responses to such therapies in KRAS wild-type
patients. Even in a KRAS wild-type group, less than 50% of
patients responded to EGFR-targeted therapy (4,5,15).
These observations have prompted investigators to analyze the
involvement in mCRC of other genes of the RAS/RAF/MAPK and
PI3K/PTEN/Akt pathways. In this regard, the presence of oncogenic
deregulation of EGFR and other members of its downstream signaling
pathways, such as BRAF, PIK3CA, and PTEN, have been
shown to influence the responsiveness to cetuximab and panitumumab
and could, therefore, help to identify non-responder patients
(4,5,15–17).
Furthermore, recent studies also have suggested that activation of
MET, a tyrosine kinase that acts as a receptor for hepatocyte
growth factor (HGF) and can activate the RAS/RAF/MAPK and
PTEN/PI3K/Akt pathways, may be a novel mechanism of cetuximab
resistance in CRC (18–20). However, no studies have yet
addressed whether these additional aberrations may influence the
responsiveness to anti-EGFR MoAb therapies in KRAS-mutated
mCRC, mostly because these MoAb therapies are currently not
recommended for this type of mCRC.
In the present study, we enrolled mCRC patients with
KRAS mutations who had been treated with anti-EGFR MoAbs
before the start of such restrictions for this therapy.
Retrospective analyses of these patients enabled us to evaluate the
impact of KRAS mutation subtype, together with additional
aberrations in other EGFR downstream genes, on the efficacy of
anti-EGFR MoAb therapies in mCRCs with mutant KRAS. In
addition to evaluating the association between the types of
KRAS mutations and the therapeutic efficacy of anti-EGFR
therapies, we investigated whether PTEN or MET expression and
BRAF or PIK3CA mutation might influence the outcome
in KRAS-mutant patients with mCRC treated by anti-EGFR
MoAbs. Our final goal was to identify a group of patients which
will benefit from such treatment among KRAS-mutant patients
with mCRC.
Patients and methods
Patients
The clinical outcome of anti-EGFR MoAb therapy was
retrospectively analyzed for possible associations with the
molecular features of tumors in the mCRC patients. This study
enrolled 81 Japanese patients who were treated at the Department of
Gastroenterological Surgery and Medical Oncology, Kyorin University
Hospital, between November 2008 and March 2012. All patients
presented with histologically confirmed mCRC, and had been treated
with salvage chemotherapy incorporating cetuximab or panitumumab.
Clinical features of the patients and pathological profiles of the
tumors were obtained from patient medical records. Cetuximab, as
monotherapy or in combination with irinotecan, was administered
intravenously (i.v.) at a loading dose of 400 mg/m2 over
2 h, followed by weekly doses administered at 250 mg/m2
over 1 h. Panitumumab was administered i.v. every 2 weeks at a dose
of 6 mg/kg. Treatment was continued until disease progression (PD)
or toxicity occurred. Clinical evaluation and tumor response were
analyzed according to Response Evaluation Criteria in Solid Tumors
(RECIST) (21). Genetic alterations
(subtype of KRAS mutation, mutations of BRAF and
PIK3CA, loss of PTEN expression and MET overexpression) were
retrospectively investigated in patient tumor specimens as
described below, and the association with the response to anti-EGFR
MoAb therapies was analyzed in patients with mutant KRAS.
This study was approved by the Research Ethics Committee of Kyorin
University School of Medicine Hospital.
Mutational analysis of KRAS, BRAF and
PIK3CA by direct sequencing
Paraffin-embedded tissues (primary or metastatic)
were sectioned at 10-μm thicknesses and mounted as three separate
slides per tissue. The resulting slides were treated three times
with xylene and then washed with ethanol. To minimize contamination
by normal DNA, areas in which at least 70% of the cells exhibited
disease-specific pathology were dissected under a binocular
microscope; DNA was extracted from the dissected tissues using the
QIAamp FFPE Tissue kit (Qiagen). Segments of the KRAS,
BRAF and PIK3CA genes were amplified using
gene-specific primers and subjected to direct DNA sequencing as
previously described (15,22). KRAS sequences were screened
for point mutations in codons 12 and 13 within exon 2, two hotspots
that cumulatively include >95% of mutations in this gene
(4,5,15).
BRAF sequences were screened for V600E mutations within exon
15, a site at which >95% of point mutations in this gene occur
(5,15). PIK3CA sequences were screened
for mutations within exons 9 and 20, sites at which >80% of
point mutations in this gene occur (17).
Immunohistochemistry of PTEN and MET
PTEN and MET expression levels were evaluated by
immunohistochemistry performed on 4-μm tissue sections of
paraffin-embedded specimens. PTEN was assessed using the 17.A mouse
MoAb (1:25 dilution; Neomarkers, Thermo Fisher Scientific Inc.,
Fremont, CA, USA); MET was assessed using the SP44 rabbit MoAb
(Spring Biosciences, Pleasanton, CA, USA) (23,24).
Negative controls were incubated with nonimmune solution instead of
the primary antibody. Endothelial and hepatocellular carcinoma
cells were used as positive controls for PTEN and MET expression,
respectively. The PTEN and MET staining intensities were evaluated
by a pathologist (Y.O.) who was blinded to the diagnosis of the
individual patients.
To our knowledge, there currently are no validated
scoring systems for interpretation of PTEN or MET staining
intensity. Both PTEN and MET are localized primarily in the
cytoplasm (4,25); we therefore adopted a scoring system
that has been used for other cytoplasmic proteins and is based on
the intensity of immunoreactivity and the percentage of stained
cells (26–28). Specifically, intensity was scored
according to a four-tier system: 0, no staining; 1, weak; 2,
moderate; and 3, strong. An additional 1, 2, or 3 points were
assigned depending in whether the percentage of positive cells was
<25%, 25–50% or >50%, respectively (4,5).
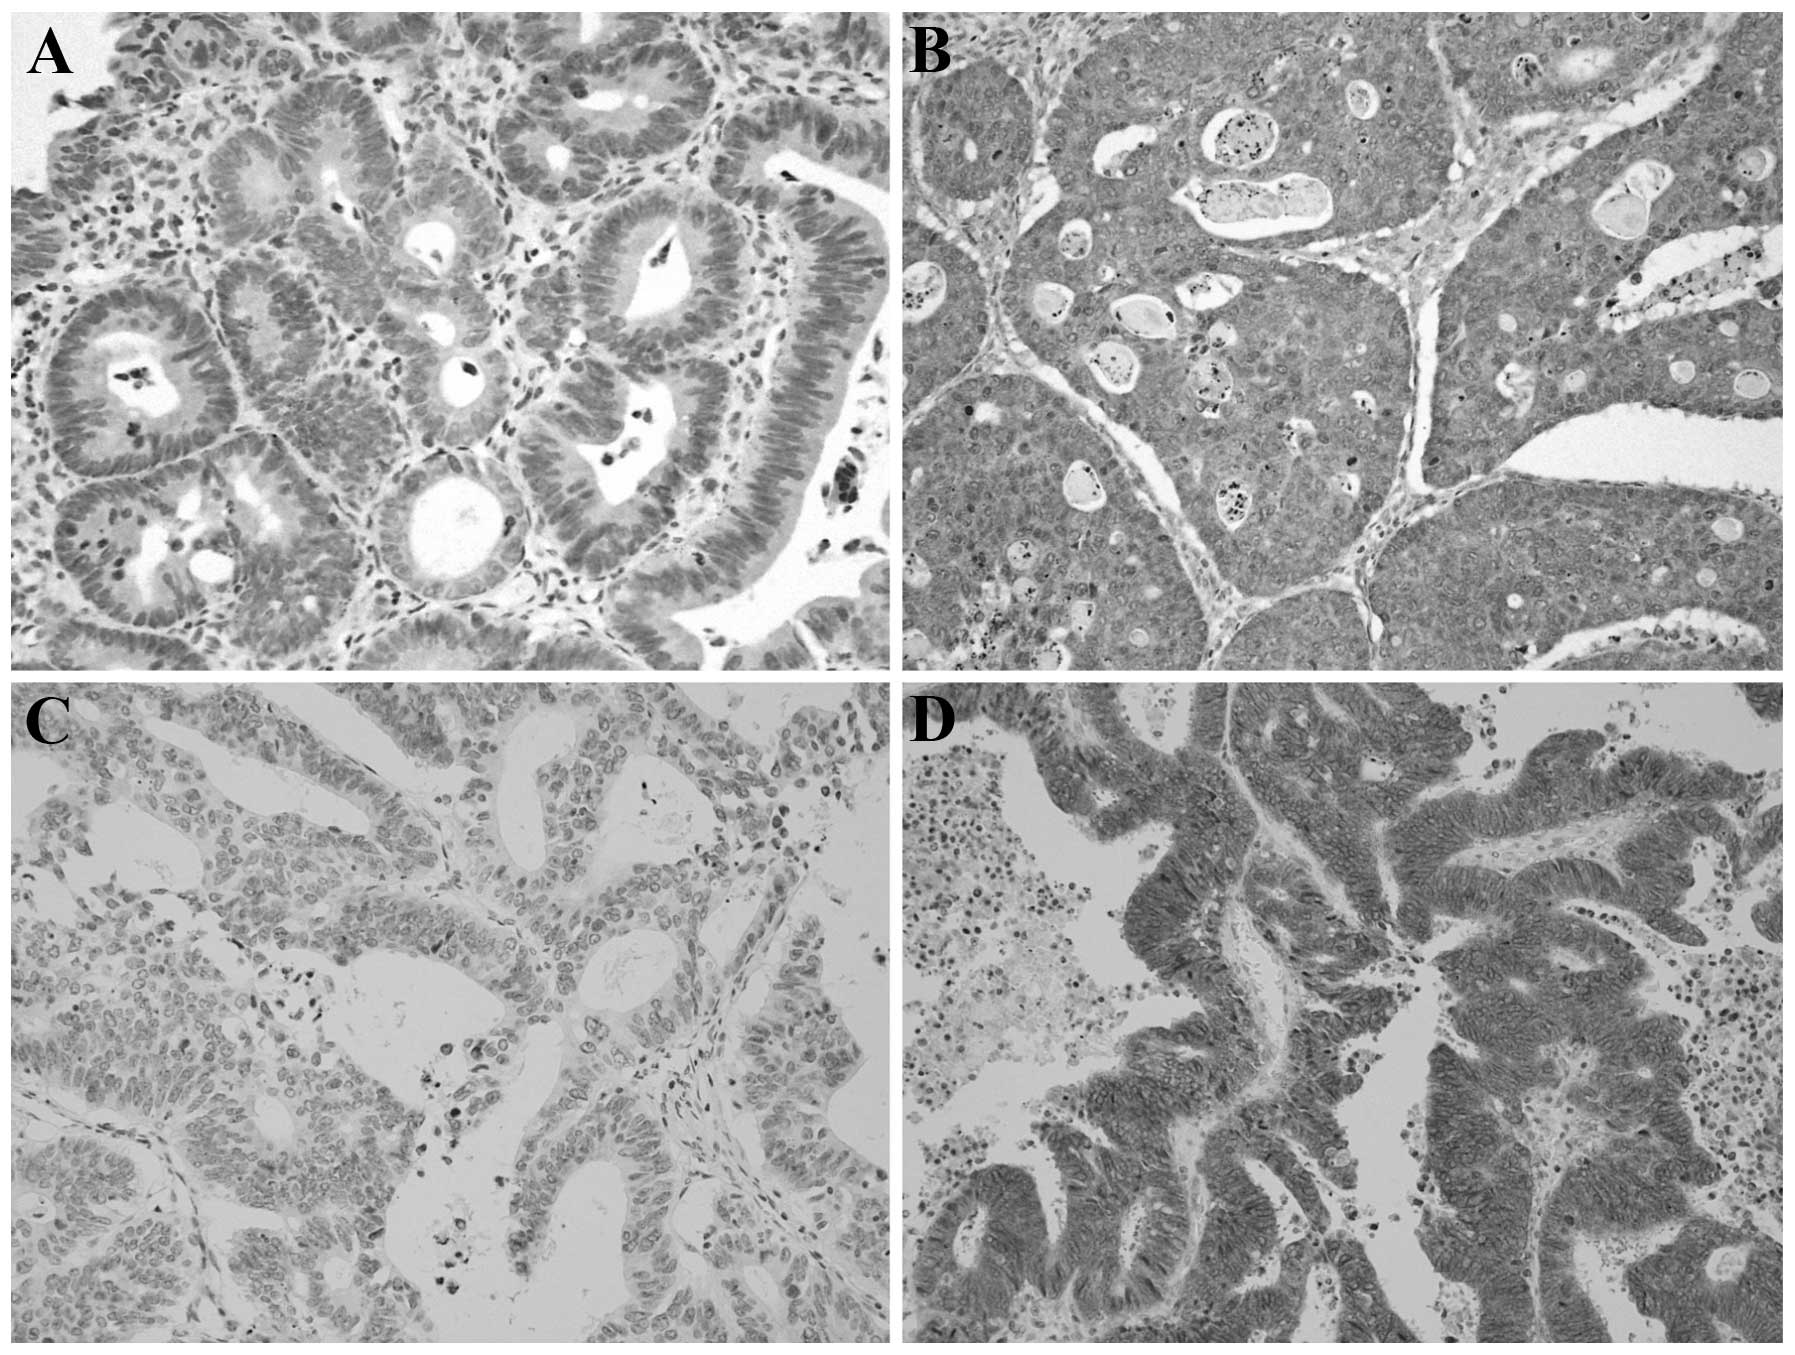
We defined normal PTEN expression as a score of ≥4
(Fig. 1A); scores of 0–3 were
classified as loss of expression (Fig.
1B). We defined normal/low expression of MET as a score of 0–3
(Fig. 1C); scores of ≥4 were
classified as MET overexpression (Fig.
1D).
Statistical analysis
Comparison of categorical variables was performed
with the χ2 test or the Fisher’s exact test. The
progression-free survival (PFS) and overall survival (OS) were
calculated using the Kaplan-Meier method. Comparisons between
different groups were performed using log-rank tests. Two-tailed
P-values of <0.05 were considered significant. All analyses were
performed using SPSS software (SPSS for Windows version 15.0; SPSS
Inc., Chicago, IL, USA).
Results
Patient characteristics
Among the 81 patients enrolled in the study, 65
patients were able to be analyzed for all of the molecular
parameters examined (mutations of KRAS, BRAF and
PIK3CA, and expression of PTEN and MET). These 65 patients
comprised 49 men and 16 women with a mean age of 68 years (range,
38 to 85 years). Among these 65 patients, the response rate (RR)
and the disease control rate (DCR) were 23 and 51%, respectively,
and PFS and OS were 3.5 and 11.9 months, respectively.
The mutations in KRAS exon 2 were detected in
21 (32%) of the 65 patients. Table
I summarizes the characteristics of the 21 patients who
harbored tumors with mutant KRAS genes. These 21 patients
comprised 14 men and 7 women with a mean age of 67 years (range, 38
to 82 years). At a median follow-up of 5.2 months (range, 1.7–24.4
months), disease had progressed in all patients with KRAS
mutations, and 16 (70%) patients had died. In this 21-patient
group, we observed no patients with complete response (CR) and
partial response (PR), 3 with stable disease (SD) and 18 with
progressive disease (PD). Therefore, the overall RR was 0%, and the
DCR was 14%. RR and DCR were significantly lower in patients with
KRAS mutations than in those with wild-type KRAS: for
RR, the values were 0 vs. 34% (P<0.001); for DCR, the values
were 14 vs. 68% (P<0.001). Median PFS and OS were significantly
shorter in patients whose tumors carried KRAS mutations than
in those without mutations (PFS: 1.8 vs. 5.9 months, P<0.001;
OS: 5.5 vs. 15.4 months; P=0.023).
 | Table ICharacteristics of the CRC patients
with mutant KRAS (n=21). |
Table I
Characteristics of the CRC patients
with mutant KRAS (n=21).
|
Characteristics | n | % |
|---|
| KRAS
mutation status | | |
| G13D | 8 | 38 |
| G12V | 7 | 33 |
| G12D | 5 | 24 |
| G12C | 1 | 5 |
| Age (years) | | |
| ≤70 | 15 | 72 |
| >70 | 6 | 28 |
| Gender | | |
| Male | 14 | 65 |
| Female | 7 | 35 |
| Evaluated
tumor | | |
| Primary | 20 | 95 |
| Metastasis | 1 | 5 |
| Stage at
diagnosis | | |
| II and III | 8 | 38 |
| IV | 13 | 62 |
| Primary tumor
location | | |
| Cecum | 1 | 5 |
| Ascending
colon | 2 | 10 |
| Transverse
colon | 1 | 5 |
| Descending
colon | 3 | 14 |
| Sigmoid colon | 4 | 19 |
| Rectum | 10 | 48 |
| Tumor
differentiation | | |
| Well/moderate | 21 | 100 |
| Poor | 0 | 0 |
| Site of
metastasis | | |
| Liver | 18 | 86 |
| Lung | 14 | 67 |
| Peritoneum | 9 | 43 |
| Others | 10 | 48 |
| EGFR-targeted
therapies | | |
| Cetuximab | 7 | 33 |
| Cetuximab +
irinotecan | 12 | 57 |
| Panitumumab | 2 | 10 |
| Anti-EGFR antibody
administration line | | |
| 1st | 0 | 0 |
| 2nd | 7 | 33 |
| 3rd | 9 | 43 |
| 4th or
greater | 5 | 24 |
Analysis of KRAS mutation subtypes
Among the 21 patients with KRAS-mutant
tumors, 8 (38%) harbored p.G13D, 7 (33%) harbored p.G12V, 5 (24%)
harbored p.G12D, and 1 (5%) harbored p.G12C mutation (Table I). Patients with the p.G13D mutation
exhibited significantly higher DCR than patients with other
KRAS mutations (P=0.042), but no significant difference in
DCR compared to wild-type KRAS patients was noted (P=0.124)
(Table IIA). Regarding RR,
patients with p.G13D showed no significant difference compared to
patients with other KRAS mutations or wild-type KRAS
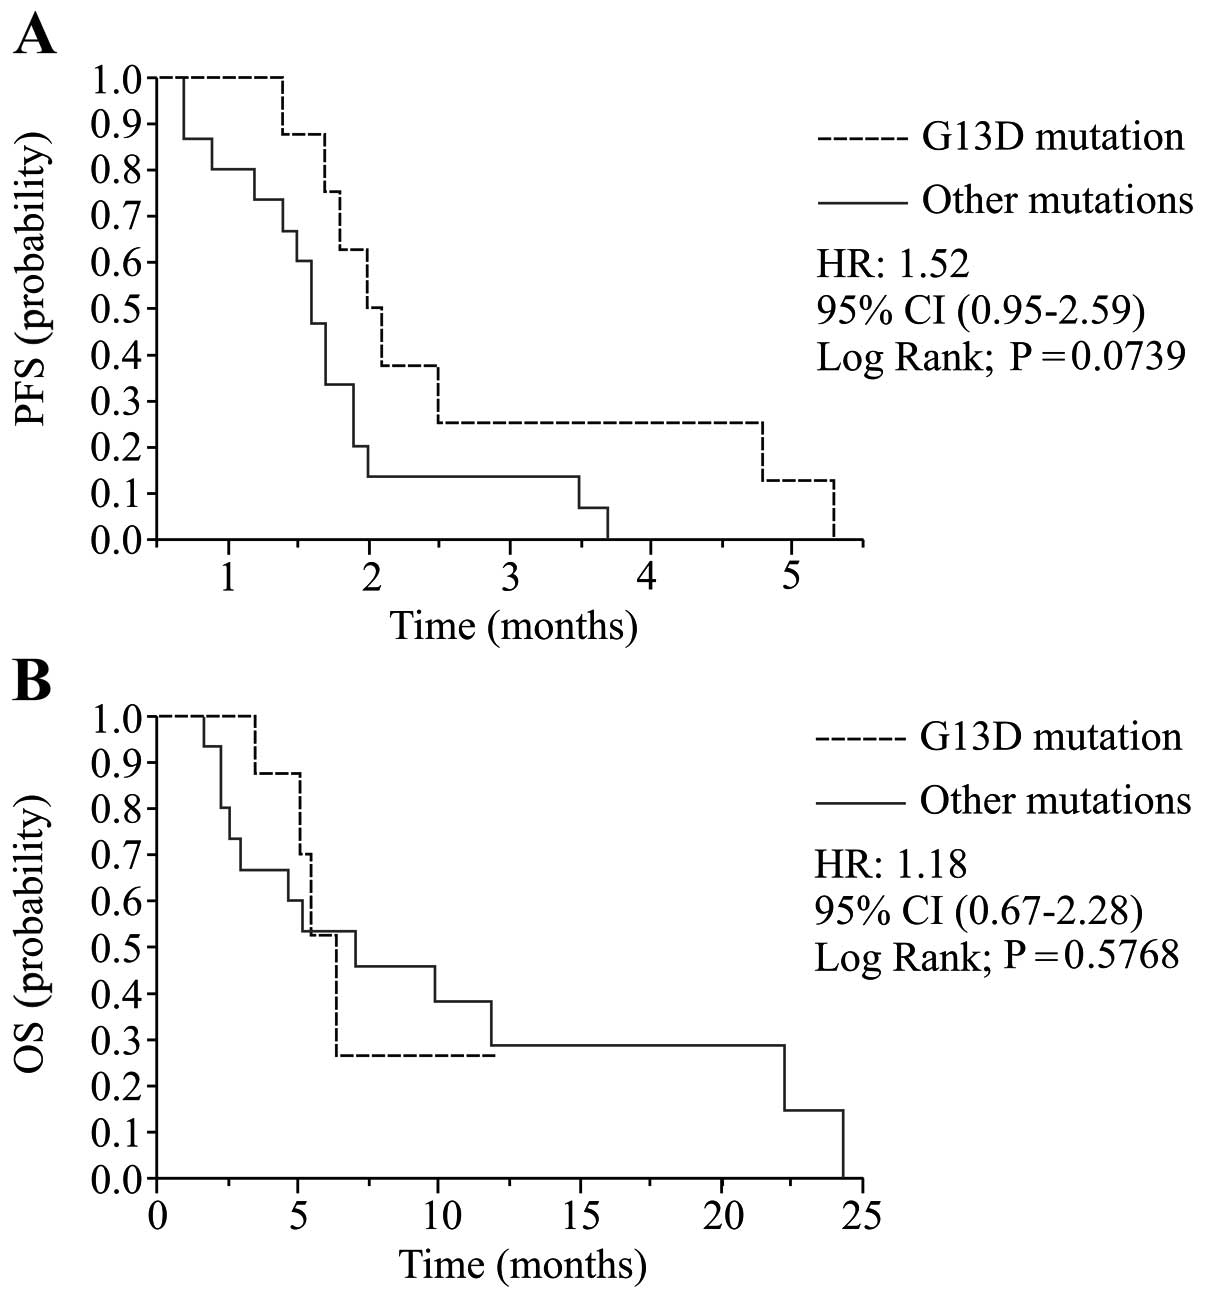
(Table IIA). Patients with the
p.G13D mutation tended to have a prolonged PFS than patients with
other KRAS mutations, and the difference was marginally
significant. (2.1 vs. 1.7 months; HR, 1.52; 95% CI, 0.95–2.59;
P=0.074; Table IIB, Fig. 2A). No significant correlation was
detected between the subtype of KRAS mutation and OS
(Fig. 2B).
| Table IIEffect of KRAS status on RR,
DCR, PFS and OS. |
Table II
Effect of KRAS status on RR,
DCR, PFS and OS.
| A, Effect of
KRAS status on RR and DCR |
|---|
|
|---|
| n | PR | SD | PD | RR (%) | P-value | DCR (%) | P-value |
|---|
| KRAS |
| G13D | 8 | 0 | 3 | 5 | 0 | | 38 | |
| Other
mutations | 13 | 0 | 0 | 13 | 0 | NAa | 0 | 0.042a |
| Wild-type | 44 | 15 | 15 | 14 | 34 | 0.087a | 68 | 0.124a |
|
| B, Effect of
KRAS status on PFS and OS |
|
| | | PFS | OS |
| | |
|
|
| n | % | Median
(months) | HR (95% CI) | P-value | Median
(months) | HR (95% CI) | P-value |
|
| KRAS |
| G13D | 8 | 11 | 2.1 | | | 6.4 | | |
| Other
mutations | 13 | 20 | 1.7 | 1.52
(0.95–2.59) | 0.074a | 5.2 | 1.18
(0.67–2.28) | 0.577a |
| Wild-type | 44 | 69 | 5.9 | 0.55
(0.37–0.87) | 0.003a | 15.4 | 0.65
(0.39–1.25) | 0.139a |
BRAF and PIK3CA mutational analysis
As expected from the reported exclusivity between
KRAS and BRAF mutations (15), BRAF mutation was not detected
among patients with KRAS mutations; therefore, the impact of
the BRAF mutation could not be analyzed in this patient
group (Table III). PIK3CA
mutations were detected in 3 (14%) of the 21 patients with
KRAS mutations (Table
III). No significant correlation was found between the
PIK3CA mutational status and the subtype of KRAS
mutation. None of the PIK3CA-mutant patients exhibited a
response to anti-EGFR MoAb therapy. However, the difference in DCR
between patients with and without PIK3CA mutation was not
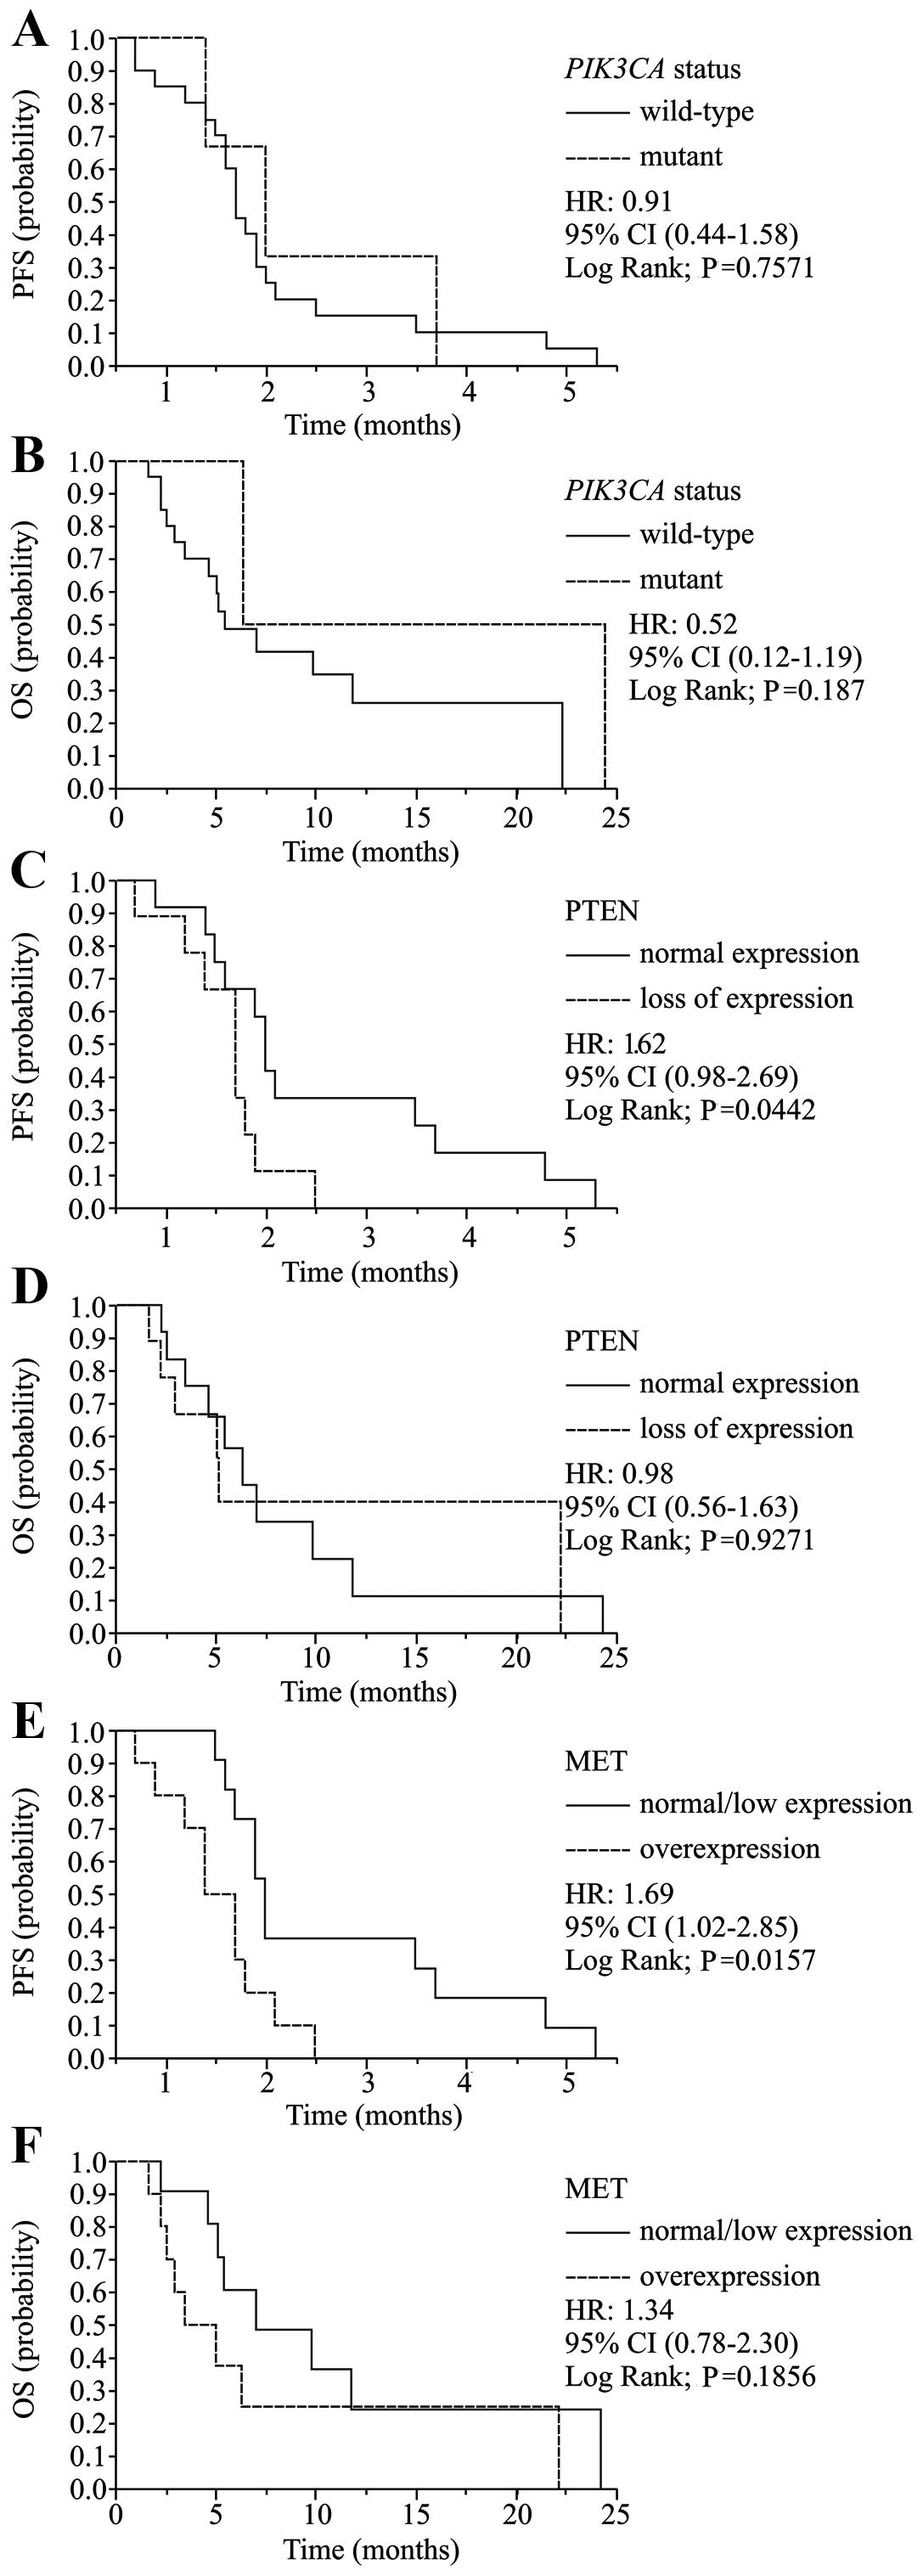
statistically significant (P=0.612; Table IVA). PIK3CA mutations were
not significantly associated with PFS (1.8 vs. 2.0 months; P=0.757)
or OS (5.2 vs. 24.4 months; P=0.187) (Table IVB, Fig. 3A and B).
| Table IIIRelationships between the KRAS
mutation subtype and other molecular biomarkers. |
Table III
Relationships between the KRAS
mutation subtype and other molecular biomarkers.
| | | KRAS | |
|---|
| | |
| |
|---|
| n | % | G13D | Other
mutations | P-value |
|---|
| BRAF |
| Wild-type | 21 | 100 | 8 | 13 | |
| Mutant | 0 | 0 | 0 | 0 | Not available |
| PIK3CA |
| Wild-type | 18 | 86 | 6 | 12 | |
| Mutant | 3 | 14 | 2 | 1 | 0.531 |
| PTEN |
| Normal
expression | 12 | 57 | 5 | 7 | |
| Loss of
expression | 9 | 43 | 3 | 6 | 0.697 |
| MET |
| Normal/low
expression | 11 | 52 | 4 | 7 | |
|
Overexpression | 10 | 48 | 4 | 6 | 0.864 |
| Table IVEffect of biomarkers on RR, DCR, PFS
and OS in patients with mutant KRAS. |
Table IV
Effect of biomarkers on RR, DCR, PFS
and OS in patients with mutant KRAS.
| A, Effect of
biomarkers on RR and DCR |
|---|
|
|---|
| n | PR | SD | PD | RR (%) | P-value | DCR (%) | P-value |
|---|
| PIK3CA |
| Wild-type | 18 | 0 | 3 | 15 | 0 | | 20 | |
| Mutant | 3 | 0 | 0 | 3 | 0 | NA | 0 | 0.614 |
| PTEN |
| Normal
expression | 12 | 0 | 2 | 10 | 0 | | 17 | |
| Loss of
expression | 9 | 0 | 1 | 8 | 0 | NA | 11 | 0.612 |
| MET |
| Normal/low
expression | 11 | 0 | 2 | 9 | 0 | 18 | | |
|
Overexpression | 10 | 0 | 1 | 9 | 0 | NA | 10 | 0.538 |
|
| B, Effect of
biomarkers on PFS and OS |
|
| | | PFS | OS |
| | |
|
|
| n | % | Median
(months) | HR (95% CI) | P-value | Median
(months) | HR (95% CI) | P-value |
|
| PIK3CA |
| Wild-type | 18 | 87.0 | 1.8 | | | 5.2 | | |
| Mutant | 3 | 13.0 | 2.0 | 0.91
(0.44–1.58) | 0.757 | 6.4 | 0.52
(0.12–1.19) | 0.187 |
| PTEN |
| Normal
expression | 12 | 57.1 | 2.0 | | | 6.4 | | |
| Loss of
expression | 9 | 42.9 | 1.7 | 1.62
(0.98–2.69) | 0.044 | 5.2 | 0.98
(0.56–1.63) | 0.927 |
| MET |
| Normal/low
expression | 11 | 52.3 | 2.0 | | | 7.1 | | |
|
Overexpression | 10 | 47.7 | 1.7 | 1.69
(1.02–2.85) | 0.016 | 5.1 | 1.34
(078–2.30) | 0.186 |
PTEN immunohistochemical evaluation
Nine (43%) of the 21 patients with KRAS
mutations exhibited loss of PTEN expression. No significant
correlation was found between PTEN expression status and the
subtype of KRAS mutation (Table III). Patients with loss of PTEN
had significantly shorter PFS than those with normal PTEN
expression (1.7 vs. 2.0 months; HR, 1.61; 95% CI, 0.98–2.69;
P=0.044, Fig. 3C), although no
significant association between levels of PTEN expression and RR,
DCR or OS was detected in patients with mutant KRAS
(Table IVA and B, Fig. 3D).
MET immunohistochemical evaluation
Overexpression of MET was detected in 10 (48%) of
the 21 patients with KRAS mutations. No significant
correlation was found between MET expression status and the subtype
of KRAS mutation (Table
III). MET overexpression was significantly associated with
shorter PFS compared to normal MET expression (1.7 vs. 2.0 months;
HR, 1.69; 95% CI, 1.02–2.85; P=0.016, Fig. 3E), although no significant
association between levels of MET expression and RR, DCR, or OS was
noted in patients with mutant KRAS (Table IVA and B, Fig. 3F).
Multi-gene analysis
The results described above suggested that
KRAS p.G13D mutation and normal PTEN and MET expression may
be potentially favorable prognostic factors in mCRCs with
KRAS mutations treated by anti-EGFR MoAbs. To test whether
incorporation of multi-gene profiles is useful for the prediction
of the response to anti-EGFR therapies, we further analyzed the
patients having multiple favorable factors. There were 2 patients
with KRAS p.G13D mutations showing no abnormality in PTEN
and MET expression. Both patients exhibited stable disease to
anti-EGFR therapies, and PFS of these two patients (5.3 and 4.8
months) were the first and second longest among the 21 patients
with KRAS mutations (range of other 19 patients, 0.7–3.7
months). The PFS of these 2 patients were similar to the PFS of
patients with wild-type KRAS (median; 5.9 months, 95% CI,
3.5–7.3 months).
Discussion
Since anti-EGFR MoAb therapies are currently
restricted to patients with wild-type KRAS in many
countries, few data are available regarding the response to these
therapies in mCRC patients with mutant KRAS. To the best of
our knowledge, the research presented here represents the first
study to analyze associations among subtypes of KRAS,
additional genetic alterations, and efficacy of anti-EGFR MoAb
therapies in mCRC patients with KRAS mutations.
The most striking finding in this study was the fact
that loss of PTEN expression and MET overexpression was associated
with reduced PFS even in patients with KRAS mutations. PTEN
is a tumor-suppressor protein that regulates the PI3K/Akt signal
transduction pathway. Loss of PTEN production is associated with
intrinsic activation of the Akt pathway, conferring resistance to
inhibitors of the HER family (29).
Accordingly, low PTEN expression has been associated with lack of
response to anti-EGFR MoAbs in several reports (4,5),
although such a correlation was not reported by other researchers
(16,18). In these earlier analyses, the
presence of KRAS mutations was not specified, precluding
recognition of such an association in patients with
KRAS-mutated mCRCs.
MET is an oncogene that contains a tyrosine kinase
domain and can activate the RAS/RAF/MAPK and PTEN/PI3K/Akt pathways
by itself or via EGFR transphosphorylation (19,30).
MET reportedly is involved in many mechanisms of cancer
proliferation and metastasis. MET additionally contributes to
cancer resistance to EGFR inhibitors through bypass signaling. In
CRC, overexpression of MET has been suggested to be associated with
tumor progression (31,32). Subsequent studies have indicated an
association of MET overexpression with poor outcome of mCRCs,
including inferior response to anti-EGFR therapy (18). However, as with PTEN above, these
studies did not separately analyze patients with KRAS
mutations.
Our present data regarding PTEN and MET indicate
that mCRC patients lacking MET overexpression or loss of PTEN may
show some benefit by these therapies even if these patients harbor
KRAS mutations in their tumors. DCR also was inferior in
patients with these molecular aberrations, although the difference
fell short of statistical significance. These results suggest that
the policies restricting anti-EGFR MoAb therapies to mCRC patients
with wild-type KRAS might deprive some patients who would
benefit from such treatments. Assessment of genetic alterations in
EGFR signaling pathways other than KRAS may enable
physicians to identify patients who would benefit from anti-EGFR
treatment despite the presence of KRAS mutations.
Several lines of evidence also indicate that
KRAS p.G13D-mutated CRC defines a less aggressive phenotype
and is more sensitive to anti-EGFR treatment than codon-12 mutated
CRC. While mutations in either codons 12 or 13 affect the intrinsic
GTPase activity of the KRAS protein, structural and
functional analyses demonstrated that the glycine residue at
position 12 is more critical for function of wild-type KRAS
than the glycine at position 13 (33). In addition, transfection of NIH3T3
cells with KRAS mutated in codon 12 resulted in a more
aggressive phenotype than that observed in cells transfected with
KRAS harboring the codon-13 mutation (11). In accordance with these
observations, several clinical studies have revealed that the
tumors from patients who responded to anti-EGFR therapies
predominantly harbored codon-13 mutations, and all codon-13 mutant
responders carried the p.G13D mutation (11–13).
More importantly, 3 meta-analyses have indicated that patients with
the p.G13D mutation who received cetuximab showed a better response
to cetuximab than patients with KRAS codon-12 mutations
(10,12,34).
In these analyses, the p.G13D mutation was associated with longer
PFS and OS of patients treated with a combination of cetuximab plus
chemotherapy compared to other KRAS mutations. The present
study is, to our knowledge, the first study conducted in a single
institute to clarify the association of the p.G13D mutation with
superior clinical response (DCR) to anti-EGFR MoAbs in mCRC
patients. In fact, patients with the p.G13D mutation exhibited DCR
equivalent to those with wild-type KRAS. Lack of statistical
significance in the prolonging of PFS in patients with p.G13D may
be due in part to the small sample size in our study. Although
meta-analysis is generally considered to provide higher levels of
confidence than single studies, the present study (involving
patients treated by relatively uniform therapies in a single
institute) reinforces the results observed in meta-analyses. These
observations should prompt further clinical trials to investigate
whether mCRC patients with p.G13D might benefit from anti-EGFR MoAb
therapies.
In testing molecular biomarkers as predictors of
therapeutic responses, multi-gene models have been proposed to be
superior to single-gene models (5,16). The
present study could not precisely analyze the feasibility of
multi-gene models, because the sample size was small. However, as
described above, incorporation of multiple factors (p.G13D, normal
PTEN and MET expression) appeared to identify patients who showed
the best response to anti-EGFR therapies. These results suggest
that PTEN and MET expression levels, together with subtype of
KRAS mutation, might be candidate criteria for the selection
of KRAS-mutant patients expected to exhibit favorable
responses to anti-EGFR MoAbs. The incorporation of PTEN, MET and
subtypes of KRAS mutation into the design of clinical trials
may permit further individualization of treatment for mCRC by
helping to define true predictive markers (20). If these data are confirmed in future
large studies, KRAS-mutated mCRC patients having these
molecular features might be eligible for anti-EGFR MoAb therapy
before trials of treatment by novel therapeutic drugs for mCRC,
such as regorafenib or aflibercept (35,36).
The present study has some limitations. Notably, our
study was performed retrospectively in a relatively small and
heterogeneous population. The small sample size may have
contributed to lack of statistical significance in some analyses.
The majority of our population (90%) was treated with two or more
chemotherapy regimens before anti-EGFR MoAb therapy. Additionally,
the anti-EGFR treatment protocols were heterogeneous. Our findings
therefore require further validation in subsequent prospective
studies prior to application in the clinical practice.
In conclusion, our data demonstrated the potential
utility of alterations in PTEN and MET expression as predictive
markers for response to anti-EGFR MoAbs in mCRC patients with
KRAS mutations. In addition, we confirmed the predictive
value of the KRAS p.G13D mutation for better response to
anti-EGFR therapies in comparison with other KRAS mutations.
Thus, a subset of mCRC patients with KRAS mutations who
harbor specific additional molecular features exhibited
responsiveness to anti-EGFR MoAb treatment that was equivalent to
that of patients with wild-type KRAS. These results warrant
further studies re-examining the current policy restricting
anti-EFGR therapies to patients with wild-type KRAS.
References
|
1
|
Linardou H, Dahabreh IJ, Kanaloupiti D, et
al: Assessment of somatic k-RAS mutations as a mechanism associated
with resistance to EGFR-targeted agents: a systematic review and
meta-analysis of studies in advanced non-small-cell lung cancer and
metastatic colorectal cancer. Lancet Oncol. 9:962–972. 2008.
View Article : Google Scholar
|
|
2
|
Normanno N, Tejpar S, Morgillo F, De Luca
A, Van Cutsem E and Ciardiello F: Implications for KRAS
status and EGFR-targeted therapies in metastatic CRC. Nat Rev Clin
Oncol. 6:519–527. 2009.
|
|
3
|
Messner I, Cadeddu G, Huckenbeck W,
Knowles HJ, Gabbert HE, Baldus SE and Schaefer KL: KRAS p.
G13D mutations are associated with sensitivity to anti-EGFR
antibody treatment in colorectal cancer cell lines. J Cancer Res
Clin Oncol. 139:201–209. 2013. View Article : Google Scholar
|
|
4
|
Loupakis F, Pollina L, Stasi I, et al:
PTEN expression and KRAS mutations on primary tumors and
metastases in the prediction of benefit from cetuximab plus
irinotecan for patients with metastatic colorectal cancer. J Clin
Oncol. 27:2622–2629. 2009.PubMed/NCBI
|
|
5
|
Saridaki Z, Tzardi M, Papadaki C, et al:
Impact of KRAS, BRAF, PIK3CA mutations,
PTEN, AREG, EREG expression and skin rash in ≥
2 line cetuximab-based therapy of colorectal cancer patients. PLoS
One. 6:e159802011.
|
|
6
|
O’Neil BH: Systemic therapy for colorectal
cancer: focus on newer chemotherapy and novel agents. Semin Radiat
Oncol. 13:441–453. 2003.PubMed/NCBI
|
|
7
|
Adlard JW, Richman SD, Seymour MT and
Quirke P: Prediction of the response of colorectal cancer to
systemic therapy. Lancet Oncol. 3:75–82. 2002. View Article : Google Scholar : PubMed/NCBI
|
|
8
|
Benvenuti S, Sartore-Bianchi A, Di
Nicolantonio F, et al: Oncogenic activation of the RAS/RAF
signaling pathway impairs the response of metastatic colorectal
cancers to anti-epidermal growth factor receptor antibody
therapies. Cancer Res. 67:2643–2648. 2007. View Article : Google Scholar
|
|
9
|
Bando H, Yoshino T, Yuki S, et al:
Clinical outcome of Japanese metastatic colorectal cancer patients
harbouring the KRAS p. G13D mutation treated with cetuximab
+ irinotecan. Jpn J Clin Oncol. 42:1146–1151. 2012. View Article : Google Scholar : PubMed/NCBI
|
|
10
|
Tejpar S, Celik I, Schlichting M,
Sartorius U, Bokemeyer C and Van Cutsem E: Association of
KRAS G13D tumor mutations with outcome in patients with
metastatic colorectal cancer treated with first-line chemotherapy
with or without cetuximab. J Clin Oncol. 30:3570–3577.
2012.PubMed/NCBI
|
|
11
|
Guerrero S, Casanova I, Farré L, Mazo A,
Capellà G and Mangues R: K-ras codon 12 mutation induces higher
level of resistance to apoptosis and predisposition to
anchorage-independent growth than codon 13 mutation or
proto-oncogene overexpression. Cancer Res. 60:6750–6756. 2000.
|
|
12
|
De Roock W, Jonker DJ, Di Nicolantonio F,
et al: Association of KRAS p. G13D mutation with outcome in
patients with chemotherapy-refractory metastatic colorectal cancer
treated with cetuximab. JAMA. 304:1812–1820. 2010.
|
|
13
|
Peeters M, Douillard JY, Van Cutsem E,
Siena S, Zhang K, Williams R and Wiezorek J: Mutant KRAS
codon 12 and 13 alleles in patients with metastatic colorectal
cancer: assessment as prognostic and predictive biomarkers of
response to panitumumab. J Clin Oncol. 31:759–765. 2013.
|
|
14
|
Gajate P, Sastre J, Bando I, et al:
Influence of KRAS p. G13D mutation in patients with
metastatic colorectal cancer treated with cetuximab. Clin
Colorectal Cancer. 11:291–296. 2012.
|
|
15
|
Di Nicolantonio F, Martini M, Molinari F,
et al: Wild-type BRAF is required for response to
panitumumab or cetuximab in metastatic colorectal cancer. J Clin
Oncol. 26:5705–5712. 2008.
|
|
16
|
Ulivi P, Capelli L, Valgiusti M, et al:
Predictive role of multiple gene alterations in response to
cetuximab in metastatic colorectal cancer: a single center study. J
Transl Med. 10:872012. View Article : Google Scholar : PubMed/NCBI
|
|
17
|
Kato S, Iida S, Higuchi T, et al:
PIK3CA mutation is predictive of poor survival in patients
with colorectal cancer. Int J Cancer. 121:1771–1778. 2007.
View Article : Google Scholar
|
|
18
|
Inno A, Di Salvatore M, Cenci T, et al: Is
there a role for IGF1R and c-MET pathways in resistance to
cetuximab in metastatic colorectal cancer? Clin Colorectal Cancer.
10:325–332. 2011. View Article : Google Scholar
|
|
19
|
Guo A, Villén J, Kornhauser J, et al:
Signaling networks assembled by oncogenic EGFR and c-Met. Proc Natl
Acad Sci USA. 105:692–697. 2008. View Article : Google Scholar : PubMed/NCBI
|
|
20
|
Sattler M, Reddy MM, Hasina R, Gangadhar T
and Salgia R: The role of the c-Met pathway in lung cancer and the
potential for targeted therapy. Ther Adv Med Oncol. 3:171–184.
2011. View Article : Google Scholar : PubMed/NCBI
|
|
21
|
Therasse P, Arbuck SG, Eisenhauer EA, et
al: New guidelines to evaluate the response to treatment in solid
tumors. European Organization for Research and Treatment of Cancer,
National Cancer Institute of the United States, National Cancer
Institute of Canada. J Natl Cancer Inst. 92:205–216. 2000.
View Article : Google Scholar
|
|
22
|
Ohnishi H, Ohtsuka K, Ooide A, Matsushima
S, Goya T and Watanabe T: A simple and sensitive method for
detecting major mutations within the tyrosine kinase domain of the
epidermal growth factor receptor gene in non-small-cell lung
carcinoma. Diagn Mol Pathol. 15:101–108. 2006. View Article : Google Scholar
|
|
23
|
Torres J, Navarro S, Roglá I, et al:
Heterogeneous lack of expression of the tumour suppressor PTEN
protein in human neoplastic tissues. Eur J Cancer. 37:114–121.
2001. View Article : Google Scholar : PubMed/NCBI
|
|
24
|
Dua R, Zhang J, Parry G and Penuel E:
Detection of hepatocyte growth factor (HGF) ligand-c-MET receptor
activation in formalin-fixed paraffin embedded specimens by a novel
proximity assay. PLoS One. 6:e159322011. View Article : Google Scholar : PubMed/NCBI
|
|
25
|
Murray S, Karavasilis V, Bobos M, et al:
Molecular predictors of response to tyrosine kinase inhibitors in
patients with non-small-cell lung cancer. J Exp Clin Cancer Res.
31:772012. View Article : Google Scholar : PubMed/NCBI
|
|
26
|
Lin B, Utleg AG, Gravdal K, et al: WDR19
expression is increased in prostate cancer compared with normal
cells, but low-intensity expression in cancers is associated with
shorter time to biochemical failures and local recurrence. Clin
Cancer Res. 14:1397–1406. 2008. View Article : Google Scholar
|
|
27
|
Halvorsen OJ, Rostad K, Øyan AM, et al:
Increased expression of SIM2-s protein is a novel marker of
aggressive prostate cancer. Clin Cancer Res. 13:892–897. 2007.
View Article : Google Scholar : PubMed/NCBI
|
|
28
|
Zeng ZL, Wu WJ, Yang J, et al: Prognostic
relevance of melanoma antigen D1 expression in colorectal
carcinoma. J Transl Med. 10:1812012. View Article : Google Scholar : PubMed/NCBI
|
|
29
|
Pandolfi PP: Breast cancer - loss of PTEN
predicts resistance to treatment. N Engl J Med. 351:2337–2338.
2004. View Article : Google Scholar : PubMed/NCBI
|
|
30
|
Jo M, Stolz DB, Esplen JE, Dorko K,
Michalopoulos GK and Strom SC: Cross-talk between epidermal growth
factor receptor and c-Met signal pathways in transformed cells. J
Biol Chem. 275:8806–8811. 2000. View Article : Google Scholar : PubMed/NCBI
|
|
31
|
Takeuchi H, Bilchik A, Saha S, et al:
c-MET expression level in primary colon cancer: a predictor of
tumor invasion and lymph node metastases. Clin Cancer Res.
9:1480–1488. 2003.
|
|
32
|
Trusolino L and Comoglio PM:
Scatter-factor and semaphorin receptors: cell signalling for
invasive growth. Nat Rev Cancer. 2:289–300. 2002. View Article : Google Scholar : PubMed/NCBI
|
|
33
|
Kiaris H and Spandidos DA: Mutations of
ras genes in human tumours (Review). Int J Oncol. 7:413–421.
1995.
|
|
34
|
Mao C, Huang YF, Yang ZY, Zheng DY, Chen
JZ and Tang JL: KRAS p. G13D mutation and codon 12 mutations
are not created equal in predicting clinical outcomes of cetuximab
in metastatic colorectal cancer: A systematic review and
meta-analysis. Cancer. 119:714–721. 2013. View Article : Google Scholar
|
|
35
|
Strumberg D, Scheulen ME, Schultheis B, et
al: Regorafenib (BAY 73-4506) in advanced colorectal cancer: a
phase I study. Br J Cancer. 106:1722–1727. 2012. View Article : Google Scholar : PubMed/NCBI
|
|
36
|
Van Cutsem E, Tabernero J, Lakomy R, et
al: Addition of aflibercept to fluorouracil, leucovorin, and
irinotecan improves survival in a phase III randomized trial in
patients with metastatic colorectal cancer previously treated with
an oxaliplatin-based regimen. J Clin Oncol. 30:3499–3506. 2012.
|