Introduction
Ovarian carcinoma is the most lethal cancer among
all gynecological malignancies (1)
due to late detection and recurrence through chemoresistance.
Despite debulking surgery and response to first-line chemotherapy
with platinum and Taxol, the majority of patients, up to 75%,
eventually suffer from recurrence due to chemoresistance (2), and 90% of the deaths from ovarian
cancer can be attributed to chemoresistance.
Ovarian carcinoma is a heterogeneous group of
neoplasms and comprises several histological subtypes: serous,
mucinous, endometrioid, clear cell and undifferentiated carcinomas.
The present study focused on high-grade serous carcinoma, which
accounts for 80% of epithelial ovarian carcinoma cases and has the
highest recurrence rate. Beyond the knowledge that a high incidence
of molecular alterations targeting TP53, HER-2 and PIK3CA (3,4) is
associated with high-grade serous carcinoma, relatively little is
known concerning the molecular alterations associated with
recurrence and chemoresistance. Therefore, a better understanding
of the molecular mechanisms leading to chemoresistance may provide
new biomarkers for predicting patient prognosis and survival, and
new treatment strategies for life-threatening ovarian cancer
(5,6).
Previous studies have shown that chemoresistance is
multifactorial, involving drug inactivation/efflux, microtubule
regulation (7), increased DNA
repair, alterations in cell cycle control, changes in apoptotic
threshold and signaling pathways such as the PI3K/AKT pathway
(8). Recently, new evidence
suggests that epithelial-to-mesenchymal transition (EMT) plays a
significant role in chemoresistance in various human cancers
(9,10). In addition, it was demonstrated that
EMT transcription factors, snail and slug, contribute to
cisplatin-resistance and cancer metastasis in ovarian cancer
(11,12). However, we did not find any
comprehensive gene expression study focusing on EMT in ovarian
cancer.
In the present study, the gene expression of
clinical specimens of high-grade ovarian serous carcinoma was
examined using qRT-PCR after screening with PCR arrays focusing on
apoptosis, EMT and cancer pathways to understand the molecular
mechanism of chemoresistance and to identify novel biomarkers to
predict the patient outcome. The mRNA expression levels of genes,
which were significantly altered in the chemoresistant tumors
compared to those of the chemosensitive tumors, were correlated
with clinicopathological parameters, including stage, metastasis
(lymph node and distant) and survival to evaluate the clinical
impact. Our results demonstrated that high expression of TERT and
goosecoid homeobox (GSC), and low expression of TRAF1 were
associated with advanced stage, chemoresistance and poor overall
survival. Further validation with immunohistochemistry confirmed
that GSC overexpression was correlated with poor overall
survival.
Materials and methods
Patients and clinical specimens
For the PCR array and qRT-PCR to evaluate mRNA
expression, 60 fresh tissues from high-grade ovarian serous
carcinomas were obtained at the time of surgery from patients
undergoing oophorectomies for ovarian carcinomas at the Bundang CHA
Medical Center (Table I). Samples
were immediately frozen in liquid nitrogen and stored at −80°C.
Frozen sections were assessed to confirm that tumor cells
represented nearly 80% of the tissue. As a normal control, 10
normal fallopian tubes were used from the patients who underwent
hysterectomies for leiomyomas.
 | Table IClinicopathological characteristics of
the ovarian serous carcinoma patients (n=60). |
Table I
Clinicopathological characteristics of
the ovarian serous carcinoma patients (n=60).
|
Chemosensitive
n (%) |
Chemoresistant
n (%) |
|---|
| Mean age (years) | 55.5±22.5 | 63±20 |
| Stage |
| I/II | 12 (20.00) | 1 (1.67) |
| III/IV | 31 (51.67) | 16 (26.67) |
| LN status |
| Negative | 20 (33.33) | 6 (10.00) |
| Positive | 23 (38.33) | 11 (18.33) |
| Metastasis |
| Negative | 32 (53.33) | 14 (23.33) |
| Positive | 11 (18.33) | 3 (5.00) |
| Total | 43 (71.67) | 17 (28.33) |
For immunohistochemical analysis, we utilized
formalin-fixed, paraffin-embedded ovarian epithelial tumor tissues
from 75 patients with high-grade ovarian serous carcinomas who had
been surgically treated at the CHA Bundang Medical Center from 1998
to 2010. Clinical and pathological data were retrieved from
clinical databases and from the original pathology reports. The
histologic type of the tumor was classified according to the WHO
ovarian tumor classification. Tumor staging was carried out
according to the tumor-node-metastasis (TNM) staging system. The
samples were divided into two groups according to responsiveness to
first-line chemotherapy. Based on the NCCN guidelines,
chemoresistant tumors were defined as those leading to persistent
or recurrent disease within 6 months after the initiation of
first-line Taxol-platinum-based combination chemotherapy.
Chemosensitive tumors were classified as those with a complete
response to chemotherapy and a platinum-free interval of >6
months. The present study was approved by the Ethics Committee of
the Bundang CHA Medical Center, and informed consent was obtained
from each patient prior to surgery.
PCR array
For screening the genes associated with
chemoresistance, PCR arrays (SABioscience, Frederick, MD, USA) were
selected that included genes involved in apoptosis (http://sabiosciences.com/rt_pcr_product/HTML/PAHS-012Z.html),
known cancer pathways (http://sabiosciences.com/rt_pcr_product/HTML/PAHS-033Z.html)
and EMT (http://sabiosciences.com/rt_pcr_product/HTML/PAHS-090Z.html).
The PCR arrays were performed using randomly selected 18 ovarian
cancer specimens (13 chemosensitive and 5 chemoresistant
carcinomas) among the samples enrolled in the present study. Two
normal fallopian tubes were used as a control. Total RNA was
isolated using TRIzol reagent (Invitrogen, Carlsbad, CA, USA)
according to the manufacturer’s instructions.
For first strand cDNA synthesis, 1 μg total RNA was
reverse-transcribed in a final reaction volume of 20 μl using the
RT2 First Strand kit (SABioscience) according to the manufacturer’s
instructions. qRT-PCR was conducted on a CFX96 thermal cycler
(Bio-Rad Applied Science, Mannheim, Germany) using universal
cycling conditions (10 min at 95°C, 15 sec at 95°C, 1 min 60°C for
40 cycles).
For data normalization and analysis, 5 endogenous
control genes, β-2-microglobulin (B2M), hypoxanthine
phosphoribosyltransferase (HPRT1), ribosomal protein L13a (RPL13A),
glyceraldehyde-3-phosphate dehydrogenase (GAPDH) and β-actin (ACTB)
on the PCR array were used. Each replicate cycle threshold (Ct) was
normalized to the average Ct of 5 endogenous controls on a per
plate basis. The comparative Ct method was used to calculate the
relative quantification of gene expression. The following formula
was used to calculate the relative amount of the transcripts in the
treated samples and the control group, both of which were
normalized to the endogenous controls. ΔΔCt = ΔCt (treated) - ΔCt
(control) for RNA samples. ΔCt is the log2 difference in
Ct between the target gene and endogenous controls by subtracting
the average Ct of the controls from each replicate. The fold change
for each treated sample relative to the control sample =
2−ΔΔCt.
PCR array quantification was based on the Ct number.
Ct was defined as 35 for the ΔCt calculation when the signal was
under detectable limits. A list of differentially expressed genes
was identified using a two-tailed t-test. Changes in gene
expression between treated groups and control groups were
illustrated as a fold increase/decrease. The criteria included a
P-value <0.05 and a mean difference of ≥2-fold. Statistical
evaluation was conducted with the web-based RT2 Profiler™ PCR Array
Data Analysis software (SABioscience).
Real-time RT-PCR
For the genes which were significantly altered by
>2-fold in the PCR arrays in the chemoresistant compared to the
chemosensitive tumors, real-time RT-PCR was conducted with 60
samples of serous carcinomas on a CFX96™ real-time PCR system
(Bio-Rad Applied Science). The final volume of 20 μl included 0.5
μl of cDNA template, 10 μl of TaqMan Master Mix (Applied
Biosystems, Foster City, CA, USA), and 1 μl of a mix containing
primers and probes. The amplification began with 2 min at 50°C, and
10 min at 95°C, followed by 50 cycles of 95°C for 15 sec and 60°C
for 1 min. The CFX Manager™ software (version 1.0) was used to
determine the cycle threshold (Ct) by default values. Individual
PCRs were performed in triplicate, and the mRNA expression level of
each gene relative to GAPDH was calculated using the
2−ΔΔCt method.
Tissue microarray and immunohistochemical
analysis
For the validation of putative markers which showed
significant association between mRNA expression and more than 2
clinicopathological parameters and survival, we performed
immunohistochemical analysis with a tissue microarray (TMA)
containing 75 ovarian serous carcinomas and 20 ovarian serous
cystadenomas and 10 normal fallopian tubes (as a control). All
tissue samples were retrieved from the archival files of the CHA
Bundang Medical Center, School of Medicine, CHA University. The
hematoxylin and eosin (H&E) sections of the selected cases were
reviewed, and the representative areas were marked on the
H&E-stained sections and the corresponding paraffin blocks. For
each case, three tissue cores with diameters of 2 mm were punched
out from the marked tissue areas of each donor tissue block. They
were then arranged into recipient paraffin blocks using a manual
microarray device (UNITMA, Quick-Ray™; Unitech Science Co., Ltd.,
Seoul, Korea).
Tissue microarray paraffin sections were
deparaffinized in xylene for 30 min and rehydrated in a graded
series of alcohols. Endogenous peroxidase activity was blocked via
30 min of treatment with 0.3% hydrogen peroxide in methanol
solution. For antigen retrieval, the sections were heated in 0.1
mol/l of citrate buffer (pH 6.0) for 15 min in a microwave oven.
Slides were incubated overnight at 4°C with the following primary
antibodies and working dilutions: TRAF1 (1:2,000; Novus
Biologicals, Littleton, CO, USA), TERT (1:200; Novus Biologicals)
and GSC (1:200; Abnova, Taipei, Taiwan). Thereafter, 30 min of
incubation with the secondary antibody was carried out using a Dako
EnVision Rabbit/Mouse kit at room temperature. The sections were
then developed with diaminobenzidine and counterstained with
hematoxylin. Positive nuclear or cytoplasmic staining in >50% of
the tumor cells was considered indicative of overexpression.
Statistical analysis
Significant differences between groups were
determined using the Student’s t-test and χ2-test.
Survival curves were estimated using the Kaplan-Meier method and
compared using the log-rank test. A P-value <0.05 was considered
statistically significant. Statistical analysis was performed using
SPSS 19.0 software (SPSS, Inc., Chicago, IL, USA).
Results
Gene expression profile by PCR array
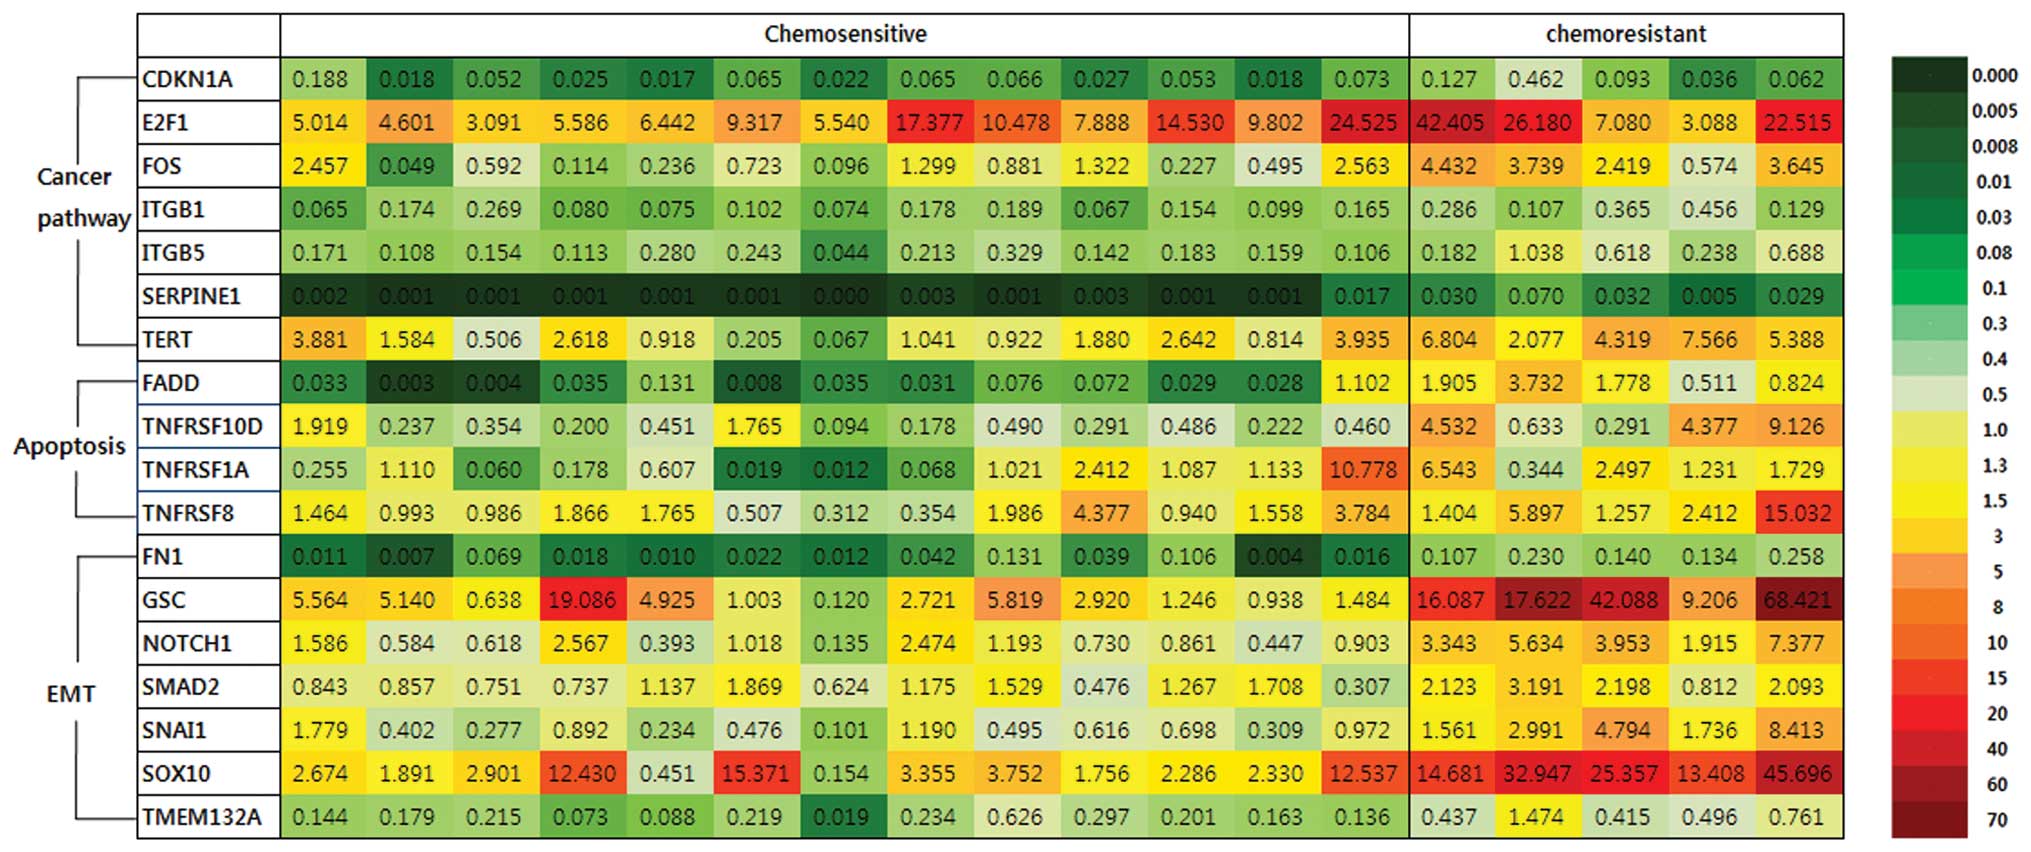
To select candidate prognostic markers, we analyzed
the mRNA expression of 18 ovarian serous carcinomas using PCR
arrays including genes involved in known cancer pathways, apoptosis
and EMT, and we compared the expression profile of the
chemoresistant tumors to that of the chemosensitive tumors
(Fig. 1). Among 84 genes involved
in cancer pathways associated with cancer adhesion, apoptosis, cell
senescence, cell cycle, invasion and metastasis, 6 genes, ITGB1,
ITGB5, TERT, E2F1, SERPINE1 and FOS, were significantly upregulated
by >2-fold in the chemoresistant compared to the chemosensitive
tumors (Table II). CDKN1A was
significantly downregulated by >2-fold in the chemoresistant
group. Among these genes, FOS (5.76-fold), TERT (4.23-fold) and
SERPINE1 (9.49-fold) had the highest statistically significant
upregulation in the chemoresistant tumors.
| Table IICancer pathway genes with mRNA levels
significantly altered by >2-fold in the chemoresistant compared
to the chemosensitive ovarian serous carcinomas as determined by
the PCR array. |
Table II
Cancer pathway genes with mRNA levels
significantly altered by >2-fold in the chemoresistant compared
to the chemosensitive ovarian serous carcinomas as determined by
the PCR array.
| Gene symbol | Gene | Function | CS/C | CR/C | CR/CS | P-value |
|---|
| Adhesion |
| ITGB1 | Integrin β 1 | Increase | −7.80 | −3.74 | 2.01 | 0.048 |
| ITGB5 | Integrin β 5 | Increase | −5.85 | −1.81 | 2.26 | 0.013 |
| Cell senescence |
| TERT | Telomerase reverse
transcriptase | Increase | 1.62 | 5.21 | 4.23 | 0.001 |
| Cell cycle control
and DNA damage repair |
| E2F1 | E2F transcription
factor 1 | Increase | 9.59 | 20.00 | 2.81 | 0.010 |
| CDKN1A | Cyclin-dependent
kinase inhibitor 1A | Decrease | −3.45 | −9.09 | −2.56 | 0.006 |
| Invasion and
metastasis |
| SERPINE1 | Serpin peptidase
inhibitor clade E, member 1 | Increase | −331.51 | −30.17 | 9.49 | 0.003 |
| Signal transduction
molecules and transcription factors |
| FOS | FBJ murine
osteosarcoma viral oncogene homolog | Increase | −1.75 | 2.94 | 5.76 | 0.007 |
Among 84 genes involved in apoptosis, 4 genes
associated with the TNF ligand and TRAF families, FADD (5.56-fold),
TNFRSF10D (6.88-fold), TNFRSF1A (2.93-fold) and TNFRSF8 (3.14-fold)
were significantly upregulated by >2-fold in the chemoresistant
compared to the chemosensitive tumors (Table III). FADD, TNFRSF1A and TNFRSF8
mediate apoptotic signals, whereas TNFRSF10D inhibits TRAIL-induced
apoptosis. TNFRSF10A, TNFRSF10C and TRAF1 were significantly
downregulated by >2-fold in this group.
| Table IIIApoptosis-related genes with mRNA
levels significantly altered by >2-fold in the chemoresistant
compared to the chemosensitive ovarian serous carcinomas as
determined by the PCR array. |
Table III
Apoptosis-related genes with mRNA
levels significantly altered by >2-fold in the chemoresistant
compared to the chemosensitive ovarian serous carcinomas as
determined by the PCR array.
| Gene symbol | Gene | Function | CS/C | CR/C | CR/CS | P-value |
|---|
| TNF ligand, TNFR
and TRAF families |
| FADD |
Fas(TNFRSF6)-associated via death
domain | Increase | −16.20 | −2.91 | 5.56 | 0.023 |
| TNFRSF10A | TNF receptor
superfamily, member 10A | Decrease | −2.33 | −5.00 | −2.17 | 0.000 |
| TNFRSF10C | TNF receptor
superfamily, member 10C | Decrease | −1.79 | −11.11 | −6.25 | 0.003 |
| TNFRSF10D | TNF receptor
superfamily, member 10D | Decrease | −1.82 | 3.79 | 6.88 | 0.031 |
| TNFRSF1A | TNF receptor
superfamily, member 1A | Increase | 1.04 | 3.04 | 2.93 | 0.039 |
| TNFRSF8 | TNF receptor
superfamily, member 8 | Increase | 1.65 | 5.18 | 3.14 | 0.032 |
| TRAF1 | TNF
receptor-associated factor 1 | Decrease | 1.72 | −1.61 | −2.78 | 0.004 |
Among 84 genes involved in EMT, 7 genes, FN1
(4.77-fold), GSC (8.15-fold), NOTCH1 (4.45-fold), SMAD2
(2.11-fold), SNAI1 (6.79-fold), SOX10 (5.93-fold) and TMEM132A
(3.69-fold) were significantly upregulated by >2.0-fold in the
chemoresistant group compared to the chemosensitive group (Table IV). GSC, SOX10 and SNAI1 were
upregulated by >5-fold.
| Table IVEMT-related genes with mRNA levels by
the PCR array significantly altered by >2-fold in chemoresistant
compared to chemosensitive ovarian serous carcinomas. |
Table IV
EMT-related genes with mRNA levels by
the PCR array significantly altered by >2-fold in chemoresistant
compared to chemosensitive ovarian serous carcinomas.
| Gene symbol | Gene | Function | CS/C | CR/C | CR/CS | P-value |
|---|
| FN1 | Fibronectin 1 | Increase | −26.08 | −5.78 | 4.77 | 0.010 |
| GSC | Goosecoid
homeobox | Increase | 3.99 | 30.76 | 8.15 | 0.005 |
| NOTCH 1 | Notch 1 | Increase | 1.00 | 4.22 | 4.45 | 0.004 |
| SMAD2 | SMAD family member
2 | Increase | 1.03 | 2.05 | 2.11 | 0.017 |
| SNAI 1 | Snail homolog
1 | Increase | −1.64 | 3.92 | 6.79 | 0.007 |
| SOX10 | SRY (sex
determining region Y)-box 10 | Increase | 4.71 | 26.41 | 5.93 | 0.019 |
| TMEM132A | Transmembrane
protein 132A | Increase | −5.68 | −1.63 | 3.69 | 0.005 |
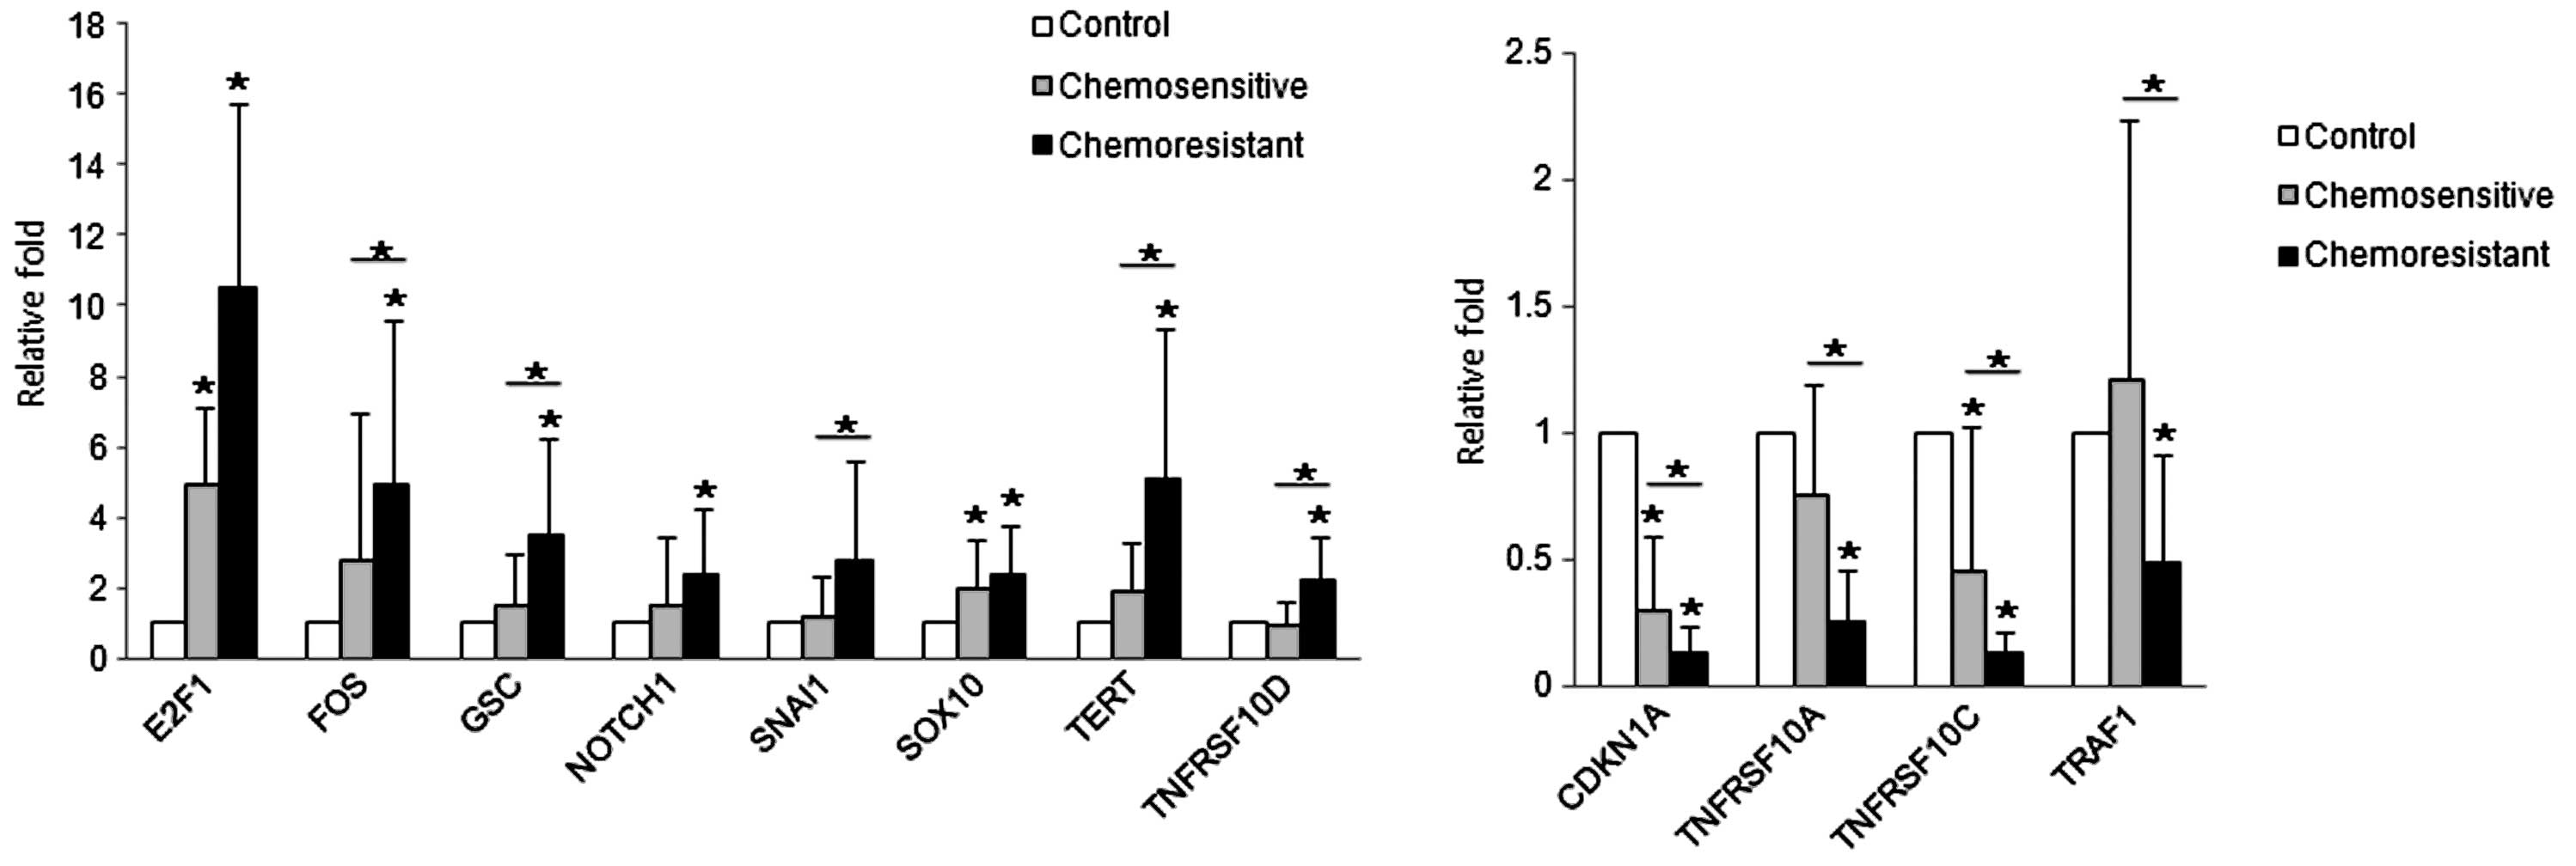
mRNA expression patterns by qRT-PCR
qRT-PCR was performed in 60 cases of high-grade
serous carcinomas for the genes which were found to be
significantly altered in the chemoresistant group in the PCR array
(listed in Tables II–IV), and thought to accelerate the
oncogenic process. The expression patterns by qRT-PCR were
consistent with those of the PCR array. The mean mRNA expression
levels of E2F1, FOS, GSC, NOTCH1, SNAI1, SOX10, TERT and TNFRSF10D
in the serous carcinomas were higher (7.8-fold, P<0.001;
3.9-fold, P=0.585; 2.5-fold, P=0.865; 2.0-fold, P=0.121; 2.0-fold,
P=0.375; 2.2-fold, P=0.003; 3.5-fold P=0.129 and 1.6-fold, P=0.105,
respectively) than those of the control. In contrast, the mean mRNA
expression levels of CDKN1A, TNFRSF10A, TNFRSF10C and TRAF1 in the
serous carcinomas were lower (0.2-fold, P=0.005; 0.5-fold, P=0.072;
0.3-fold, P=0.003 and 0.8-fold, P=0.574, respectively) than those
of the control (Fig. 2).
We also analyzed whether the mRNA expression of each
gene was significantly different between the chemosensitive and
chemoresistant group. Seventeen patients (28.3%) among the 60
patients with high-grade ovarian serous carcinomas experienced
tumor recurrence or persistence after surgery, representing
resistance to a first-line chemotherapeutic regimen consisting of
Taxol and carboplatin. Among the genes examined, FOS, GSC, SNAI1,
TERT and TNFRSF10D showed significantly higher levels (1.8-fold,
P=0.009; 2.2-fold, P=0.021; 2.4-fold, P=0.016; 2.6-fold, P=0.036;
2.4-fold, P=0.006, respectively) in the chemoresistant group
compared with the chemosensitive group. The expression levels of
CDKN1A, TNFRSF10A TNFRSF10C and TRAF1 were significantly lower
(0.4-fold, P=0.006; 0.4-fold, P=0.001; 0.3-fold, P=0.003 and
0.4-fold, P=0.004, respectively) than those of the chemosensitive
group (Fig. 2).
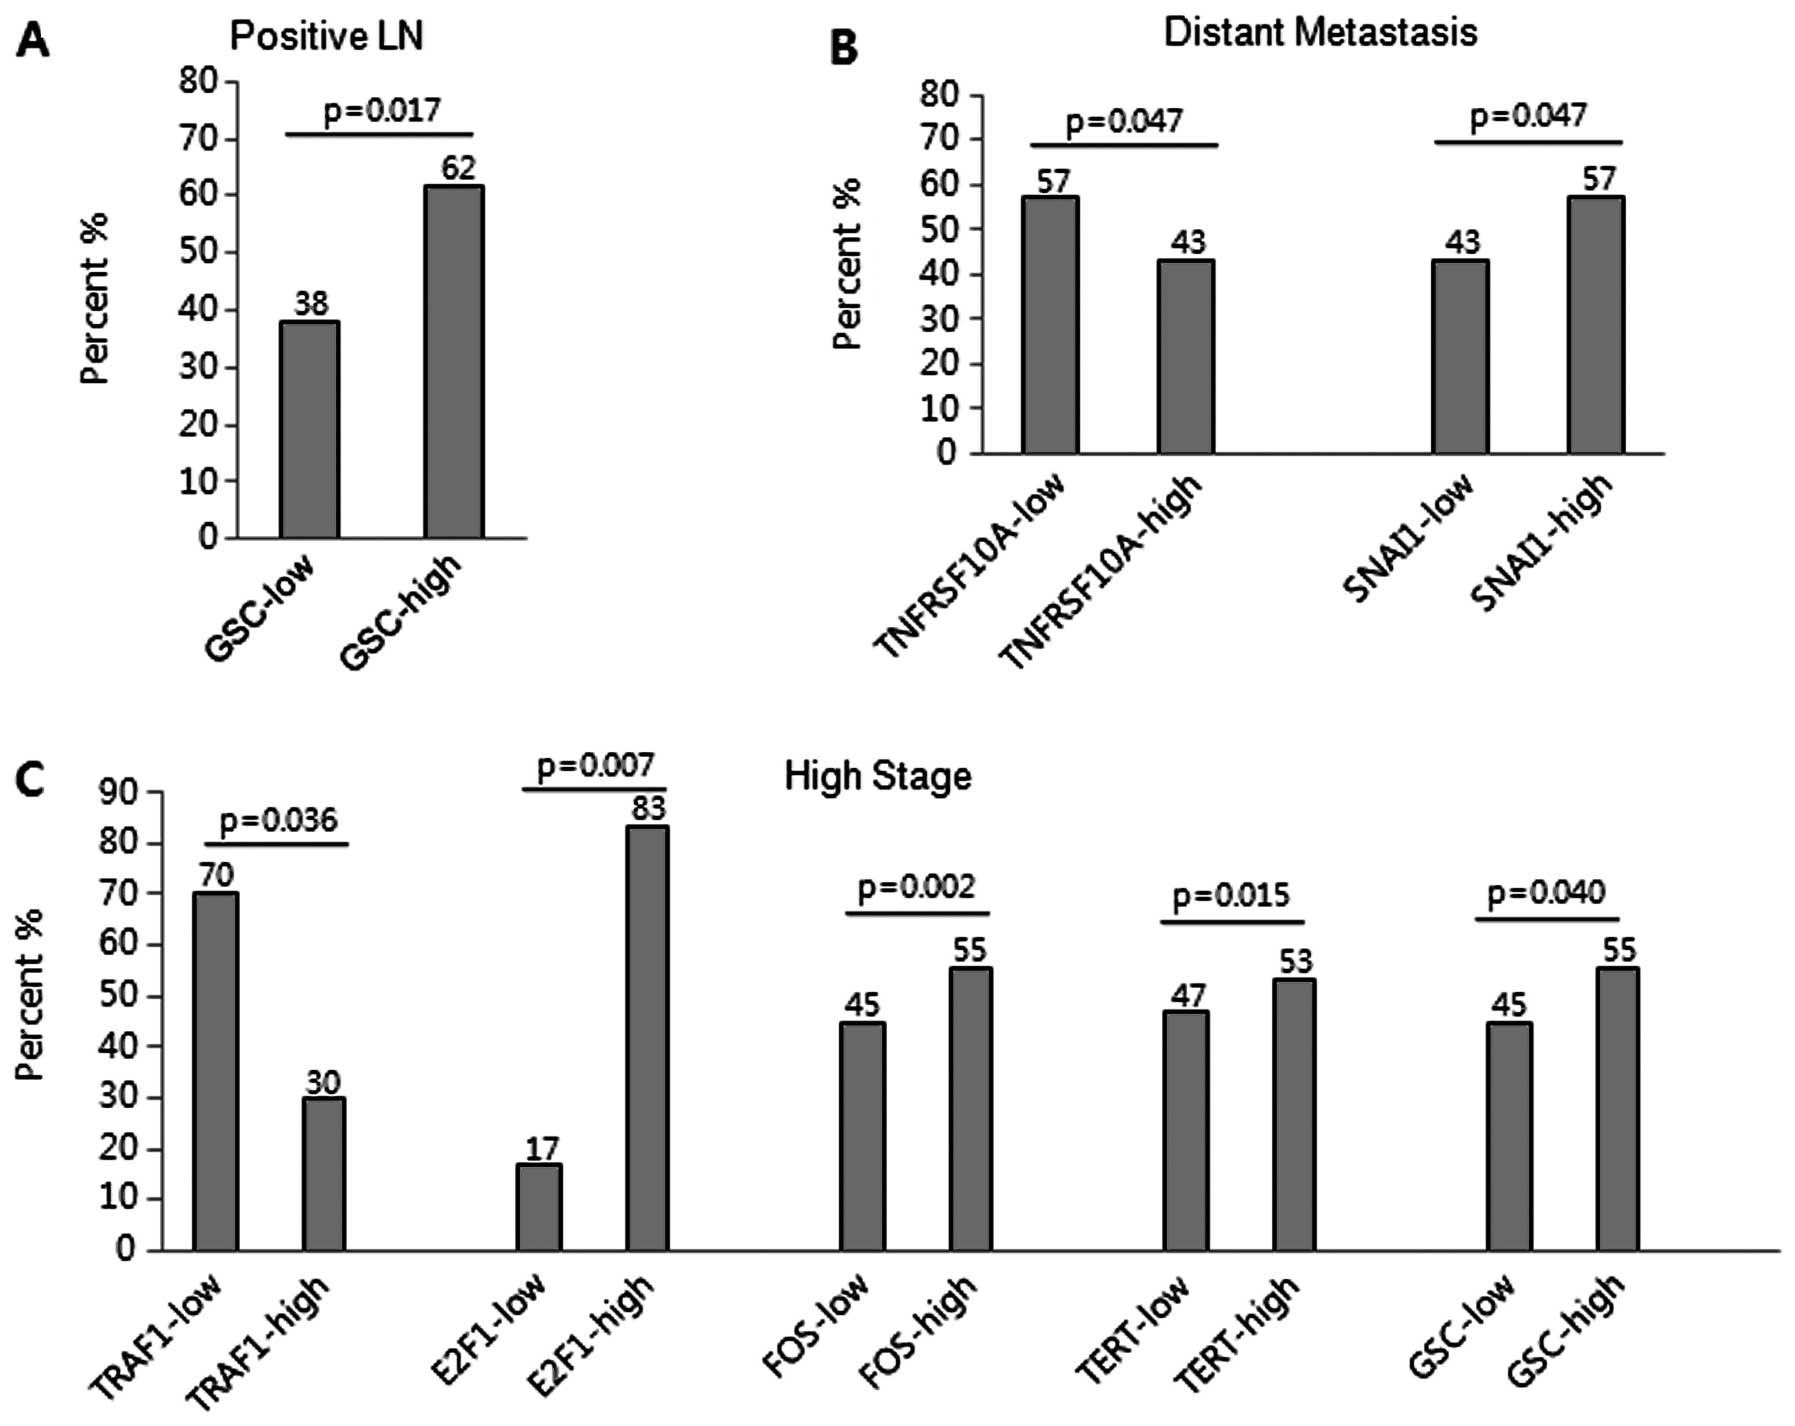
Correlation of mRNA expression with
clinicopathological parameters
The potential association between mRNA expression
and clinicopathological parameters, including clinical stage, lymph
node metastasis, distant metastasis and survival, was examined to
assess the clinical implication of the differentially regulated
genes in ovarian serous carcinomas (Table V). Lymph node metastasis was
significantly associated with high expression of GSC (≥1.5-fold,
P=0.017) (Fig. 3A). Distant
metastasis was significantly associated with low expression of
TNFRSF10A (≤0.5-fold, P=0.047) and high expression of SNAI1
(≥1.5-fold, P=0.047) (Fig. 3B). Low
expression of TRAF1 (≤0.5 fold, P=0.036) and high expression of
E2F1 (≥2-fold, P=0.007), FOS (≥2-fold, P=0.002), TERT (≥1.5-fold,
P=0.015) and GSC (≥1.5-fold, P=0.040) were significantly associated
with advanced clinical stage (Fig.
3C). The chemoresistance was significantly associated with low
expression of TNFRSF10C (≤0.1-fold, P=0.001), TRAF1 (≤0.5-fold,
P=0.012) and CDKN1A (≤0.3-fold, P=0.003), and high expression of
FOS (≥2-fold, P=0.012), TERT (≥1.5-fold, P=0.050), GSC (≥1.5-fold,
P=0.030), NOTCH1 (≥1.5-fold, P=0.025) and SOX10 (≥1.5-fold,
P=0.024).
| Table VCorrelation between mRNA expression
and clinicopathological variables. |
Table V
Correlation between mRNA expression
and clinicopathological variables.
| LN | Metastasis | Stage | Chemoresponse |
|---|
|
|
|
|
|
|---|
| P | N | P-value | P | N | P-value | III, IV | I, II | P-value | R | S | P-value |
|---|
| Apoptosis |
| TNFRSF10A |
| ≤0.5 | 12 (35.3) | 9 (34.6) | 0.956 | 8 (57.1) | 13 (28.3) |
0.047a | 18 (38.3) | 3 (23.1) | 0.309 | 8 (47.1) | 13 (30.2) | 0.218 |
| >0.5 | 22 (64.7) | 17 (65.4) | | 6 (42.9) | 33 (71.7) | | 29 (61.7) | 10 (76.9) | | 9 (52.9) | 30 (69.8) | |
| TNFRSF10C |
| ≤0.1 | 12 (35.3) | 10 (38.5) | 0.801 | 3 (21.4) | 19 (41.3) | 0.177 | 18 (38.3) | 4 (30.8) | 0.618 | 12 (70.6) | 10 (23.3) |
0.001a |
| >0.1 | 22 (64.7) | 16 (61.5) | | 11 (78.6) | 27 (58.7) | | 29 (61.7) | 9 (69.2) | | 5 (29.4) | 33 (76.7) | |
| TRAF1 |
| ≤0.5 | 24 (70.6) | 14 (53.8) | 0.182 | 9 (64.3) | 29 (63.0) | 0.933 | 33 (70.2) | 5 (38.5) |
0.036a | 15 (88.2) | 23 (53.5) |
0.012a |
| >0.5 | 10 (29.4) | 12 (46.2) | | 5 (35.7) | 17 (37.0) | | 14 (29.8) | 8 (61.5) | | 2 (11.8) | 20 (46.5) | |
| Cancer pathway
finder |
| CDKN1A |
| ≤0.3 | 20 (58.8) | 15 (57.7) | 0.930 | 9 (64.3) | 26 (56.5) | 0.606 | 29 (61.7) | 6 (46.2) | 0.314 | 15 (88.2) | 20 (46.5) |
0.003a |
| >0.3 | 14 (41.2) | 11 (42.3) | | 5 (35.7) | 20 (43.5) | | 18 (38.3) | 7 (53.8) | | 2 (11.8) | 23 (53.5) | |
| E2F1 |
| ≥2 | 28 (82.4) | 17 (65.4) | 0.133 | 11 (78.6) | 34 (73.9) | 0.724 | 39 (83.0) | 6 (46.2) |
0.007a | 15 (88.2) | 30 (69.8) | 0.135 |
| <2 | 6 (17.6) | 9 (34.6) | | 3 (21.4) | 12 (26.1) | | 8 (17.0) | 7 (53.8) | | 2 (11.8) | 13 (30.2) | |
| FOS |
| ≥2 | 18 (52.9) | 9 (34.6) | 0.157 | 5 (35.7) | 22 (47.8) | 0.425 | 26 (55.3) | 1 (7.7) |
0.002a | 12 (70.6) | 15 (34.9) |
0.012a |
| <2 | 16 (47.1) | 17 (65.4) | | 9 (64.3) | 24 (52.2) | | 21 (44.7) | 12 (92.3) | | 5 (29.4) | 28 (65.1) | |
| TERT |
| ≥1.5 | 17 (50.0) | 10 (38.5) | 0.373 | 8 (57.1) | 19 (41.3) | 0.297 | 25 (53.2) | 2 (15.4) |
0.015a | 11 (64.7) | 16 (37.2) |
0.050a |
| <1.5 | 17 (50.0) | 16 (61.5) | | 6 (42.9) | 27 (58.7) | | 22 (46.8) | 11 (84.6) | | 6 (35.3) | 27 (62.8) | |
| EMT |
| GSC |
| ≥1.5 | 21 (61.8) | 8 (30.8) |
0.017a | 7 (50.0) | 22 (47.8) | 0.887 | 26 (55.3) | 3 (23.1) |
0.040a | 12 (70.6) | 17 (39.5) |
0.030a |
| <1.5 | 13 (38.2) | 18 (69.2) | | 7 (50.0) | 24 (52.2) | | 21 (44.7) | 10 (76.9) | | 5 (29.4) | 26 (60.5) | |
| NOTCH1 |
| ≥1.5 | 13 (38.2) | 9 (34.6) | 0.773 | 4 (28.6) | 18 (39.1) | 0.473 | 18 (38.3) | 4 (30.8) | 0.618 | 10 (58.8) | 12 (27.9) |
0.025a |
| <1.5 | 21 (61.8) | 17 (65.4) | | 10 (71.4) | 28 (60.9) | | 29 (61.7) | 9 (69.2) | | 7 (41.2) | 31 (72.1) | |
| SNAI1 |
| ≥1.5 | 14 (41.2) | 7 (26.9) | 0.251 | 8 (57.1) | 13 (28.3) |
0.047a | 20 (42.6) | 1 (7.7) | 0.020 | 9 (52.9) | 12 (27.9) | 0.067 |
| <1.5 | 20 (58.8) | 19 (73.1) | | 6 (42.9) | 33 (71.7) | | 27 (57.4) | 12 (92.3) | | 8 (47.1) | 31 (72.1) | |
| SOX10 |
| ≥1.5 | 17 (50.0) | 15 (57.7) | 0.554 | 6 (42.9) | 26 (56.5) | 0.370 | 25 (53.2) | 7 (53.8) | 0.967 | 13 (76.5) | 19 (44.2) |
0.024a |
| <1.5 | 17 (50.0) | 11 (42.3) | | 8 (57.1) | 20 (43.5) | | 22 (46.8) | 6 (46.2) | | 4 (23.5) | 24 (55.8) | |
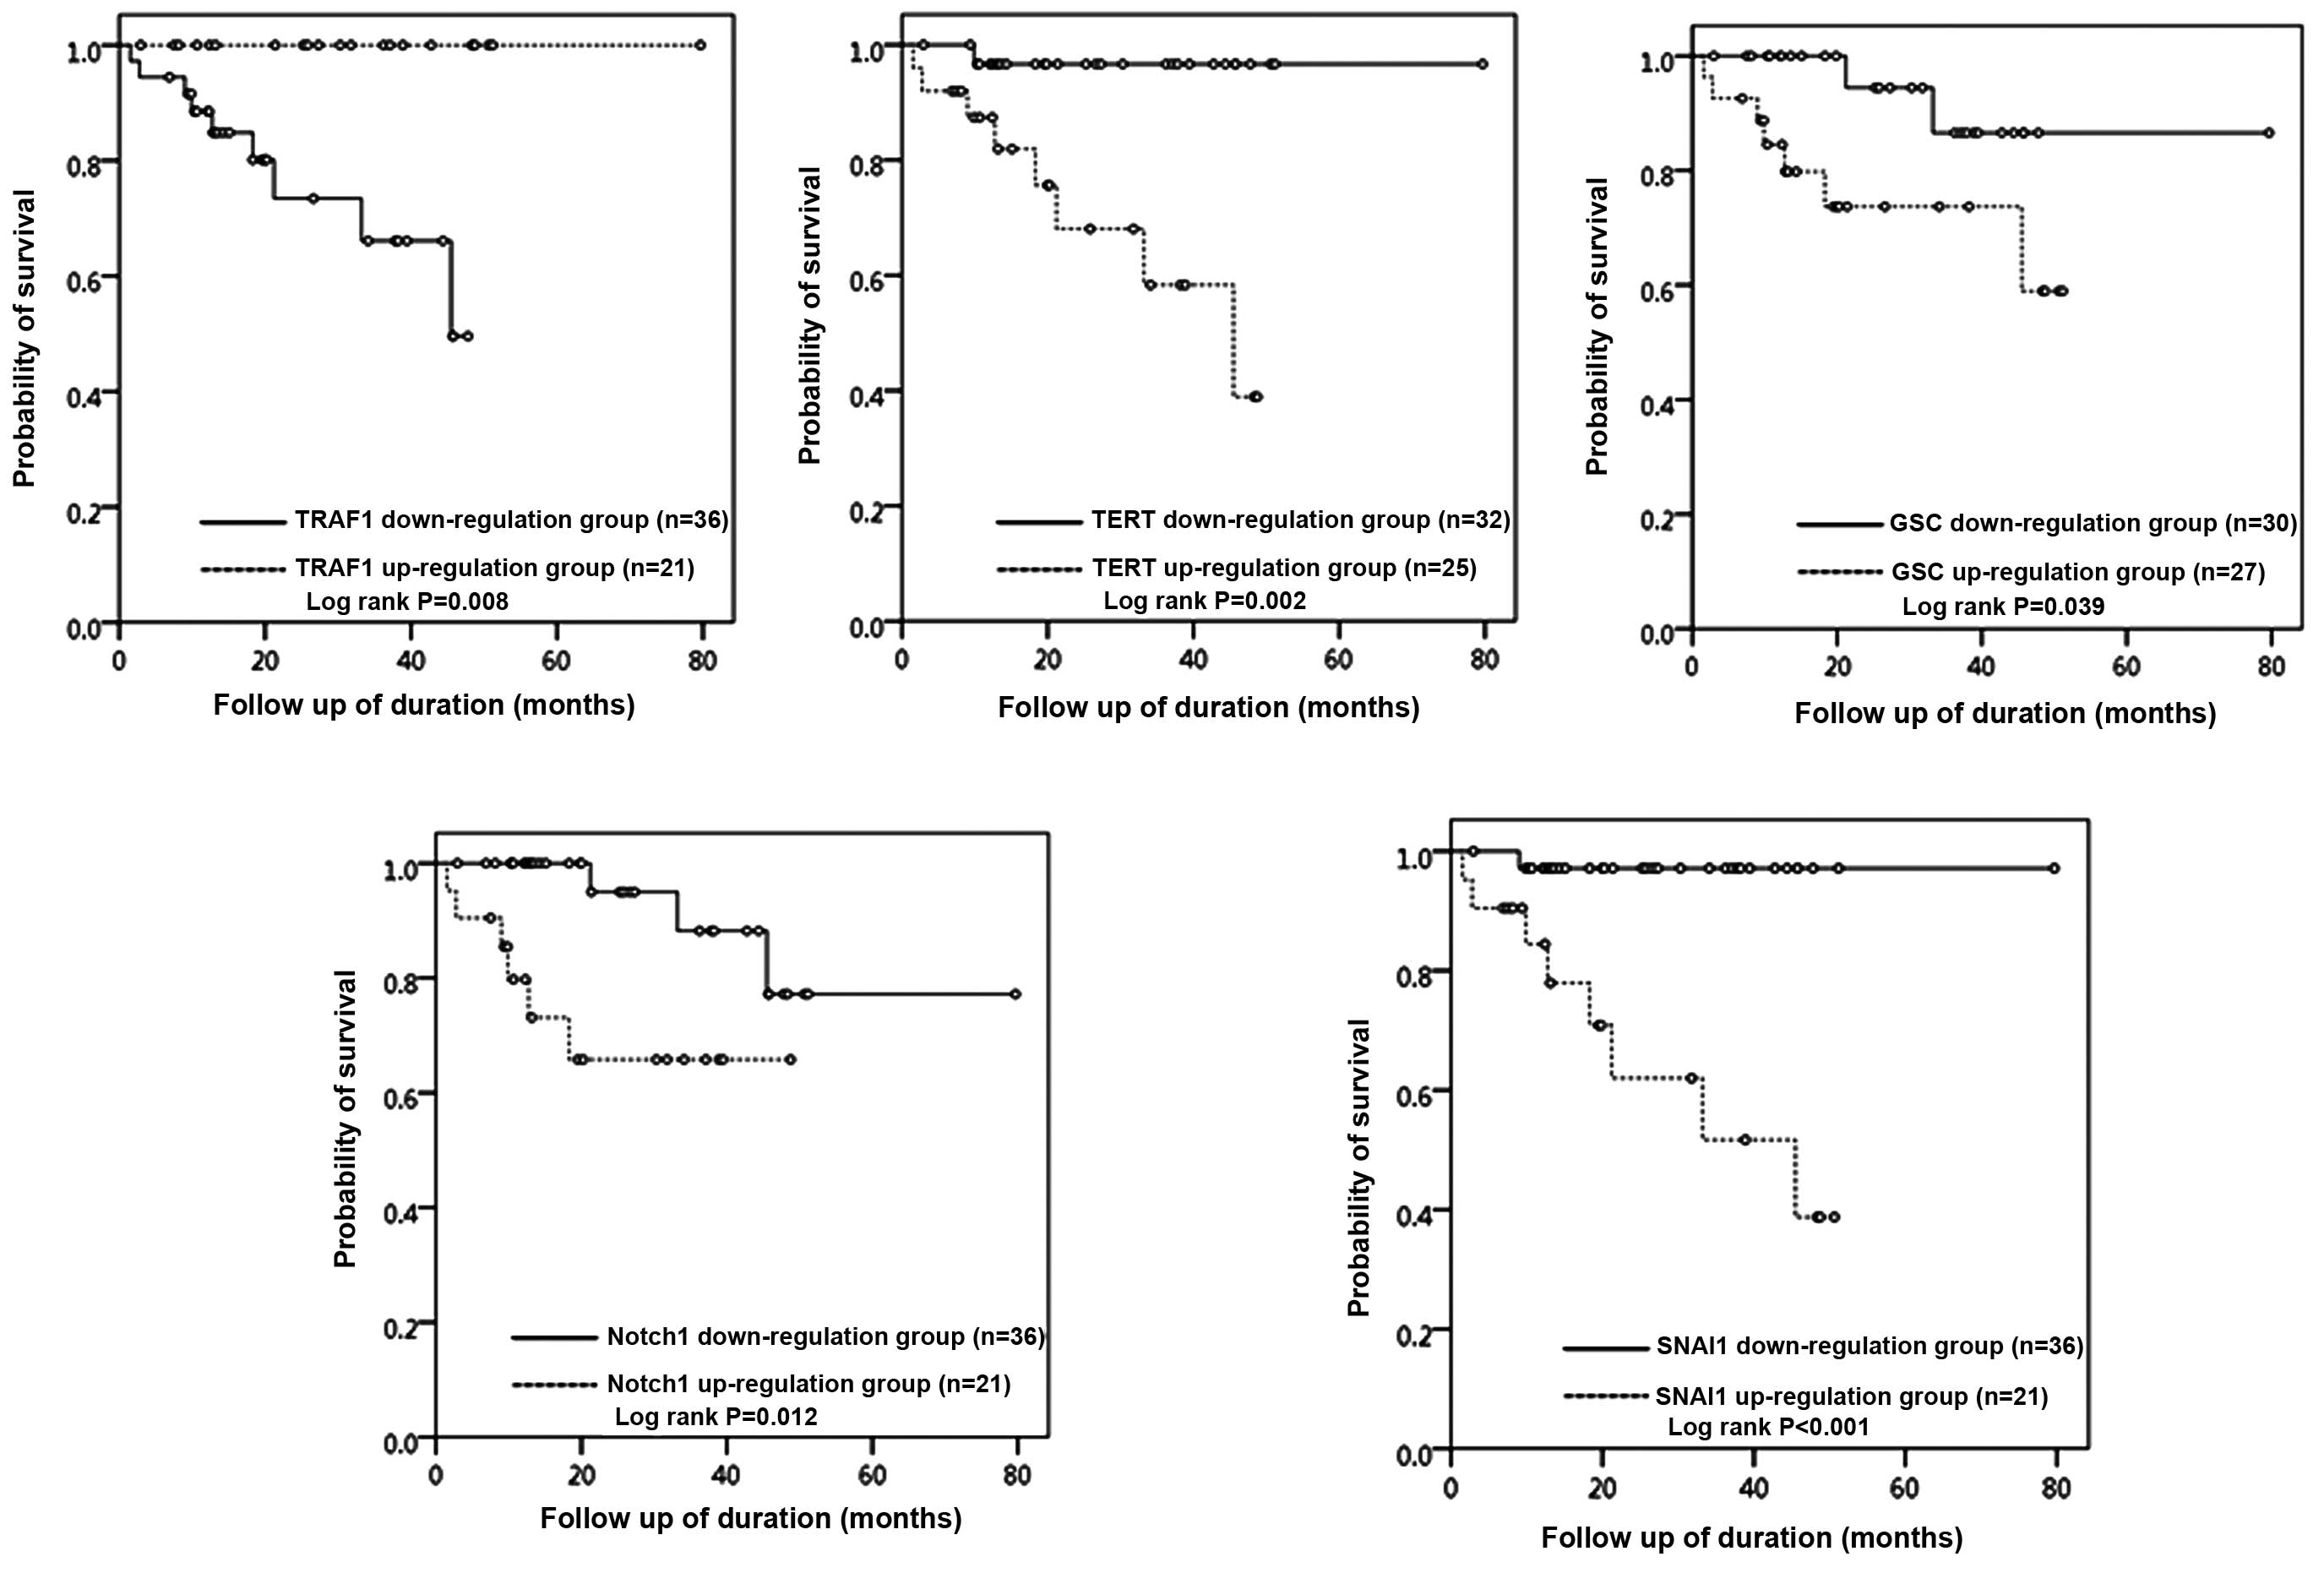
Survival analysis
The survival analysis was performed for 60 ovarian
serous carcinoma patients according to the mRNA expression level of
each gene. Follow-up was available for all 57 patients with serous
carcinomas, and the mean follow-up period of the study population
was 29 months (range, 2–80 months). Nine patients (15.8%) died of
disease during the follow-up period. For each gene, patients were
divided into two groups, an upregulation group and a downregulation
group, based on the cut-off value of 1.5-fold (for upregulated
genes) or 0.5-fold (for downregulated genes) compared to the level
observed in the control. The upregulation group for TERT (OS: 68.0
vs. 96.9%, P=0.002), GSC (OS 74.1 vs. 93.3%, P=0.039), NOTCH1 (OS:
71.4 vs. 91.7%, P=0.012) and SANI1 (OS: 61.9 vs. 97.2%, P=0.001)
demonstrated a statistically significant decrease in overall
survival (Fig. 4) compared with
that of the downregulation group. The downregulation group for
TRAF1 (OS: 75.0 vs. 100.0%, P=0.008) demonstrated a statistically
significant decrease in overall survival (Fig. 4) compared with that of the
upregulation group.
Validation with TMA and
immunohistochemistry
We performed immunohistochemistry with a larger
number of 75 ovarian serous carcinomas for the genes which showed a
significant association of mRNA expression with more than 2
clinicopathological parameters and survival, such as TRAF1, TERT
and GSC to validate their clinical impact at the protein level.
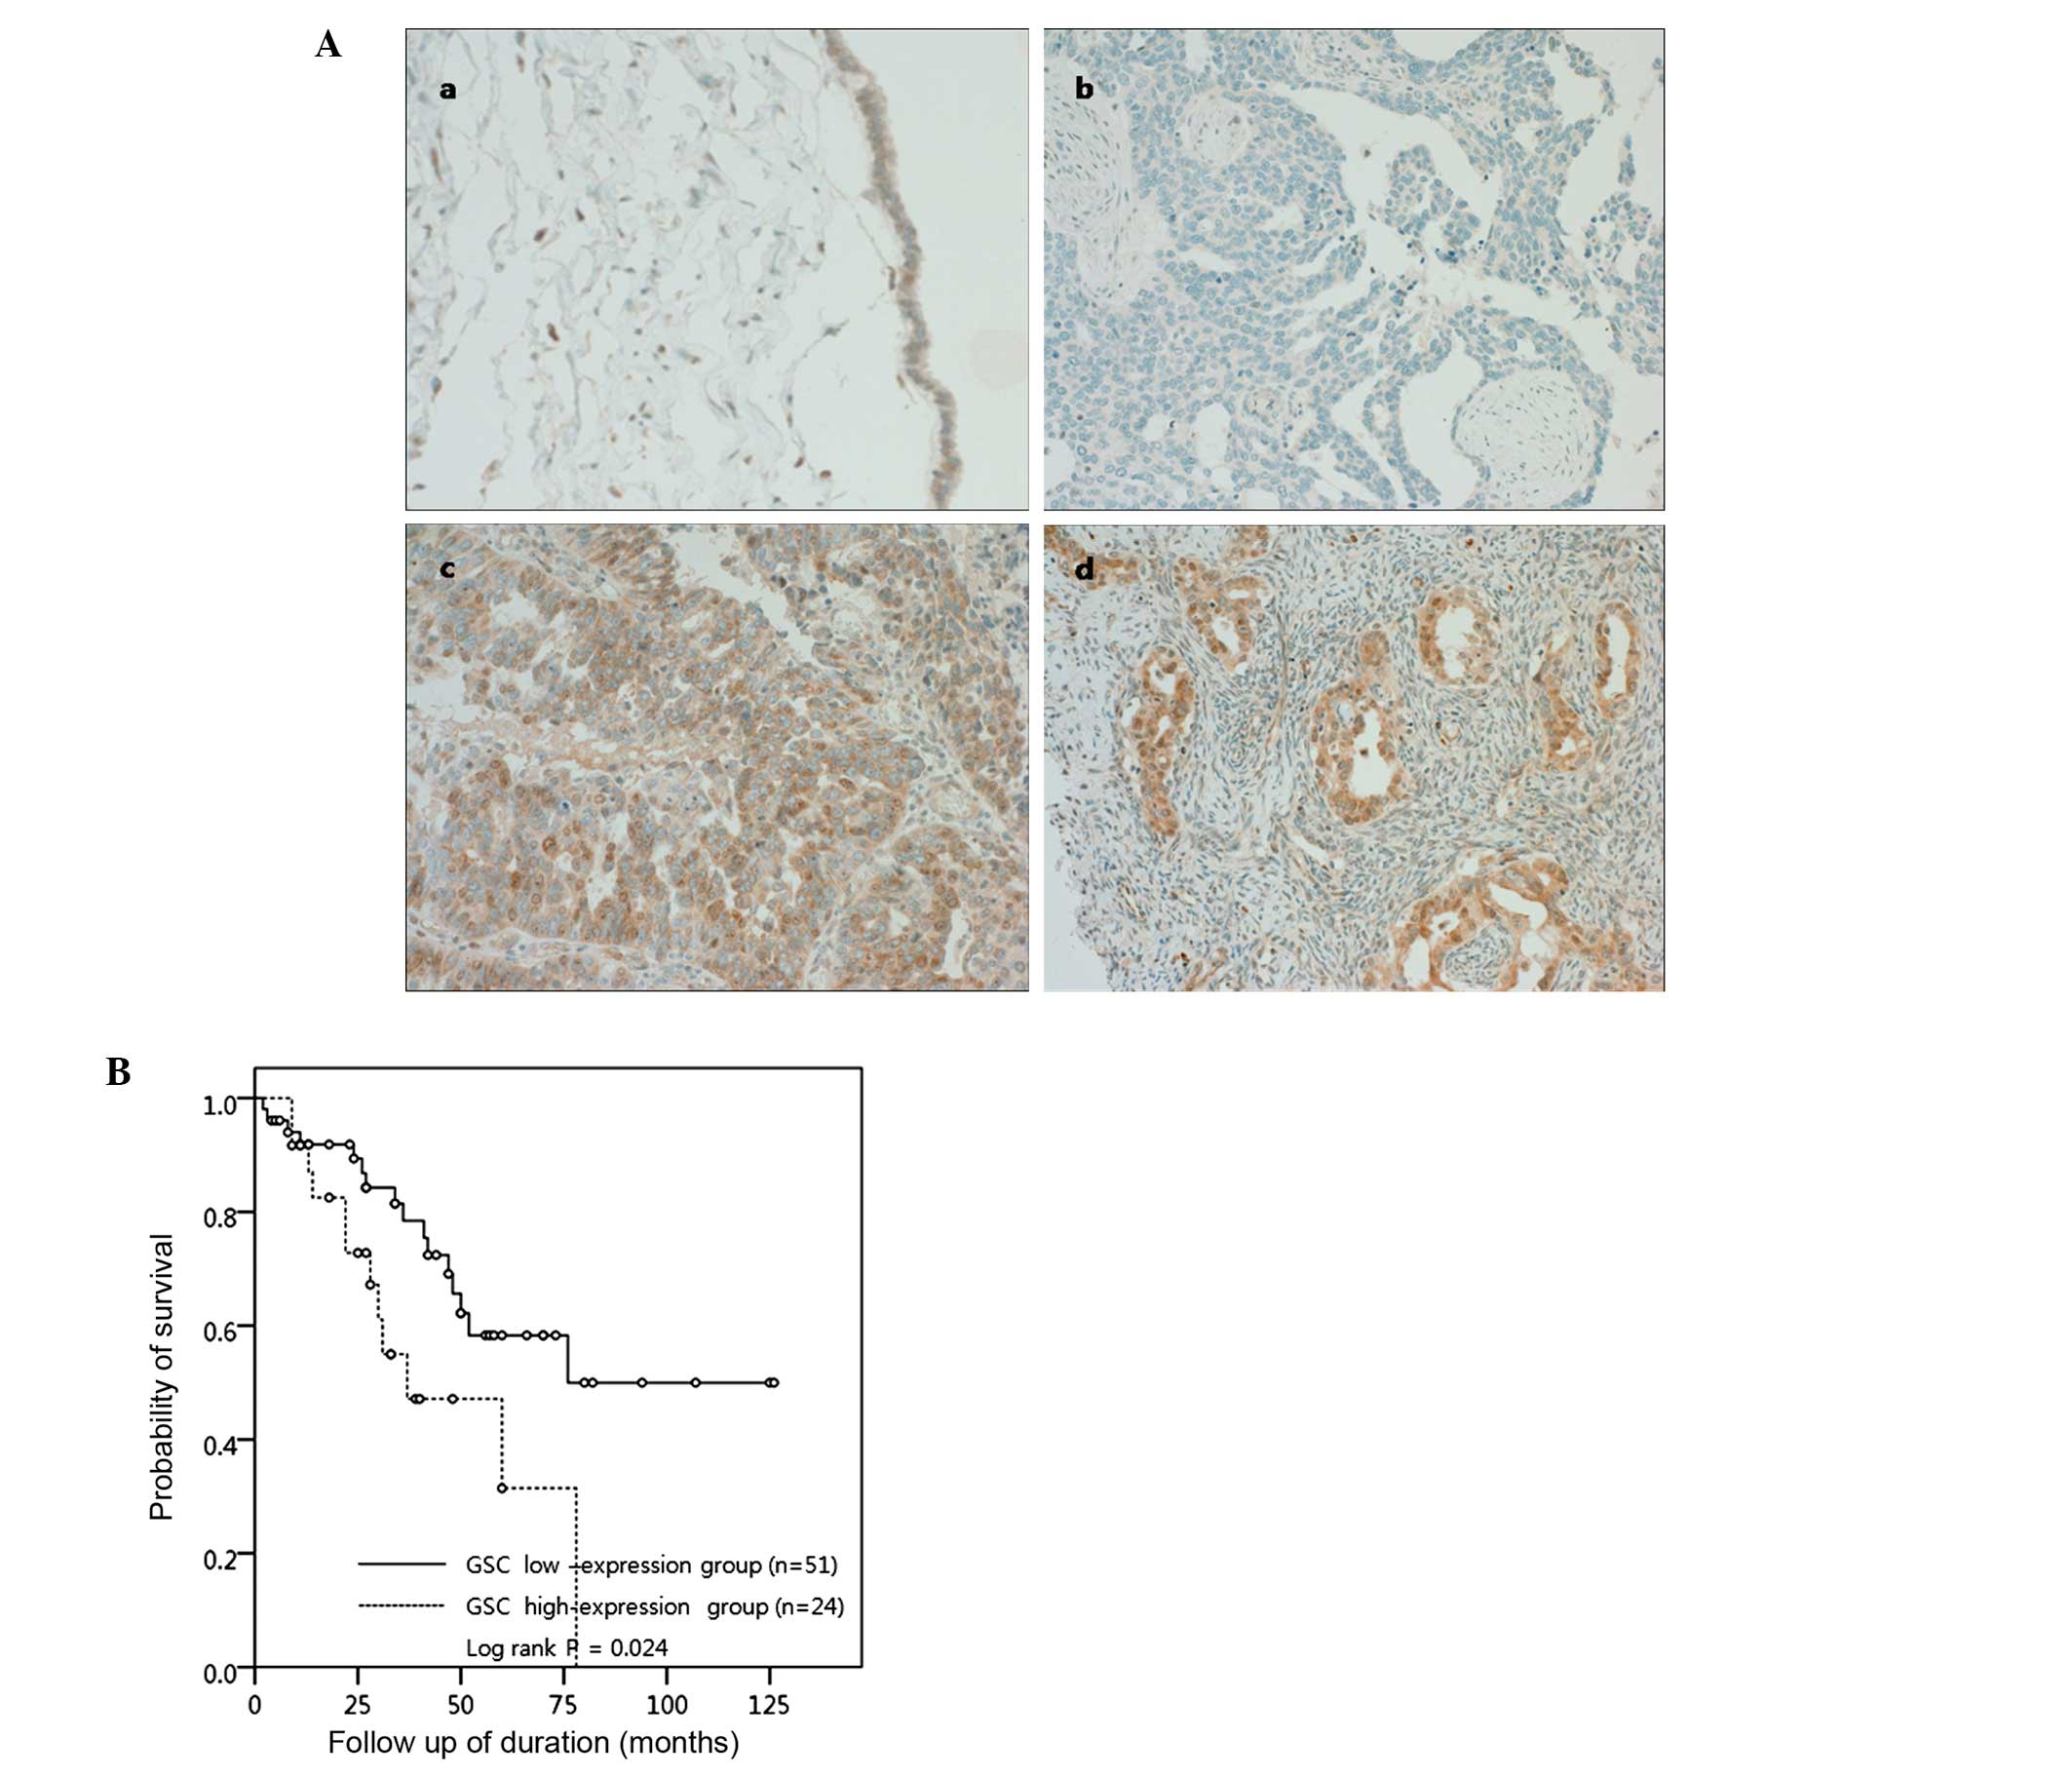
Among the proteins examined, GSC overexpression showed a
significant association with patient survival. The nuclear and/or
cytoplasmic expression of GSC protein was observed in 48 (64%) of
75 ovarian serous carcinomas, whereas it was weakly expressed in
<10% of epithelial cells of normal fallopian tubes or benign
serous tumors. The overexpression of GSC (positive cells >50% of
tumor cells) was found in 24 (32%) ovarian serous carcinomas
(Fig. 5A). Among 75 patients, 28
patients (37.3%) died of disease during the follow-up period. A
Kaplan-Meier survival analysis (Fig.
5B) revealed that the GSC-overexpressing group was
significantly correlated with poor patient survival (OS: 50.0 vs.
68.6%, P=0.024). The expression of TRAF1 or TERT did not show a
significant difference between the control and the malignant serous
tumors, and any association with patient survival.
Discussion
Ovarian carcinoma is the most frequent cause of
mortality among gynecological malignancies. Treatment generally
consists of surgical cytoreduction and platinum/taxane-based
chemotherapy (13). The majority of
patients with advanced stage eventually relapse within 18 months,
many with chemoresistance. Indeed, 90% of the deaths from ovarian
cancer may be attributed to chemoresistance (5). Therefore, the development of
strategies to overcome chemoresistance in ovarian cancer is
urgently needed.
Recent studies indicate that chemoresistance is
multifactorial and may involve increased drug inactivation/efflux,
increased DNA repair, alterations in cell cycle control and changes
in apoptosis. Several signal transduction pathways, including
PI3K/AKT and MAPK, are involved in the drug resistance in many
malignancies (8,14). A better understanding of the
molecular mechanism of chemoresistance may lead to new approaches
to overcome it and improve survival; however, despite vigorous
efforts, no marked advances have been reported in the clinical
field.
In the present study, to identify genes contributing
to the development of chemoresistance, the gene expression of
ovarian carcinomas was profiled by PCR arrays, and chemoresistant
tumors were compared to chemosensitive tumors. The selected arrays
focused on apoptosis, EMT and cancer development pathways since the
response to chemotherapeutic agents is mainly dependent upon
apoptotic ability, and since chemoresistance is associated with EMT
(15,16). We then validated mRNA expression by
qRT-PCR for the candidate genes, which showed a significantly
differential expression between chemosensitive and chemoresistant
tumors.
For cancer development pathways, the qRT-PCR arrays
contained 84 genes involved in cell adhesion, senescence, cell
cycle control, invasion/metastasis, apoptosis and signal
transduction/transcription. Six genes, including ITGB1, ITGB5,
TERT, E2F1, SERPINE1 and FOS, were upregulated by >2-fold in the
chemoresistant compared to the chemosensitive tumors. However,
ITGB1, ITGB5 and SERPINE1 were unexpectedly downregulated in the
cancer tissues compared to normal epithelium; therefore, these
genes were not thought to have a significant impact on oncogenesis
or chemoresistance in this subset of ovarian carcinomas. On the
other hand, upregulation of TERT and FOS was associated with
advanced clinical stage as well as chemoresistance. In terms of
apoptosis, four genes associated with the TNF ligand and TRAF
families, FADD, TNFRSF10D, TNFRSF1A and TNFRSF8, were significantly
upregulated by >2-fold in the chemoresistant compared to the
chemosensitive tumors. The other apoptotic genes, such as
TNFRSF10A, TNFRSF10C and TRAF1, were significantly downregulated by
>2-fold in the chemoresistant compared to the chemosensitive
group. Since FADD, TNFRSF1A and TNFRSF8 mediate apoptosis,
upregulation of these genes in the chemoresistant tumors was an
unexpected finding; however, when taking into consideration that
TNFRSF1A and TFFRSF8 also activate the NF-κB pathway, and an
anti-apoptotic gene, TNFRSF10D, was highly upregulated, the overall
apoptotic balance was likely to favor decreased apoptosis in the
chemoresistant group of tumors.
Emerging evidence suggests that EMT is associated
with chemoresistance (10) and with
the acquisition of the cancer stem cell phenotype. EMT is a
developmental process that plays an important role in tumor
progression and metastasis in many cancers, including ovarian
cancer (17). Our results showed
that typical EMT-inducing genes, including FN1, GSC, NOTCH1, SMAD2,
SNAI1, SOX10 and TMEM132A, were significantly upregulated in the
chemoresistant tumors. However, FN1 and TMEM132A were downregulated
in the cancer tissues compared to normal epithelium, suggesting
that these genes did not play important roles in oncogenesis in
this tumor. The other genes, such as GSC, NOTCH1, SNAI1 and SOX 10,
showed a significant association with poor prognostic factors as
well as with chemoresistance by qRT-PCR in the present study.
When assessing the correlation between these genes
and clinicopathological variables, low expression of TRAF1 and
CDKN1A, and high expression of FOS, TERT and GSC were significantly
associated with advanced clinical stage. Lymph node metastasis was
significantly associated with high expression of GSC, and distant
metastasis was significantly associated with low expression of
TNFRSF10A and high expression of SNAI1, implying that these genes
are implicated in tumor progression.
Among the genes with significantly altered mRNA
expression in the chemoresistant tumors, those which showed a
significant association with more than 2 clinicopathological
parameters and survival, including TRAF1, TERT and GSC, were
selected for verification at the protein level. The differences in
protein levels reached statistical significance only for GSC
protein, whereas the expression of TRAF1 or TERT did not show a
significant difference between the benign and malignant serous
tumors. When we further analyzed the impact of these proteins on
prognostic factors and survival, high expression of GSC protein was
associated with poor overall survival upon immunohistochemical
analysis, suggesting that GSC is the most predictive and prognostic
biomarker for the chemoresistance and patient overall survival in
ovarian serous carcinoma.
GSC is a homeobox-containing protein first reported
as a transcriptional repressor regulating formation and patterning
in vertebrate embryos (18–20). Notably, elements of the TGF-β
superfamily and Wnt/β-catenin signaling pathways, which are
involved in tumor invasion and metastasis through EMT (21,22),
can induce GSC expression in embryonic cells (23,24).
Therefore, GSC is anticipated to play a role in neoplastic disease.
A recent study found that GSC is overexpressed in human breast
carcinomas and plays an important role in activating cell
properties associated with tumor progression to malignancy and
metastasis in breast cancer cells (25). In accordance with their study, we
demonstrated that GSC is significantly correlated with poor
prognostic factors, such as advanced clinical stage and lymph node
metastasis, and poor overall survival in high-grade ovarian serous
carcinomas. This is the first report that GSC is implicated in
chemoresistance and poor survival in human cancer, suggesting that
GSC is a potential biomarker of drug response or novel therapeutic
strategies for overcoming drug resistance in ovarian serous
carcinomas. Further study with a large scale of clinical samples
and functional study on chemoresistant ovarian cancer cells may
support our suggestion.
Acknowledgements
This research was supported by the Basic Science
Research Program of the National Research Foundation of Korea (NRF)
funded by the Ministry of Education, Science and Technology
(NRF-2012-R1A1B3004095).
References
|
1
|
Jemal A, Thomas A, Murray T and Thun M:
Cancer statistics, 2002. CA Cancer J Clin. 52:23–47. 2002.
View Article : Google Scholar
|
|
2
|
McGuire WP, Hoskins WJ, Brady MF, et al:
Cyclophosphamide and cisplatin compared with paclitaxel and
cisplatin in patients with stage III and stage IV ovarian cancer.
New Engl J Med. 334:1–6. 1996. View Article : Google Scholar : PubMed/NCBI
|
|
3
|
Chan WY, Cheung KK, Schorge JO, et al:
Bcl-2 and p53 protein expression, apoptosis, and p53 mutation in
human epithelial ovarian cancers. Am J Pathol. 156:409–417. 2000.
View Article : Google Scholar : PubMed/NCBI
|
|
4
|
Shih Ie M and Kurman RJ: Ovarian
tumorigenesis: a proposed model based on morphological and
molecular genetic analysis. Am J Pathol. 164:1511–1518.
2004.PubMed/NCBI
|
|
5
|
Agarwal R and Kaye SB: Ovarian cancer:
strategies for overcoming resistance to chemotherapy. Nat Rev
Cancer. 3:502–516. 2003. View
Article : Google Scholar : PubMed/NCBI
|
|
6
|
Shahzad MM, Lopez-Berestein G and Sood AK:
Novel strategies for reversing platinum resistance. Drug Resist
Updat. 12:148–152. 2009. View Article : Google Scholar : PubMed/NCBI
|
|
7
|
Stordal B, Pavlakis N and Davey R: A
systematic review of platinum and taxane resistance from bench to
clinic: an inverse relationship. Cancer Treat Rev. 33:688–703.
2007. View Article : Google Scholar : PubMed/NCBI
|
|
8
|
Garcia-Echeverria C and Sellers WR: Drug
discovery approaches targeting the PI3K/Akt pathway in cancer.
Oncogene. 27:5511–5526. 2008. View Article : Google Scholar : PubMed/NCBI
|
|
9
|
Fan F, Samuel S, Evans KW, et al:
Overexpression of snail induces epithelial-mesenchymal transition
and a cancer stem cell-like phenotype in human colorectal cancer
cells. Cancer Med. 1:5–16. 2012. View
Article : Google Scholar : PubMed/NCBI
|
|
10
|
Wang Z, Li Y, Kong D, et al: Acquisition
of epithelial-mesenchymal transition phenotype of
gemcitabine-resistant pancreatic cancer cells is linked with
activation of the notch signaling pathway. Cancer Res.
69:2400–2407. 2009. View Article : Google Scholar
|
|
11
|
Haslehurst AM, Koti M, Dharsee M, et al:
EMT transcription factors snail and slug directly contribute to
cisplatin resistance in ovarian cancer. BMC Cancer. 12:912012.
View Article : Google Scholar : PubMed/NCBI
|
|
12
|
Kurrey NK, Amit K and Bapat SA: Snail and
Slug are major determinants of ovarian cancer invasiveness at the
transcription level. Gynecol Oncol. 97:155–165. 2005. View Article : Google Scholar : PubMed/NCBI
|
|
13
|
Cannistra SA: Cancer of the ovary. N Engl
J Med. 351:2519–2529. 2004. View Article : Google Scholar : PubMed/NCBI
|
|
14
|
Wu H, Cao Y, Weng D, et al: Effect of
tumor suppressor gene PTEN on the resistance to cisplatin in human
ovarian cancer cell lines and related mechanisms. Cancer Lett.
271:260–271. 2008. View Article : Google Scholar : PubMed/NCBI
|
|
15
|
Marchini S, Fruscio R, Clivio L, et al:
Resistance to platinum-based chemotherapy is associated with
epithelial to mesenchymal transition in epithelial ovarian cancer.
Eur J Cancer. 49:520–530. 2012. View Article : Google Scholar : PubMed/NCBI
|
|
16
|
Chen X, Lingala S, Khoobyari S, Nolta J,
Zern MA and Wu J: Epithelial mesenchymal transition and hedgehog
signaling activation are associated with chemoresistance and
invasion of hepatoma subpopulations. J Hepatol. 55:838–845. 2011.
View Article : Google Scholar : PubMed/NCBI
|
|
17
|
Ahmed N, Thompson EW and Quinn MA:
Epithelial-mesenchymal interconversions in normal ovarian surface
epithelium and ovarian carcinomas: an exception to the norm. J Cell
Physiol. 213:581–588. 2007. View Article : Google Scholar : PubMed/NCBI
|
|
18
|
Niehrs C, Keller R, Cho KW and De Robertis
EM: The homeobox gene goosecoid controls cell migration in
Xenopus embryos. Cell. 72:491–503. 1993.PubMed/NCBI
|
|
19
|
Blumberg B, Wright CV, De Robertis EM and
Cho KW: Organizer-specific homeobox genes in Xenopus laevis
embryos. Science. 253:194–196. 1991. View Article : Google Scholar : PubMed/NCBI
|
|
20
|
Blum M, Gaunt SJ, Cho KW, et al:
Gastrulation in the mouse: the role of the homeobox gene goosecoid.
Cell. 69:1097–1106. 1992. View Article : Google Scholar : PubMed/NCBI
|
|
21
|
Thiery JP: Epithelial-mesenchymal
transitions in tumour progression. Nat Rev Cancer. 2:442–454. 2002.
View Article : Google Scholar : PubMed/NCBI
|
|
22
|
Grunert S, Jechlinger M and Beug H:
Diverse cellular and molecular mechanisms contribute to epithelial
plasticity and metastasis. Nat Rev Mol Cell Biol. 4:657–665. 2003.
View Article : Google Scholar : PubMed/NCBI
|
|
23
|
Moon RT and Kimelman D: From cortical
rotation to organizer gene expression: toward a molecular
explanation of axis specification in Xenopus. BioEssays.
20:536–545. 1998. View Article : Google Scholar : PubMed/NCBI
|
|
24
|
Watabe T, Kim S, Candia A, et al:
Molecular mechanisms of Spemann’s organizer formation: conserved
growth factor synergy between Xenopus and mouse. Genes Dev.
9:3038–3050. 1995.
|
|
25
|
Hartwell KA, Muir B, Reinhardt F,
Carpenter AE, Sgroi DC and Weinberg RA: The Spemann organizer gene,
Goosecoid, promotes tumor metastasis. Proc Natl Acad Sci USA.
103:18969–18974. 2006. View Article : Google Scholar : PubMed/NCBI
|