Introduction
Colon cancer is a common gastrointestinal cancer and
is the second leading cause of cancer-related death in Western
countries (1). The morbidity of
colon cancer has been increasing in China during the past 20 years.
Colon cancer and lung cancer as well as breast cancer are three
types of cancers with the most rapidly increasing rate. The
morbidity of colon cancer is ~60/100,000 individuals and its
mortality is ~8/100,000 individuals (2). According to these statistics, there
are almost 800,000 new patients diagnosed with colon cancer every
year in China. Moreover, almost 100,000 colon cancer patients die
from colon cancer every year. Therefore, colon cancer has become a
serious social health issue. Most patients with colon cancer are in
its advanced stages at the time of diagnosis (3), thus surgical operation is not always a
curative solution. Consequently, chemotherapy is extremely
important for the treatment of colon cancer. However, the response
to most forms of chemotherapy achieved to date is generally
limited. Less than 50% of patients with colon cancer respond to the
best regimen of combined chemotherapy. Moreover, among these
patients, most of them suffer from recurrence after stopping
chemotherapy for some time when relief is obtained (4). This is because colon cancer cells
acquire the features of multiple drug resistance (MDR) (5).
The traditional classical mechanism of MDR in cancer
cells is that cancer cells express ATP-binding cassette
transporters including P-glycoprotein (P-gp), multidrug
resistance-associated protein (MRP), lung cancer resistance protein
(LRP) and others (6). These
transmembrane proteins pump chemotherapeutic drugs out of cancer
cells to decrease concentrations of these drugs in cancer cells.
Therefore, cancer cells are resistant to these chemotherapeutic
drugs. Although MDR reversal agents targeting these ATP-binding
cassette transporters including calcium antagonist such as
verapamil (7), antisense RNA
(8) and siRNA (9) can reverse the MDR of cancer cells
in vitro, they do not improve the prognosis of patients when
combined with antitumor drugs in vivo particularly in the
human body.
The conception of cancer stem cells has provided a
new hypothesis for the MDR of cancer in recent years. It is now
currently accepted that cancer stem cells play an important role in
MDR of cancer cells. Researchers are currently attempting to
identify specific markers of cancer stem cells in order to
exclusively kill this cell population. Various markers including
CD133 (10,11) and CD44 (12) have been regarded as specific markers
of cancer stem cells in cancer including colon cancer. However,
CD133-negative cancer cells were found to have features of cancer
stem cells in some types of cancer (13,14).
Therefore, the opinion that CD133 could be regarded as a specific
marker of cancer stem cells and a target of MDR of cancer cells is
still controversial (15).
The side population of cancer cells is believed to
have features of cancer stem cells including self-renewal and
differentiation ability and multidrug resistance to antitumor drugs
(16,17). Side population (SP) cells usually
express transmembrane protein such as MDR1, BCRP1 and ABCG2.
However, non-side population (non-SP) cells in many types of cancer
were also reported to express BCRP1, which suggests that although
these transmembrane proteins play a role in the phenotype of SP
cells, they are not specific markers of SP cells (18). Behbod et al investigated gene
markers of SP cells in breast cancer (19). However, no report exists concerning
the microRNA profile comparison between SP and non-SP cells in
colon cancer. The present study compared the microRNA profile of SP
and non-SP cells in several colon cancer cell lines in order to
explore the potential microRNA biomarkers of side population in
colon cancer, which may provide new specific targets of the side
population for the reversal of MDR of colon cancer.
Materials and methods
Materials
RPMI-1640 medium, Hoechst 33342, methylthiazol
tetrazolium (MTT) and dimethyl sulfoxide (DMSO) were all purchased
from Sigma-Aldrich. Fetal bovine serum (FBS) and TRIzol were
purchased from Invitrogen. 5-Fluorouracil was purchased from Xudong
Haipu Pharmaceutical Co., Ltd. (Shanghai, China). Oxaliplatin was
purchased from Sanofi-Synthelabo Co. Adriamycin was purchased from
Pharmacia & Upjohn Co.. miRNeasy Mini kit was purchased from
Qiagen Co.. MicroRNA array analysis was performed using miRCURY™
LNA array (v.18.0) from Exiqon Co. (Vedbaek, Denmark). A reverse
transcriptase kit was provided by Kangchen Bio-tech Inc. (Shanghai,
China). PCR amplification was performed using Gene Amp PCR System
9700 from Applied Biosystems. Flow cytometry was performed using BD
FACSAria II fluorescence-activated cell sorting system from BD
Biosciences.
Cell culture
The human colon cancer cell lines, HCT-15, HT-29 and
LoVo, were obtained from the Shanghai Cell Bank, Chinese Academy of
Sciences. The three colon cancer cell lines were cultured in
RPMI-1640 medium supplemented with 10% FBS at 37°C in a humidified
incubator containing 5% CO2.
Side population analysis
Side population analysis was performed as described
previously, with some modifications (20). Trypsinized cultured cells were
washed with PBS and were resuspended at 37°C in RPMI-1640 medium
supplemented with 5% FBS. After a 10-min preincubation, the cells
were labeled with Hoechst 33342 dye for 90 min at a concentration
of 5 μg/ml. Cells were counterstained with 1 μg/ml propidium iodide
to labeled dead cells. Next, 1×10⁶ viable cells were
analyzed and sorted using a BD FACSAia II fluorescence-activated
cell sorting system. The Hoechst dye was excited at 355 nm and its
fluorescence was measured at two wavelengths using optical filters
450 DF20 [450/20 nm band-pass filter O (Hoechst blue)] and 635LP
[635 nm longpass edge filter (Hoechst red)]. Propidium iodide
labeling was measured through a 630/BP30 filter for discrimination
of dead cells.
MTT assay
Cell proliferation assays were performed by MTT
assay (21). Cells were seeded at
1×10⁴/well in 96-well microtiter plates. After a 24-h
incubation, an antitumor drug was added. Then cells were incubated
at 37°C in 5% CO2 for 72 h. Then 30 μl of 5 mg/ml MTT
solution was added and incubated for 4 h at 37°C. Medium and MTT
solution were discarded after a 4-h incubation. DMSO (150 μl) was
added into each well to stop the reaction and shaken for 5 min. The
optical density (OD) value was read on a Synergy HT multi-detection
microplate reader (Bio-Tek Instruments, Inc., Winooski, VT, USA) at
λ=570 nm.
MicroRNA array analysis
MicroRNA array analysis was performed by Kangchen
Bio-tech, Inc. (Shanghai, China). The protocol was as follows.
RNA extraction
Total RNA was isolated using TRIzol and the miRNeasy
Mini kit according to the manufacturer’s instructions, which
efficiently recovered all RNA species, including miRNAs. RNA
quality and quantity were measured using a Nanodrop
spectrophotometer (ND-1000, Nanodrop Technologies) and RNA
integrity was determined by gel electrophoresis.
RNA labeling
After RNA isolation from the samples, the miRCURY™
Hy3™/Hy5™ Power labeling kit (Exiqon) was used according to the
manufacturer’s guideline for miRNA labeling. One microgram of each
sample was 3′-end-labeled with the Hy3™ fluorescent label, using T4
RNA ligase by the following procedure: RNA in 2.0 μl of water was
combined with 1.0 μl of CIP buffer and CIP (Exiqon). The mixture
was incubated for 30 min at 37°C and was terminated by incubation
for 5 min at 95°C. Then 3.0 μl of labeling buffer, 1.5 μl of
fluorescent label (Hy3™), 2.0 μl of DMSO, 2.0 μl of labeling enzyme
were added into the mixture. The labeling reaction was incubated
for 1 h at 16°C and terminated by incubation for 15 min at
65°C.
Array hybridization
After terminating the labeling procedure, the
Hy3™-labeled samples were hybridized on the miRCURY LNA array
(v.18.0) according to the array manual. The total 25 μl mixture
from Hy3™-labeled samples with 25 μl hybridization buffer were
first denatured for 2 min at 95°C, incubated on ice for 2 min and
then hybridized to the microarray for 16–20 h at 56°C in a 12-Bay
hybridization system (Hybridization System; Nimblegen Systems,
Inc., Madison, WI, USA), which provides an active mixing action and
constant incubation temperature to improve hybridization uniformity
and enhance signals. Following hybridization, the slides were
achieved, washed several times using wash buffer kit (Exiqon) and
finally dried by centrifugation for 5 min at 400 rpm. Then the
slides were scanned using the Axon GenePix 4000B microarray scanner
(Axon Instruments, Foster City, CA, USA).
Data analysis
Scanned images were then imported into GenePix Pro
6.0 software (Axon) for grid alignment and data extraction.
Replicated miRNAs were averaged and miRNAs with intensities ≥30 in
all samples were chosen for calculating the normalization factor.
Expression data were normalized using the median normalization.
After normalization, differentially expressed miRNAs were
identified through fold change filtering. To identify
differentially expressed miRNAs, we performed a fold change
filtering between the two samples from the experiment. The
threshold we used to screen upregulated or downregulated miRNAs
with a fold change ≥2.0. Hierarchical clustering was performed
using MEV software (v4.6, TIGR).
Verification of microRNA expression using
RT-PCR
This part of the experiment was completed by
Kangchen Bio-tech, Inc. The protocol in detail was as follows.
Total RNAs were isolated from both SP and non-SP cells using TRIzol
and the miRNeasy Mini kit according to the manufacturer’s
instructions. Complementary DNA (cDNA) was synthesized from 0.8 μg
of total RNA by reverse transcription using MMLV reverse
transcriptase (Epicentre). The primers were: RT primer
5′-GTCGTATCCAGTGCGTGTCGTGGAGTCGGCAATTGCACTGGATACGACTCCAAG-3′ for
miR-5000-3p;
5′-GTCGTATCCAGTGCGTGTCGTGGAGTCGGCAATTGCACTGGATACGACTTTTGG-3′ for
miR-5009-3p;
5′-GTCGTATCCAGTGCGTGTCGTGGAGTCGGCAATTGCACTGGATACGACTTGTCTA-3′ for
miR-552; 5′-CGCTTCACGAATTTGCGTGTCAT-3′ for U6 as an internal
control. The PCR amplification was performed in 10 μl of PCR
mixture containing 2 μl of cDNA mixture, 0.5 μl of Taq DNA
polymerase (Qiagen) and 1 μl 10 μM of the primers. The PCR mixture
was initially incubated at 95°C for 10 min, followed by 40 cycles
of denaturation at 95°C for 10 sec, annealing at 60°C for 60 sec.
The following primer pairs were used for RT-PCR analysis (forward
and reverse, respectively): 5′-GGGTCAGGACACTTCTGAA-3′ and
5′-CAGTGCGTGTCGTGGAG-3′ for miR-5000-3p, with an expected product
size of 65 bp; 5′-GGGGGTCCTAAATCTGAAAGT-3′ and
5′-GTGCGTGTCGTGGAGTCG-3′ for miR-5009-3p, with an expected product
size of 65 bp; 5′-GGGGGAACAGGTGACTGGT-3′ and
5′-GTGCGTGTCGTGGAGTCG-3′ for miR-552, with an expected product size
of 64 bp; 5′-GCTTCGGCAGCACATATACTAAAAT-3′ and
5′-CGCTTCACGAATTTGCGTGTCAT-3 for U6, with an expected product size
of 89 bp. U6 was used as an internal control. The relative
abundance of each microRNA was normalized by the expression level
of U6 RNA, according to the formula: ΔΔCt = (Ctsample −
CtU6sample) − (Ctcontrol −
CtU6control) and the estimated expression ratio was
equal to 2ΔΔCt.
Results
Side population analysis
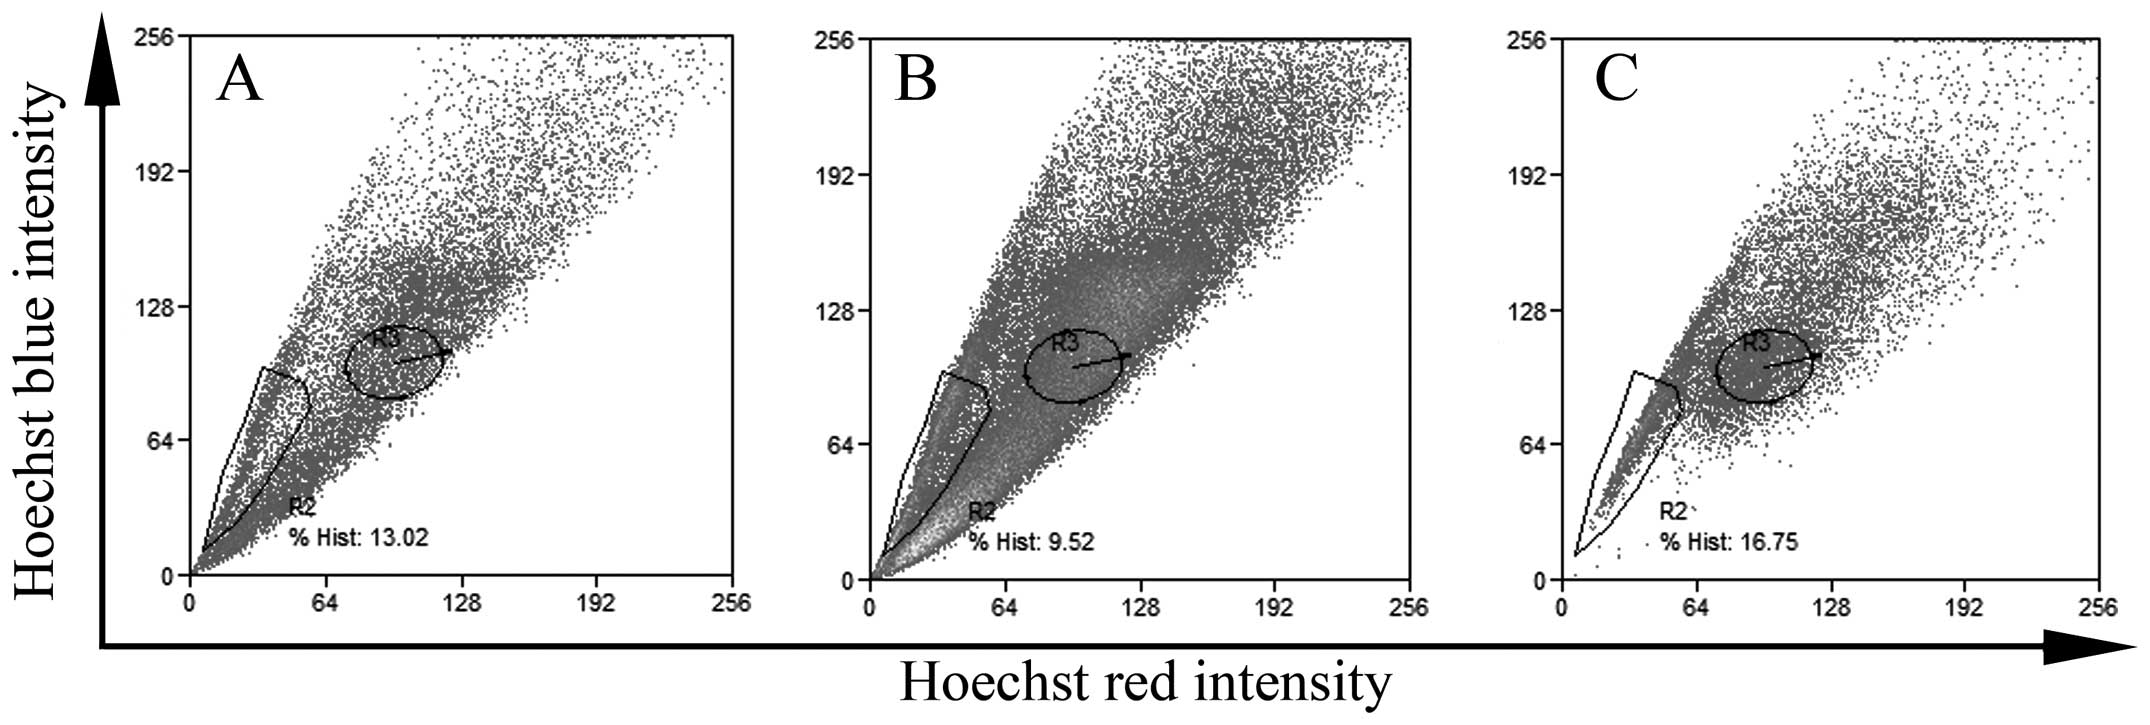
Colon cancer cells were labeled with Hoechst 33342
and then the side population of colon cancer cells were sorted by
flow cytometry. As shown in Fig. 1,
there was a certain ratio of SP cells in the different colon cancer
cell lines in spite of the different ratio of SP cells. The ratio
of SP cells in the HCT-15, HT-29 and Lovo colon cancer cell lines
was 16.75, 13.02 and 9.52%, respectively.
Cell viability of SP and non-SP cells in
colon cancer cell lines treated with antitumor drugs
SP and non-SP cells sorted from the HCT-15, HT-29
and LoVo colon cancer cell lines were treated with different
concentrations of 5-fluorouracil, oxaliplatin and adriamycin,
respectively, for 3 days. Then cell viability was measured. As
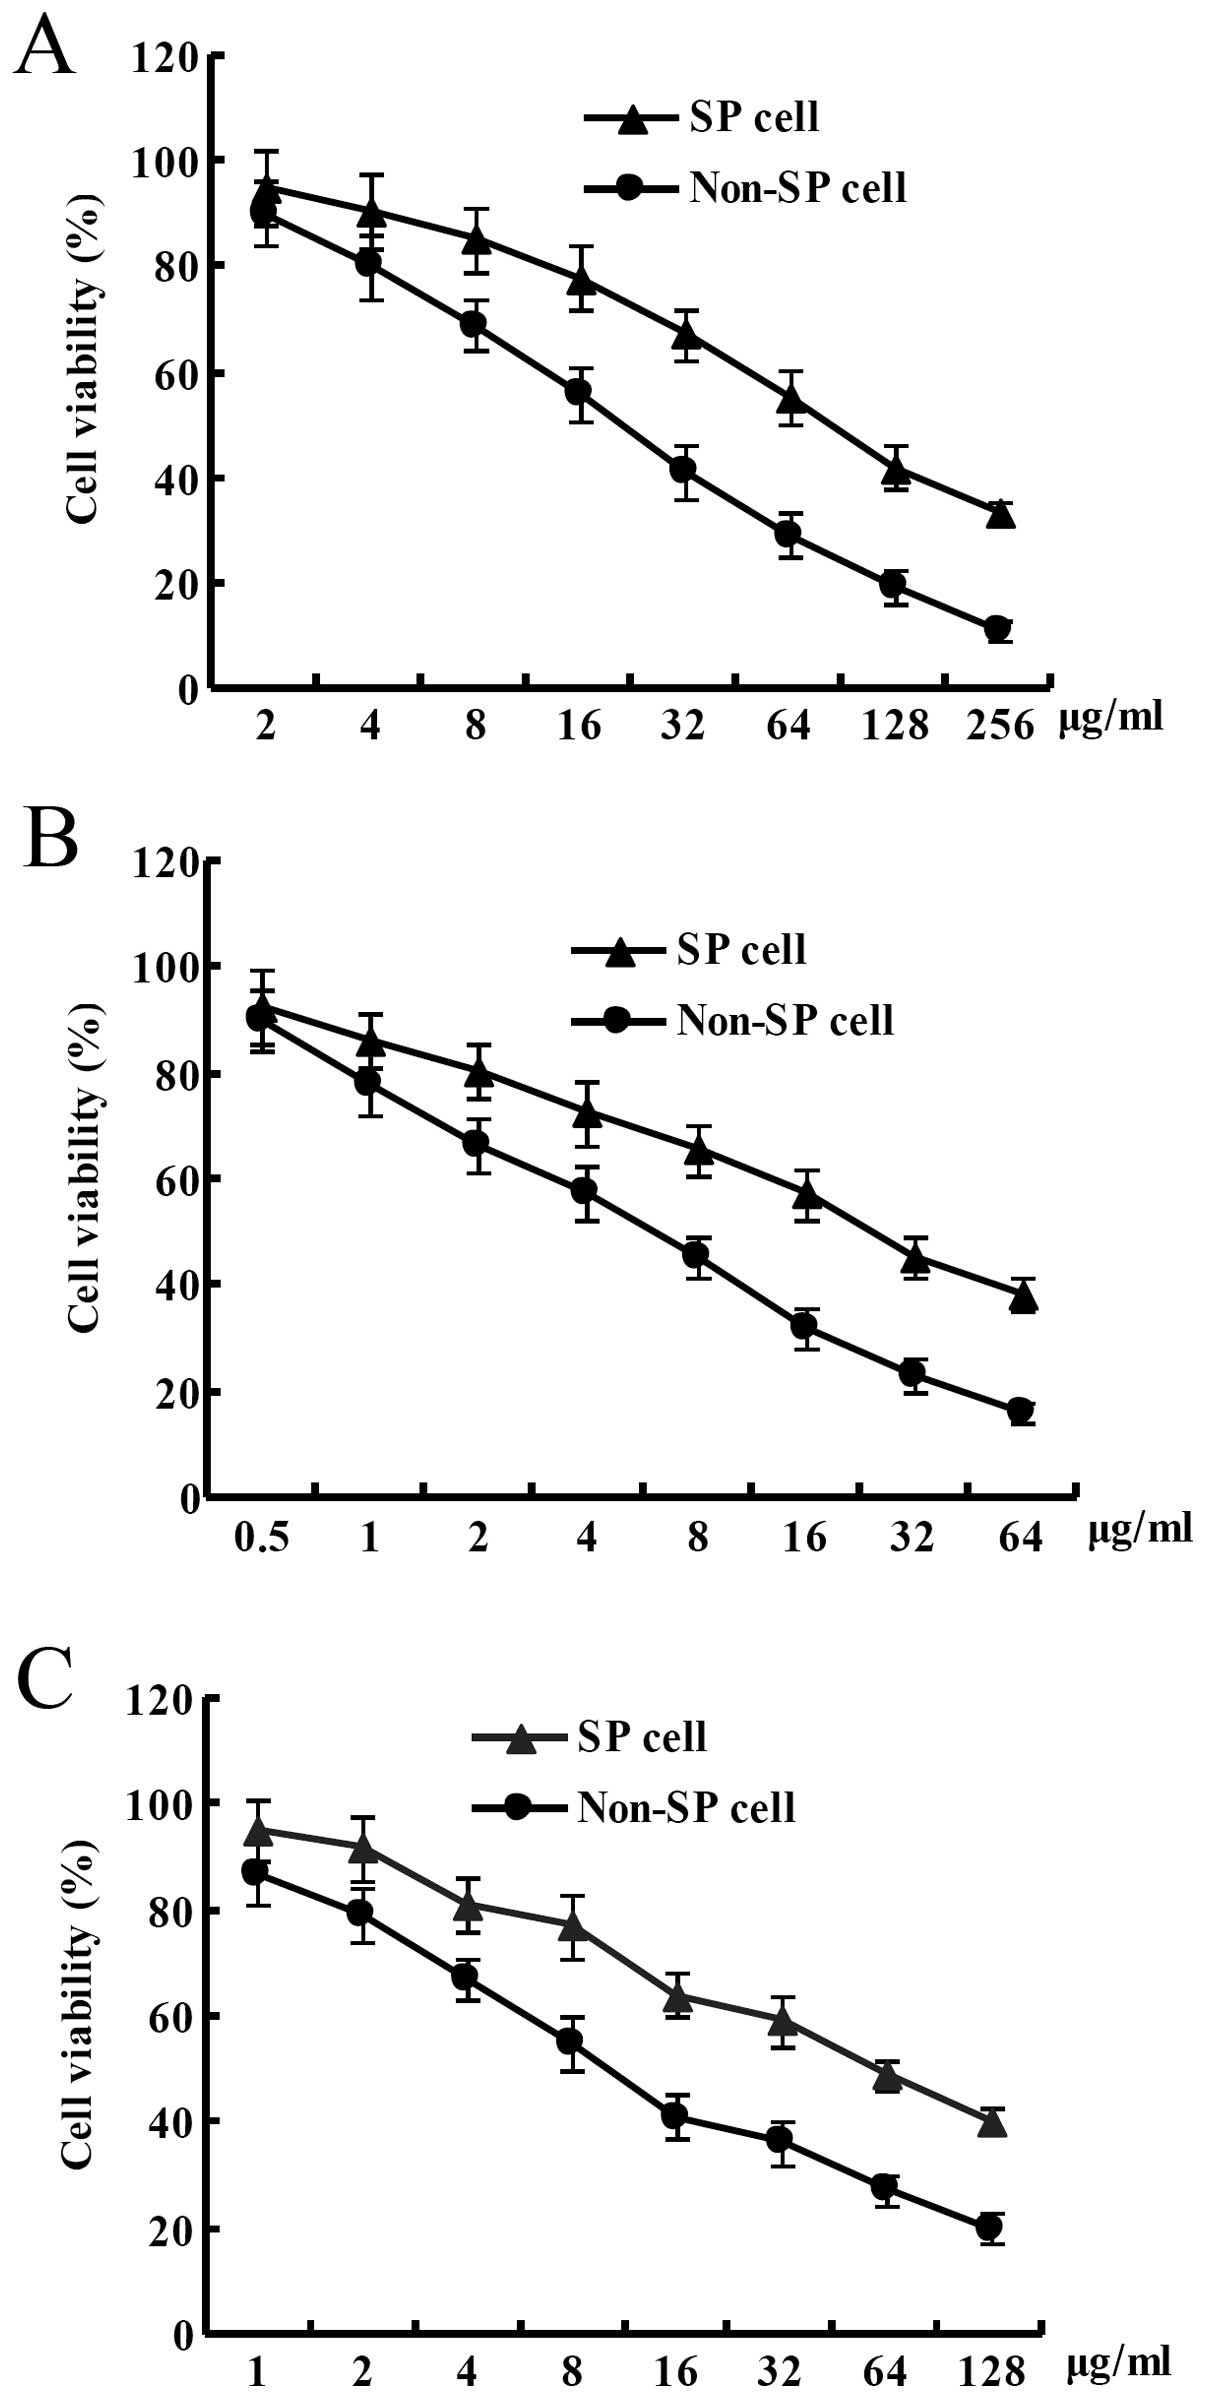
shown in Fig. 2A, the cell
viability of the SP cells derived from the HCT-15 colon cancer cell
line was significantly higher than that of the non-SP cells at the
same concentration of 5-fluorouracil after the HCT-15 colon cancer
cells were treated with different concentrations of 5-fluorouracil
for 3 days. IC50 of 5-fluorouracil for the SP cells from
the HCT-15 colon cancer cell line was ~100 μg/ml. In contrast,
IC50 of 5-fluorouracil for the non-SP cells from the
HCT-15 colon cancer cell line was ~20 μg/ml. In other word, in the
HCT-15 colon cancer cell line, IC50 of 5-fluorouracil
for the SP cells was increased by ~5-fold compared to that for the
non-SP cells. Cell viability of the SP cells derived from the
HCT-15 colon cancer cell line was significantly higher than that of
the non-SP cells at the same concentration of oxaliplatin after the
HCT-15 colon cancer cells were treated with different
concentrations of oxaliplatin for 3 days. IC50 of
oxaliplatin for the SP cells from the HCT-15 colon cancer cell line
was ~24 μg/ml. In contrast, IC50 of oxaliplatin for the
non-SP cells from the HCT-15 colon cancer cell line was ~6 μg/ml.
In other word, in the HCT-15 colon cancer cell line,
IC50 of oxaliplatin for the SP cells was increased by
~4-fold than that for the non-SP cells (Fig. 2B). Cell viability of the SP cells
derived from the HCT-15 colon cancer cell line was significantly
higher than that of the non-SP cells at the same concentration of
adriamycin after the HCT-15 colon cancer cells were treated with
different concentrations of adriamycin for 3 days. IC50
of adriamycin for the SP cells from the HCT-15 colon cancer cell
line was ~60 μg/ml. In conrast, IC50 of adriamycin for
the non-SP cells from the HCT-15 colon cancer cell line was ~10
μg/ml. In other word, in the HCT-15 colon cancer cell line,
IC50 of adriamycin for the SP cells was increased by
~6-fold than that for the non-SP cells (Fig. 2C).
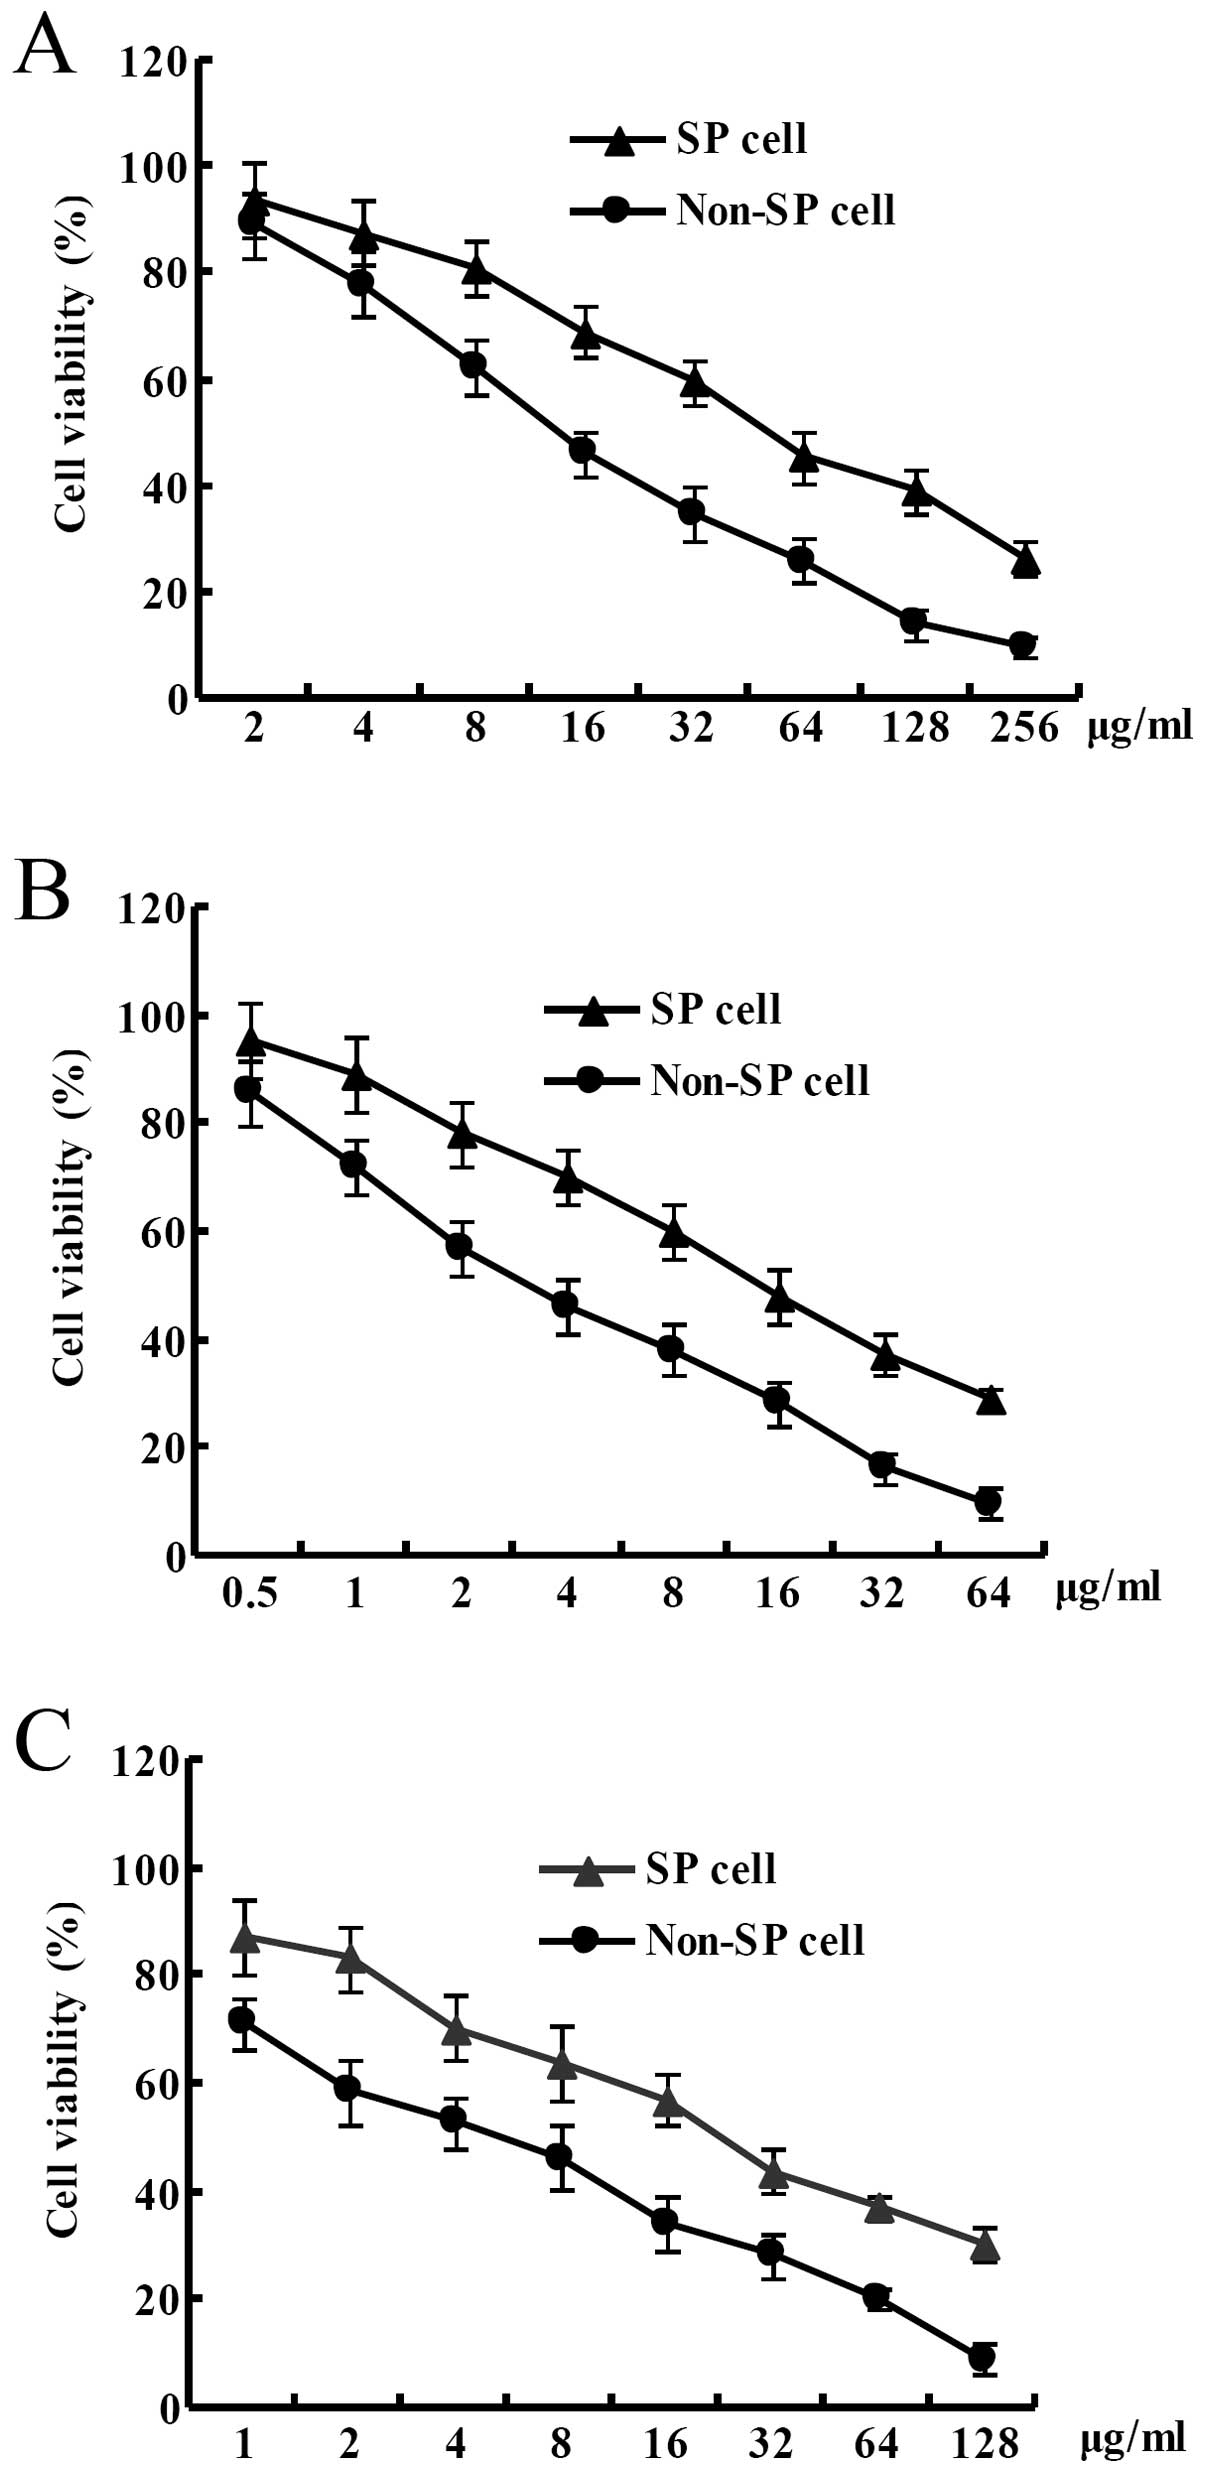
Cell viability of SP cells derived from the HT-29
colon cancer cell line was significantly higher than that of the
non-SP cells at the same concentration of 5-fluorouracil after the
HT-29 colon cancer cells were treated with different concentrations
of 5-fluorouracil for 3 days. IC50 of 5-fluorouracil for
the SP cells from the HT-29 colon cancer cell line was ~50 μg/ml.
In contrast, IC50 of 5-fluorouracil for the non-SP cells
from the HT-29 colon cancer cell line was ~10 μg/ml. In other word,
in the HT-29 colon cancer cell line, IC50 of
5-fluorouracil for the SP cells was increased by ~5-fold than that
for the non-SP cells (Fig. 3A).
Cell viability of SP cells derived from the HT-29 colon cancer cell
line was significantly higher than that of the non-SP cells at the
same concentration of oxaliplatin after the HT-29 colon cancer
cells were treated with different concentrations of oxaliplatin for
3 days. IC50 of oxaliplatin for the SP cells from the
HT-29 colon cancer cell line was ~15 μg/ml. In contrast,
IC50 of oxaliplatin for the non-SP cells from the HT-29
colon cancer cell line was ~3 μg/ml. In other word, in the HT-29
colon cancer cell line, IC50 of oxaliplatin for the SP
cells was increased by ~5-fold than that for the non-SP cells
(Fig. 3B). Cell viability of the SP
cells derived from the HT-29 colon cancer cell line was
significantly higher than that of the non-SP cells at the same
concentration of adriamycin after the HT-29 colon cancer cells were
treated with different concentrations of adriamycin for 3 days.
IC50 of adriamycin for the SP cells from the HT-29 colon
cancer cell line was ~25 μg/ml. In contrast, IC50 of
adriamycin for the non-SP cells from the HT-29 colon cancer cell
line was ~5 μg/ml. In other word, in the HT-29 colon cancer cell
line, IC50 of adriamycin for the SP cells was increased
by ~5-fold than that for the non-SP cells (Fig. 3C).
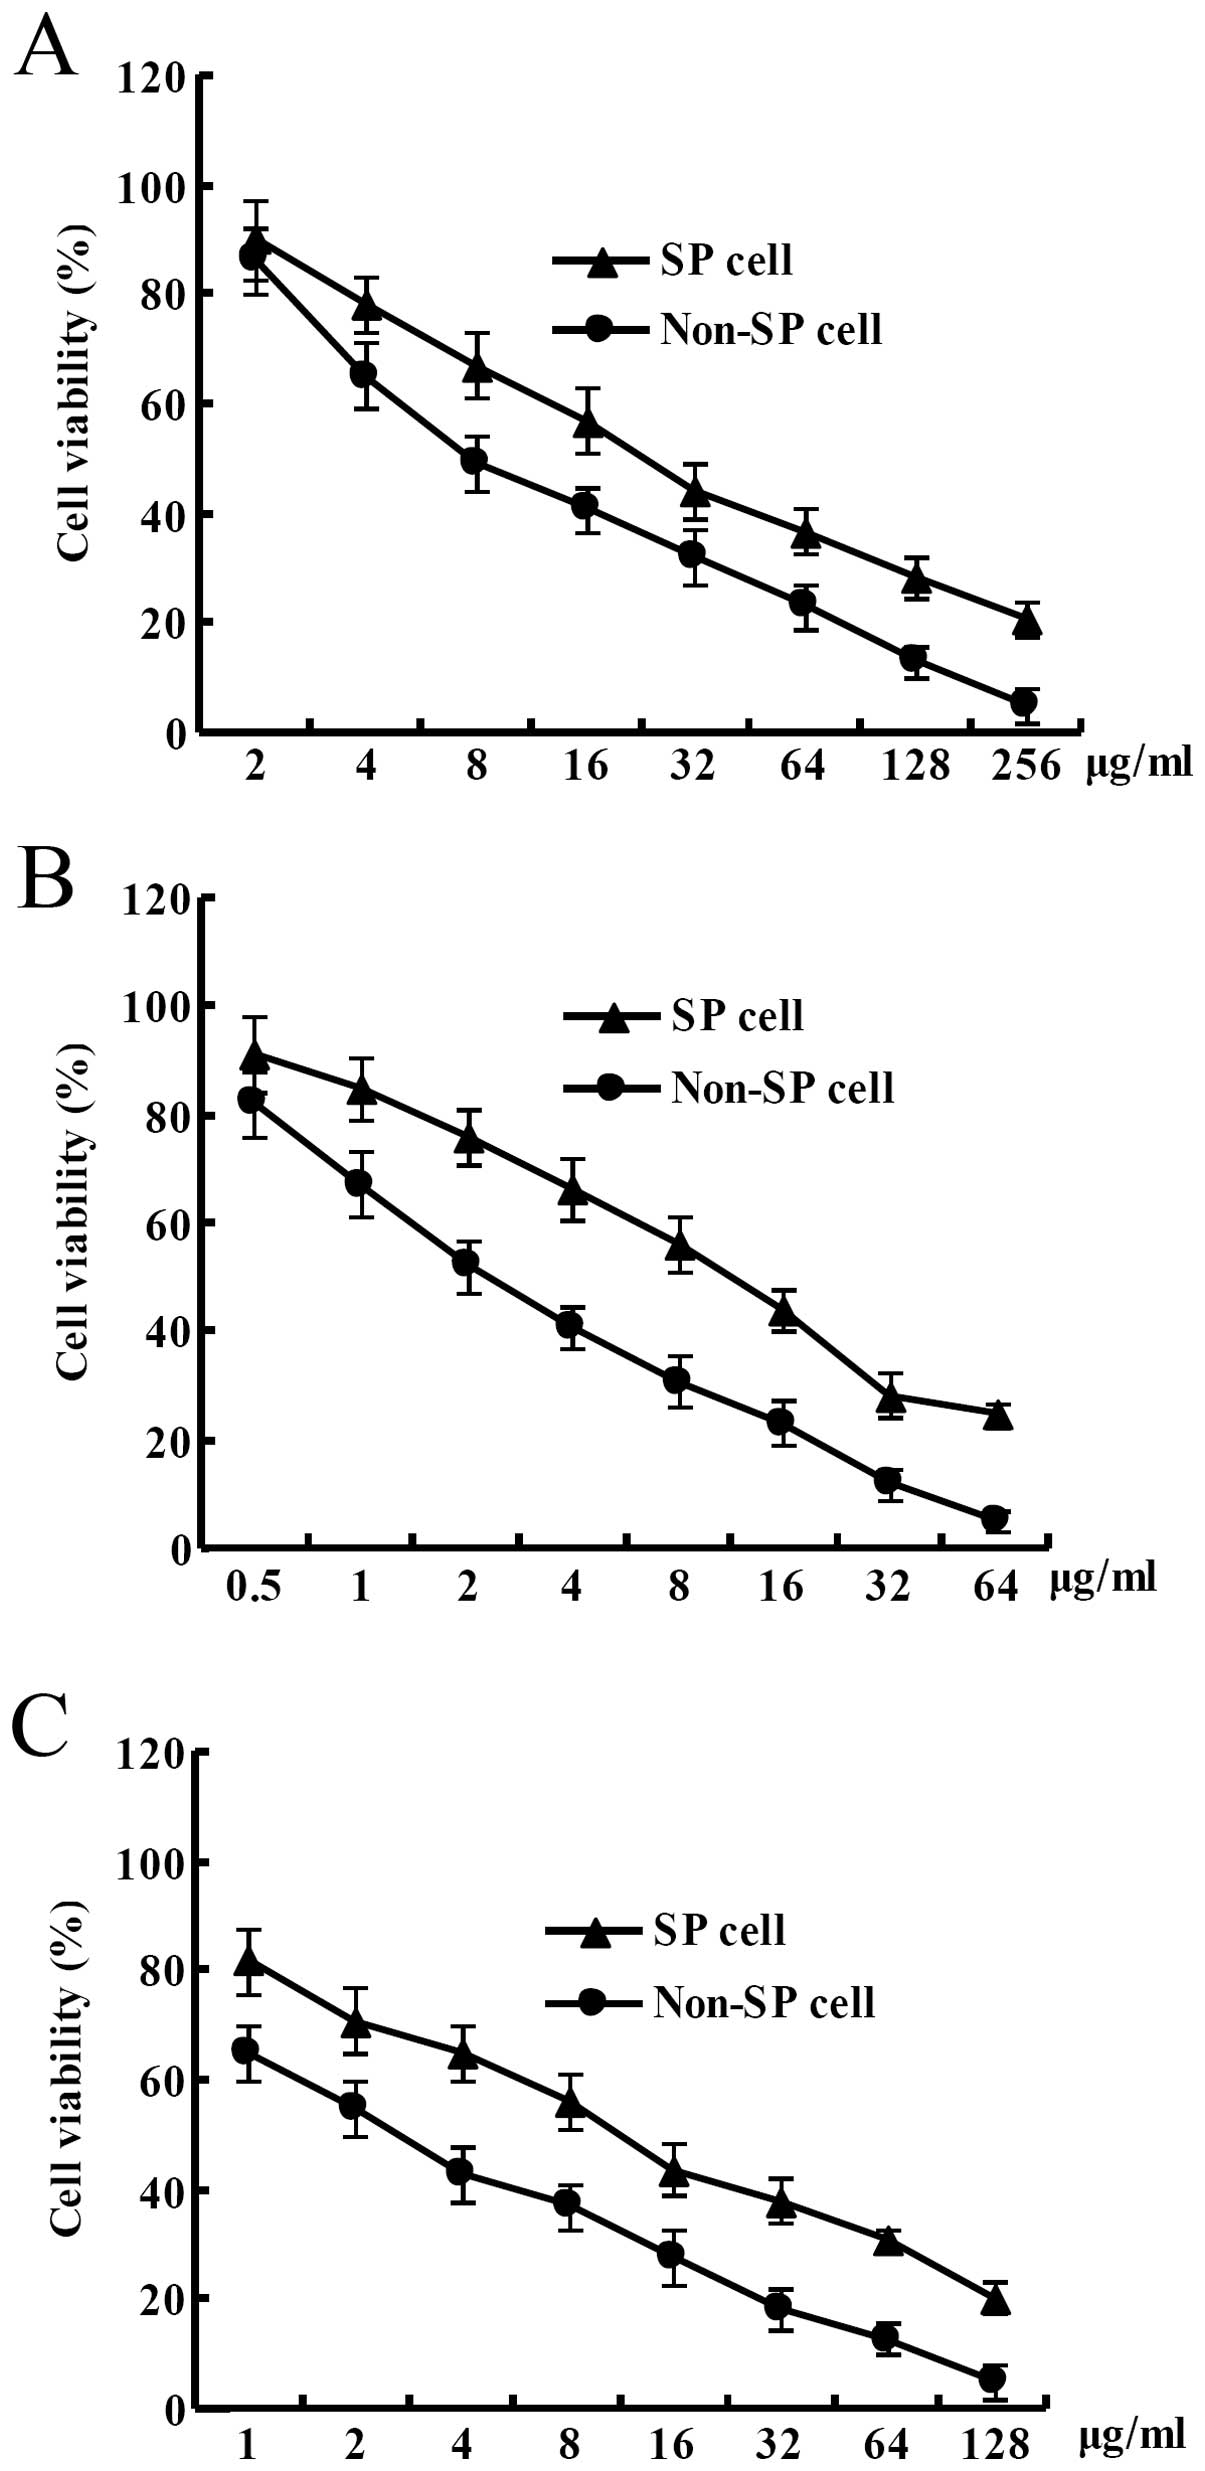
Cell viability of SP cells derived from the LoVo
colon cancer cell line was significantly higher than that of the
non-SP cells at the same concentration of 5-fluorouracil after the
LoVo colon cancer cells were treated with different concentrations
of 5-fluorouracil for 3 days. IC50 of 5-fluorouracil for
the SP cells from the LoVo colon cancer cell line was ~25 μg/ml. In
contrast, IC50 of 5-fluorouracil for the non-SP cells
from the LoVo colon cancer cell line was ~5 μg/ml. In other word,
in the LoVo colon cancer cell line, IC50 of
5-fluorouracil for the SP cells was increased by ~5-fold than that
for the non-SP cells (Fig. 4A).
Cell viability of the SP cells derived from the LoVo colon cancer
cell line was significantly higher than that of the non-SP cells at
the same concentration of oxaliplatin after the LoVo colon cancer
cells were treated with different concentrations of oxaliplatin for
3 days. IC50 of oxaliplatin for the SP cells from the
LoVo colon cancer cell line was ~12 μg/ml. In contrast,
IC50 of oxaliplatin for the non-SP cells from the LoVo
colon cancer cell line was ~2 μg/ml. In other word, in the LoVo
colon cancer cell line, IC50 of oxaliplatin for the SP
cells was increased by ~6-fold than that for the non-SP cells
(Fig. 4B). Cell viability of the SP
cells derived from the LoVo colon cancer cell line was
significantly higher than that of the non-SP cells at the same
concentration of adriamycin after the LoVo colon cancer cells were
treated with different concentrations of adriamycin for 3 days.
IC50 of adriamycin for the SP cells from the LoVo colon
cancer cell line was ~12 μg/ml. In contrast, IC50 of
adriamycin for the non-SP cells from the LoVo colon cancer cell
line was ~3 μg/ml. In other word, in the LoVo colon cancer cell
line, IC50 of adriamycin for the SP cells was increased
by ~4-fold than that for non-SP cells (Fig. 4C).
MicroRNA profiling of the side population
in colon cancer cell lines
MicroRNA profiling of the SP and non-SP cells sorted
from the HCT-15, HT-29 and LoVo colon cancer cell lines was carried
out using miRCURY LNA array (v.18.0) microRNA chip. The differences
in the microRNA profile between the SP and non-SP cells were
compared in each colon cancer cell line. microRNAs with fold change
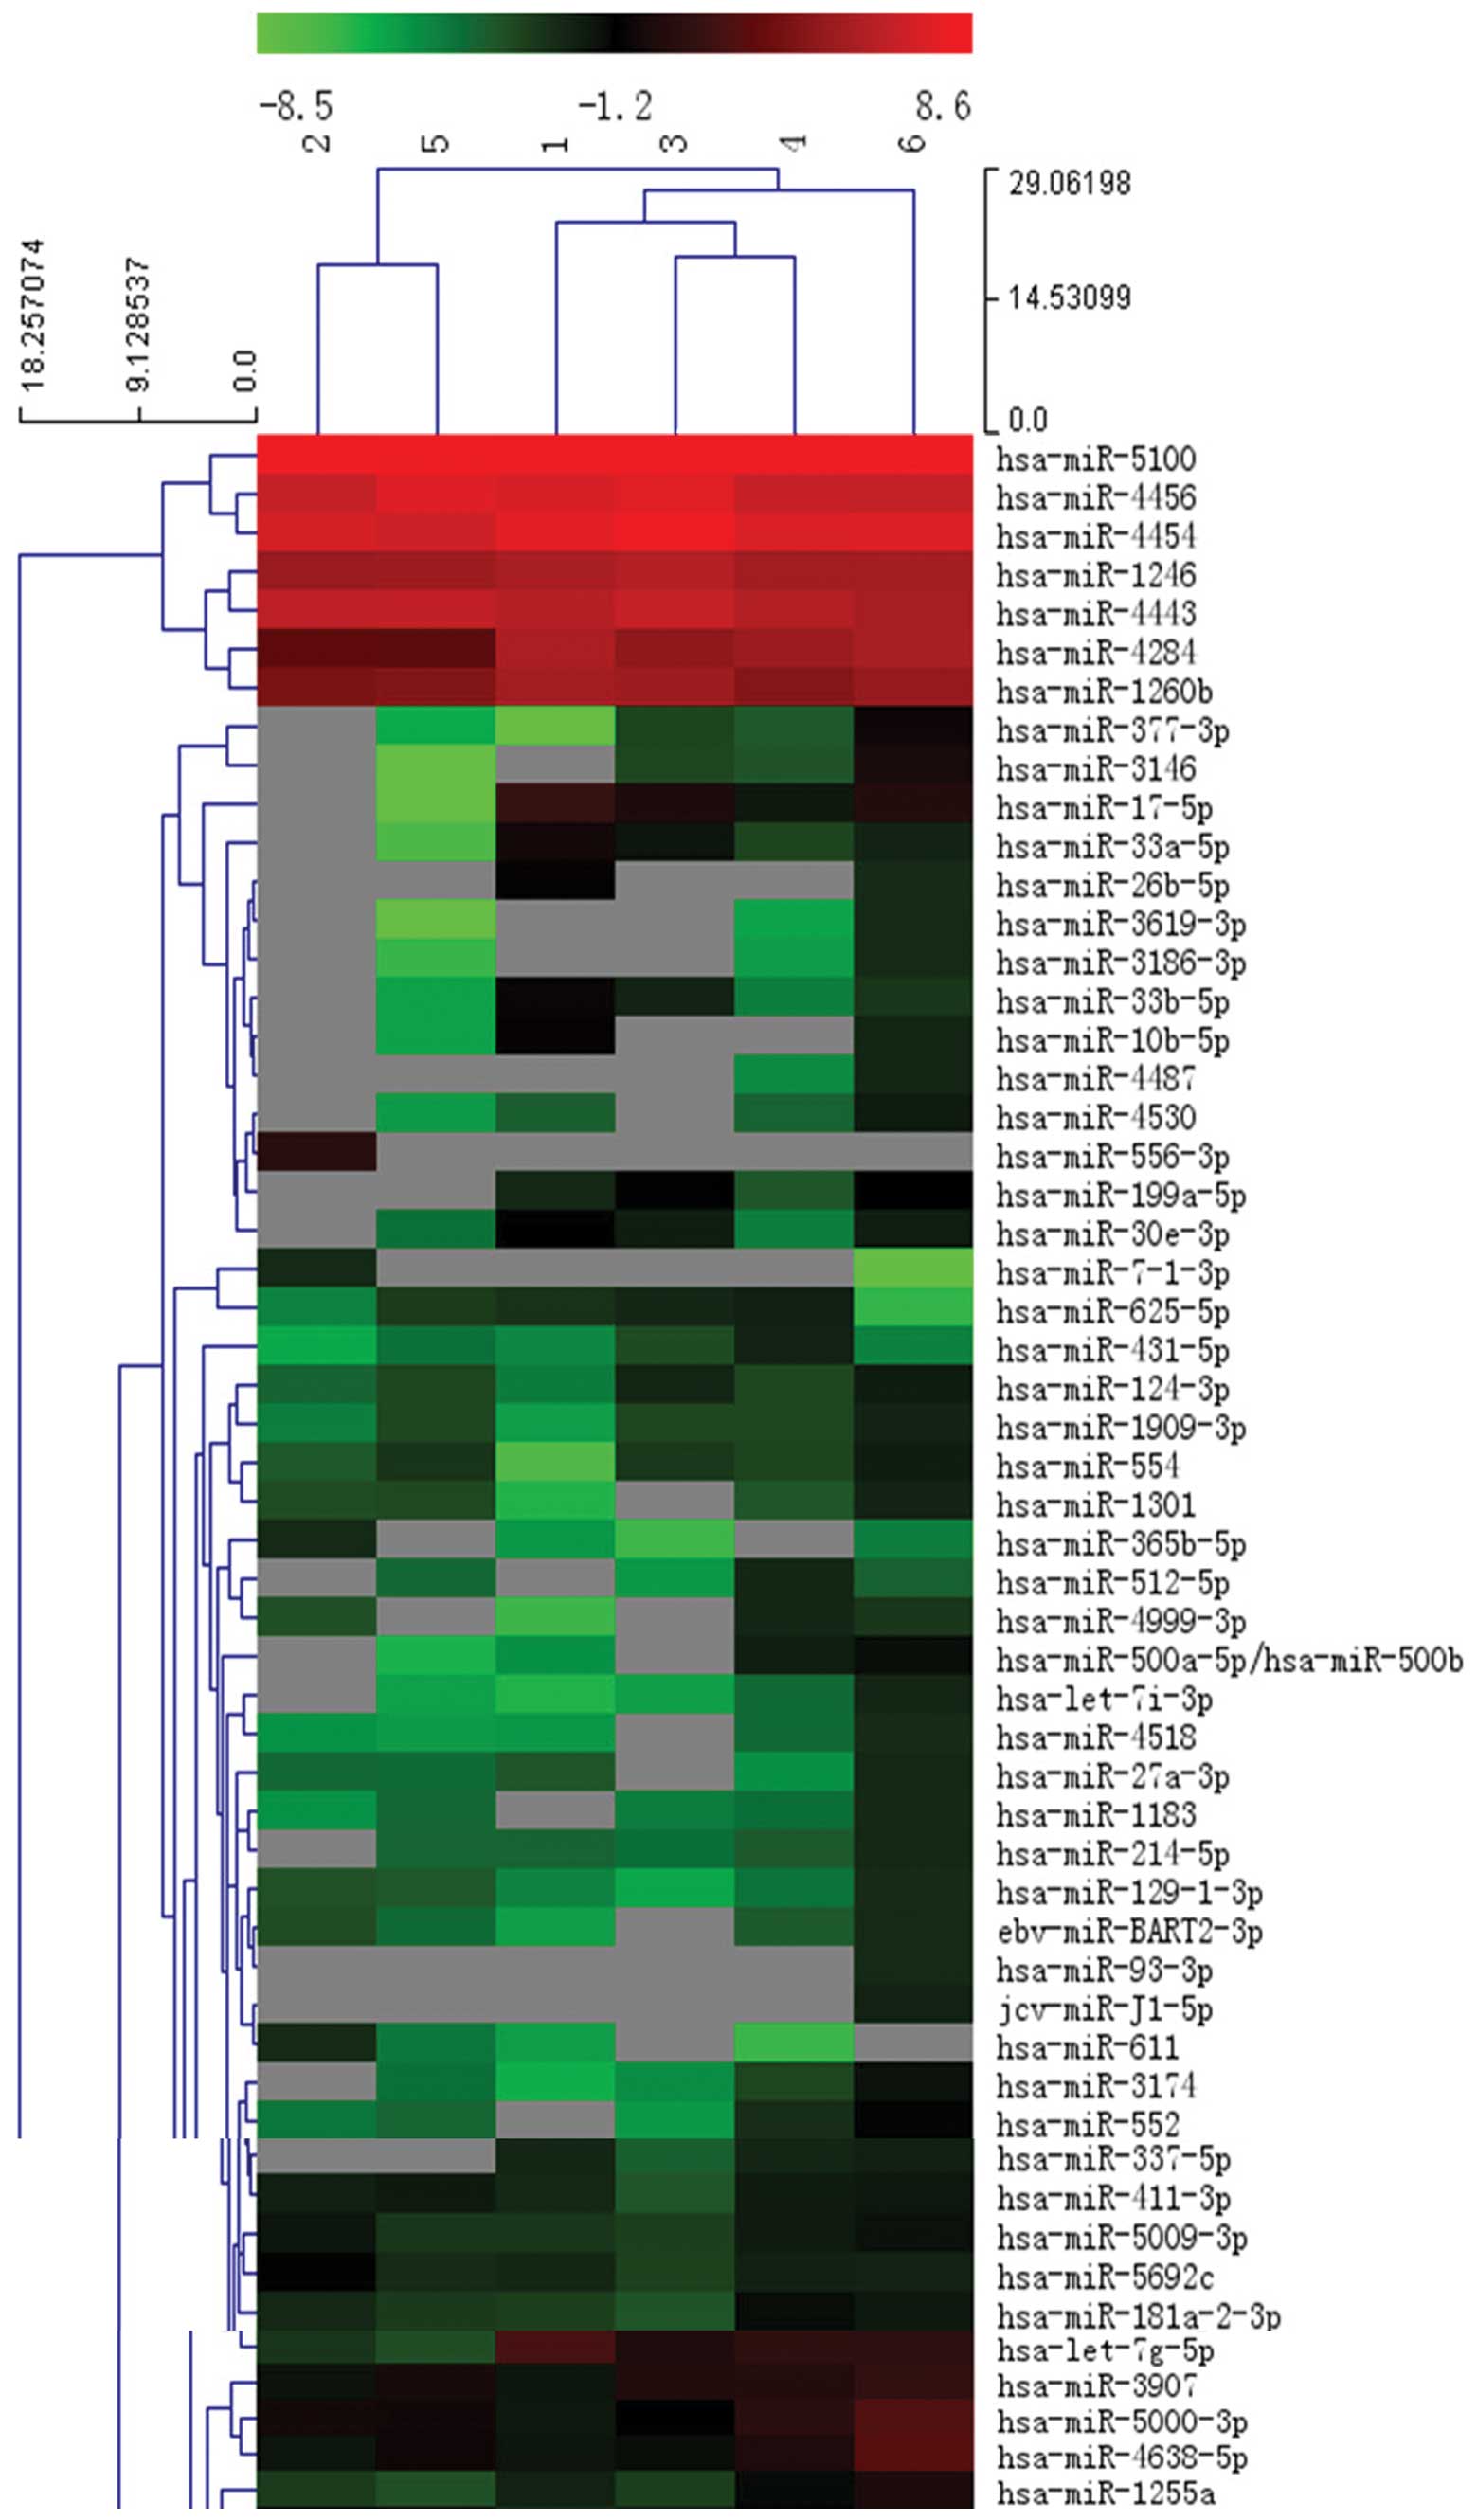
>2-fold were screened. MicroRNA array analysis indicated that,
in the HCT-15 colon cancer cell line, there were 106 upregulated
microRNAs in the SP cells including miR-5000-3p, miR-5009-3P,
miR-552, miR-17-5p, miR-3146, miR3619-3P and others (Fig. 5); On the other hand, 52 microRNAs
were downregulated including miR-133b, miR-4312, miR-4664-3p,
miR-4667-3p, miR-4087-5p, miR-940 and others (data not shown). In
the HT-29 colon cancer cell line, 58 microRNAs in the SP cells were
upregulated including miR-5000-3p, miR-5009-3P, miR-552, miR-611,
miR-365b-5p, and others (Fig. 5);
However, 63 microRNAs were downregulated including miR-125b-5p,
miR-30b-5p, miR-101-3p, miR-7g-5p, miR-125a-5p, miR-130b-3p, and
others. (data not shown). In the LoVo colon cancer cell line, 47
microRNAs in the SP cells were upregulated including miR-5000-3p,
miR-5009-3P, miR-552, miR-3915, miR-4777-5p, miR-301a-3p and others
(some part of the data not shown). However, 22 microRNAs were
downregulated including miR-34a-5p, miR-33b-5p, miR-30e-3p,
miR-199a-5p, miR-125b-3p, miR-1275 and others (data not shown).
From the above mentioned results, we found that miR-5000-3p,
miR-5009-3P and miR-552 were upregulated in the SP cells of all
three colon cancer cell lines (Fig.
5). However, no microRNA was found to be downregulated in SP
cells of all of the three colon cancer cell lines.
Verification of three upregulated
microRNAs using RT-PCR
MicroRNA profiling revealed that miR-5000-3p,
miR-2009-3P and miR-552 were upregulated in SP cells of all of the
three colon cancer cell lines including HCT-15, HT-29 and LoVo. To
confirm and validate the results obtained from the microarray, we
analyzed the expression of these three microRNAs by RT-PCR. Using
U6 as an internal control, relative expression of microRNAs from
the SP and non-SP cells was calculated. Then, microRNA expression
detected by RT-PCR was compared with the microRNA expression
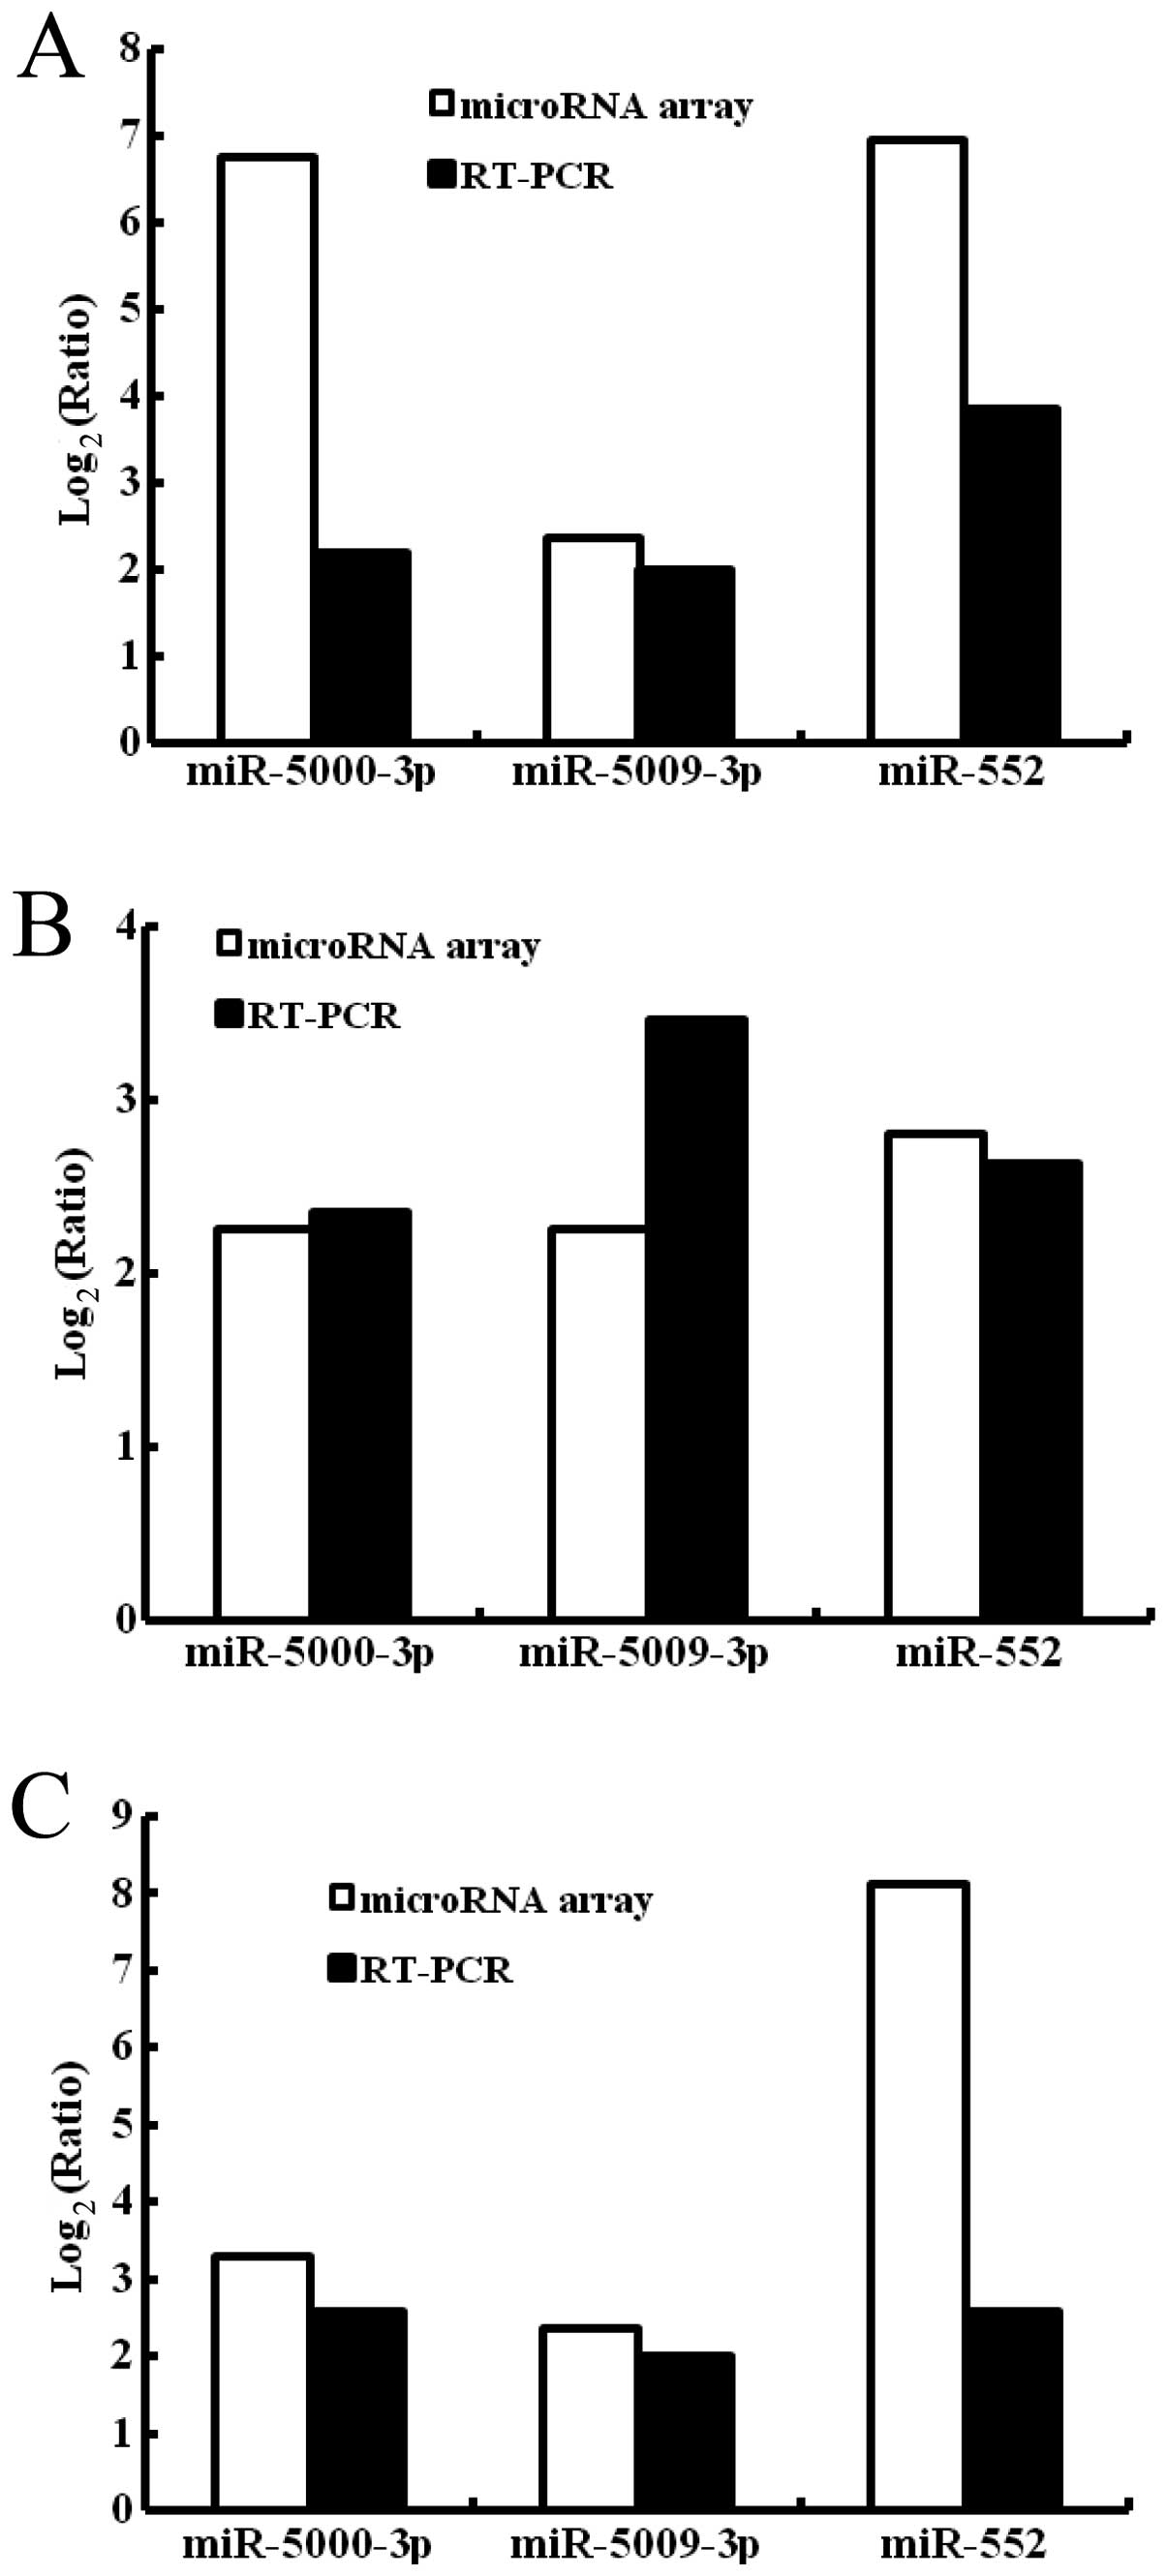
obtained by the microRNA array. The ratios representing microRNA
expression changes were log2-transformed in the
histograms for these microRNAs. As shown in Fig. 6A, in the HCT-15 colon cancer cell
line, expression levels of miR-5000-3p, miR-5009-3P and miR-552 in
the SP cells as detected by microRNA array were increased by 6.76-,
2.37- and 6.96-fold, respectively, than those of the non-SP cells
while those detected by RT-PCR were increased by 2.20-, 2.01- and
3.85-fold. In the HT-29 colon cancer cell line, expression levels
of miR-5000-3p, miR-5009-3P and miR-552 of the SP cells as detected
by the microRNA chip were increased by 2.25-, 2.26- and 2.81-fold,
respectively, than those of the non-SP cells while those detected
by RT-PCR were increased by 2.35-, 3.46- and 2.63-fold (Fig. 6B). In the LoVo colon cancer cell
line, expression levels of miR-5000-3p, miR-5009-3P and miR-552 of
the SP cells as detected by the microRNA array were increased by
3.28-, 2.35- and 8.13-fold, respectively, than those of the non-SP
cells while those detected by RT-PCR were increased by 2.57-, 2.00-
and 2.59-fold (Fig. 6C). MicroRNAs
including miR-5000-3p, miR-5009-3P and miR-552 detected by the
microRNA chip were upregulated in SP cells of all of the three
colon cancer cell lines. So were microRNAs obtained by RT-PCR.
Therefore, the results obtained by RT-PCR verified those obtained
by the microRNA chip. This implies that the data obtained from the
microRNA array analysis were reliable.
Discussion
In the present study, we successfully isolated SP
cells in colon cancer cell lines using Hoechst 33342 staining. SP
cells were first described by Goodell et al (20) and SP cells of several types of
malignancies were successfully isolated in subsequent studies
(22–27). Haraguchi et al (28) isolated SP cells from
gastrointestinal cancer cell lines. Although they reported the gene
expression profiles and resistance to chemotherapeutic agents of SP
cells derived from the liver cancer cell line Huh7, they did not
report the microRNA profiles of SP cells. Schetter et al
(29) and Callari et al
(30) reported the microRNA
profiling of colon cancer cells, but the colon cancer cells were
from colon cancer tissues. They did not report the microRNA
profiling of SP cells from colon cancer. In the present study, we
were able to isolate SP cells from all three colon cancer cell
lines (HCT15, HT29, LoVo). The ratio of SP cells in the HCT-15,
HT-29 and LoVo colon cancer cell lines was 16.75, 13.02 and 9.52%,
respectively. Inoda et al (31) reported that the ratio of SP cells in
the HCT-15, HT-29 and LoVo colon cancer cell lines was 11.1, 10.4
and 9.1%, respectively. Our data were similar to Inoda’s results.
This indicates that each type of colon cancer cell line contains a
certain ratio of SP cells.
SP and non-SP cells sorted from the HCT-15, HT-29
and LoVo colon cancer cell lines were treated with different
concentrations of 5-fluorouracil, oxaliplatin and adriamycin,
respectively, for 3 days. Our data showed that cell viability of
the SP cells derived from whichever HCT-15, HT-29 or LoVo colon
cancer cell line used, was significantly higher than that of the
non-SP cells at the same concentration of 5-fluorouracil. This
indicated that the SP cells of the colon cancer cell lines were
more resistant to 5-fluorouracil. Similar results were found in the
presence of oxaliplatin and adriamycin. Therefore the SP cells of
the colon cancer cell lines were more resistant to antitumor drugs.
Inoda et al reported that SP cells from colon cancer cell
lines SW480, HT-29 and HCT-15 showed resistance to chemotherapeutic
agents such as irinotecan or etoposide (31). All of these findings indicate that
SP cells of colon cancer cells are more resistant to
chemotherapeutic drugs than non-SP cells. Therefore, SP cells play
an important role in multidrug resistance of colon cancer.
Since SP cells play an important role in multidrug
resistance of colon cancer, we aimed to investigate the specific
biomarkers of SP cells. In a previous study, Behbod et al
investigated the gene markers of SP cells in breast cancer
(19). Microarray gene profiling
suggests that SP cells in breast cancer are a lineage-deficient
mammary gland subpopulation expressing key genes involved in cell
cycle regulation, development and angiogenesis. In the present
study, we performed the microRNA profiling of SP cells in colon
cancer cell lines to investigate the microRNA biomarkers of SP
cells in colon cancer. miRCURY™ LNA Array (v.18.0), the newest
version of microRNA array which can simultaneously detect hundreds
of microRNAs, was used to perform the microRNA profiling of SP
cells in colon cancer cell lines. In the HCT-15, HT-29 and LoVo
colon cancer cell lines, three microRNAs including miR-5000-3p,
miR-5009-3P and miR-552 were upregulated in SP cells of all of
these three colon cancer cell lines. However, no microRNA was
downregulated in SP cells of all three colon cancer cell lines.
Furthermore, the findings were also confirmed by RT-PCR. In
previous studies, Schetter et al (29) and Callari et al (30) reported the microRNA profiling of
colon cancer cells. However, the colon cancer cells were from colon
cancer tissues. Link et al (32) reported fecal microRNA profiling of
colon cancer whereas the stool samples were from patients with
colon cancer and healthy volunteers. Hofsli et al (33) investigated the serum microRNA
profile of colon cancer while the serum samples were from patients
with colon cancer and healthy controls. Although Zhang et al
(34) and Fang et al
(35) investigated the microRNA
expression profile of colon cancer stem-like cells, they collected
colon cancer stem-like cells based on CD133 or CD133/CD44 not SP
cells. In addition to this, they compared the microRNA expression
profile of colon cancer stem cells with non-stem cells only using
one type of colon cancer cell line. No study on the microRNA
profiling of SP cells of colon cancer was reported in all of the
above studies. Therefore, the present study was the first report on
microRNA profiling of SP cells in colon cancer.
In the present study, three microRNAs were found to
be upregulated in SP cells of all three colon cancer cell lines
including HCT-15, HT-29 and LoVo. These three microRNAs including
miR-5000-3p, miR-5009-3P and miR-552 may be potential microRNA
biomarker candidates of SP cells in colon cancer. As we know, SP
cells play an important role in multidrug resistance of colon
cancer. Thus, these three microRNAs may also be potential targets
for the treatment of colon cancer. In future research, antisense
RNA targeted to one of these three microRNAs will be used to
inhibit the specific microRNA expression to investigate whether
antisense RNA targeting to miR-5000-3p, miR-5009-3P or miR-552
reverses the multidrug resistance of colon cancer.
Acknowledgements
This study was supported by Guangdong Natural
Science Foundation, China (9451008901002424).
References
|
1
|
Hawk ET, Limburg PJ and Viner JL:
Epidemiology and prevention of colorectal cancer. Surg Clin North
Am. 82:905–941. 2002. View Article : Google Scholar : PubMed/NCBI
|
|
2
|
Sung J: Does fecal occult blood test have
a place for colorectal cancer screening in China in 2006? Am J
Gastroenterol. 101:213–215. 2006. View Article : Google Scholar : PubMed/NCBI
|
|
3
|
Taal BG, Van Tinteren H and Zoetmulder FA:
Adjuvant 5FU plus levamisole in colonic or rectal cancer: improved
survival in stage II and III. Br J Cancer. 85:1437–1443. 2001.
View Article : Google Scholar : PubMed/NCBI
|
|
4
|
Douillard JY, Cunningham D, Roth AD, et
al: Irinotecan combined with fluorouracil compared with
fluorouracil alone as first-line treatment for metastatic
colorectal cancer: a multicentre randomised trial. Lancet.
355:1041–1047. 2000. View Article : Google Scholar
|
|
5
|
Redmond SM, Joncourt F, Buser K, et al:
Assessment of P-glycoprotein, glutathione-based detoxifying enzymes
and O6-alkylguanine-DNA alkyltransferase as potential
indicators of constitutive drug resistance in human colorectal
tumors. Cancer Res. 51:2092–2097. 1991.PubMed/NCBI
|
|
6
|
van den Heuvel-Eibrink MM, Sonneveld P and
Pieters R: The prognostic significance of membrane
transport-associated multidrug resistance (MDR) proteins in
leukemia. Int J Clin Pharmacol Ther. 38:94–110. 2000.PubMed/NCBI
|
|
7
|
Tsuruo T, lida H, Tsukagoshi S, et al:
Overcoming of vincristine resistence in P388 leukemia in vivo and
in vitro through enhanced cytotoxicity of vincristine and
vinblastine by verapamil. Cancer Res. 41:1967–1972. 1981.PubMed/NCBI
|
|
8
|
Gao Z, Fields JZ and Boman BM:
Co-transfection of MDR1 and MRP antisense RNAs abolishes the drug
resistance in multidrug resistant human lung cancer cells.
Anticancer Res. 18:3073–3076. 1998.PubMed/NCBI
|
|
9
|
Xia Z, Zhu Z, Zhang L, et al: Specific
reversal of MDR1/P-gp-dependent multidrug resistance by RNA
interference in colon cancer cells. Oncol Rep. 20:1433–1439.
2008.PubMed/NCBI
|
|
10
|
Todaro M, Francipane MG, Medema JP and
Stassi G: Colon cancer stem cells: promise of targeted therapy.
Gastroenterology. 138:2151–2162. 2010. View Article : Google Scholar : PubMed/NCBI
|
|
11
|
Todaro M, Alea Mp, Di Stefano AB, et al:
Colon cancer stem cells dictate tumor growth and resist cell death
by production of interleukin-4. Cell Stem Cell. 1:389–402. 2007.
View Article : Google Scholar : PubMed/NCBI
|
|
12
|
Lee CJ, Dosch J and Simeone DM: Pancreatic
cancer stem cells. J Clin Oncol. 26:2806–2812. 2008. View Article : Google Scholar : PubMed/NCBI
|
|
13
|
Zheng X, Shen G, Yang X and Liu W: Most C6
cells are cancer stem cells: evidence from clonal and population
analyses. Cancer Res. 67:3691–3697. 2007. View Article : Google Scholar : PubMed/NCBI
|
|
14
|
Beier D, Hau P, Proescholdt M, et al:
CD133+ and CD133− glioblastoma-derived cancer
stem cells show differential growth characteristics and molecular
profiles. Cancer Res. 67:4010–4015. 2007.PubMed/NCBI
|
|
15
|
Sakariassen PØ, Immervoll H and Chekenya
M: Cancer stem cells as mediators of treatment resistance in brain
tumors: status and controversies. Neoplasia. 9:882–892.
2007.PubMed/NCBI
|
|
16
|
Szotek PP, Pieretti-Vanmarcke R, Masiakos
PT, et al: Ovarian cancer side population defines cells with stem
cell-like characteristics and Mullerian Inhibiting Substance
responsiveness. Proc Natl Acad Sci USA. 103:11154–11159. 2006.
View Article : Google Scholar : PubMed/NCBI
|
|
17
|
Hirschmann-Jax C, Foster AE, Wulf GG, et
al: A distinct ‘side population’ of cells with high drug efflux
capacity in human tumor cells. Proc Natl Acad Sci USA.
101:14228–14233. 2004.
|
|
18
|
Zhou S, Schuetz JD, Bunting KD, et al: The
ABC transporter Bcrp1/ABCG2 is expressed in a wide variety of stem
cells and is a molecular determinant of the side-population
phenotype. Nat Med. 7:1028–1034. 2001. View Article : Google Scholar : PubMed/NCBI
|
|
19
|
Behbod F, Xian W, Shaw CA, et al:
Transcriptional profiling of mammary gland side population cells.
Stem Cells. 24:1065–1074. 2006. View Article : Google Scholar : PubMed/NCBI
|
|
20
|
Goodell MA, Brose K, Paradis G, et al:
Isolation and functional propertied of murine hematopoietic stem
cells that are replicating in vivo. J Exp Med. 183:1797–1806. 1996.
View Article : Google Scholar : PubMed/NCBI
|
|
21
|
Carmichael J, Degraff WG, Gazdar AF, et
al: Evaluation of a tetrazolium-based semiautomated colorimetric
assay: assessment of chemosensitivity testing. Cancer Res.
47:936–942. 1987.PubMed/NCBI
|
|
22
|
Murase M, Kano M, Tsukahara T, et al: Side
population cells have the characteristics of cancer stem-like
cellscancer-initiating cells in bone sarcomas. Br J Cancer.
101:1425–1432. 2009. View Article : Google Scholar : PubMed/NCBI
|
|
23
|
Kondo T, Setoguchi T and Taga T:
Persistence of a small subpopulation of cancer stem-like cells in
the C6 glioma cell line. Proc Natl Acad Sci USA. 101:781–786. 2004.
View Article : Google Scholar : PubMed/NCBI
|
|
24
|
Chiba T, Kita K, Zheng YW, et al: Side
population purified from hepatocellular carcinoma cells harbors
cancer stem cell-like properties. Hepatology. 44:240–251. 2006.
View Article : Google Scholar : PubMed/NCBI
|
|
25
|
Ho MM, Ng AV, Lam S and Hung JY: Side
population in human lung cancer cell lines and tumors is enriched
with stem-like cancer cells. Cancer Res. 67:4827–4833. 2007.
View Article : Google Scholar : PubMed/NCBI
|
|
26
|
Mitsutake N, Iwao A, Nagai K, et al:
Characterization of side population in thyroid cancer cell lines:
cancer stem-like cells are enriched partly but not exclusively.
Endocrinology. 148:1797–1803. 2007. View Article : Google Scholar : PubMed/NCBI
|
|
27
|
Wang J, Guo LP, Chen LZ, et al:
Identification of cancer stem cell-like side population cells in
human nasopharyngeal carcinoma cell line. Cancer Res. 67:3716–3724.
2007. View Article : Google Scholar : PubMed/NCBI
|
|
28
|
Haraguchi N, Utsunomiya T, Inoue H, et al:
Characterization of a side population of cancer cells from human
gastrointestinal system. Stem Cells. 24:506–513. 2006. View Article : Google Scholar : PubMed/NCBI
|
|
29
|
Schetter AJ, Leung SY, Sohn JJ, et al:
MicroRNA expression profiles associated with prognosis and
therapeutic outcome in colon adenocarcinoma. JAMA. 299:425–436.
2008. View Article : Google Scholar : PubMed/NCBI
|
|
30
|
Callari M, Dugo M, Musella V, et al:
Comparison of microarray platforms for measuring differential
microRNA expression in paired normal/cancer colon tissues. PLoS
One. 7:1–15. 2012. View Article : Google Scholar
|
|
31
|
Inoda S, Hirohashi Y, Torigoe T, et al:
Cytotoxic T lymphocytes efficiently recognize human colon cancer
stem-like cells. Am J Pathol. 178:1805–1813. 2011. View Article : Google Scholar : PubMed/NCBI
|
|
32
|
Link A, Balaguer F, Shen Y, et al: Fecal
MicroRNAs as novel biomarkers for colon cancer screening. Cancer
Epidemiol Biomarkers Prev. 19:1766–1774. 2010. View Article : Google Scholar : PubMed/NCBI
|
|
33
|
Hofsli E, Sjursen W, Prestvik WS, et al:
Identification of serum microRNA profiles in colon cancer. Br J
Cancer. 108:1712–1719. 2013. View Article : Google Scholar : PubMed/NCBI
|
|
34
|
Zhang H, Li W, Nan F, et al: MicroRNA
expression profile of colon cancer stem-like cells in HT29
adenocarcinoma cell line. Biochem Biophys Res Commun. 404:273–278.
2011. View Article : Google Scholar : PubMed/NCBI
|
|
35
|
Fang Y, Xiang J, Chen ZY, et al: miRNA
expression profile of colon cancer stem cells compared to non-stem
cells using the SW1116 cell line. Oncol Rep. 28:2115–2124.
2012.PubMed/NCBI
|