Introduction
Ependymomas are primary neuroepithelial tumors of
the central nervous system (CNS) mimicking ependymal cell
differentiation. Intraspinal ependymomas are more common in the
adult patient population whereas children more often have
intracranial tumors (1).
Ependymomas are subgrouped into subependymomas (WHO grade I),
myxopapillary ependymomas (WHO grade I), ependymomas (WHO grade
II), and anaplastic ependymomas (WHO grade III) (2). They are rare with an incidence of ~2
per million inhabitants per year (3). Ependymomas of grades II and III
constitute 2–5% (4–7) of all primary CNS neoplasms and only
1–3% of brain tumors in adults (6,8).
However, they are the fourth most common CNS neoplasm in children,
constituting 6–12% of all intracranial pediatric tumors. Within the
pediatric population, more than a third of the patients are 4 years
of age or younger (2,4,6).
Surgery is the mainstay of ependymoma treatment and
gross total tumor resection (GTR) is an independent prognostic
factor affecting both overall (OS) and progression-free (PFS)
survival (2,6,8–10). GTR
is only achieved in ~50–75% of patients, however (8–10). The
5-year relative survival of ependymoma patients is reported to be
~70% (11,12) and children tend to fare worse than
adults (13,14). Patients with intraspinal tumors have
a better prognosis than do those with intracranial tumors (2,6,13,15)
and some studies indicate that supratentorial ependymomas carry a
worse prognosis than infratentorial lesions (13,16–19).
Grade I ependymomas have a relatively good prognosis (2) whereas the histologic distinction
between ependymoma grade II and III is a controversial issue of
unclear prognostic importance (2,3,15,20–22).
Genetic and molecular characteristics of these tumors may prove to
be more reliable prognostic markers (15,23).
Only 113 ependymomas (of 2,511 CNS tumors) are
registered in the Mitelman Database of Chromosome Aberrations in
Cancer (24). Approximately
two-thirds of ependymomas are karyotypically abnormal (25) and most of these are near-diploid
(24,26). Loss of chromosome 22 has been the
most common aberration (25,27)
reported in approximately a third of tumors with abnormal
karyotypes, with structural abnormalities of chromosome 22 being
reported in another 11% (3,24). In a large meta-analysis (23) comparing CGH results in adult and
pediatric ependymomas, chromosome 22 was the most common site of
genomic loss in both groups. 1q gain was significantly more
frequent in the pediatric tumors and was the most common aberration
overall in this group. Gains of chromosomes 7, 9 and 12 were
significantly more common in adult tumors which also had a higher
number of genomic imbalances than did pediatric ependymomas. Thus,
the authors suggested that ependymomas of the two age groups are
genetically distinct.
No previous studies have investigated the ependymoma
genome using a combination of CGH and G-banding techniques. We
describe genomic and chromosomal aberrations in a series of
histologically heterogeneous ependymomas.
Materials and methods
Patients and tumor samples
The tumor samples used in the present study (19
specimens from 18 patients) were prospectively collected between
January 2005 and December 2012. Clinical and pathological details
are provided in Table I. All
patients underwent surgery at the Department of Neurosurgery, Oslo
University Hospital-Rikshospitalet and none of them had received
chemotherapy or radiotherapy prior to surgery. Patient age ranged
from eight months to 75 years at the time of the primary surgery.
There were six female and 12 male patients, and all but three
samples were taken from primary tumors. Both spinal and
intracranial tumors were included, and all histopathological
diagnoses were reviewed according to the WHO 2007 classification
system (2). Progression was defined
as tumor growth on magnetic resonance imaging (MRI) and recurrence
was defined as the appearance of a new tumor by MRI.
Progression-free survival (PFS) was defined as the time interval
between initial surgery and radiologically proven tumor progression
or recurrence. Overall survival (OS) was defined as the time
interval between primary surgery and death.
 | Table IClinical and pathological data of the
19 ependymoma samples from 18 patients. |
Table I
Clinical and pathological data of the
19 ependymoma samples from 18 patients.
| Case no. | Gender/age
(years) |
Localizationa | Histologyb | WHO grade | Primary tumor/
recurrence | Extent of
resectionc | PFS/OS (years) | Current disease
statusd |
|---|
| 1 | F/48 | IT | E (melanotic
variant) | II | Primary | STR | 8.5e | AWD |
| 2 | M/44 | S | MPE | I | Primary | GTR | 7.6e | NED |
| 3 | M/49 | ST | AE | III | Recurrent | GTR | 8.9 | NED |
| 4 | M/69 | IT | MPE | I | Recurrent | STR | 4.6/5.8 | DOD |
| 5 | F/47 | S | E | II | Primary | GTR | 7.5e | NED |
| 6 | M/42 | S | E | II | Primary | GTR | 6.9e | NED |
| 7 | M/53 | S | E | II | Primary | GTR | 6.5e | NED |
| 8 | M/61 | IT | SE | I | Primary | GTR | 6.1e | NED |
| 9-1 | M/38 | ST | AE (giant cell
type) | III | Primary | GTR | 1.5 | |
| 9-2 | | | AE | III | Recurrent | GTR | 4.2e | NED |
| 10 | M/75 | IT | SE | I | Primary | GTR | 5.1e | NED |
| 11 | M/0.8 | ST | E | II or III | Primary | GTR | 5.1e | NED |
| 12 | M/42 | ST | AE | III | Primary | GTR | 0.8/1.3 | DOE |
| 13 | F/46 | IT | SE | I | Primary | GTR | 3.4e | NED |
| 14 | F/46 | IT | E | II | Primary | GTR | 1.7 | AWD |
| 15 | F/0.9 | ST | AE/GBM | IV | Primary | STR | 2.1e | AWD |
| 16 | F/1 | IT | AE | III | Primary | STR | 1.2 | AWD |
| 17 | M/72 | IT | E | II | Primary | GTR | 0.0/0.0 | DPC |
| 18 | M/67 | IT | E with SE
component | II | Primary | GTR | 0.7e | NED |
G-banding and karyotyping
All tumor samples were processed for cytogenetic
analysis using standard methods as described by Mandahl (28). The chromosomes of the dividing cells
were G-banded and a karyotype was established in accordance with
ISCN 2009 (29). Karyotypes with
four or fewer aberrations were defined as simple, whereas
karyotypes with five or more aberrations were defined as
complex.
DNA extraction and high-resolution
comparative genomic hybridization (HR-CGH)
DNA was extracted from the tumor samples using
Maxwell 16 (Promega, Madison, WI, USA) (12 samples), standard
phenol/chloroform method (four samples), or MagAttract DNA Mini M48
kit (Qiagen, Hilden, Germany). DNA sample quality and
concentrations were measured and assessed using NanoVue Plus (GE
Healthcare Life Sciences, Uppsala, Sweden).
CGH was performed as described by Kallioniemi et
al (30) with modifications as
published by Kirchhoff et al (31,32)
and Kraggerud et al (33).
Normal male human DNA (Promega) and the LoVo cell line
(Sigma-Aldrich, St. Louis, MO, USA) were used as negative and
positive controls. Inverted DAPI images were used to identify the
chromosomes in 12 suitable metaphases of good quality, and the
average green-to-red fluorochrome ratios with 99.5% confidence
intervals were calculated along the length of each chromosome. In
the cases where the G-banded karyotype was not near-diploid, a 95%
confidence interval was used. These ratio profiles were compared
with dynamic standard reference intervals as described by Ribeiro
et al (34). Aberrations
were recorded when the case and standard reference profiles, with
their respective confidence intervals, did not overlap. A
green-to-red ratio of 2.0 was defined as the threshold for
amplifications. The short arms of acrocentric chromosomes
(chromosome 13, 14, 15, 21 and 22) and the Y chromosome were not
included in the analysis due to the known repetitive sequences in
these chromosomal arms (30). The
results of the HR-CGH analysis were described according to ISCN
2009 guidelines (29). We defined
four or fewer chromosomes with imbalances as simple genomic
changes, as opposed to complex genomic changes when five or more
chromosomes were imbalanced.
Study approval and ethics
The study was approved by the Norwegian Regional
Research Ethics Committee (reference number S-06046). Written,
informed consent was obtained from 15 participants. The remaining
three patients were included post mortem following permission from
the Norwegian Directorate of Health. All tumor samples were
collected from an approved biobank.
Results
Karyotypes were established from 17 samples, the
remaining two samples failed in culture. Tissue was available for
DNA extraction and HR-CGH analysis for 17 of 19 samples. Fifteen
samples (79%) were analyzed using both methods. The karyotypes and
HR-CGH results are presented in Table
II and Fig. 1. Tumor recurrence
and/or progression occurred in six patients after an average of 3.1
years (median 1.6 years). Three patients died; one of postoperative
complications, one of ependymoma, and one of other disease. GTR was
achieved at primary surgery in 14 of 18 patients (78%). For samples
9-1 and 9-2, which were taken from the primary and recurrent tumor
from one patient, GTR was achieved at both the initial surgery and
at the time of recurrence. These two tumors are thoroughly
described in a previous case report (35).
| Table IIKaryotypes and HR-CGH results in 19
ependymoma samples from 18 patients. |
Table II
Karyotypes and HR-CGH results in 19
ependymoma samples from 18 patients.
| Case no. | Karyotype | HR-CGH results |
|---|
| 1 |
68–70,XX,−X,−2,−6,+7,+9,+10,+11,+14,+15,−16[cp4]/46,XX[2] | rev ish enh
(5p14p15, 7, 8q23, 9, 11, 14,
15) dim (X, 2, 6, 16) |
| 2 | 46,XY | No material
available |
| 3 |
89–94,XXYY,+2,−6,i(6)(p10)[cp11]/46,XY[2] | rev ish enh
(2), dim (6q) |
| 4 |
45,XY,−6[6]/44,idem,−Y[16]/46,XY[1] | No material
available |
| 5 | Culture fail | rev ish dim (17q21,
22q11) |
| 6 |
64–69,XXY,+Y,−3,+5,−6,+7,−11,+13,−14,+15,−16,−22
[cp6]/46,XY[13] | rev ish enh
(Xq21qter, 5, 7, 8, 13) dim (3,
6, 11, 16p11p13, 16q12q24,
22) |
| 7 |
69–70,XXY,+Y,+2,−3,+5,+7,−8,+12,−14,+15,−18,+20,−21,
−22[cp7]/46,XY[21]/nonclonal[1] | rev ish enh
(Xp11p21, 2, 5, 7p13p22, 7q11qter,
9p23p24, 12q23, 12q24, 20p11pter,
20q13) dim (1p36pter, 1q12q21, 1q21, 3,
8p11p12, 8p21p23, 8q21q23, 8q24, 9q34,
11q13, 14q32, 16p13, 18p11, 18q11q12,
18q21q22, 19q13, 21, 22) |
| 8 | 46,XY | No imbalances |
| 9-1 |
34–36,XY,−3,−6,−11,−12,−13,−14,−15,−17,−18,−22[cp6]/46,XY[10] | rev ish enh
(2q22q32, 2q34q37, 4q12q21, 4q24q31, 4q32q34, 5p12p14, 5q11q12,
5q21, 5q33q34, 9p23pter, 9q13q21) dim (3p13p14,
3p21p25, 3q12q13, 3q13q22, 3q24q27,
6p12, 6q22, 13q12q31, 14q11q21,
14q24q32, 15q15q21, 15q22q24, 17p11p13, 17q11q21,
17q22q24, 18q12q22) |
| 9-2 |
33–36,XY,−3,−6,−10,−11,−12,−13,−14,−18,−22[cp3] | rev ish enh
(1p13p34, 1q21qter, 2, 4, 5p, 5q13q31, 5q33q35, 7p13p22, 7q21q22,
7q22q36, 8p21pter, 8q12qter, 9p21pter, 9q22q34, 20p12p13, 20q13,
21q21q22) dim (3p21, 3q27q28, 6p12p23, 6q25, 10p11p14, 10q21,
11p11p15, 11q13, 12p11p12, 12p13, 12q13q14, 12q24, 15q11q24, 17p,
17q11q25, 22q11q13) |
| 10 | 46,XY [19] | No imbalances |
| 11 |
46,XY,der(14)t(2;14)(p23;q22)[14]/46,XY[1] | rev ish enh
(2p23pter) dim (14q23qter) |
| 12 |
44,XY,−10,del(13)(q22),−22[12]/44,
idem,der(14)t(1;14)(p32;q32)[5]/39–43,idem,
−8[14],−11[9],−12[4],−17[7],−18[4][cp22] | rev ish enh (7p)
dim (8q11q22, 8q24, 10, 11q13, 12, 13, 17, 22q12qter) |
| 13 | Fail - no
metaphases suitable for analysis | No imbalances |
| 14 | 46,XX [10] | rev ish enh (4, 5,
11, 14, 15, 17, 18, 19q13, 20p11p13, 20q11, 20q13) dim (6p12p22,
6q, 8, 10, 13) |
| 15 |
81–92,XXX,−X,del(2)(p13~16p21~23),−10,+22[cp12]/46,XX[4] | rev ish dim
(1p35p36, 2p16p23, 16q12, 16q21, 16q24) |
| 16 | 46,XX[21] | No imbalances |
| 17 |
45,XY,−6[14]/46,XY[4] | rev ish dim
(6) |
| 18 |
45,X,−Y[5]/46,XY[19]/nonclonal[4] | No imbalances |
G-banding and karyotyping
Twelve of 17 karyotypes (71%) were abnormal
(Table II, Fig. 1): seven were near-diploid, three
were near-triploid and two were near-tetraploid. Six (50%)
karyotypes were simple, whereas the remaining six aberrant
karyotypes had multiple chromosomal abnormalities. The number of
aberrations in each abnormal sample ranged from one to 13. Eight of
12 (67%) abnormal samples displayed numerical aberrations only.
Three samples (cases 3, 12 and 15) showed a combination of
structural and numerical genomic abnormalities. One sample had an
unbalanced t(2;14)(p23;q22) as its sole aberration (case 11). Three
of the 12 abnormal karyotypes (25%) displayed a sole abnormality
(cases 11, 17 and 18), but none of these were recurrent. None of
the structural rearrangements occurred in more than one tumor. The
most common numerical aberration was loss of chromosome 6, which
was noted in six tumor samples, two of which were obtained from the
same patient (primary tumor and recurrence; cases 9-1 and 9-2).
Five tumors from four patients showed loss of chromosome 22. The
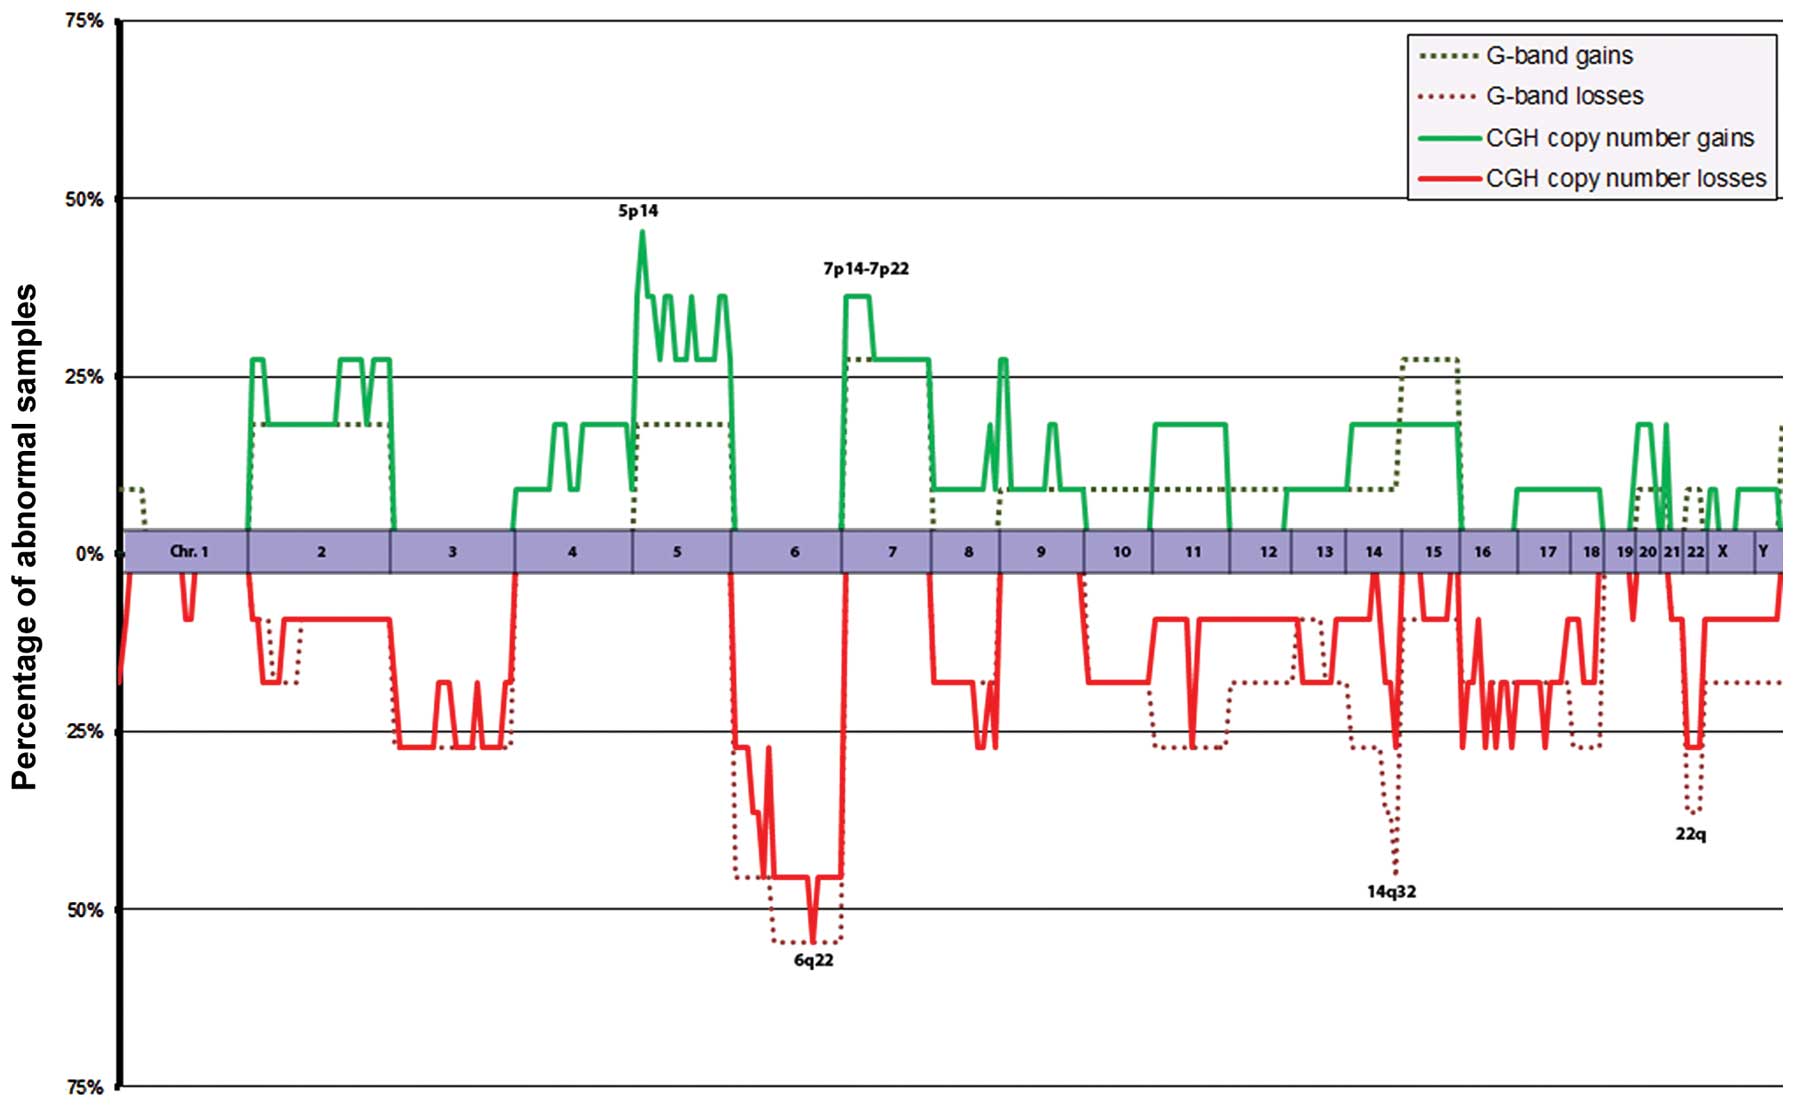
overall gain/loss profile of 11 karyotypically abnormal tumor
samples (Fig. 1; the recurrent
tumor from the patient from whom we also had primary tumor
material, case 9-1, is excluded) showed that the long arm of
chromosome 6 was lost in six tumors (55%). This was mostly due to
monosomy 6, but in one case because of an isochromosome 6p with
loss of chromosome arm 6q. Material from 14q (14q24-qter) was lost
in five (45%) samples; this was due to loss of the entire
chromosome 14 in three tumors and to unbalanced structural
rearrangements in two.
HR-CGH analysis
HR-CGH analysis was informative in all 17 samples
from which DNA was available. Twelve of 17 samples (71%) had
genomic imbalances, and all analyzed chromosomes were affected in
one or more samples. Gains were noted in nine and losses in 12
samples. No amplifications were found. The average number of
aberrations per abnormal sample was 12, and gains (average 5.3)
were slightly less common than losses (average 6.9). Five of 12
samples (42%) had simple genomic changes whereas the remaining
seven (58%) were genomically complex with an average of 12 affected
chromosomes per sample. The most common genomic imbalances in 11
tumor samples (Fig. 1; the
recurrent tumor from the patient in which we also had material from
the primary tumor, case 9-2, is again excluded) were copy number
loss involving 6q (55%) and 6p (45%) and gain involving 5p
(46%).
Genomic aberrations in anatomical
subgroups
Karyotypes were successfully obtained from three of
four spinal tumors. One of them was normal (case 2) whereas the
other two (cases 6 and 7) had near-triploid, complex karyotypes
with numerical abnormalities only. HR-CGH was performed on three of
four spinal lesions and all three were abnormal. Two tumors
displayed complex genomic aberrations and all three had copy number
losses at band 22q11.
Eight of nine (89%) infratentorial tumors were
successfully karyotyped. Four of these were cytogenetically normal
and one tumor (case 18) showed Y loss only. Two of the remaining
three abnormal tumors (cases 4 and 17) had simple, near-diploid
karyotypes with loss of chromosome 6. The last tumor (case 1) had a
complex, near-triploid karyotype with several numerical
aberrations. DNA material was available for HR-CGH analysis for
eight of nine (89%) tumors. Three of these (38%; cases 1, 14 and
17) were abnormal, of which two harbored complex genomic
imbalances. Genomic losses at 6p and 6q were found by HR-CGH in all
three abnormal infratentorial tumors.
All six supratentorial tumors were karyotypically
abnormal and in three of five (60%) tumors loss of material from
14q was noted. All four tumors harboring structural rearrangements
were supratentorial. HR-CGH results from all six supratentorial
samples were abnormal. When excluding the recurrent tumor (case
9-2), three of five (60%) cases displayed simple genomic
changes.
Genomic aberrations and tumor grade
Sixteen tumors were assessed; five grade I tumors
(cases 2, 4, 8, 10 and 13), seven grade II tumors (cases 1, 5, 6,
7, 14, 17 and 18), and four grade III tumors (cases 3, 9-1, 12 and
16). Case 11 was not included due to its uncertain WHO grade and
case 9-2 was not assessed because its corresponding primary tumor
(case 9-1) was already included in the grade III group. Case 15 was
excluded due to its histology (anaplastic ependymoma with prominent
glioblastoma features).
Four of five (80%) grade I tumors were informative
by G-banding. Three of these (75%) were karyotypically normal,
whereas the remaining tumor (case 4) had a simple karyotype with
monosomy 6. DNA was available for HR-CGH analysis in three of five
tumors and all three were normal.
Six of seven grade II lesions were informative by
G-banding. One of these (17%) had a normal karyotype. There were no
structural chromosomal aberrations found in this group. The most
common numerical aberrations were +7, +15 and −6 (three cases each;
50%). HR-CGH analyses were performed on all seven grade II
ependymomas: one tumor (14%) did not harbor any genomic imbalances,
two tumors (29%) displayed simple genomic imbalances, and four
(57%) had complex HR-CGH profiles with an average of 17 aberrations
per sample.
G-banded karyotypes were obtained from all four
grade III ependymomas. One karyotype was normal, one tumor had a
simple karyotype and two tumors had complex karyotypes. All four
tumors were informative by HR-CGH. One of them had a normal
profile, one had simple changes, whereas the remaining two tumors
(cases 9-1 and 12) had complex profiles.
Genomic aberrations and biological tumor
behavior
Tumor samples from patients with known disease
progression were compared to those with stable disease. Six
patients were included (cases 3, 4, 9-1, 12, 14 and 16) in the
progression group, eleven patients (cases 1, 2, 5, 6, 7, 8, 10, 11,
13, 15 and 18) in the ‘no progression’ group, whereas one patient
(case 17) died of postoperative complications and was excluded.
There were four grade III, one grade II, and one grade I tumor
within the progression group.
The progression group was karyotypically
heterogeneous. Two patients (33%) had a normal karyotype, two
(cases 3 and 4) had karyotypes with simple changes, and the
remaining two abnormal tumors were karyotypically complex.
Aberrations leading to loss of 6q were found in three of four (75%)
abnormal karyotypes. By HR-CGH, one tumor had a normal profile, one
had a simple profile, and three tumors had complex changes. The
most common imbalance by CGH was loss of material from band 6q22
which was noted in three of four (75%) abnormal samples.
The average follow-up for the 11 patients in the ‘no
recurrence’ group was 5.4 years (median 6.1). Karyotypes were
successfully obtained from nine of 11 (82%) tumors. Three of these
were normal, three were karyotypically simple, while the remaining
three samples had complex karyotypes. The most common karyotypic
aberrations in this group were +7 and +15 as well as loss of
material from the distal end of chromosome 14. These changes
occurred in three tumors (50%) each. DNA was available for HR-CGH
in all but one of the cases in this group of tumors. Four of them
(40%) were normal. Among the six remaining cases there were three
samples with simple and three samples with complex profiles. The
most common imbalances were gains at 5p and 7p/7q as well as losses
from 16p/16q and 22q, which were all found in three (50%) of the
six abnormal samples.
Discussion
There was good overall concordance between HR-CGH
and G-banding results in the 19 ependymomas we examined (Figs. 1 and 2; Table
II). Of the 15 tumor samples analyzed by both methods, three
(20%) were normal by both G-banding and HR-CGH. Because cryptic
balanced rearrangements are not visible in G-banded karyotypes and
small genomic imbalances are below the HR-CGH resolution level, we
cannot exclude the possibility that the observed normality was
representative for the parenchyma in these tumors. At least equally
likely is that there were not enough neoplastic cells present in
these samples for the analytical techniques to pick up
abnormalities. Some discrepancies between the two methods were
observed, however; the most striking example of which was case 14.
This tumor had a normal karyotype, but multiple gains and losses,
mainly of whole chromosomes, when analyzed by HR-CGH. In this case,
apparently the parenchymal cells did not divide in vitro and
so remained undetected.
22q loss was previously reported to be the most
common genomic aberration in ependymal tumors (23,25–27)
and the present study confirmed this aberration to be a frequent
finding (22%). However, the most common imbalance in the present
series, irrespective of tumor histology, grade, or anatomical
location, was 6q loss (39%). 6q loss was previously detected in
ependymomas at a frequency of 15–30% (23,36–39).
Some genes mapping to the long arm of chromosome 6 have previously
been reported to be downregulated in ependymal tumors, including
SASH1 [a candidate tumor suppressor gene in breast (40) and colon (41) cancer], TCP1 (involved in
tubulin function), ADM1 and CDK11 (involved in cell
proliferation) (15,42,43).
According to the Cancer Gene Census (44), five genes located on chromosome 6
are involved in human cancers. Large-scale genomic alterations such
as 6/6q loss might contribute to carcinogenesis by affecting these
and/or presently unknown cancer genes; alternatively, the
chromosomal aberration may lead to regulatory changes of an unknown
type. Notably, Korshunov et al (38) proposed a risk stratification scheme
for ependymomas based on cytogenetics with tumors harboring
monosomy 6 (among other aberrations) being significantly associated
with an excellent progression-free and overall survival. These
findings were validated in an independent cohort of 170 patients.
Some smaller studies have also investigated the impact of 6q
deletions on prognosis. Monoranu et al (45) found that 6q25.3 deletions in
pediatric, intracranial grade III ependymomas were significantly
associated with longer overall survival. In contrast, Rajaram et
al (46) found that 6q23 loss,
detected by fluorescent in situ hybridization (FISH), was
associated with disease progression in a mixed patient population.
The present series is small and prognostic conclusions cannot be
drawn. The potential of 6q loss as a prognostic marker is still in
need of prospective evaluation in future studies (47). 5p gain is also a known abnormality
in ependymomas and was detected in five of 12 tumors (42%) with
copy number changes. Kilday et al (23) found that gain of chromosome 5 or
chromosome arm 5p was reported in ~25% of adult ependymomas
analyzed by CGH. In the present study, this aberration was not
typical of any anatomical subgroup, but four of five (80%) tumors
with 5p gain were grade II ependymomas.
Pediatric ependymomas appear to be genetically
distinct from adult tumors; 1q gain was reported to be more common
in children in spite of generally fewer genomic imbalances or even
balanced genomic profiles by CGH (23,38,48).
1q gain was found to be associated with poor survival for
intracranial ependymoma patients (38,47).
In our series, 1q gain was not found in any tumor, neither adult
nor pediatric. The three pediatric ependymomas all had simple
karyotypes and few imbalances by HR-CGH. One of them was normal
both by karyotyping and HR-CGH (case 16). Notably, this was a
clinically aggressive tumor which progressed after 1.2 years in
spite of active oncological treatment. Another pediatric tumor
(case 15) was described by the neuropathologist as an anaplastic
glioma with both astrocytic and ependymal features. The final
diagnosis was ‘anaplastic glioma, WHO grade IV, most likely
anaplastic ependymoma’ and the patient was treated according to
ependymoma protocols. The karyotype was near-tetraploid but simple,
with an interstitial 2p deletion, gain of chromosome 22, and loss
of chromosome 10. The HR-CGH analysis confirmed the 2p deletion and
also showed loss of 1p and 16q. Loss of chromosome 10 is a typical
finding in glioblastomas (26,49)
but was not frequent in the current ependymoma series. Furthermore,
none of the most common aberrations in this series (Fig. 1), such as 6q loss, 5p gain, 7p/7q
gain or 22q loss, were detected in this particular tumor.
Glioblastomas most often have complex karyotypes with multiple
structural and numeric abnormalities (49). Based on the cytogenetic findings,
one might argue that this case bears more resemblance to
astrocytomas/glioblastomas than to ependymomas.
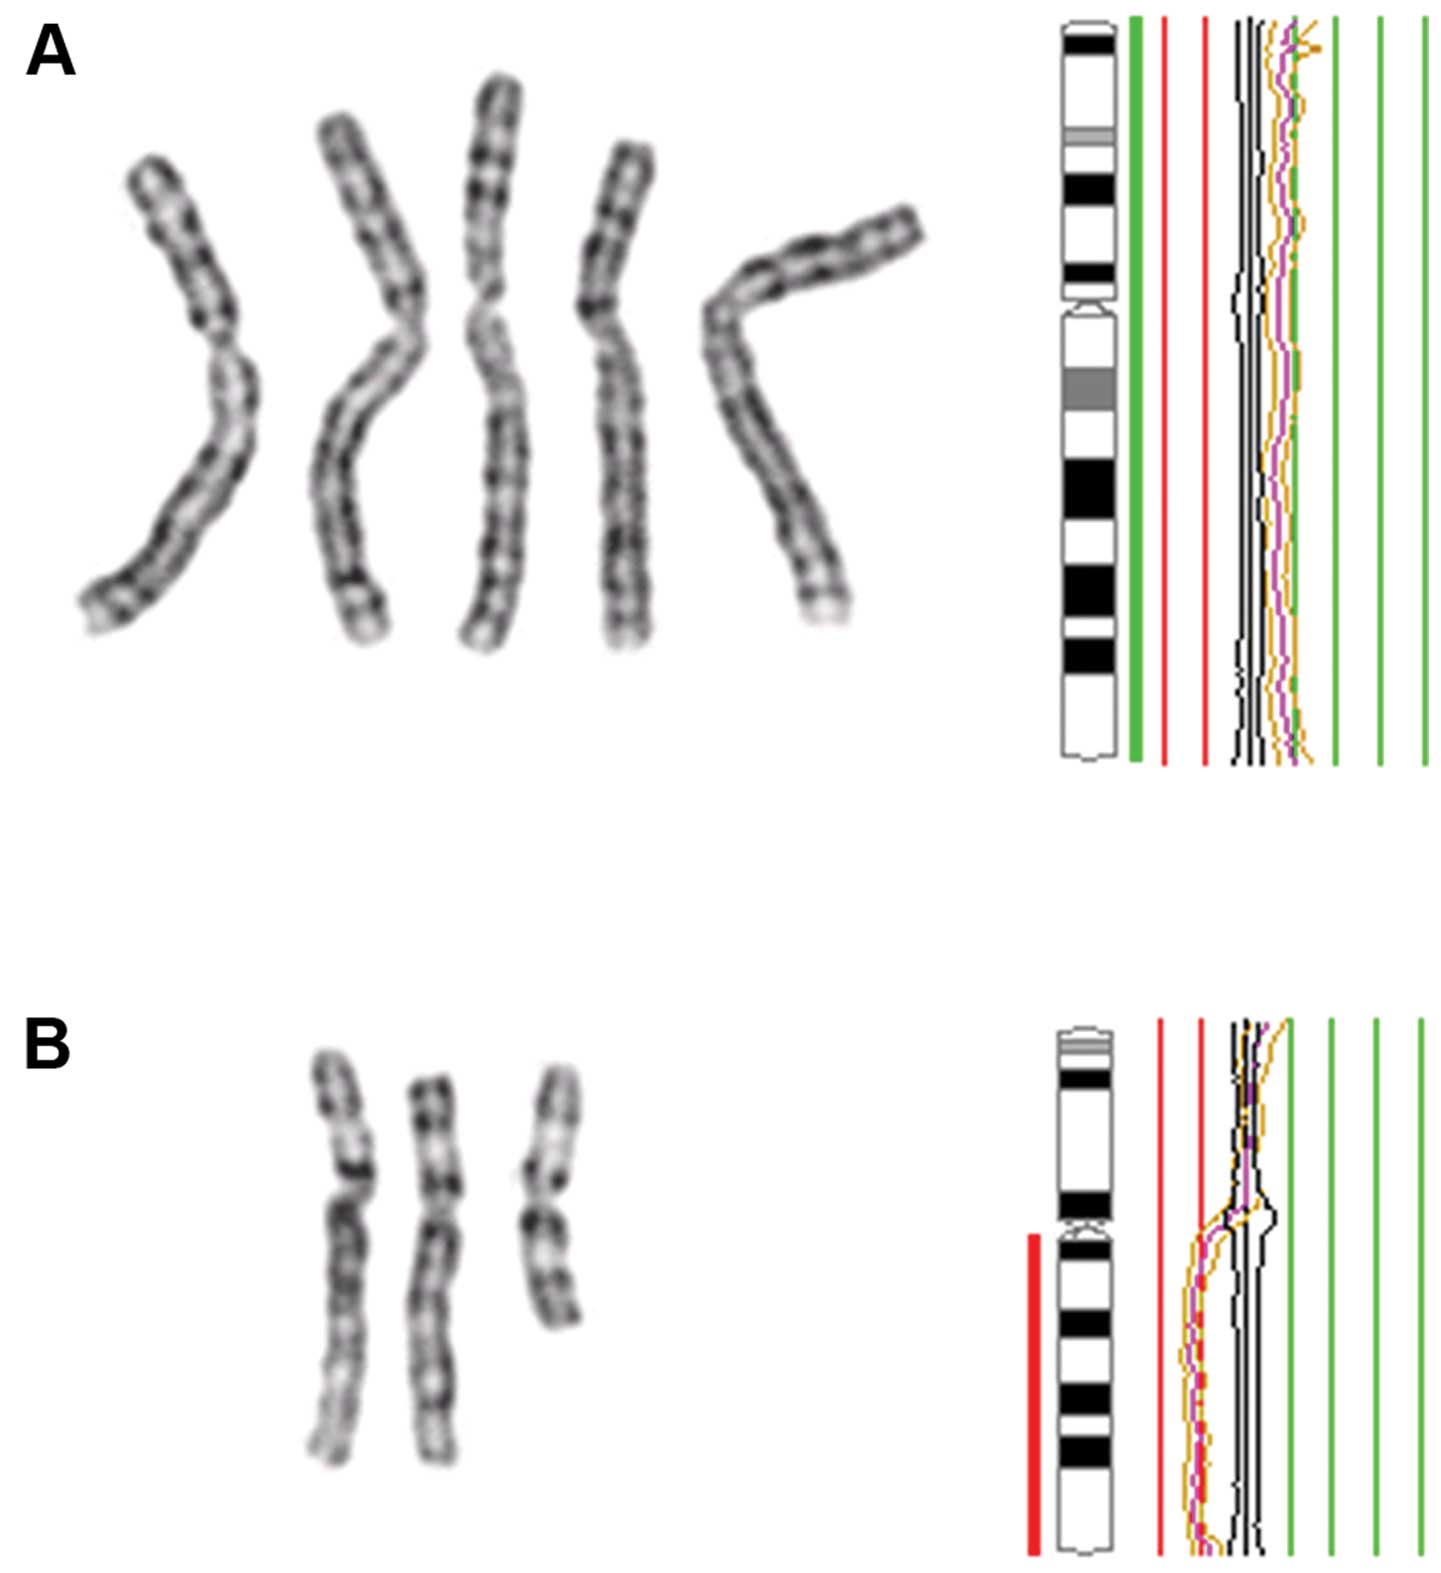
Four tumors in this series (cases 3, 11, 12 and 15)
harbored structural chromosomal rearrangements. Among these, case
11 is of particular interest. This tumor had a der(14)t(2;14) as its sole aberration by
G-banding. The unbalanced translocation was reflected in the HR-CGH
profile which displayed loss of material at 14q23qter but also gain
of material at 2p23pter. Notably, this breakpoint region on
chromosome 2 (2p23) was also involved in an interstitial 2p
deletion found in another tumor (case 15). It is possible that the
observed rearrangements affect putative cancer-related genes
located in this chromosomal region. Thus, 2p23 is an area of
interest for future molecular studies.
The present study is the first to combine karyotypic
and CGH analyses of ependymomas. It provides an overview of the
ependymoma genome and is a significant contribution to existing
cytogenetic knowledge on these rare tumors. 6q loss and 5p gain
were found to be the most common chromosomal aberrations in our
heterogeneous patient population. The significance of these
findings requires further analysis in larger studies.
Acknowledgements
The present study was supported by grants from the
Norwegian Cancer Society and The Norwegian Children’s Cancer Fund
(Barnekreftforeningens forskningsfond-Forsvar mot kreft). It was
partly supported by the Research Council of Norway through its
Centres of Excellence funding scheme, project number 179571. The
authors thank Hanne-Sofie Spenning Dahlback, Hege Kilen Andersen
and Lisbeth Haugom for data management and technical
assistance.
References
|
1
|
McGuire CS, Sainani KL and Fisher PG:
Incidence patterns for ependymoma: a Surveillance, Epidemiology,
and End Results study. J Neurosurg. 110:725–729. 2009. View Article : Google Scholar : PubMed/NCBI
|
|
2
|
McLendon RE, Schiffer D, Rosenblum MK,
Wiestler OD, Kros JM, Korshunov A and Ng HK: Ependymal tumours. WHO
Classification of Tumours of the Central Nervous System. 4th
edition. Louis DN, Ohgaki H, Wiestler OD and Cavenee WK:
International Agency for Research on Cancer (IARC); Lyon: pp.
69–80. 2007
|
|
3
|
Reni M, Gatta G, Mazza E and Vecht C:
Ependymoma. Crit Rev Oncol Hematol. 63:81–89. 2007. View Article : Google Scholar
|
|
4
|
Dolecek TA, Propp JM, Stroup NE and
Kruchko C: CBTRUS statistical report: primary brain and central
nervous system tumors diagnosed in the United States in 2005–2009.
Neuro Oncol. 14(Suppl 5): v1–v49. 2012.PubMed/NCBI
|
|
5
|
Sant M, Minicozzi P, Lagorio S, Borge
Johannesen T, Marcos-Gragera R and Francisci S: Survival of
European patients with central nervous system tumors. Int J Cancer.
131:173–185. 2012. View Article : Google Scholar : PubMed/NCBI
|
|
6
|
Gilbert MR, Ruda R and Soffietti R:
Ependymomas in adults. Curr Neurol Neurosci Rep. 10:240–247. 2010.
View Article : Google Scholar
|
|
7
|
Surawicz TS, McCarthy BJ, Kupelian V,
Jukich PJ, Bruner JM and Davis FG: Descriptive epidemiology of
primary brain and CNS tumors: results from the Central Brain Tumor
Registry of the United States 1990–1994. Neuro Oncol. 1:14–25.
1999.PubMed/NCBI
|
|
8
|
Chamberlain MC: Ependymomas. Curr Neurol
Neurosci Rep. 3:193–199. 2003. View Article : Google Scholar
|
|
9
|
Zacharoulis S and Moreno L: Ependymoma: an
update. J Child Neurol. 24:1431–1438. 2009. View Article : Google Scholar : PubMed/NCBI
|
|
10
|
Ruda R, Gilbert M and Soffietti R:
Ependymomas of the adult: molecular biology and treatment. Curr
Opin Neurol. 21:754–761. 2008. View Article : Google Scholar
|
|
11
|
Crocetti E, Trama A, Stiller C, et al:
Epidemiology of glial and non-glial brain tumours in Europe. Eur J
Cancer. 48:1532–1542. 2012. View Article : Google Scholar : PubMed/NCBI
|
|
12
|
Barnholtz-Sloan JS, Sloan AE and Schwartz
AG: Relative survival rates and patterns of diagnosis analyzed by
time period for individuals with primary malignant brain tumor,
1973–1997. J Neurosurg. 99:458–466. 2003.PubMed/NCBI
|
|
13
|
Rodriguez D, Cheung MC, Housri N,
Quinones-Hinojosa A, Camphausen K and Koniaris LG: Outcomes of
malignant CNS ependymomas: an examination of 2408 cases through the
Surveillance, Epidemiology, and End Results (SEER) database
1973–2005. J Surg Res. 156:340–351. 2009.PubMed/NCBI
|
|
14
|
Villano JL, Parker CK and Dolecek TA:
Descriptive epidemiology of ependymal tumours in the United States.
Br J Cancer. 108:2367–2371. 2013. View Article : Google Scholar : PubMed/NCBI
|
|
15
|
Yang I, Nagasawa DT, Kim W, Spasic M,
Trang A, Lu DC and Martin NA: Chromosomal anomalies and prognostic
markers for intracranial and spinal ependymomas. J Clin Neurosci.
19:779–785. 2012. View Article : Google Scholar : PubMed/NCBI
|
|
16
|
Metellus P, Guyotat J, Chinot O, et al:
Adult intracranial WHO grade II ependymomas: long-term outcome and
prognostic factor analysis in a series of 114 patients. Neuro
Oncol. 12:976–984. 2010. View Article : Google Scholar : PubMed/NCBI
|
|
17
|
Korshunov A, Golanov A, Sycheva R and
Timirgaz V: The histologic grade is a main prognostic factor for
patients with intracranial ependymomas treated in the
microneurosurgical era: an analysis of 258 patients. Cancer.
100:1230–1237. 2004. View Article : Google Scholar : PubMed/NCBI
|
|
18
|
Reni M, Brandes AA, Vavassori V, et al: A
multicenter study of the prognosis and treatment of adult brain
ependymal tumors. Cancer. 100:1221–1229. 2004. View Article : Google Scholar : PubMed/NCBI
|
|
19
|
Metellus P, Barrie M, Figarella-Branger D,
et al: Multicentric French study on adult intracranial ependymomas:
prognostic factors analysis and therapeutic considerations from a
cohort of 152 patients. Brain. 130:1338–1349. 2007. View Article : Google Scholar
|
|
20
|
Godfraind C: Classification and
controversies in pathology of ependymomas. Childs Nerv Syst.
25:1185–1193. 2009. View Article : Google Scholar : PubMed/NCBI
|
|
21
|
Massimino M, Buttarelli FR, Antonelli M,
Gandola L, Modena P and Giangaspero F: Intracranial ependymoma:
factors affecting outcome. Future Oncol. 5:207–216. 2009.
View Article : Google Scholar : PubMed/NCBI
|
|
22
|
Andreiuolo F, Ferreira C, Puget S and
Grill J: Current and evolving knowledge of prognostic factors for
pediatric ependymomas. Future Oncol. 9:183–191. 2013. View Article : Google Scholar : PubMed/NCBI
|
|
23
|
Kilday JP, Rahman R, Dyer S, Ridley L,
Lowe J, Coyle B and Grundy R: Pediatric ependymoma: biological
perspectives. Mol Cancer Res. 7:765–786. 2009. View Article : Google Scholar : PubMed/NCBI
|
|
24
|
Mitelman F, Johansson B and Mertens F:
Mitelman Database of Chromosome Aberrations and Gene Fusions in
Cancer. Available at: http://cgap.nci.nih.gov/Chromosomes/Mitelman.
Accessed May 13, 2013
|
|
25
|
Mazewski C, Soukup S, Ballard E, Gotwals B
and Lampkin B: Karyotype studies in 18 ependymomas with literature
review of 107 cases. Cancer Genet Cytogenet. 113:1–8. 1999.
View Article : Google Scholar : PubMed/NCBI
|
|
26
|
Heim S and Mitelman F: Cancer
Cytogenetics. 3rd edition. John Wiley & Sons; Hoboken, NJ:
2009
|
|
27
|
Mack SC and Taylor MD: The genetic and
epigenetic basis of ependymoma. Childs Nerv Syst. 25:1195–1201.
2009. View Article : Google Scholar : PubMed/NCBI
|
|
28
|
Mandahl N: Methods in solid tumor
cytogenetics. Human Cytogenetics - Malignancy and Acquired
Abnormalities. 3rd edition. Rooney DE: Oxford University Press;
Oxford; pp. 165–203. 2001
|
|
29
|
Shaffer LG, Slovak ML and Campbell LJ:
ISCN: An International System for Human Cytogenetic Nomenclature.
Karger; Basel: 2009
|
|
30
|
Kallioniemi OP, Kallioniemi A, Piper J,
Isola J, Waldman FM, Gray JW and Pinkel D: Optimizing comparative
genomic hybridization for analysis of DNA sequence copy number
changes in solid tumors. Genes Chromosomes Cancer. 10:231–243.
1994. View Article : Google Scholar : PubMed/NCBI
|
|
31
|
Kirchhoff M, Gerdes T, Maahr J, Rose H,
Bentz M, Dohner H and Lundsteen C: Deletions below 10 megabasepairs
are detected in comparative genomic hybridization by standard
reference intervals. Genes Chromosomes Cancer. 25:410–413. 1999.
View Article : Google Scholar : PubMed/NCBI
|
|
32
|
Kirchhoff M, Gerdes T, Rose H, Maahr J,
Ottesen AM and Lundsteen C: Detection of chromosomal gains and
losses in comparative genomic hybridization analysis based on
standard reference intervals. Cytometry. 31:163–173. 1998.
View Article : Google Scholar : PubMed/NCBI
|
|
33
|
Kraggerud SM, Szymanska J, Abeler VM, et
al: DNA copy number changes in malignant ovarian germ cell tumors.
Cancer Res. 60:3025–3030. 2000.PubMed/NCBI
|
|
34
|
Ribeiro FR, Jeronimo C, Henrique R,
Fonseca D, Oliveira J, Lothe RA and Teixeira MR: 8q gain is an
independent predictor of poor survival in diagnostic needle
biopsies from prostate cancer suspects. Clin Cancer Res.
12:3961–3970. 2006. View Article : Google Scholar : PubMed/NCBI
|
|
35
|
Dahlback HS, Brandal P, Krossnes BK, et
al: Multiple chromosomal monosomies are characteristic of giant
cell ependymoma. Hum Pathol. 42:2042–2046. 2011. View Article : Google Scholar : PubMed/NCBI
|
|
36
|
Hirose Y, Aldape K, Bollen A, et al:
Chromosomal abnormalities subdivide ependymal tumors into
clinically relevant groups. Am J Pathol. 158:1137–1143. 2001.
View Article : Google Scholar : PubMed/NCBI
|
|
37
|
Huang B, Starostik P, Schraut H, Krauss J,
Sorensen N and Roggendorf W: Human ependymomas reveal frequent
deletions on chromosomes 6 and 9. Acta Neuropathol. 106:357–362.
2003. View Article : Google Scholar : PubMed/NCBI
|
|
38
|
Korshunov A, Witt H, Hielscher T, et al:
Molecular staging of intracranial ependymoma in children and
adults. J Clin Oncol. 28:3182–3190. 2010. View Article : Google Scholar : PubMed/NCBI
|
|
39
|
Reardon DA, Entrekin RE, Sublett J, et al:
Chromosome arm 6q loss is the most common recurrent autosomal
alteration detected in primary pediatric ependymoma. Genes
Chromosomes Cancer. 24:230–237. 1999. View Article : Google Scholar : PubMed/NCBI
|
|
40
|
Zeller C, Hinzmann B, Seitz S, et al:
SASH1: a candidate tumor suppressor gene on chromosome 6q24.3 is
downregulated in breast cancer. Oncogene. 22:2972–2983. 2003.
View Article : Google Scholar : PubMed/NCBI
|
|
41
|
Rimkus C, Martini M, Friederichs J, et al:
Prognostic significance of downregulated expression of the
candidate tumour suppressor gene SASH1 in colon cancer. Br J
Cancer. 95:1419–1423. 2006. View Article : Google Scholar : PubMed/NCBI
|
|
42
|
Suarez-Merino B, Hubank M, Revesz T, et
al: Microarray analysis of pediatric ependymoma identifies a
cluster of 112 candidate genes including four transcripts at
22q12.1–q13.3. Neuro Oncol. 7:20–31. 2005.PubMed/NCBI
|
|
43
|
Korshunov A, Neben K, Wrobel G, et al:
Gene expression patterns in ependymomas correlate with tumor
location, grade, and patient age. Am J Pathol. 163:1721–1727. 2003.
View Article : Google Scholar : PubMed/NCBI
|
|
44
|
COSMIC: Catalogue of somatic mutations in
cancer - Cancer gene census. Available at: http://cancer.sanger.ac.uk/cancergenome/projects/census/.
Accessed August 20, 2013
|
|
45
|
Monoranu CM, Huang B, Zangen IL, et al:
Correlation between 6q25.3 deletion status and survival in
pediatric intracranial ependymomas. Cancer Genet Cytogenet.
182:18–26. 2008. View Article : Google Scholar : PubMed/NCBI
|
|
46
|
Rajaram V, Gutmann DH, Prasad SK, Mansur
DB and Perry A: Alterations of protein 4.1 family members in
ependymomas: a study of 84 cases. Mod Pathol. 18:991–997. 2005.
View Article : Google Scholar : PubMed/NCBI
|
|
47
|
Witt H, Korshunov A, Pfister SM and Milde
T: Molecular approaches to ependymoma: the next step(s). Curr Opin
Neurol. 25:745–750. 2012. View Article : Google Scholar : PubMed/NCBI
|
|
48
|
Puget S, Grill J, Valent A, et al:
Candidate genes on chromosome 9q33–34 involved in the progression
of childhood ependymomas. J Clin Oncol. 27:1884–1892. 2009.
|
|
49
|
Dahlback HS, Brandal P, Meling TR,
Gorunova L, Scheie D and Heim S: Genomic aberrations in 80 cases of
primary glioblastoma multiforme: Pathogenetic heterogeneity and
putative cytogenetic pathways. Genes Chromosomes Cancer.
48:908–924. 2009. View Article : Google Scholar
|