Introduction
Glypican-3 (GPC3), a member of the glypican family
of heparan sulfate proteoglycans (HSPGs) which are attached to the
cell surface by a glycosylphosphatidylinositol (GPI) anchor
(1), is specifically expressed in
ovarian clear cell carcinoma (OCCC) (2,3),
hepatocellular carcinoma (HCC) (4,5), lung
cancer (6) and melanoma (7). GPC3 is responsible for the
Simpson-Golabi-Behmel syndrome (SGBS) via the Hedgehog signaling
pathway (8). GPC3 is identified to
be a tumor-associated antigen and stimulates the growth of HCC
cells by increasing autocrine/paracrine canonical Wnt signaling
(9). In ovarian and lung cancer,
GPC3 inhibits the growth of cancer cells by adding
5-aza-2′-deoxycytidine to restore GPC3 expression in cancer cells
(11,12). GPC3 is considered as a candidate
target for immunotherapy of OCCC and HCC (13–16).
Clinical trials of GPC3-based immunotherapy for HCC are currently
being conducted (17,18).
GPC3 is an HSPG. Hence, it is considered to
participate in inflammatory response in tumor tissue. Heparan
sulfate in syndecans binds to chemokines and cytokines through
positively charged domains and thus regulates the activity of
chemokines through formation of chemokine gradient (19–23).
The interactions modulate inflammatory responses. Cell surface
HSPGs also influence MHC class II-restricted antigen presentation
(24). GPC3 expression in HCC
causes macrophage increase and it is involved in the recruitment of
M2 macrophages (25,26). However, it remains elusive in
ovarian cancer. Macrophages, a highly heterogeneous cell
population, adapt and respond to various microenvironmental signals
(27). M1 macrophages phenotypic
definition in mouse is
iNOS+IL-12+CD86+MHC-IIhigh
(28). The M1 macrophages process
tumor antigens and present them to lymphocytes. Consequently, T
lymphocytes become activated, proliferate, and infiltrate the tumor
(29). The M2 macrophages are
phenotypically defined as
CD206+CD163+CD36+ARG1+MHC-IIlow
IL-10+IL-4Ra+FIZZ1+YM1+
(28) and can stimulate tumor
growth (30); macrophage
polarization plays an important role in the tumor growth
process.
GPC3 is demonstrated to induce T cell-mediated
immune response in HCC (16,31);
however, it is unclear in GPC3 expressing ovarian cancer.
Therefore, we used mouse GPC3, which shares 95% amino acid sequence
identity with human GPC3, established a GPC3 transgenic mouse
ovarian cancer cell line, OV2944-HM-1 (HM-1), and used the
intraperitoneal ovarian cancer mouse model to analyze immune
response in GPC3-expressing mouse ovarian cancer.
Materials and methods
Cell line, construction of plasmid,
transfection and reagents
The mouse ovarian cancer cell line HM-1 consisting
of murine ovarian cancer cells of B6C3F1 origin was provided by
Professor Ikuo Konishi (Department of Gynecology and Obstetrics,
Kyoto University Graduate School of Medicine, Japan). The cells
were cultured in minimum essential medium-α (Sigma-Aldrich, Irvine,
UK) supplemented with 10% fetal calf serum (FCS; Gibco®
Life Technologies, Grand Island, NY, USA) in a humidified
atmosphere of 5% CO2 at 37°C. The GPC3-overexpressing
HM-1 cells were derived from the HM-1 cell line by stable
transfection of a GPC3-containing pcAGGS-IRES-puro vector. The
vector and an empty vector were kindly provided by Dr T. Nakatsura
(National Cancer Center Hospital East, Chiba, Japan). The vectors
were used to transfect HM-1 cells using Lipofectamine (Invitrogen).
Clonal selection was performed in a 7 μg/ml puromycin
(Sigma-Aldrich, St. Louis, MO, USA)-containing medium. Selected
colonies were assayed using western blotting; a puromycin-resistant
colony transfected with the empty vector was used as a control.
Anti-GPC3 antibody (cat. no. ab66596) was purchased from Abcam Ltd.
(Cambridge, UK). Anti-GAPDH (14C10; cat. no. 2118) was purchased
from Cell Signaling Technology Inc. (Beverly, MA, USA). Anti-mouse
F4/80 labeled with fluorescein isothiocyanate (FITC; cat. no.
122606) or red-algae phycoerythrin (PE; cat. no. 123109), Alexa
Fluor 647-labeled anti-mouse CD86 (cat. no. 105019),
allophycocyanin (APC)-labeled CD206 (cat. no. 141707), PE-(cat. no.
123109)-labeled anti-mouse interferon-γ (IFN-γ; cat. no. 506507),
and FITC-labeled anti-mouse CD8a antibodies (cat. no. 100803) were
purchased from BioLegend (San Diego, CA, USA).
Animals
Six-week-old female B6C3F1 mice were obtained from
SLC (Hamamatsu, Japan) and kept in appropriate facilities at the
Bell Research Center for Reproductive Health and Cancer. The mice
were kept under a 12/12-h light/dark regime in standard cages and
handled according to the guidelines of the Institute, with the
approval of the Local Animal Care Ethics Committee. The mice were
anesthetized by subcutaneous injection of 7.5% chloral hydrate
(Wako, Japan).
In vivo tumorigenicity
Female B6C3F1 mice were used for the assessment of
tumor formation. The control and GPC3-expressing HM-1 cells were
injected intraperitoneally (1×10⁶ cells in 0.1 ml PBS).
The mice were examined each day for tumor ascite accumulation or
followed up for mouse survival rates. Approximately 1 week after
inoculation with the cancer cells, visible ascites were detected by
abdominal swelling and the mice were sacrificed. The peritoneal
cavity was opened. Ascitic fluids were collected using a 1-ml
syringe.
Western blot analysis
The control and GPC3-expressing HM-1 cells were
cultured in 35-mm dishes overnight. The cells were washed three
times with PBS and solubilized in 200 μl RIPA buffer [50 mM
Tris-HCl (pH 7.4), 150 mM EDTA, 1% Triton, 1% sodium deoxycholate,
and 0.1% SDS]. Western blotting was performed using standard
protocols with antibodies against GPC3 and GAPDH.
Preparation of peritoneal macrophages and
isolation of cells from tumor tissues
Mouse peritoneal wash or cancer ascetic fluid was
collected and centrifuged. The collected cells were stained for
FACS. The peritoneal macrophages were used for the co-culture assay
and in vitro phagocytic assay. To obtain tumor-infiltrating
lymphocytes, tumors were excised and minced on ice. Then, RPMI-1640
containing 20% FCS and 200 U/ml of collagenase from Clostridium
histolyticum (Worthington Biochemical Corporation, Lakewood,
NJ, USA) was added, and suspensions of tumor were incubated for 2 h
at 37°C. The suspensions were passed through a sterile 100-μm BD
Falcon™nylon mesh (BD Biosciences Labware, Bedford, MA, USA) for
debris removal. The cells were treated with 1× BD Pharm Lyse™ (BD
Biosciences, San Jose, CA, USA) lysis buffer at room temperature
for 5 min and then washed two times with RPMI-1640 (PAA
Laboratories GmbH, Pashing, Austria). The cells were stained as
described below.
Isolation of lymph node and spleen
cells
Lymph node cells were obtained from inguinal lymph
nodes. The collected lymph nodes or spleens were crushed through a
40-mm nylon cell strainer (BD Biosciences Labware, Bedford, MA,
USA). Erythrocytes were depleted using the 1× BD Pharm Lyse™ lysis
buffer, and the cells were suspended in 10% FCS-containing
RPMI-1640 for the antigen stimulation test or stained directly for
FACS analysis.
Immunofluorescence staining and flow
cytometry (FCM)
Cells (5×10⁵) were washed with PBS
containing 1% bovine serum albumin (BSA; Wako, Japan) and stained
with one or two labeled antibodies. Nonspecific FcR binding was
blocked by rat serum. At least 10,000 cells were assayed by FCM
using BD FACSAria II (BD Biosciences, San Jose, CA, USA) and the
data were analyzed using the FlowJo data analysis software package
(TreeStar, Ashland, OR, USA). Nonviable cells were visualized by
adding 0.5 μl of 7-AAD Viability Staining Solution (BD
Biosciences).
Cell proliferation assay
A water-soluble tetrazolium (WST-8) (Kishida
Chemical Co., Ltd., Osaka, Japan)-based colorimetric proliferation
assay was performed according to the manufacturer’s instructions.
Cells (5×10⁴ cells/well) were plated on 24-well plates.
Replication assays were performed at 4, 24, 48, and 72 h.
Co-culture assay
Peritoneal macrophages (1×10⁶) were
seeded in a 35-mm dish, and a Transwell insert (0.4-μm pore; Nunc)
containing 5×10⁵ cancer cells was inserted into the
dish. The cells were incubated at 37°C and the macrophages were
harvested on the indicated days for CD86 analysis by FACS.
In vitro phagocytic assay
Fluorescent labeling of cells with green fluorescent
dye carboxyfluorescein diacetate succinimidyl ester (CFSE) was
performed according to the manufacturer’s protocol. CFSE-labeled
HM-1 or HM-1GPC3 (1×10⁶) cells were incubated with
peritoneal macrophages (5×10⁶); the cells were harvested
on day 3 and stained with anti-mouse F4/80-APC prior to flow
cytometric analysis.
Immunofluorescence staining of tumor
tissues and inguinal lymph nodes
Mouse intraperitoneal tumors were excised. Frozen
sections were fixed with cold acetone for 15 min, blocked with 5%
rat serum in PBS, reacted with FITC-labeled anti-mouse F4/80
antibody at 37°C for 30 min. The sections were then washed three
times with PBS, incubated with Hoechst 3358 (Invitrogen, Eugene,
OR, USA), and mounted with FluoroShield (ImmunoBioScience,
Mukilteo, WA, USA). Finally, the slides were examined using an
Olympus Fluoview FV1000-D laser-scanning confocal microscope
(Olympus Co., Tokyo, Japan).
Splenocyte stimulation assay
Mouse splenocytes were isolated on day 7 after
intraperitoneal injection of cancer cells (1×10⁶ cells).
The splenocytes (5×10⁶ cells) were incubated at 37°C for
2 h and stimulated with freeze-thawed HM-1GPC3#1 lysate overnight
in the presence of 1× monensin solution (cat. no. 420701;
BioLegend). The stimulated splenocytes were harvested, fixed in 2%
paraformaldehyde for 10 min at room temperature, washed with 1 ml
of 5% BSA in PBS containing 0.5% saponin (Saponin buffer; Wako
Chemicals Inc., Richmond VA, USA) and stained with anti-mouse
PE-labeled IFN-γ, APC-labeled CD3, and FITC-labeled CD8a in saponin
buffer on ice for 30 min. The cells were analyzed using a flow
cytometer after washing with PBS containing 1% BSA. The same
experiment was performed as described without adding monensin and
then the cultured medium was collected for IFN-γ determination with
ELISA kit.
Cytokine detection
To detect tumor necrotic factor-α (TNF-α),
interleukin-12 (IL-12), or IFN-γ levels in ascitic fluids or
medium, ELISA kits were used according to the manufacturer’s
instructions (BioLegend).
TUNEL and immunohistochemical
staining
Frozen sections were fixed in 4% PFA for 10 min.
After washing in PBS, the sections were digested in proteinase K
(40 mg/ml; Sigma Chemical, St Louis, MO, USA) for 15 min. Cell
death was assessed using the ApopTag® Peroxidase In Situ
Apoptosis Detection Kit (Millipore Corporation, Billerica, MA,
USA), according to the manufacturer’s recommendations. In brief,
the slides were incubated in a humidified chamber for 1 h at 37°C
with a reaction mixture containing TdT and biotinylated
deoxyuridine triphosphate to label the exposed 3′-hydroxyl ends of
nicked single-strand DNA. The antibody complexes were detected
using the ABC streptavidin-horseradish peroxidase Kit and developed
using DAB (Vector Laboratories Inc., Burlingame, CA, USA).
Statistical analysis
The significance of changes in cell replication,
cytokine secretion, and macrophage percentages on individual days
was determined using Student’s t-test. Cell proliferation was
analyzed by one-way ANOVA. Survival rates were estimated by the
Kaplan-Meier method, and significance was determined by the
log-rank test. Cell replication O.D., cytokine concentrations in
wash solutions and ascitic fluids, and
CD86+/F4/80+ macrophage percentages are
expressed as means ± SD. Statistical analysis was performed using
SPSS 1.1J Software® (SPSS Inc., Chicago, IL, USA).
Differences with P<0.05 were considered statistically
significant.
Results
GPC3 expression increases macrophage
recruitment into tumor masses
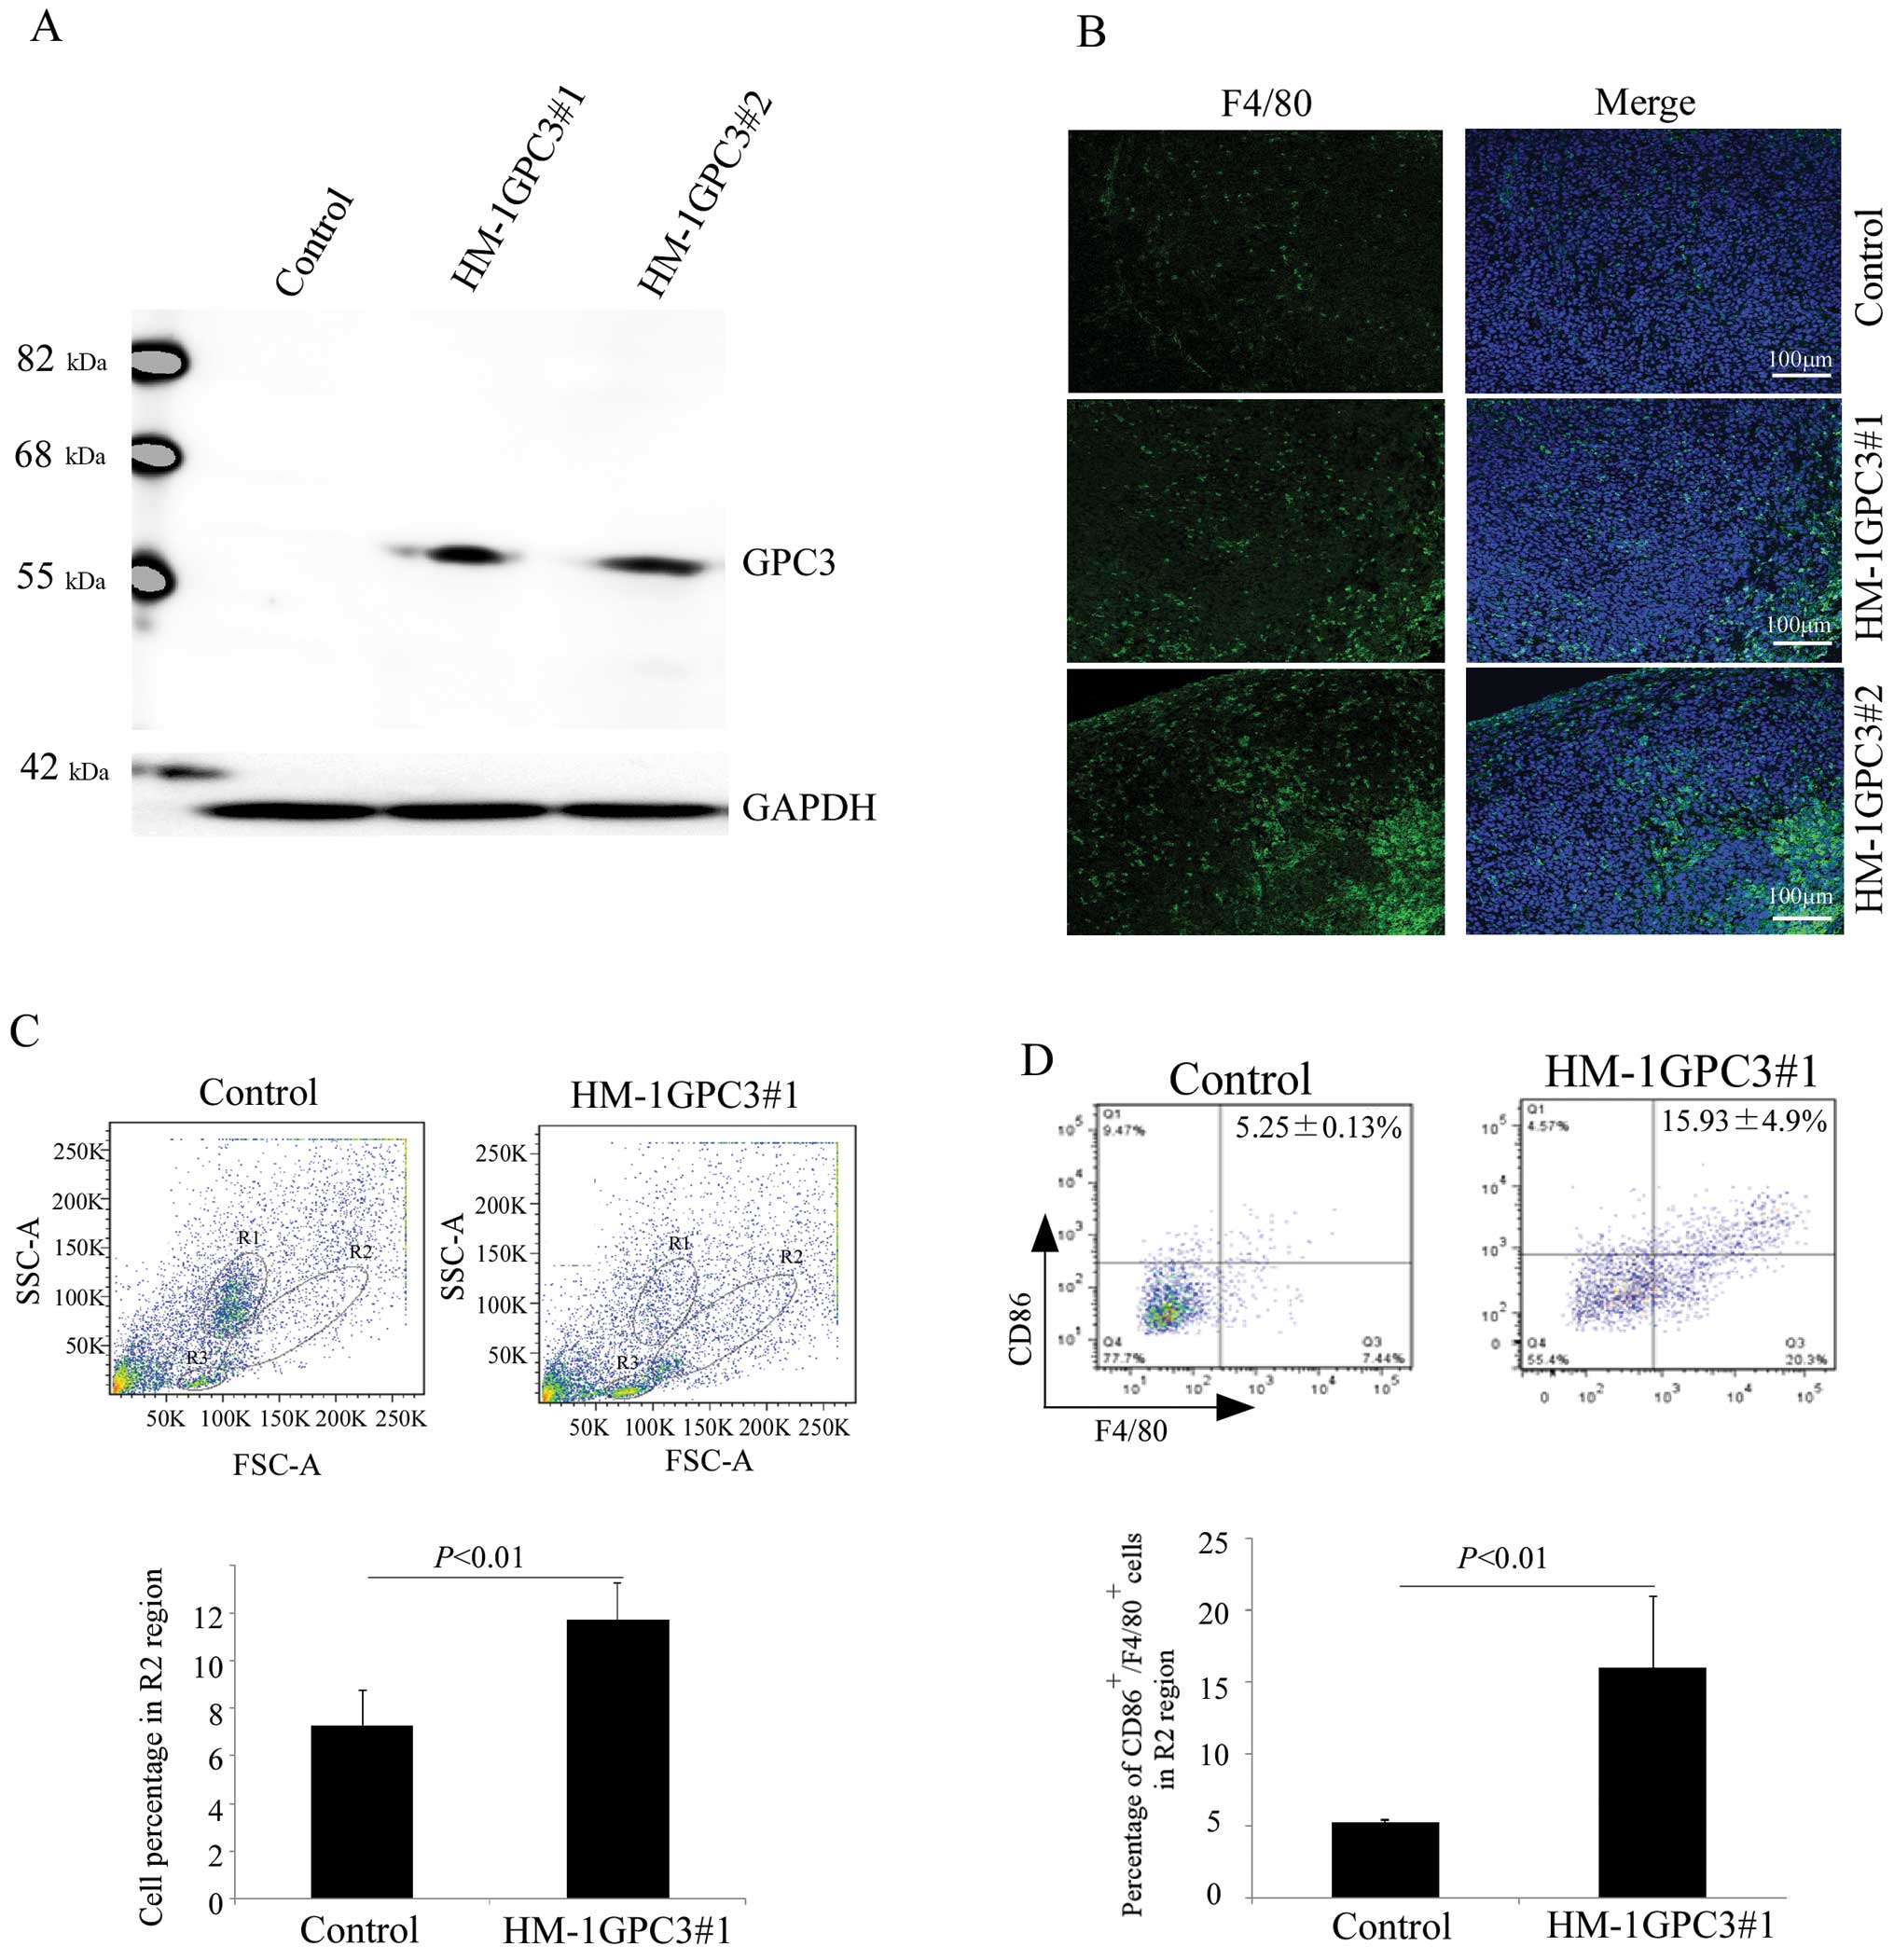
We established a GPC3 transgenic HM-1 cell line as
described in the Materials and methods section. We confirmed GPC3
expression in two colonies (HM-1GPC3#1 and HM-1GPC3#2) using
western blotting with an anti-GPC3 antibody (Fig. 1A). Therefore, we used the
intraperitoneal GPC3-expressing ovarian cancer mouse model to
examine macrophage distribution in tumor with a mouse F4/80
monoclonal antibody. HM-1GPC3#1 and HM-1GPC3#2 tumors had higher
F4/80-positive cells compared with control tumors (Fig. 1B). Moreover, macrophages were
examined by FCM on day 8 after cancer cell inoculation (Fig. 1C). Upon tumor dissociation, since
leukocytes can be distinguished from malignant cells on the basis
of their size and morphology using FACS analysis (FSC-A) (SSC-A),
we identified regions of lymphocytes (R3), monocytes and
macrophages (R2), and granulocytes (R1) (Fig. 1C, top). Results indicated that GPC3
expression induced an 11.7% increase in macrophage and monocyte
recruitment compared with the control (~7.3%) regarding the total
of number of cells collected from dissociated tumors (Fig. 1C, bottom graph). In this study, we
used CD86 and F4/80 as markers for identifying M1 macrophages in
the R2 region. The percentage of infiltrating
CD86+/F4/80+ cells in the GPC3-expressing
tumor was approximately 15.93% in the region of monocytes and
macrophages (Fig. 1D), whereas it
was only 5% in the control tumors. Fig.
1D (bottom graph) presents the percentage of
CD86+/F4/80+ cells, and results indicated a
significant difference (*P<0.05). Data were obtained
from three independent experiments.
GPC3 expression increases the number of
CD86+/F4/80+ macrophages in ascitic fluids
and enhances the secretion of IL-12 and TNF-α cytokines
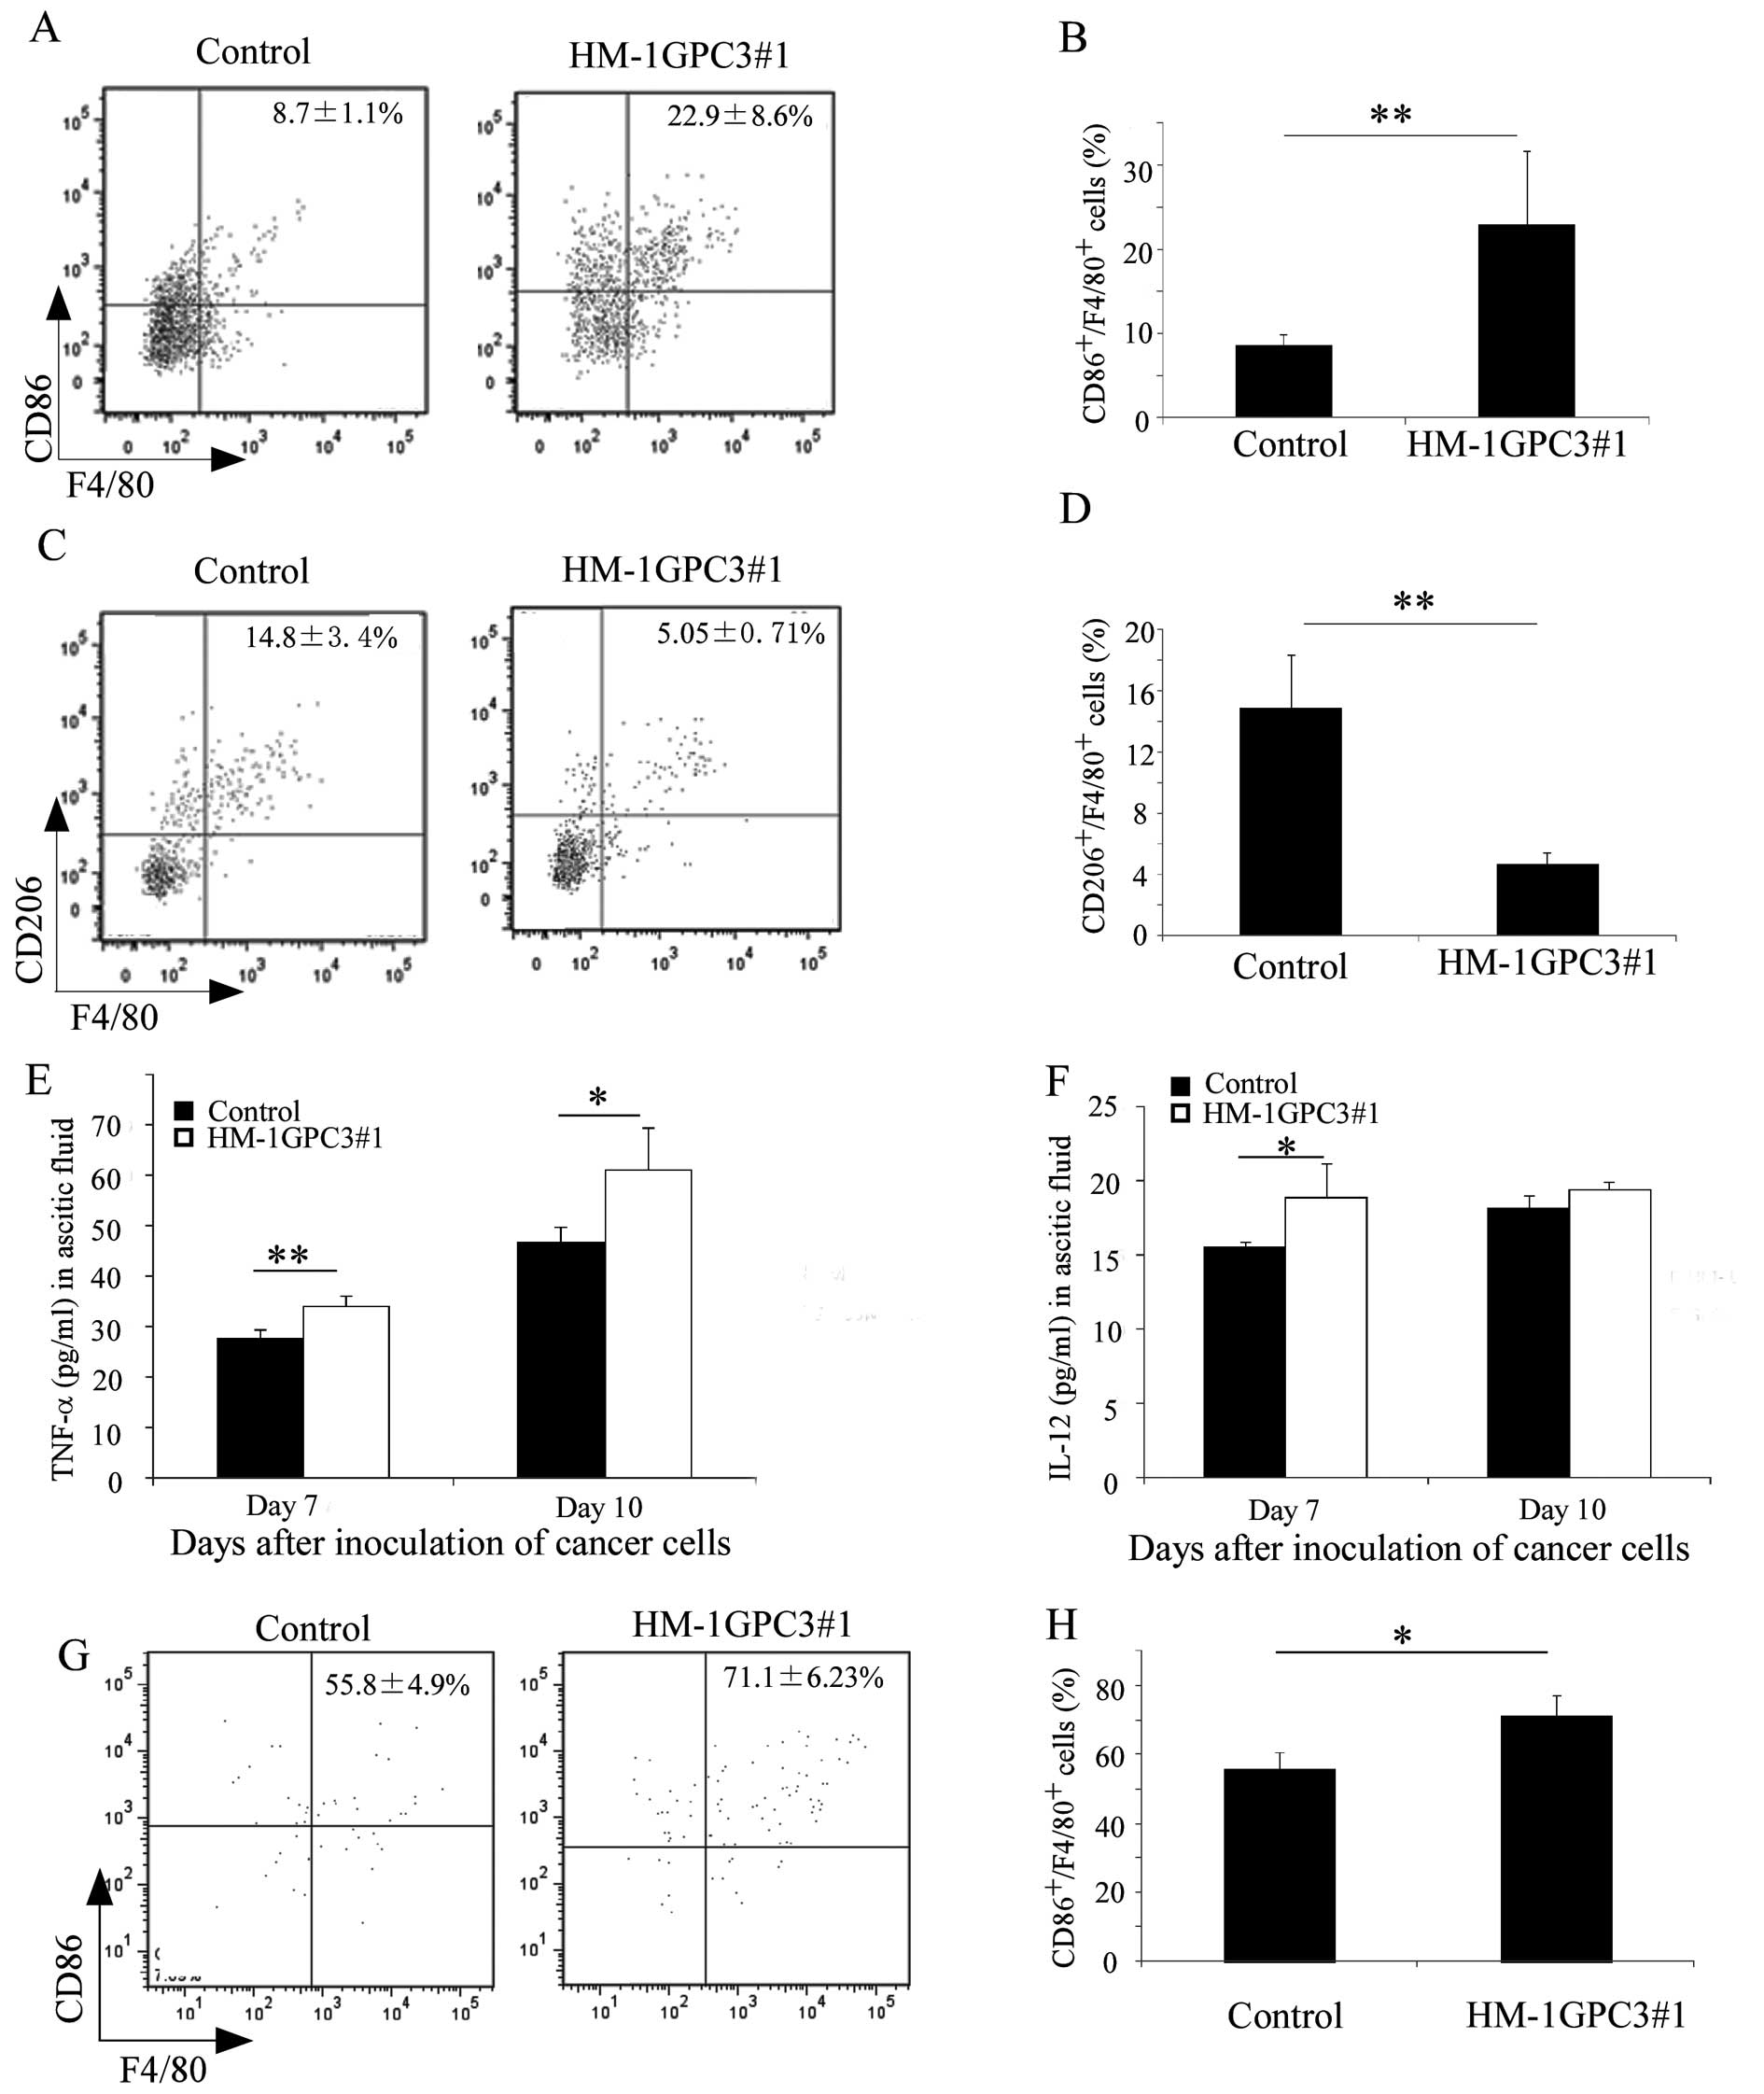
We collected peritoneal washes or ascitic fluids on
days 3, 7 and 10 after inoculation with cancer cells for the
determination of TNF-α and IL-12 cytokines, which are secreted by
M1 macrophages, and for the analysis of macrophage properties. Our
data revealed CD86+/F4/80+ (M1) and
CD206+/F4/80+ (M2) cells in peritoneal washes
and ascitic fluids 3 and 7 days after inoculation with cancer
cells. On day 3 after inoculation, the
CD86+/F4/80+ cells amounted to 22.9% of the
total cell number in the regions of monocytes and macrophages in
the GPC3-expressing group. However, the
CD86+/F4/80+ cells constituted only 8.7% in
similar regions in the control group (Fig. 2A and B). On day 7 after the
inoculation with cancer cells, no significant difference was
observed in the percentage of CD86+/F4/80+
cells (P>0.05) between the GPC3-expressing and control groups
(data not shown). The percentage of
CD206+/F4/80+ cells was 5.05% in the
GPC3-expressing group and 14.7% in the control group on day 3 after
inoculation with cancer cells (Fig. 2C
and D). We also determined that the secretion levels of TNF-α
(Fig. 2E) and IL-12 (Fig. 2F) were significantly higher in the
ascitic fluids of the GPC3-expressing HM-1 cell-infected mice than
in the control HM-1 cell-injected mice on day 7 after inoculation
with cancer cells. However, there was no significant difference in
the secretion levels of IL-12 on day 10 after inoculation with
cancer cells. We also examined the percentage of
CD86+/F4/80+ cells in inguinal lymph nodes on
day 4 after inoculation with cancer cells. Our results indicate
that the CD86+/F4/80+ cells were
significantly more abundant in the lymph nodes of the
GPC3-expressing group than in the control group (Fig. 2G and H). The percentage of
CD86+/F4/80+ cells in inguinal lymph nodes
was 71.1% in the GPC3-expressing group and 55.8% in the control
group.
GPC3 expression increases CD86 expression
in peritoneal macrophages and increases HM-1 cell susceptibility to
phagocytosis by mouse peritoneal macrophages in vitro
An increased number of CD86+ macrophages
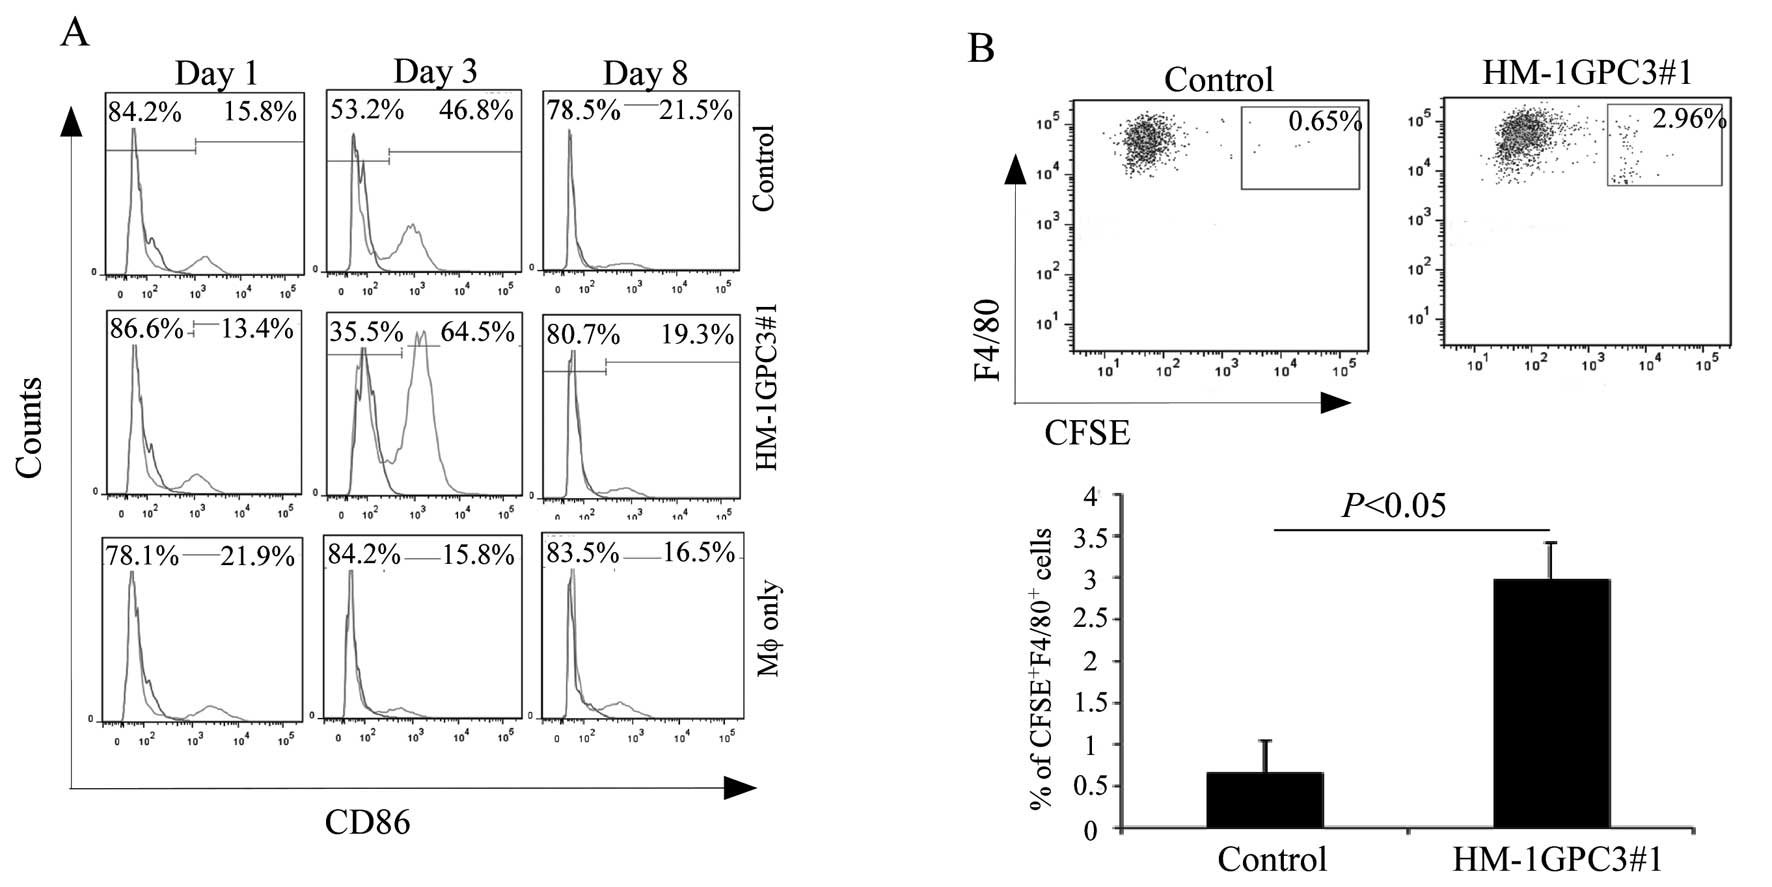
were present in the GPC3-expressing tumor. Therefore, we
investigated the effect of GPC3 on CD86 expression in vitro.
The collected mouse peritoneal macrophages were co-cultured with
the control HM-1 cells and GPC3-expressing HM-1 cells in Transwell
inserts without direct cell-cell contact. We collected co-cultured
macrophages for CD86 expression analysis by FCM. The results showed
that, on day 3 of co-culture, GPC3 expression increased the
proportion of CD86-expressing peritoneal macrophages to
approximately 64.5%. Co-culture with the control HM-1 cells induced
the number of CD86-expressing macrophages to approximately 45%. No
changes were observed in macrophage-only cultures (Fig. 3A). Moreover, to determine whether
expression of mouse GPC3 on HM-1 cells facilitated phagocytosis by
mouse peritoneal macrophages, we performed in vitro
phagocytic assay. Mouse peritoneal macrophages were markedly more
effective in engulfing HM-1GPC3#1 cells than in engulfing the
control HM-1 cells (Fig. 3B).
GPC3 expression increases CD8+
T cell infiltration, cellular immune induction and the number of
apoptotic cancer cells in the tumor mass
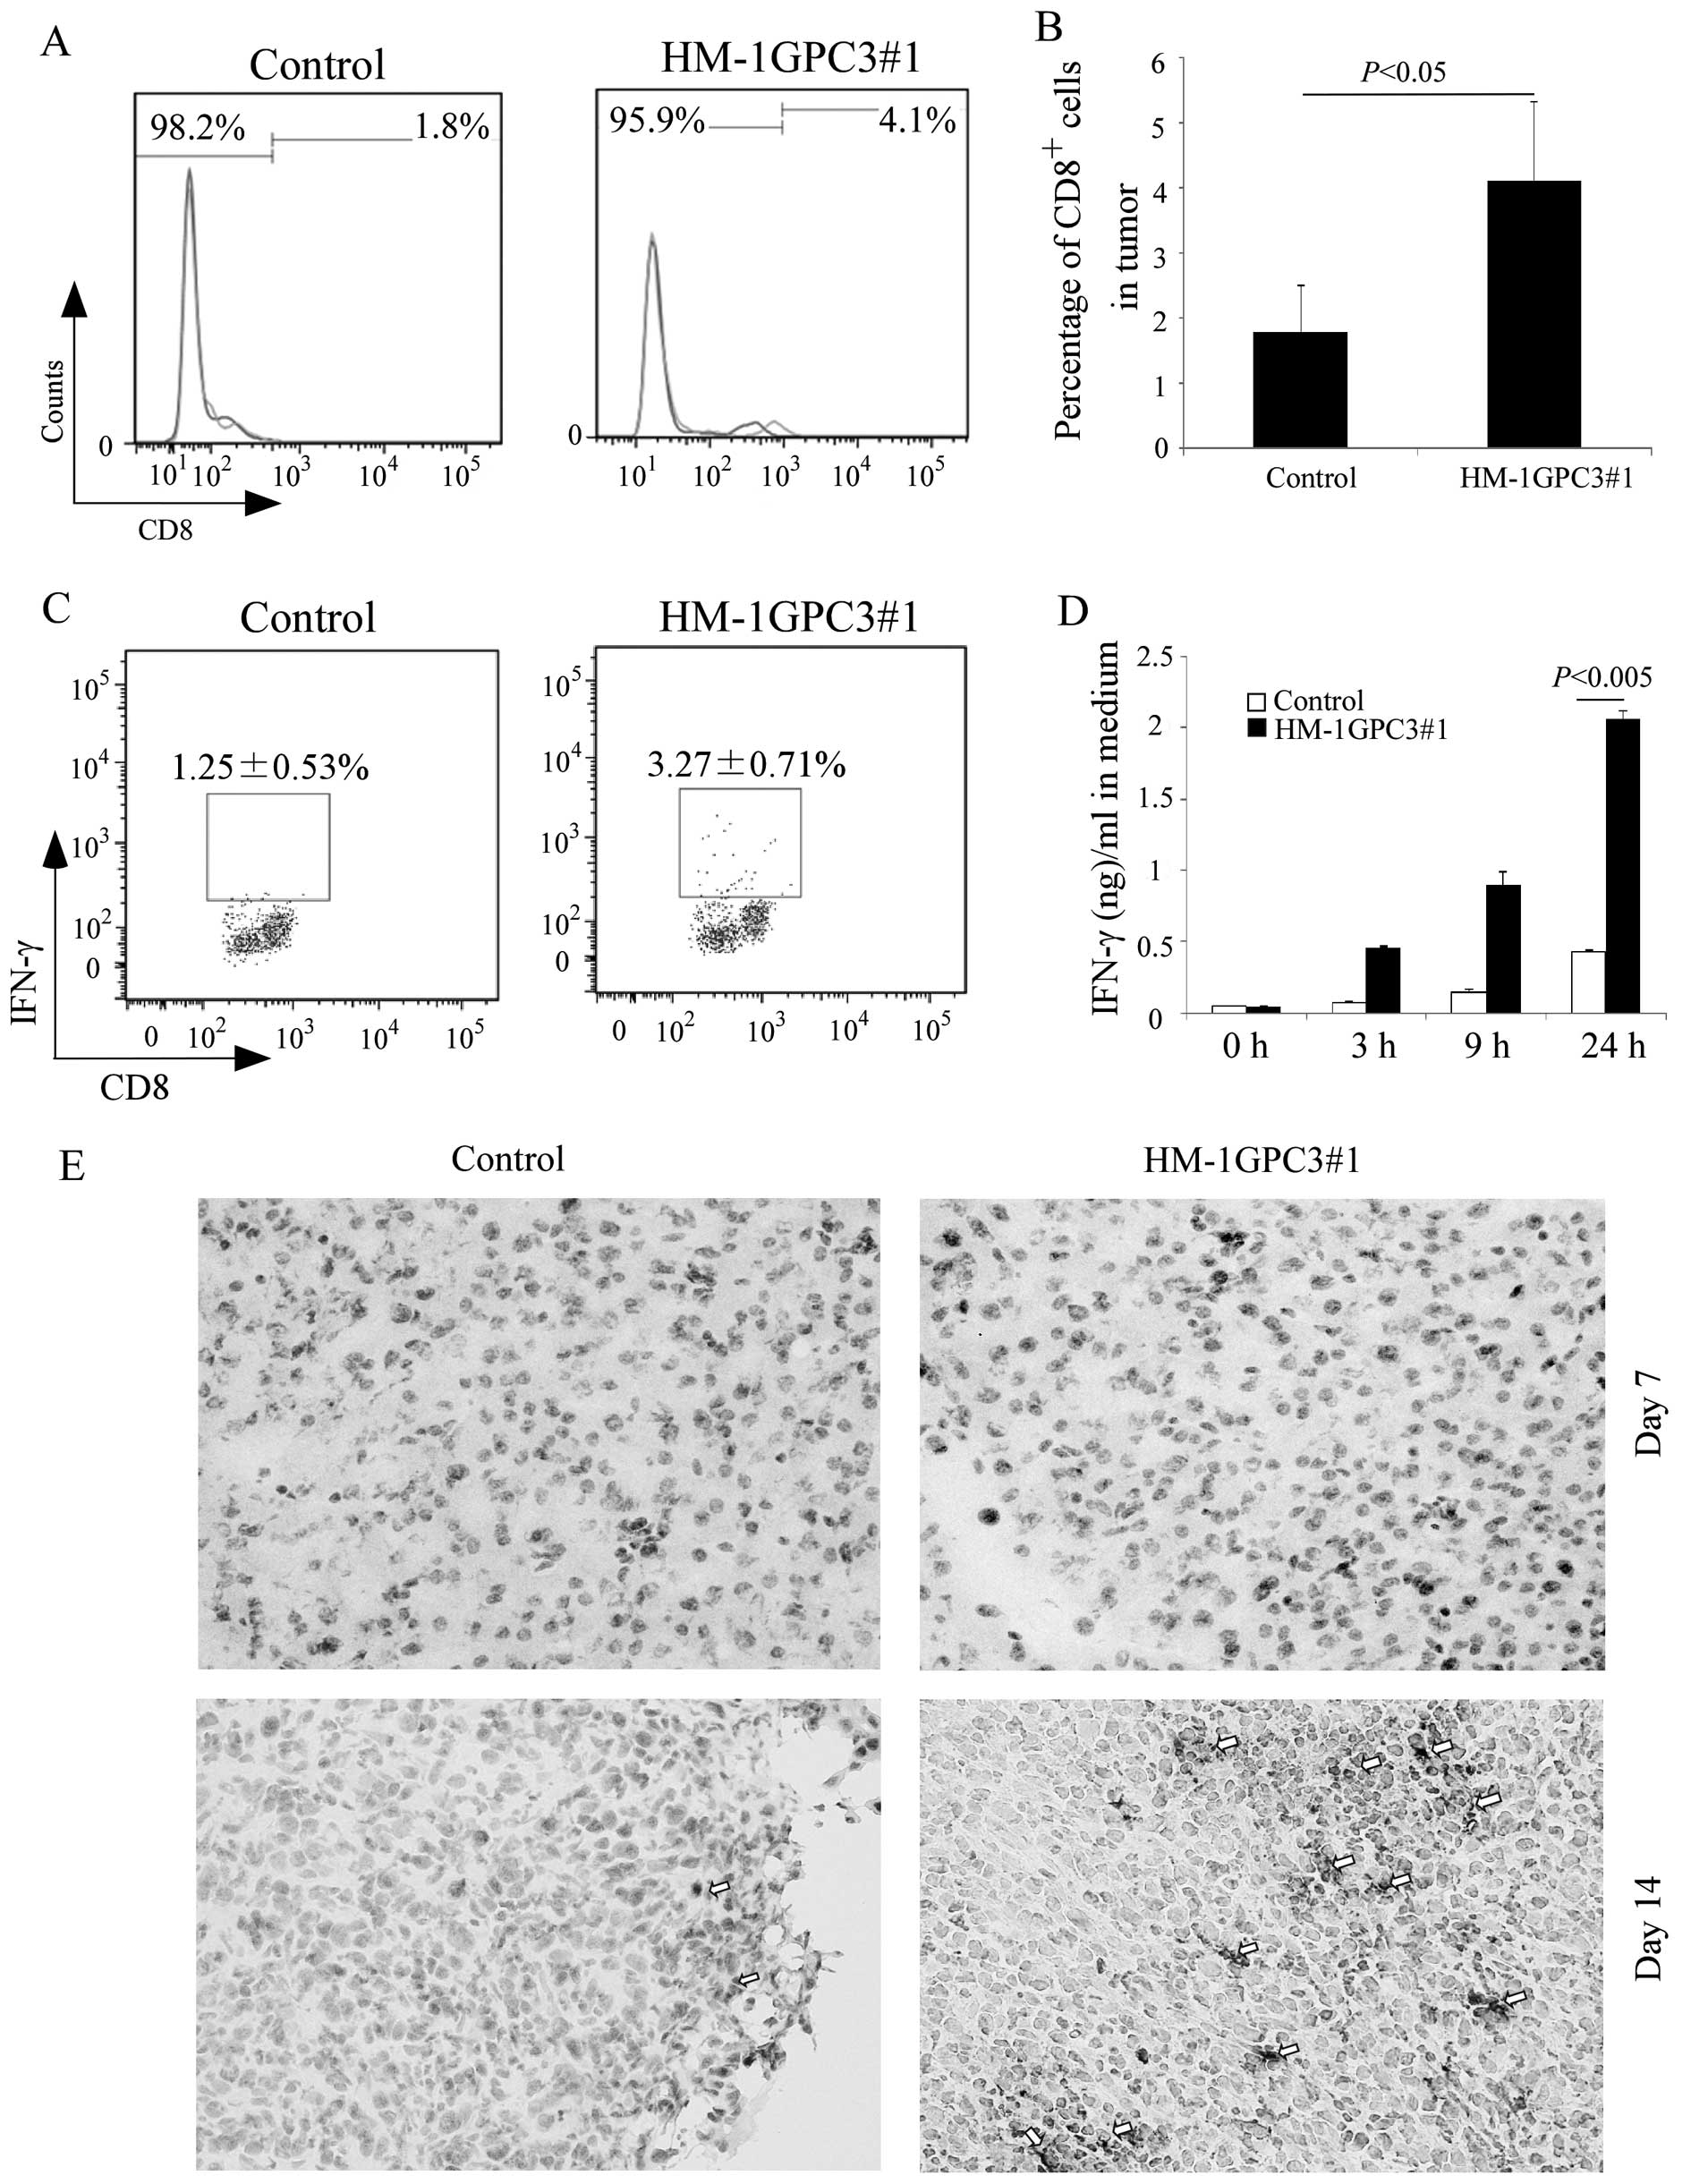
To perform their immune function, T lymphocytes are
activated by M1 macrophages (29).
Therefore, we analyzed CD8+ T cell infiltration and
tumor apoptosis. Peritoneal tumor masses were removed 14 days after
inoculation with cancer cells and disassociated. Disassociated
tumor cells were stained with anti-CD8 FITC-conjugated antibody and
analyzed by FACS. The FACS analysis showed that CD8+ T
cells constituted 4.1% of the total lymphocytes in the
GPC3-expressing tumor and 1.51% in the tumor formed by injection of
the control HM-1 cells (Fig. 4A and
B). To evaluate cellular responses against GPC3, we also
stimulated splenocytes from mice inoculated with the control HM-1
cells and HM-1GPC3#1 cells by adding freeze-thawed HM-1GPC3#1 cell
lysate. Then, we examined IFN-γ production kinetics. We found that
more IFN-γ accumulated in the medium of splenocytes from the
HM-1GPC3#1-inoculated mouse group than from the control group
(Fig. 4D). Therefore, we used the
flow cytometric method to evaluate the contribution of CD8 subset
of T lymphocytes in the spleen to the immune response to the
GPC3-expressing HM-1 cells. We measured the production of
intracellular IFN-γ in this subset after brief antigenic
stimulation. In splenocytes from the mouse spleen inoculated with
the GPC3-expressing HM-1 cells, 3.27% of the CD8-subset cells of T
lymphocytes were IFN-γ positive. In controls, 1.25% of the
CD8-subset cells were IFN-γ positive (Fig. 4C). We also measured the incidence of
cancer cell apoptosis by conducting the TUNEL assay using tumor
tissue extracted on days 7 and 14 after inoculation with cancer
cells. The TUNEL assay of HM-1GPC3#1 tumor sections showed more
apoptotic nuclei (arrow heads) than tumor sections obtained from
mice injected with the control HM-1 cells and the increase in the
number of apoptotic nuclei was time-dependent (Fig. 4E).
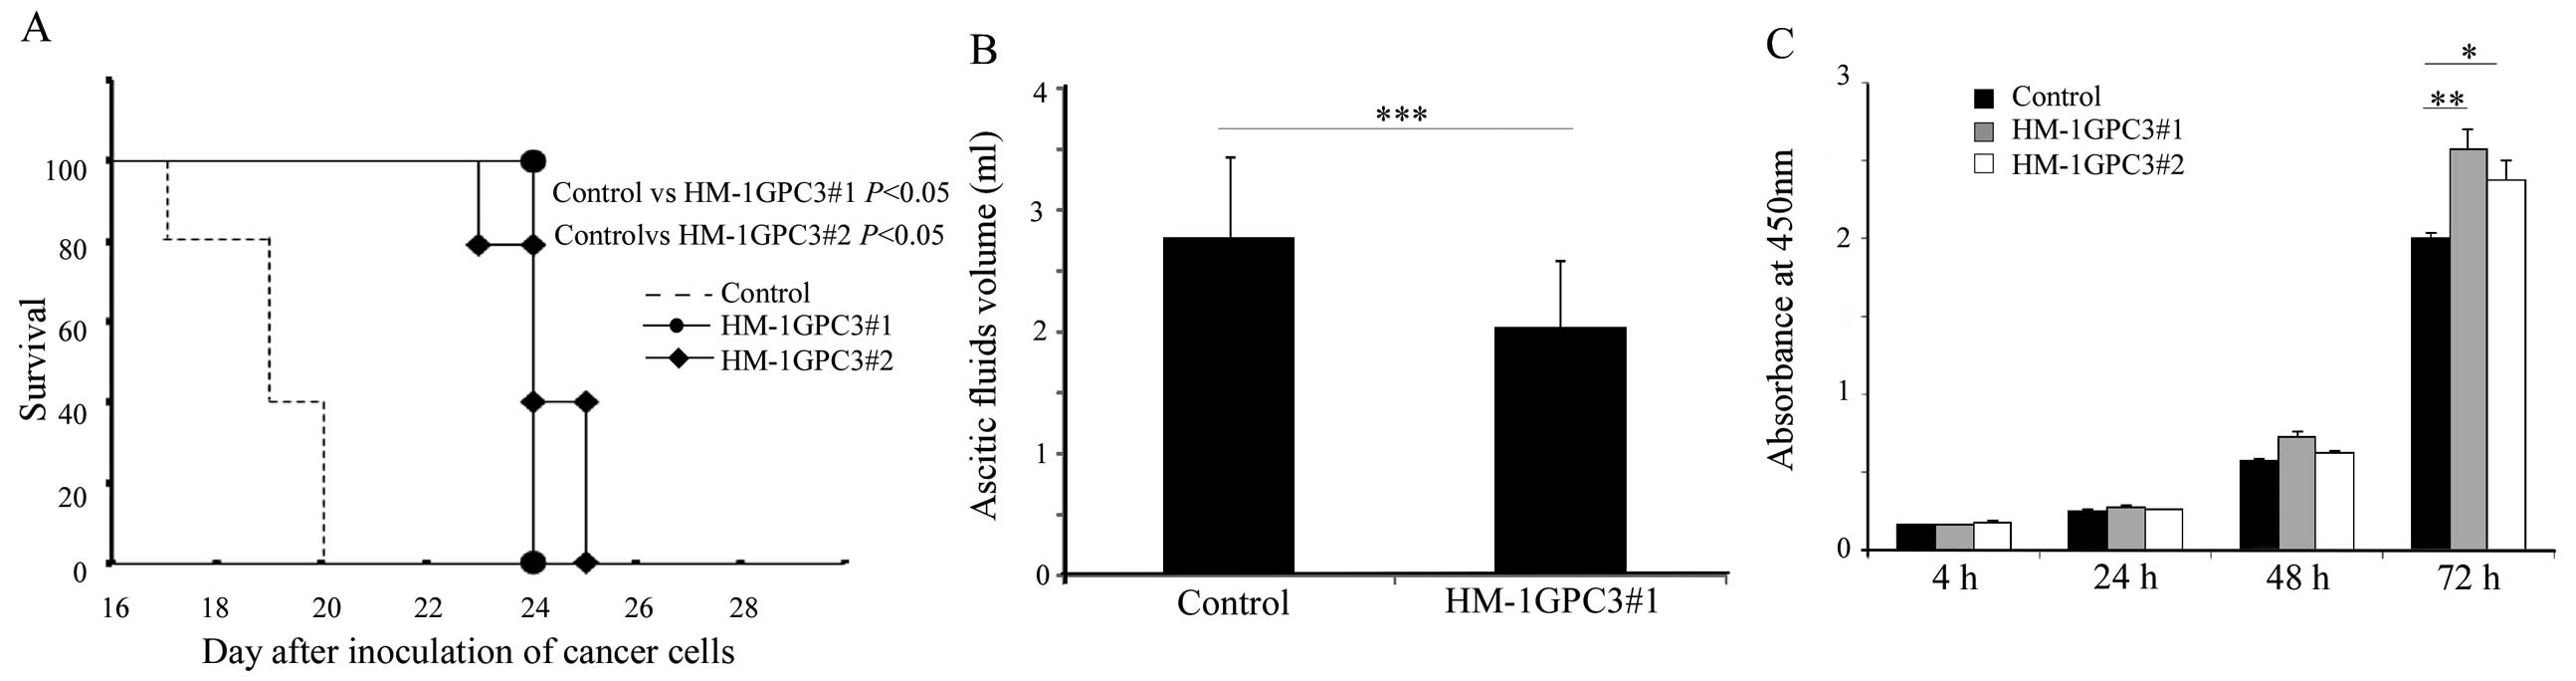
GPC3 expression prolongs mouse survival
and decreases formation of ascitic fluids in vivo
The two colonies of GPC3-expressing HM-1 cells had
significantly higher proliferation rates than the control cells at
72 h after seeding in vitro (HM-1 vs. HM-1GPC3#1 or
HM-1GPC3#2; P<0.01 or 0.05) (Fig.
5C). GPC3 expression significantly improved survival time (HM-1
vs. HM-1GPC3#1 or HM-1GPC3#2; P<0.05). All of the control HM-1
cell-injected mice died by day 20 after inoculation. However, the
mice inoculated with the GPC3-expressing HM-1 cells died by day 24
or 25 after inoculation (Fig. 5A).
The growth rates of the HM-1GPC3#1 and HM-1GPC3#2 cells were
similar both in vivo and in vitro. We compared the
formation of ascitic fluid of the HM-1GPC3#1 and the control HM-1
cells in vivo. The formation of ascitic fluid was less
pronounced in the HM-1GPC3#1-injected mice (Fig. 5B). Thus, GPC3 significantly
suppressed tumor growth.
Discussion
GPC3 expression on a cell membrane stimulates
recruitment of macrophages into HCC tissues (10). Therefore, we used this mouse ovarian
cancer model to analyze the effect of GPC3 on ovarian cancer immune
microenvironment. According to our analysis, GPC3 expression
significantly increased the proportion of M1 macrophages in tumor
mass and ascitic fluids. Macrophages are a highly heterogeneous
cell population. M1 macrophages process tumor antigens and present
them to lymphocytes. M2 macrophages stimulate tumor growth
(30). Hence, our results suggest
that GPC3 expression increases the number of M1 macrophages in
ascitic fluids, especially at an early time. Furthermore, we
examined the cytokines TNF-α and IL-12 in ascitic fluids, which are
secreted by M1 macrophages (32).
We found the two cytokines were higher in ascitic fluids of GPC3
expression cancer than the control especially at an early time; it
was similar to M1 macrophages in ascitic fluids. These results
further suggest that GPC3 expression increases the proportion of M1
macrophages. Moreover, previous studies demonstrated that the
combination of tumor immunotherapy with IL-12 and TNF-α may be more
effective to mouse melanoma (33),
and heparan sulfate causes the release of TNF-α and IL-12, and
induces cytotoxic capability in peritoneal macrophages (34). Our results also revealed GPC3
expression HM-1 cell phagocytosis by intraperitoneal macrophages
in vitro. These studies provide evidence to support that
GPC3 as an HSPG may suppress mouse ovarian cancer growth through
increasing macrophage phagocytosis and induction of IL-12 and TNF-α
secretions.
CD86 is a protein expressed on antigen-presenting
cells that provides costimulatory signals necessary for T cell
activation and survival (35). In
this study, we used CD86 as a marker to determine M1 macrophages.
In addition, as a result of F4/80+CD86+
macrophage increase in GPC3-expressing mouse ovarian cancer, we
analyzed the effect of GPC3 on CD86 expression in mouse
intraperitoneal macrophages. We obtained a result that GPC3 on
mouse ovarian cancer cells induces CD86 expression on mouse
intraperitoneal macrophages. Soluble heparan sulfate delivers
signals to macrophages and upregulates MHC-II and CD86, markedly
increasing the ability of the macrophages to modify immune
responses (34). The increase in
CD86 expression by virtue of GPC3 on mouse peritoneal macrophages
may enhance the antigen-presenting ability of macrophages.
M1 macrophages are antigen-presenting cells that
process tumor antigens and present them to lymphocytes after
migration into the draining lymph nodes (29). According to our results, M1
macrophages in GPC3 expressing cancer ascitic fluids increase on
day 3 after inoculation with cancer cells. We also confirmed that
M1 macrophages increase significantly in inguinal lymph node on day
4 after inoculation with cancer cells and F4/80+ cells
migrate into T cell zone of the inguinal lymph nodes at the same
time (data not shown). Thus, the time- and space-dependent
distribution of F4/80+CD86+ cells suggests
that the increase in the abundance of
F4/80+CD86+ cells in the inguinal lymph nodes
might be associated with the migration of
F4/80+CD86+ cells from the peritoneal cavity.
These results provide further evidence to support that GPC3
expression recruits M1 macrophages and enhances antigen
presentation ability to lymphocytes.
Enhancement of antigen presenting capability of
macrophage can activates helper T cells and then helper T cells
help CD8-T cell responses (36).
Our results demonstrated that GPC3-expression increases M1
macrophages in tumor mass, ascitic fluids and inguinal lymph node.
Thus, we consider that T cell-mediated immune responses to GPC3 can
be induced. In order to confirm this hypothesis, we analyzed tumor
infiltrating CD8+T cells and found infiltrating
CD8+T cells increase in GPC3-expressing tumor. In
addition, we also confirmed that HM-1GPC3 lysate stimulates
splenocytes from the mice inoculated with HM-1GPC3 to secrete IFN-γ
specifically. These results demonstrated that GPC3 expression in
mouse ovarian cancer is able to induce GPC3-specific T
cell-mediated immune response. Effecter T cells kill targets by
apoptosis (37). Consequently, we
found GPC3 expression increases apoptotic cells in tumor masses.
Collectively, we suggest that GPC3 expression recruits M1
macrophages to engulf cancer cells and enhances antigen
presentation ability to lymphocytes, and then induces GPC3-specific
T cell-mediated immune response to suppress GPC3-expressing tumor
growth.
Finally, in order to confirm that this immune
response suppresses GPC3-expressing tumor growth, we used the
intraperitoneal ovarian cancer mouse model to investigate the
effect of GPC3 on mouse survival rate. We found that GPC3
expression decreased ascitic fluid production and significantly
prolonged mouse survival. Contrarily, GPC3 expression stimulated
cancer cell growth in vitro.
In conclusion, the present study demonstrates that
GPC3 expression induces T cell-mediated immune response in this
mouse ovarian cancer model and also provides supportive evidence
that GPC3 is an ideal target for ovarian cancer immunotherapy.
Abbreviations:
|
GPC3
|
glypican-3
|
|
HSPG
|
heparan sulfate proteoglycan
|
|
OCCC
|
ovarian clear cell carcinoma
|
|
HCC
|
hepatocellular carcinoma
|
|
TNF-α
|
tumor necrotic factor-α
|
|
IL-12
|
interleukin-12
|
|
IFN-γ
|
interferon-γ
|
References
|
1
|
Fransson LA: Glypicans. Int J Biochem Cell
Biol. 35:125–129. 2003. View Article : Google Scholar
|
|
2
|
Stadlmann S, Gueth U, Baumhoer D, Moch H,
Terracciano L and Singer G: Glypican-3 expression in primary and
recurrent ovarian carcinomas. Int J Gynecol Pathol. 26:341–344.
2007. View Article : Google Scholar : PubMed/NCBI
|
|
3
|
Maeda D, Ota S, Takazawa Y, et al:
Glypican-3 expression in clear cell adenocarcinoma of the ovary.
Mod Pathol. 22:824–832. 2009.PubMed/NCBI
|
|
4
|
Capurro M, Wanless IR, Sherman M, et al:
Glypican-3: a novel serum and histochemical marker for
hepatocellular carcinoma. Gastroenterology. 125:89–97. 2003.
View Article : Google Scholar : PubMed/NCBI
|
|
5
|
Nakatsura T, Yoshitake Y, Senju S, et al:
Glypican-3, overexpressed specifically in human hepatocellular
carcinoma, is a novel tumor marker. Biochem Biophys Res Commun.
306:16–25. 2003. View Article : Google Scholar : PubMed/NCBI
|
|
6
|
Lin Q, Xiong LW, Pan XF, et al: Expression
of GPC3 protein and its significance in lung squamous cell
carcinoma. Med Oncol. 29:663–669. 2012. View Article : Google Scholar : PubMed/NCBI
|
|
7
|
Nakatsura T, Kageshita T, Ito S, et al:
Identification of glypican-3 as a novel tumor marker for melanoma.
Clin Cancer Res. 10:6612–6621. 2004. View Article : Google Scholar : PubMed/NCBI
|
|
8
|
Capurro MI, Xu P, Shi W, Li F, Jia A and
Filmus J: Glypican-3 inhibits Hedgehog signaling during development
by competing with patched for Hedgehog binding. Dev Cell.
14:700–711. 2008. View Article : Google Scholar : PubMed/NCBI
|
|
9
|
Lai JP, Oseini AM, Moser CD, et al: The
oncogenic effect of sulfatase 2 in human hepatocellular carcinoma
is mediated in part by glypican 3-dependent Wnt activation.
Hepatology. 52:1680–1689. 2010. View Article : Google Scholar : PubMed/NCBI
|
|
10
|
Gao W and Ho M: The role of glypican-3 in
regulating Wnt in hepatocellular carcinomas. Cancer Rep. 1:14–19.
2011.PubMed/NCBI
|
|
11
|
Lin H, Huber R, Schlessinger D and Morin
PJ: Frequent silencing of the GPC3 gene in ovarian cancer cell
lines. Cancer Res. 59:807–810. 1999.PubMed/NCBI
|
|
12
|
Kim H, Xu GL, Borczuk AC, et al: The
heparan sulfate proteoglycan GPC3 is a potential lung tumor
suppressor. Am J Respir Cell Mol Biol. 29:694–701. 2003. View Article : Google Scholar : PubMed/NCBI
|
|
13
|
Suzuki S, Yoshikawa T, Hirosawa T, et al:
Glypican-3 could be an effective target for immunotherapy combined
with chemotherapy against ovarian clear cell carcinoma. Cancer Sci.
102:1622–1629. 2011. View Article : Google Scholar : PubMed/NCBI
|
|
14
|
Suzuki S, Shibata K, Kikkawa F and
Nakatsura T: Significant clinical response of progressive recurrent
ovarian clear cell carcinoma to glypican-3-derived peptide vaccine
therapy: two case reports. Hum Vaccin Immunother. 10:338–343. 2014.
View Article : Google Scholar : PubMed/NCBI
|
|
15
|
Fatourou EM and Koskinas JS: Adaptive
immunity in hepatocellular carcinoma: prognostic and therapeutic
implications. Expert Rev Anticancer Ther. 9:1499–1510. 2009.
View Article : Google Scholar : PubMed/NCBI
|
|
16
|
Hiroishi K, Eguchi J, Baba T, et al:
Strong CD8(+) T-cell responses against tumor-associated
antigens prolong the recurrence-free interval after tumor treatment
in patients with hepatocellular carcinoma. J Gastroenterol.
45:451–458. 2010.
|
|
17
|
Yoshikawa T, Nakatsugawa M, Suzuki S, et
al: HLA-A2-restricted glypican-3 peptide-specific CTL clones
induced by peptide vaccine show high avidity and antigen-specific
killing activity against tumor cells. Cancer Sci. 102:918–925.
2011. View Article : Google Scholar
|
|
18
|
Tada F, Abe M, Hirooka M, et al: Phase
I/II study of immunotherapy using tumor antigen-pulsed dendritic
cells in patients with hepatocellular carcinoma. Int J Oncol.
41:1601–1609. 2012.PubMed/NCBI
|
|
19
|
Webb LM, Ehrengruber MU, Clark-Lewis I,
Baggiolini M and Rot A: Binding to heparan sulfate or heparin
enhances neutrophil responses to interleukin 8. Proc Natl Acad Sci
USA. 90:7158–7162. 1993. View Article : Google Scholar : PubMed/NCBI
|
|
20
|
Wang D, Sai J and Richmond A: Cell surface
heparan sulfate participates in CXCL1-induced signaling.
Biochemistry. 42:1071–1077. 2003. View Article : Google Scholar : PubMed/NCBI
|
|
21
|
Slimani H, Charnaux N, Mbemba E, et al:
Binding of the CC-chemokine RANTES to syndecan-1 and syndecan-4
expressed on HeLa cells. Glycobiology. 13:623–634. 2003. View Article : Google Scholar : PubMed/NCBI
|
|
22
|
Hamon M, Mbemba E, Charnaux N, et al: A
syndecan-4/CXCR4 complex expressed on human primary lymphocytes and
macrophages and HeLa cell line binds the CXC chemokine stromal
cell-derived factor-1 (SDF-1). Glycobiology. 14:311–323. 2004.
View Article : Google Scholar : PubMed/NCBI
|
|
23
|
Fernandez-Botran R, Yan J and Justus DE:
Binding of interferon gamma by glycosaminoglycans: a strategy for
localization and/or inhibition of its activity. Cytokine.
11:313–325. 1999. View Article : Google Scholar : PubMed/NCBI
|
|
24
|
Leonetti M, Gadzinski A and Moine G: Cell
surface heparan sulfate proteoglycans influence MHC class
II-restricted antigen presentation. J Immunol. 185:3847–3856. 2010.
View Article : Google Scholar : PubMed/NCBI
|
|
25
|
Takai H, Kato A, Kato C, et al: The
expression profile of glypican-3 and its relation to macrophage
population in human hepatocellular carcinoma. Liver Int.
29:1056–1064. 2009. View Article : Google Scholar : PubMed/NCBI
|
|
26
|
Takai H, Ashihara M, Ishiguro T, et al:
Involvement of glypican-3 in the recruitment of M2-polarized
tumor-associated macrophages in hepatocellular carcinoma. Cancer
Biol Ther. 8:2329–2338. 2009. View Article : Google Scholar : PubMed/NCBI
|
|
27
|
Van Ginderachter JA, Movahedi K,
Hassanzadeh Ghassabeh G, et al: Classical and alternative
activation of mononuclear phagocytes: picking the best of both
worlds for tumor promotion. Immunobiology. 211:487–501.
2006.PubMed/NCBI
|
|
28
|
Gabrilovich DI, Ostrand-Rosenberg S and
Bronte V: Coordinated regulation of myeloid cells by tumours. Nat
Rev Immunol. 12:253–268. 2012. View Article : Google Scholar : PubMed/NCBI
|
|
29
|
Dunn GP, Old LJ and Schreiber RD: The
immunobiology of cancer immunosurveillance and immunoediting.
Immunity. 21:137–148. 2004. View Article : Google Scholar : PubMed/NCBI
|
|
30
|
Murdoch C, Giannoudis A and Lewis CE:
Mechanisms regulating the recruitment of macrophages into hypoxic
areas of tumors and other ischemic tissues. Blood. 104:2224–2234.
2004. View Article : Google Scholar : PubMed/NCBI
|
|
31
|
Komori H, Nakatsura T, Senju S, et al:
Identification of HLA-A2-or HLA-A24-restricted CTL epitopes
possibly useful for glypican-3-specific immunotherapy of
hepatocellular carcinoma. Clin Cancer Res. 12:2689–2697. 2006.
View Article : Google Scholar : PubMed/NCBI
|
|
32
|
Mantovani A, Sica A, Sozzani S, Allavena
P, Vecchi A and Locati M: The chemokine system in diverse forms of
macrophage activation and polarization. Trends Immunol. 25:677–686.
2004. View Article : Google Scholar : PubMed/NCBI
|
|
33
|
Lasek W, Feleszko W, Golab J, et al:
Antitumor effects of the combination immunotherapy with
interleukin-12 and tumor necrosis factor alpha in mice. Cancer
Immunol Immunother. 45:100–108. 1997. View Article : Google Scholar : PubMed/NCBI
|
|
34
|
Wrenshall LE, Stevens RB, Cerra FB and
Platt JL: Modulation of macrophage and B cell function by
glycosaminoglycans. J Leukoc Biol. 66:391–400. 1999.PubMed/NCBI
|
|
35
|
Chen C, Gault A, Shen L and Nabavi N:
Molecular cloning and expression of early T cell costimulatory
molecule-1 and its characterization as B7-2 molecule. J Immunol.
152:4929–4936. 1994.PubMed/NCBI
|
|
36
|
Serre K, Giraudo L, Siret C, Leserman L
and Machy P: CD4 T cell help is required for primary CD8 T cell
responses to vesicular antigen delivered to dendritic cells in
vivo. Eur J Immunol. 36:1386–1397. 2006. View Article : Google Scholar : PubMed/NCBI
|
|
37
|
Cullen SP and Martin SJ: Mechanisms of
granule-dependent killing. Cell Death Differ. 15:251–262. 2008.
View Article : Google Scholar : PubMed/NCBI
|