Introduction
Lung cancer still remains the leading cause of
cancer-related mortality in the world, and the majority of patients
present with advanced disease at diagnosis or develop recurrence,
neither of which is amenable to curative approaches (1). The epidermal growth factor receptor
(EGFR) is expressed in a number of tumors, including non-small-cell
lung cancer (NSCLC). EGFR is a member of the EGFR family that
includes HER2 (ErbB2), HER3 (ErbB3) and HER4 (ErbB4) (2–4).
Activation of the EGFR leads to receptor associated tyrosine kinase
activity that initiates a cascade of events leading to downstream
signaling and a variety of changes characteristic of malignant
progression including upregulation of ras, raf, mitogen-activated
phosphorylated (MAP) kinase, and phosphatidylinositol 3-kinase
(PI3K) and the downstream protein-serine/threonine kinase Akt. In
turn, cellular growth and invasive capacity are enhanced.
Preclinical data indicate that small molecules that compete with
adenosine triphosphate for delivery of phosphate groups to critical
tyrosine residues could block signal transduction through EGFR.
Studies have demonstrated that gefitinib is a promising agent for
the treatment of a wide range of tumors, including NSCLC. Gefitinib
can enter cells and inhibit the autophosphorylation of
EGF-stimulated EGFR in a variety of EGFR-expressing human cancer
cell lines (5). Several phase I
studies have shown that gefitinib is generally well tolerated, with
evidence of antitumor activity in NSCLC, and two large phase II
gefitinib monotherapy studies [Iressa Dose Evaluation in Advanced
Lung Cancer (IDEAL) 1 and 2] in patients with pretreated advanced
NSCLC further confirmed that gefitinib was generally well tolerated
and demonstrated clinically significant antitumor activity
(6–8). Cetuximab is an IgG1 subclass chimeric
mouse-human antibody that plays roles similar to gefitinib. In
addition, cetuximab binds to the extracellular portion of EGFR and
induces destruction of the receptor (9). Addition of cetuximab to platinum-based
chemotherapy results in a moderate increase in the overall survival
of patients with advanced NSCLC as confirmed in clinical research
(10). There is a strong rationale
for combining gefitinib with standard chemotherapeutic agents.
Unfortunately, this exciting, high-level of preclinical activity
has not transpired in most clinical studies reported to date. In
fact, the addition of gefitinib has offered minimal to no additive
or synergistic clinical activity to the standard antineoplastic
regimens which has led to its limited availability (11–15).
Likewise, two phase III trials have not shown gefitinib to be
effective when combined with chemotherapy in the treatment of NSCLC
(16,17). Paclitaxel + cisplatin (TP)
chemotherapy regimens are used for the treatment of NSCLC (18). We hypothesized that one of the
reasons resulting in the failure of combination therapy was that
chemotherapy drugs affect the cellular gefitinib concentration.
Thus, the present study investigated the effects of combining
gefitinib with TP on growth factor signaling, cell cycle
progression, and apoptosis in vitro and in vivo.
Subsequently, we evaluated the difference in cellular gefitinib
concentration after gefitinib monotherapy and after combination
therapy with gefitinib and TP to confirm our hypothesis.
Materials and methods
Chemical preparation
Gefitinib was purchased from AstraZeneca
(Macclesfield, UK). A 10 mM working solution in DMSO was prepared
and stored at −20°C. Recombinant human EGF was purchased from
PeproTech (London, UK). Fetal bovine serum (FBS) was purchased from
Gibco Invitrogen Co. (Carlsbad, CA, USA). The primary antibodies
used for western blot assays were as follows: rabbit monoclonal for
anti-EGFR antibody, anti-phospho-EGFR (PY1068) antibody,
anti-IGF-1R antibody, anti-phospho-IGFR (Tyr1135/1136) antibody,
anti-SRC antibody, anti-phospho-SRC (Tyr416) antibody, anti-ABCG2
antibody, anti-ERK1/2 antibody, anti-phospho-ERK (PY204) antibody,
anti-Akt antibody, anti-phospho-AKT (PS473) antibody (all from
Abcam Co.); and mouse polyclonal anti-P53 antibody, anti-BAX
antibody (from Cell Signaling Technology).
Cell culture
The lung adenocarcinoma A549 cell line was
maintained in RPMI-1640 medium with 10% FBS at 37°C in a 5%
CO2 atmosphere. For this study, we divided the A549
cells into four groups: group one remain in normal growth;
group-two (G) was administered gefitinib monotherapy and TP was
added to group-three; group-four was administered the combination
of gefitinib and TP. Group two, three and four received four
repeated doses to simulate clinical situations.
Detection of gefitinib concentration in
NSCLC A549 cells by high performance liquid chromatography
(HPLC)
The cells were cultured according to the
experimental design and harvested. By thawing and refreezing five
times in liquid nitrogen, the A549 cells were destroyed, added to a
mixture of mobile phase methanol:water (70:30, 500 μl), and the
supernatant was directly injected into HPLC. The objective of this
study was to compare the differences in the cellular gefitinb
concentration between the G and TP+G groups. The gefitinib
concentration of one cell was equal to the concentration obtained
by HPLC/total cell number. Assay performance was monitored using
quality control samples, and the limit of quantification for each
analysis was 0.05, 0.1 and 0.2 μM for gefitinib. The linear
relationship between the peak area and the concentration of
gefitinib was good; it was convenient for calculation and
comparison with the intracellular gefitinb concentration.
Cell growth inhibition assay
CCK-8 assays were used to evaluate the growth
inhibitory effects of gefitinib, paclitaxel and cisplatin. The
cells were seeded on 96-well plates at a density of 3,000
cells/well, incubated for 24 h, and then treated for 48 h with the
drugs at 37°C. After drug treatment, CCK-8 solution was added to
each well and incubated for 4 h at 37°C. Cell viability was
determined by measuring the absorbance at 540 nm in a microplate
reader (micro-ELISA). Six replicate wells were used for each
analysis, and at least three independent experiments were
conducted. The data from the replicate wells are presented as the
mean numbers of remaining cells, with 95% confidence intervals. To
determine the effects of the combined drug treatments, any
potentiation was estimated by multiplying the percentage of
remaining cells (percent growth) for each drug.
Growth curves
Culture media were replaced every 48 h following
drug treatment. The cells in the G and TP+G groups were cultured
for 5–10 days to allow cells to return to the logarithmic phase.
Then cells were harvested and seeded on 96-well plates at a density
of 800 cells/well. Three replicate wells were used for each
analysis. Every three wells were select from two groups of cells on
day 1, 2, 3, 4 and 5. CCK-8 solution was added to each well and
incubated for 4 h at 37°C. Cell viability was determined by
measuring the absorbance at 540 nm in a microplate reader
(micro-ELISA).
Analysis of the cell cycle and
apoptosis
The cells were exposed to the different drug
treatments for 48–72 h and were harvested. The cells were then
washed with PBS and stained by PI at 4°C for 30 min using a cell
cycle detection kit (KeyGen, Nanjin, China) and analyzed using a
flow cytometer (BD FACSCalibur). Cells were stained using Annexin
V-FITC and PI. Briefly, cells were suspended in binding buffer,
followed by incubation with 1X Annexin V-FITC binding buffer (195
μl) and Annexin V-FITC (5 μl) for 10 min at room temperature in the
dark. Expression of Annexin V and PI was determined using a
fluorescence-activated cell sorting (FACS) flow cytometer (BD
FACSCalibur). Apoptosis in the A549 cells was analyzed by Hoechst
33258 staining according to the manufacturer’s instructions
(Beyotime). Stained nuclei were observed under a fluorescence
microscope.
Mutational analysis of the EGFR (exon
18–21) gene
Genomic DNA was extracted from the A549 cells.
Primers were designed using Primer 5, and the sequences were as
follows: 18 exon forward, 5′-GATGCCAAAGAAGTAGAATGAGA AAA-3′ and
reverse, 5′-CAGGAAAGCATCTTCACCCA CAG-3′; 19 exon forward,
5′-ATGGAATCTGTCAGCAAC CTCACCCTT-3′ and reverse,
5′-CAACTGCTAATGGCCCG TTCTCG-3′; 20 exon forward, 5′-AACATGGTGAGGGC
TGAGGTGAC-3′ and reverse, 5′-ATGCCTTTGGTCTGTGA ATTGGT-3′; 21 exon
forward, 5′-AAATTACTATGCAGCA TGTGGCACC-3′ and reverse,
5′-TAGGATGTGGAGATGAG CAGGGT-3′. All mutations were confirmed at
least twice from independent PCR isolates.
Western blotting
A549 cells and tumor samples were lysed in RIPA
buffer (150 mM NaCl, 1% NP-40, 50 mM Tris-HCl pH 7.4, 1 mM
phenylmethylsulfonyl fluoride, 1 μg/ml leupeptin, 1 mM deoxycholic
acid and 1 mM EDTA) containing a cocktail of protease inhibitors
and phosphatase inhibitors (Calbiochem, Darmstadt, Germany). Equal
amounts of the protein samples (30–50 μg) were separated by 12%
SDS-PAGE and transferred to PVDF membranes (Millipore, Bedford, MA,
USA) using the Bio-Rad Semi-Dry Transfer system.
Knockdown of IGF-1R by RNA interference
and inhibitor for SRC
siRNA (sense, 5′-GAAGAGGUAUU GAAUGCUAdT dT-3′ and
antisense, 5′-UAGCAUU CAAUACCUCUU CT dTd-3′) against IGF-1R was
purchased from Guangzhou RiboBio Co., Ltd. Cells were transfected
with short interfering RNAs at a final concentration of 40 nmol/l
using Lipofectamine 2000 (Invitrogen) in accordance with the
manufacturer’s instructions. Cell lysates were harvested 48 h after
transfection. The SRC inhibitor, saratinib (5 nM) was added to the
culture medium for 48 h, and the cell lysates were collected.
In vivo studies
Male athymic nude mice (4- to 6-weeks old) were
purchased from Beijing HFK Bioscience Co., Ltd. Gefitinib was
suspended at 50 mg/kg in 1% Tween-80 for administration by oral
gavage. A549 cells were injected subcutaneously into the right
dorsal flank of the mice. Tumor volumes were calculated using the
formula: Width2 × length × 0.52. Tumor growth was
monitored and when tumors reached an average of 200 mm3,
40 mice (injected with A549 cells) were randomized into 4 groups
(10 mice/group). One group of female nude mice (control group)
received 1% Tween-80 alone (0.2 ml volume delivered as an oral
gavage). The second group (bearing A549 tumor xenografts) was dosed
orally with gefitinib at a dose level of 50 mg/kg. The third group
received paclitaxel (injected in the abdominal cavity at a dose
level of 5 mg/kg) and cisplatin (injected in the caudal vein at a
dose level of 2 mg/kg). The fourth group received gefitinib and TP
(cisplatin and paclitaxel). Treatment was performed once daily.
Tumor size and mouse weight were measured at the same time. After
14 days, the mice were sacrificed and the tumors were dissected.
All animals were treated in accordance with National Institutes of
Health guidelines for animal care and use, and experimental
protocols were approved by the Institutional Animal Care and
Treatment Committee of Sichuan University.
Determination of gefitinib concentration
in the tumor samples
Twenty mice were sacrificed by inhalation of
halothane at 2 h after the final dose, and blood samples were
collected into heparinized tubes. The tumor samples were
flash-frozen and stored at −70°C before processing. Plasma and
tumor samples were immediately assayed for concentrations of
gefitinib by HPLC as previously described (19). Tumor extracts were processed in an
identical manner, except that samples were diluted using
methanol:water (70:30, v/v).
Statistical analysis
The data are presented as the means ± SEM. p<0.05
was considered to indicate a statistically significant result.
Calculation of the survival rate of the nude mice was by the Life
Table method. The statistical significance was determined by the
log-rank test. The statistical significance of the tumor size and
weight was determined by the Student’s t-test for two groups or by
the Kruskal-Wallis test followed by Dunn’s post-test for multiple
groups. All data were analyzed using SPSS 19.0.
Results
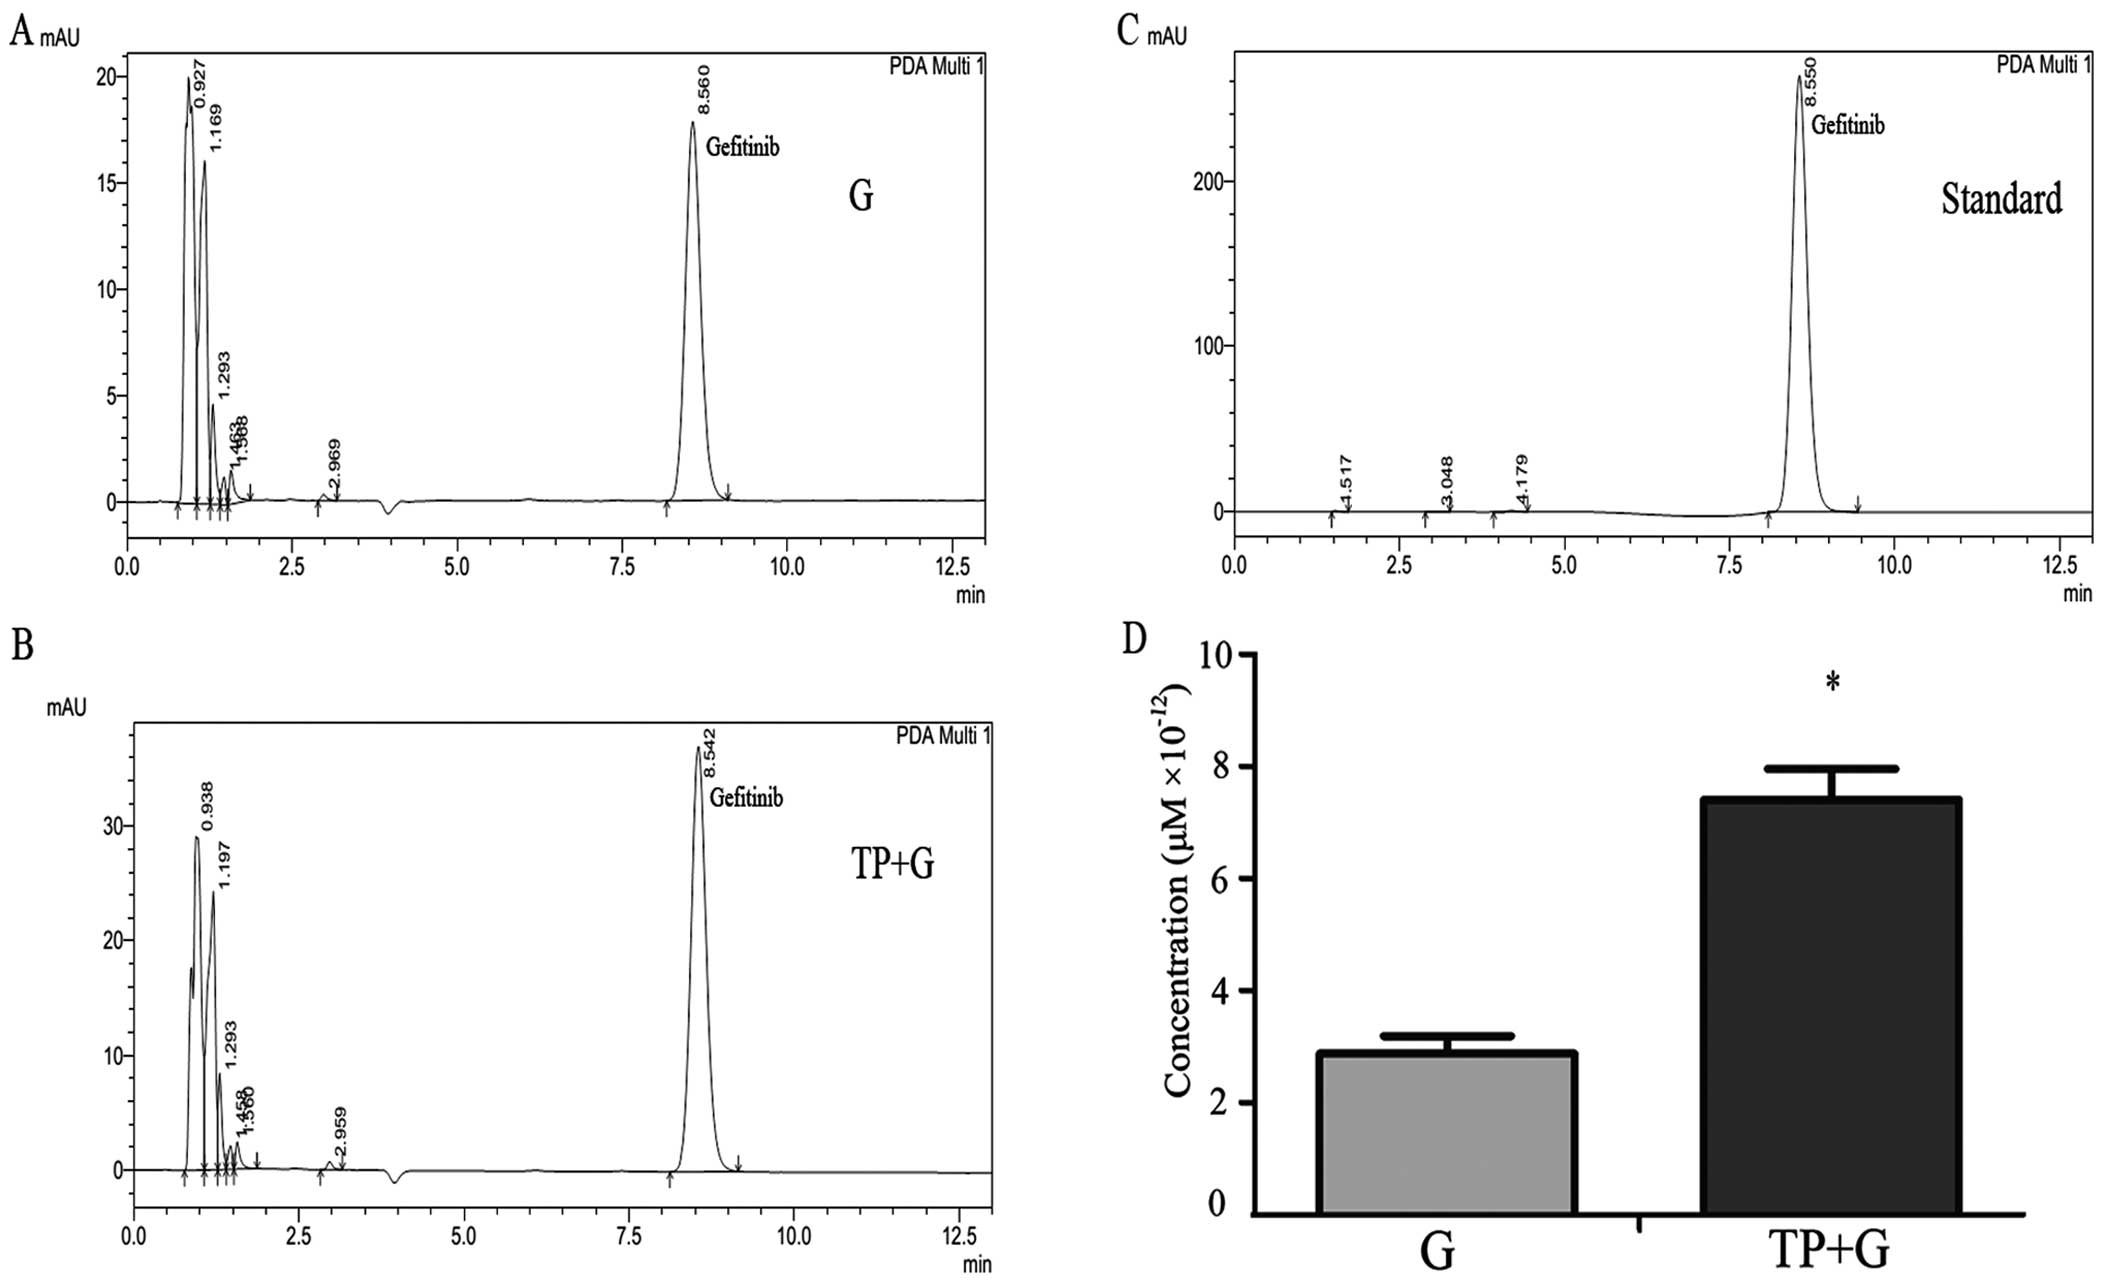
Cellular gefitinib concentration is
significantly increased in the combination group
The gefitinib concentration in the NSCLC A549 cells
was detected by HPLC. Representative chromatographic profiles from
the G and TP+G groups are shown in Fig.
1A and B. Fig. 1C shows
standard (gefitinib; 0.1 μM) chromatographic profiles; peaks at ~8
min, maximum absorption wavelength of 246 nm. After repeating the
test, the results showed that the cellular gefitinib concentration
was significantly higher in the combination (TP+G) group as
compared with that in the G group (Fig.
1D).
Combination drug treatment greatly
inhibits tumor cell growth following the first three treatments but
not after the fourth treatment
To confirm the effect of the combined treatment and
the single-drug exposure, we simulated the clinical treatment model
by administering gefitinib alone or in combination with TP for four
times.
After the first drug treatment, cell proliferation
was inhibited (Fig. 2A), the cell
cycle was arrested in the G2/M phase (Fig. 2F) and marked cell death induction
was observed in the TP+G group (Fig.
2G). Compared with the normal control and TP group, the
expression levels of P-EGFR, P-AKT and P-ERK protein were decreased
in the G and TP+G groups. Compared with the normal control and the
G group, p53 and BAX were increased in the TP and TP+G groups
(Fig. 2B). The expression of ABCG2
displayed no obvious difference among the four groups. During
treatment, the IC50 values of gefitinib increased
(Fig. 2E), and the cellular
gefitinib concentration was always significantly higher in the
combination (TP+G) when compared with that in the G group (Fig. 2D). The second and third treatment
had a similar effect on cell viability in comparison to the first
treatment. However, after the fourth drug treatment, cells in the
TP+G group exhibited increased growth rate, reduced cell cycle
arrest in the G2/M phase, and decreased apoptosis (Fig. 2F and G).
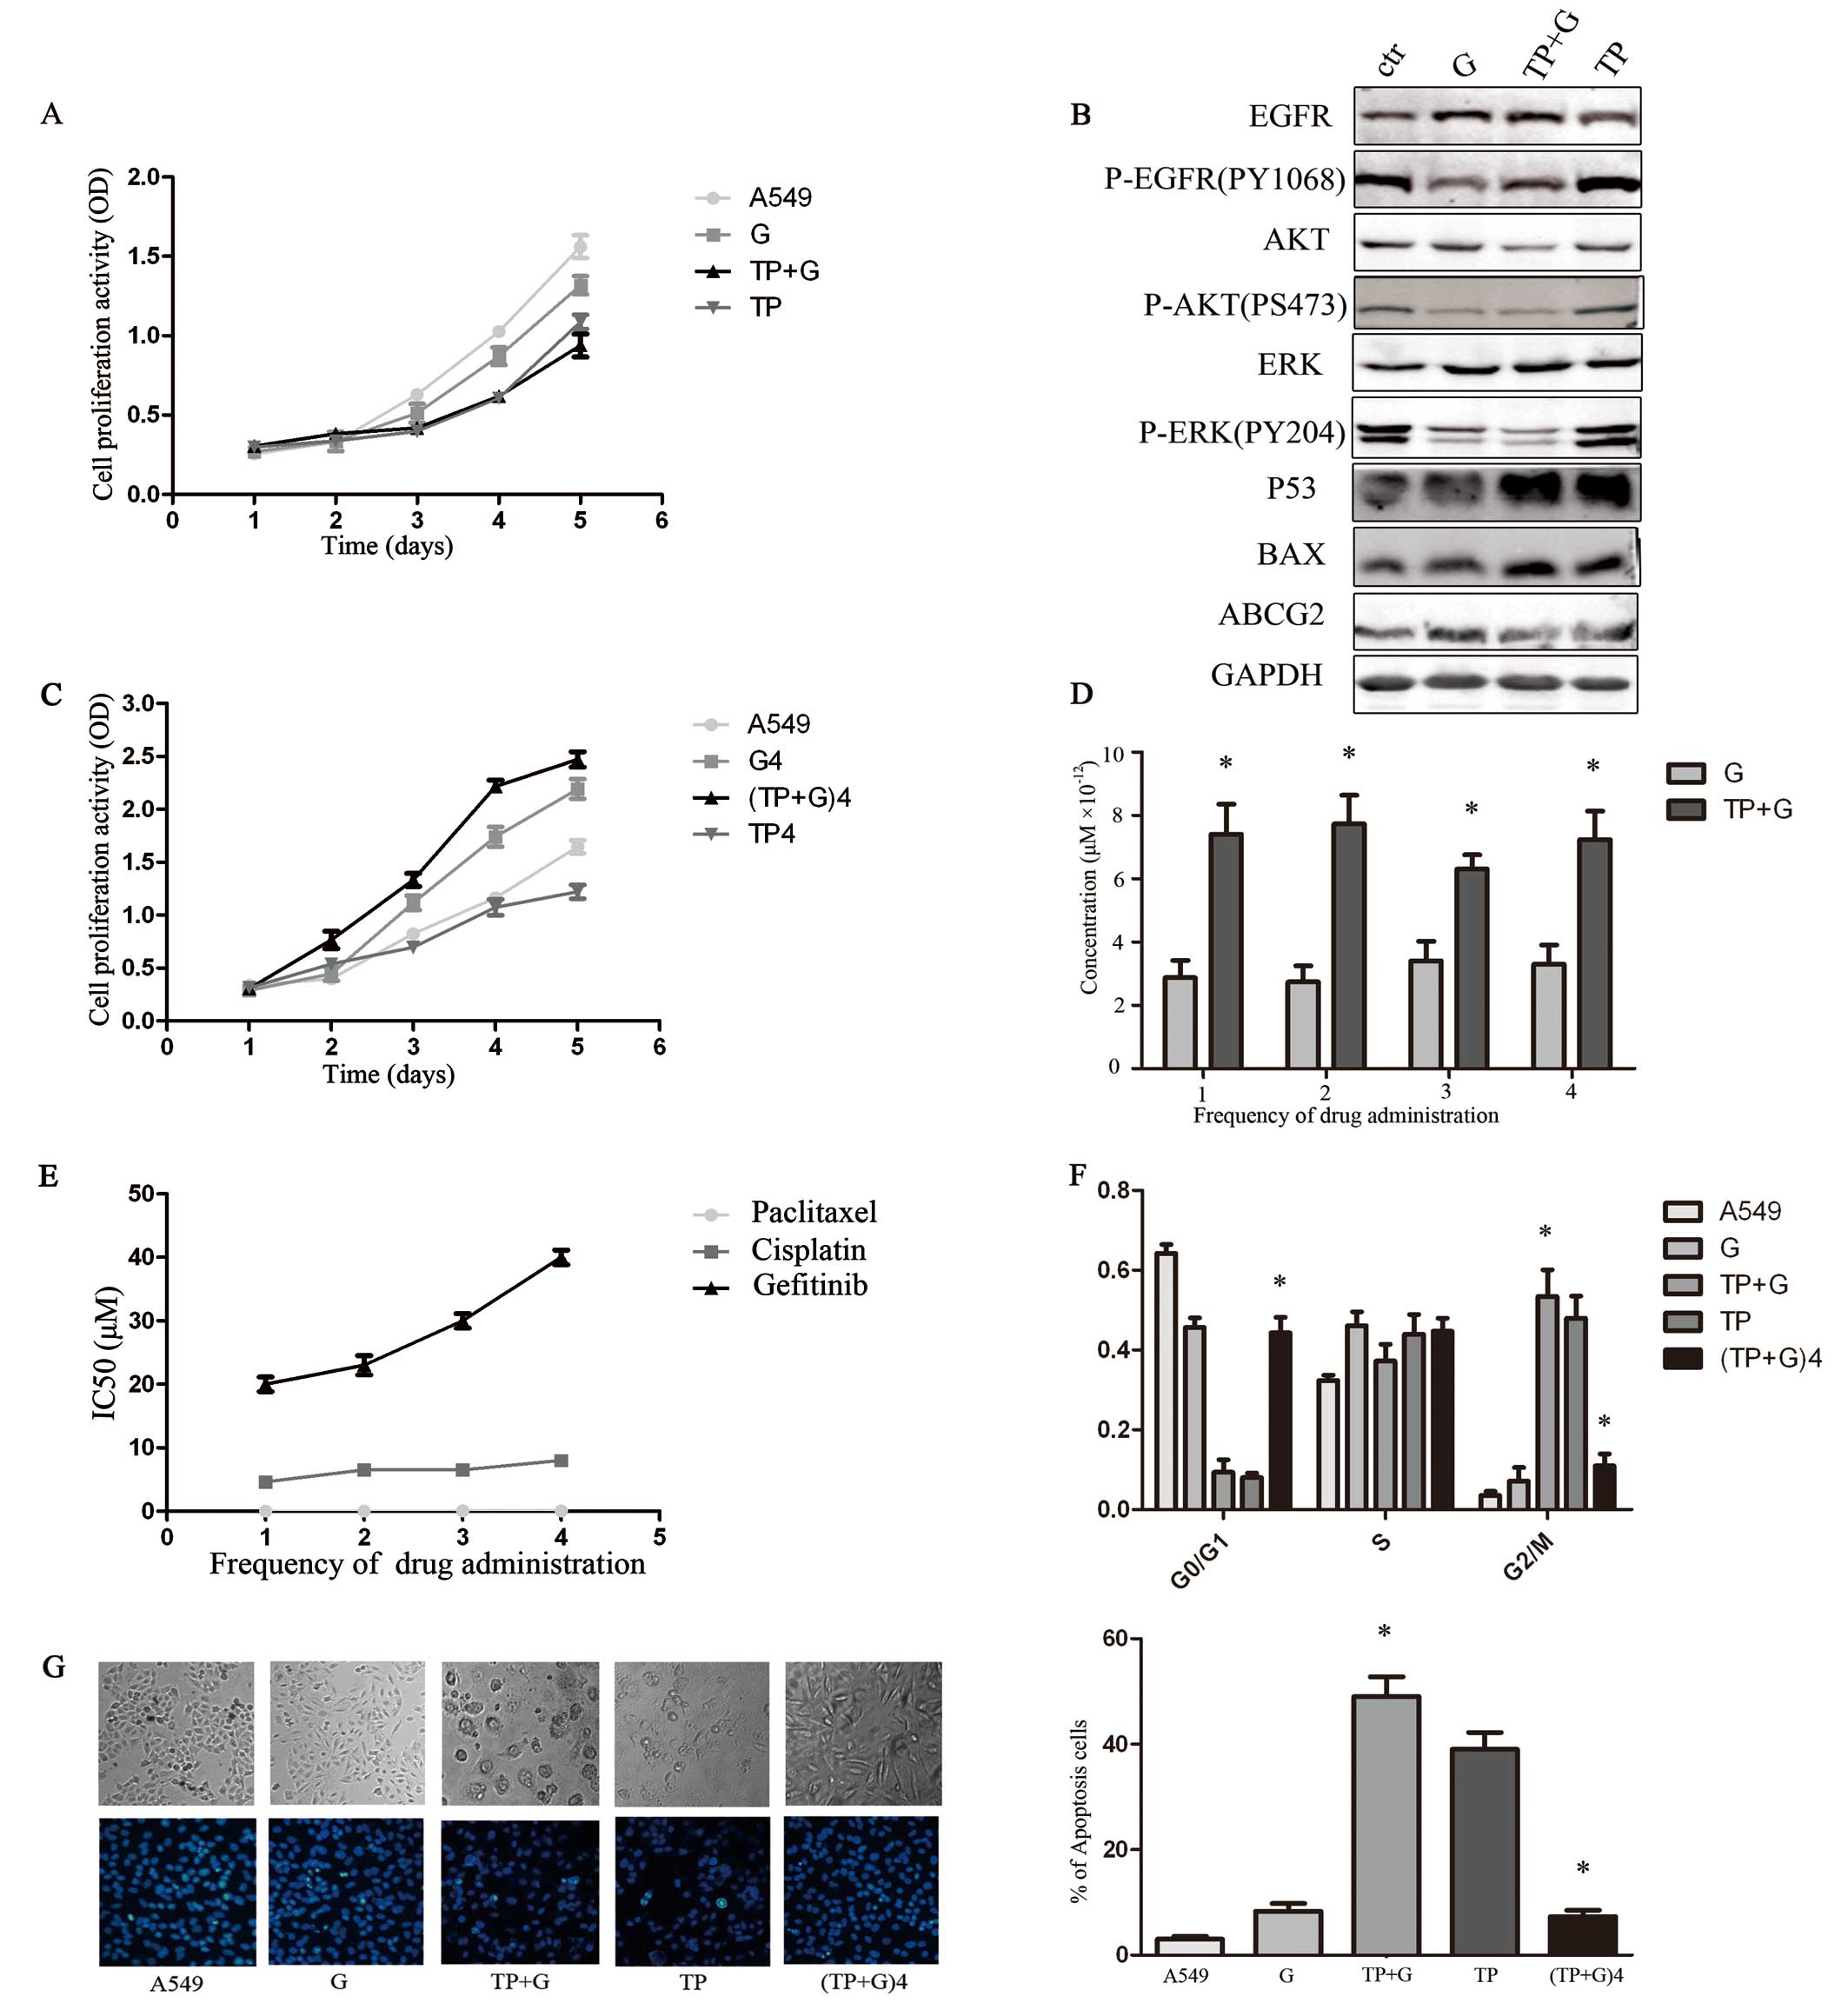 | Figure 2Effect of different drug treatments on
NSCLC A549 cells following 4 treatments. Values are expressed as
the means ± SEM at each time-point and represent three individual
experiments. (TP+G)4, the fourth TP and gefitinib treatment group.
(A) CCK-8 assay of the growth-inhibitory effect of different
treatments on the various groups including A549 (control), G
(gefitinib), TP+G (paclitaxel, cisplatin and gefitinib) and TP. The
control group exhibited the most rapid proliferation rate while the
TP+G group had the slowest. (B) Different protein levels in the
cells were detected by western blotting. Compared with the control
and TP group, the expression levels of P-EGFR, P-AKT and P-ERK
proteins were decreased in the G and TP+G groups, while p53 and BAX
were increased in the TP and TP+G groups. (C) Cell proliferation
was analyzed after the fourth drug treatments. After the fourth
drug treatment, cells in the (TP+G)4 group exhibited an increased
growth rate (p<0.05). (D) Cellular gefitinib concentration was
significantly higher in the TP+G group when compared with that in
the G group (*p<0.05). (E) The IC50 value
of paclitaxel, cisplatin and gefitinib after each treatment in the
TP+G group. After the fourth drug treatment, cells in the (TP+G)4
group exhibited improved gefitinib IC50 values
(p<0.05). Results are the average of duplicate experiments. (F)
Cells in the TP+G group exhibited cell cycle arrest in the G2/M
phase (p<0.05), compared with the G and control groups.
Following the time extension, cell cycle in the fourth treatment
(TP+G)4 group was arrested in the G0/G1 phase (p>0.05), compared
with the control group. (G) Hoechst staining images of cells. The
percentage of Hoechst-positive cells were counted as apoptotic. The
TP+G group showed an increase in apoptosis compared with the
control, G and TP groups (*p<0.05). The fourth time
(TP+G)4 treatment group showed a decrease in the percentage of
apoptotic cells when compared with the TP+G treatment group
(*p<0.05). |
Protein levels of P-IGF-1R, P-SRC and
P-ERK in the fourth (TP+G) treatment group are significantly
increased (Fig. 3)
The expression of cell growth-associated proteins
was detected after the fourth drug treatment. The levels of P-EGFR,
P-IGF-1R, P-SRC and P-ERK were higher in the fourth treatment
(TP+G)4 group than these levels in the control group and the fourth
G4 treatment group. The results of P-HER2, P-MET, P-PTEN are not
shown due to the absence of expression in the three groups.
IGF-IR mediates drug resistance in the
late combination treatment group
We aimed to determine the molecular mechanism by
downregulating expression of IGF-1R and SRC in the fourth (TP+G)4
treatment group. Results showed that cell proliferation was
inhibited (Fig. 4C), and the levels
of P-AKT, P-ERK, P-SRC were reduced after IGF-1R silencing with
specific siRNA (Fig. 4A). Moreover,
the percentage of cell apoptosis increased following exposure to
gefitinib (Fig. 4B). However, all
these changes were not observed after SRC was inhibited by
saratinib.
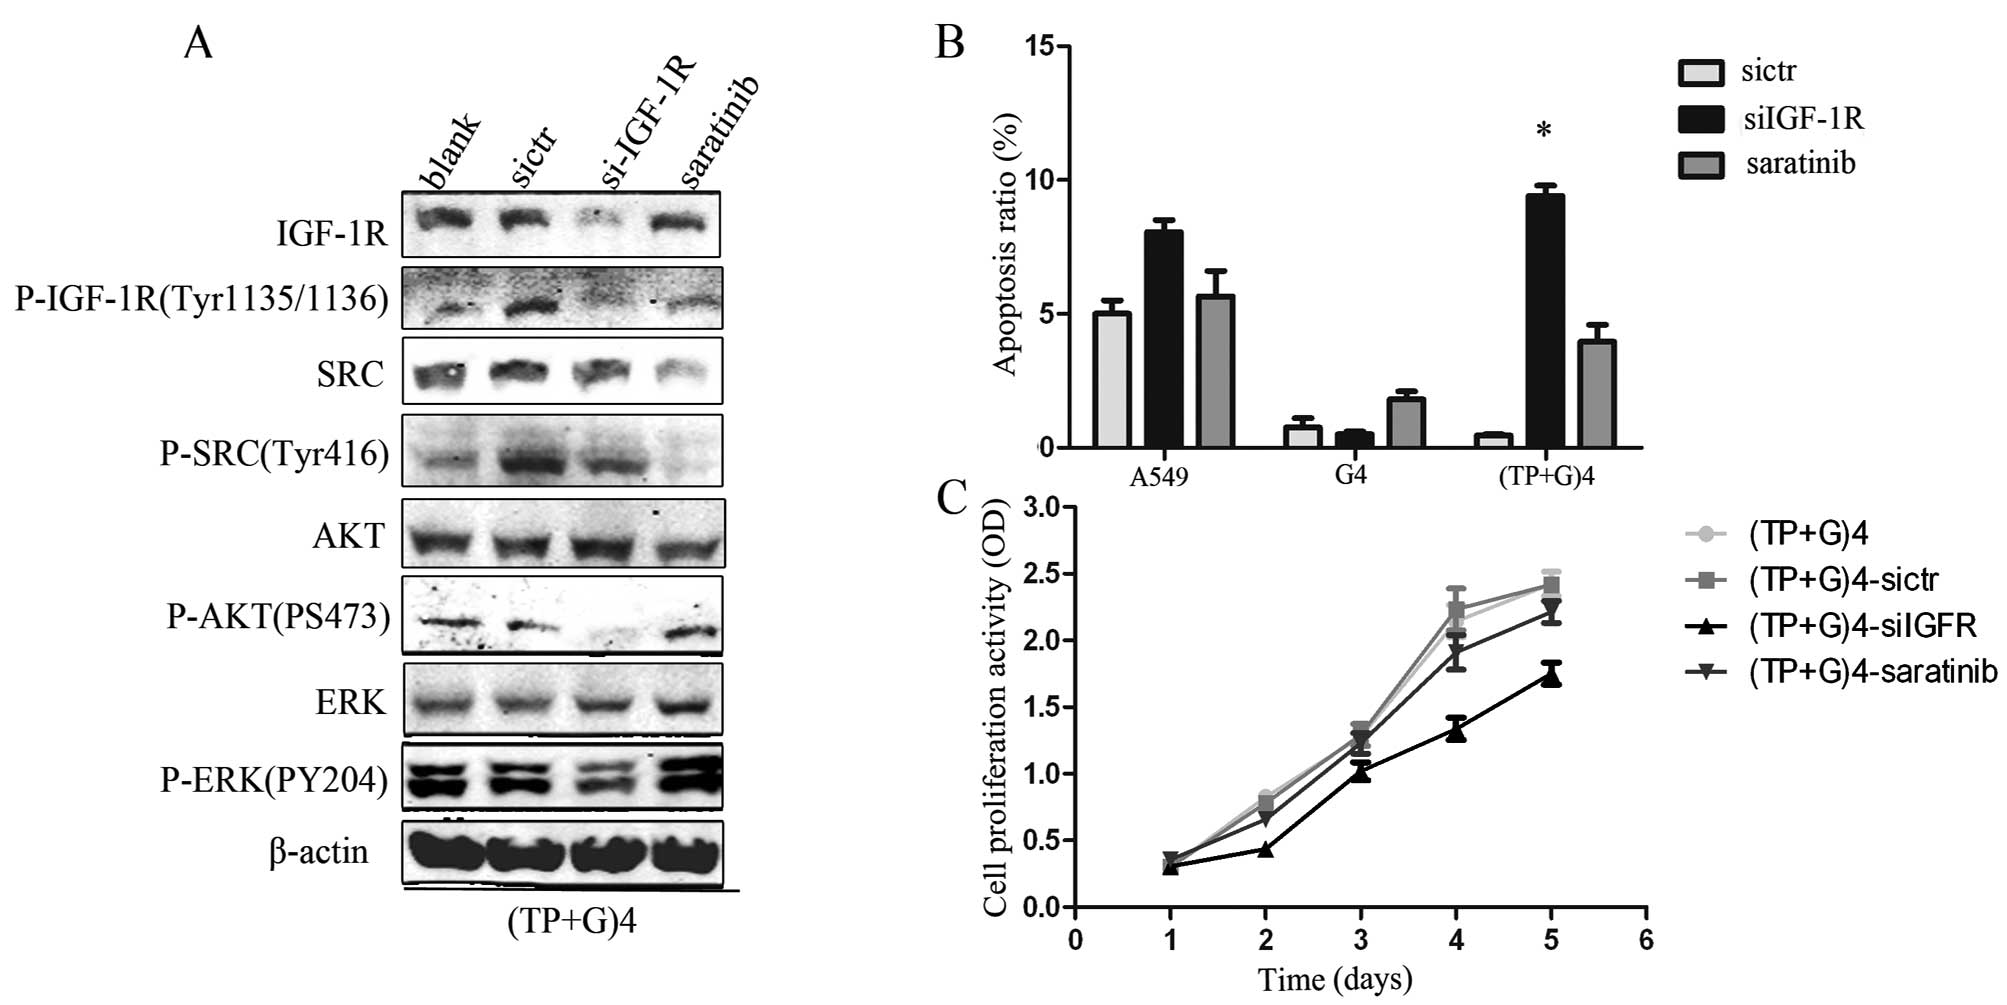 | Figure 4IGF-IR induces drug resistance in the
fourth TP+G treatment group. Data represents the means ± SEM (n=3).
(A) IGF-1R and SRC expression in the (TP+G)4 group was determined.
A549 cells were transfected with sicontrol (sictr), siIGF-1R and
SRC inhibitor (5 nM, saratinib). Following downregulation of IGF-1R
with siRNA, the levels of P-AKT, P-ERK, P-SRC were reduced in the
(TP+G)4-A549 cells. β-actin was used as a loading control. (B)
A549, G4-A549 and (TP+G)4 group cells were treated with sictr,
siIGF-1R and saratinib for 48 h, respectively. Gefitinib (24 μM)
was then added to continue culture for 24 h. Cell apoptosis was
increased in the (TP+G)4-siIGF-1R cells (*p<0.05)
compared with the control and saratinib-treated cells. (C) (TP+G)4
A549 cells were separately treated by sictr, siIGF-1R and saratinib
and then analyzed by CCK-8 for cell proliferation. After
downregulation of IGF-1R, cells in the (TP+G)4 group exhibited a
decreased growth rate (p<0.05). |
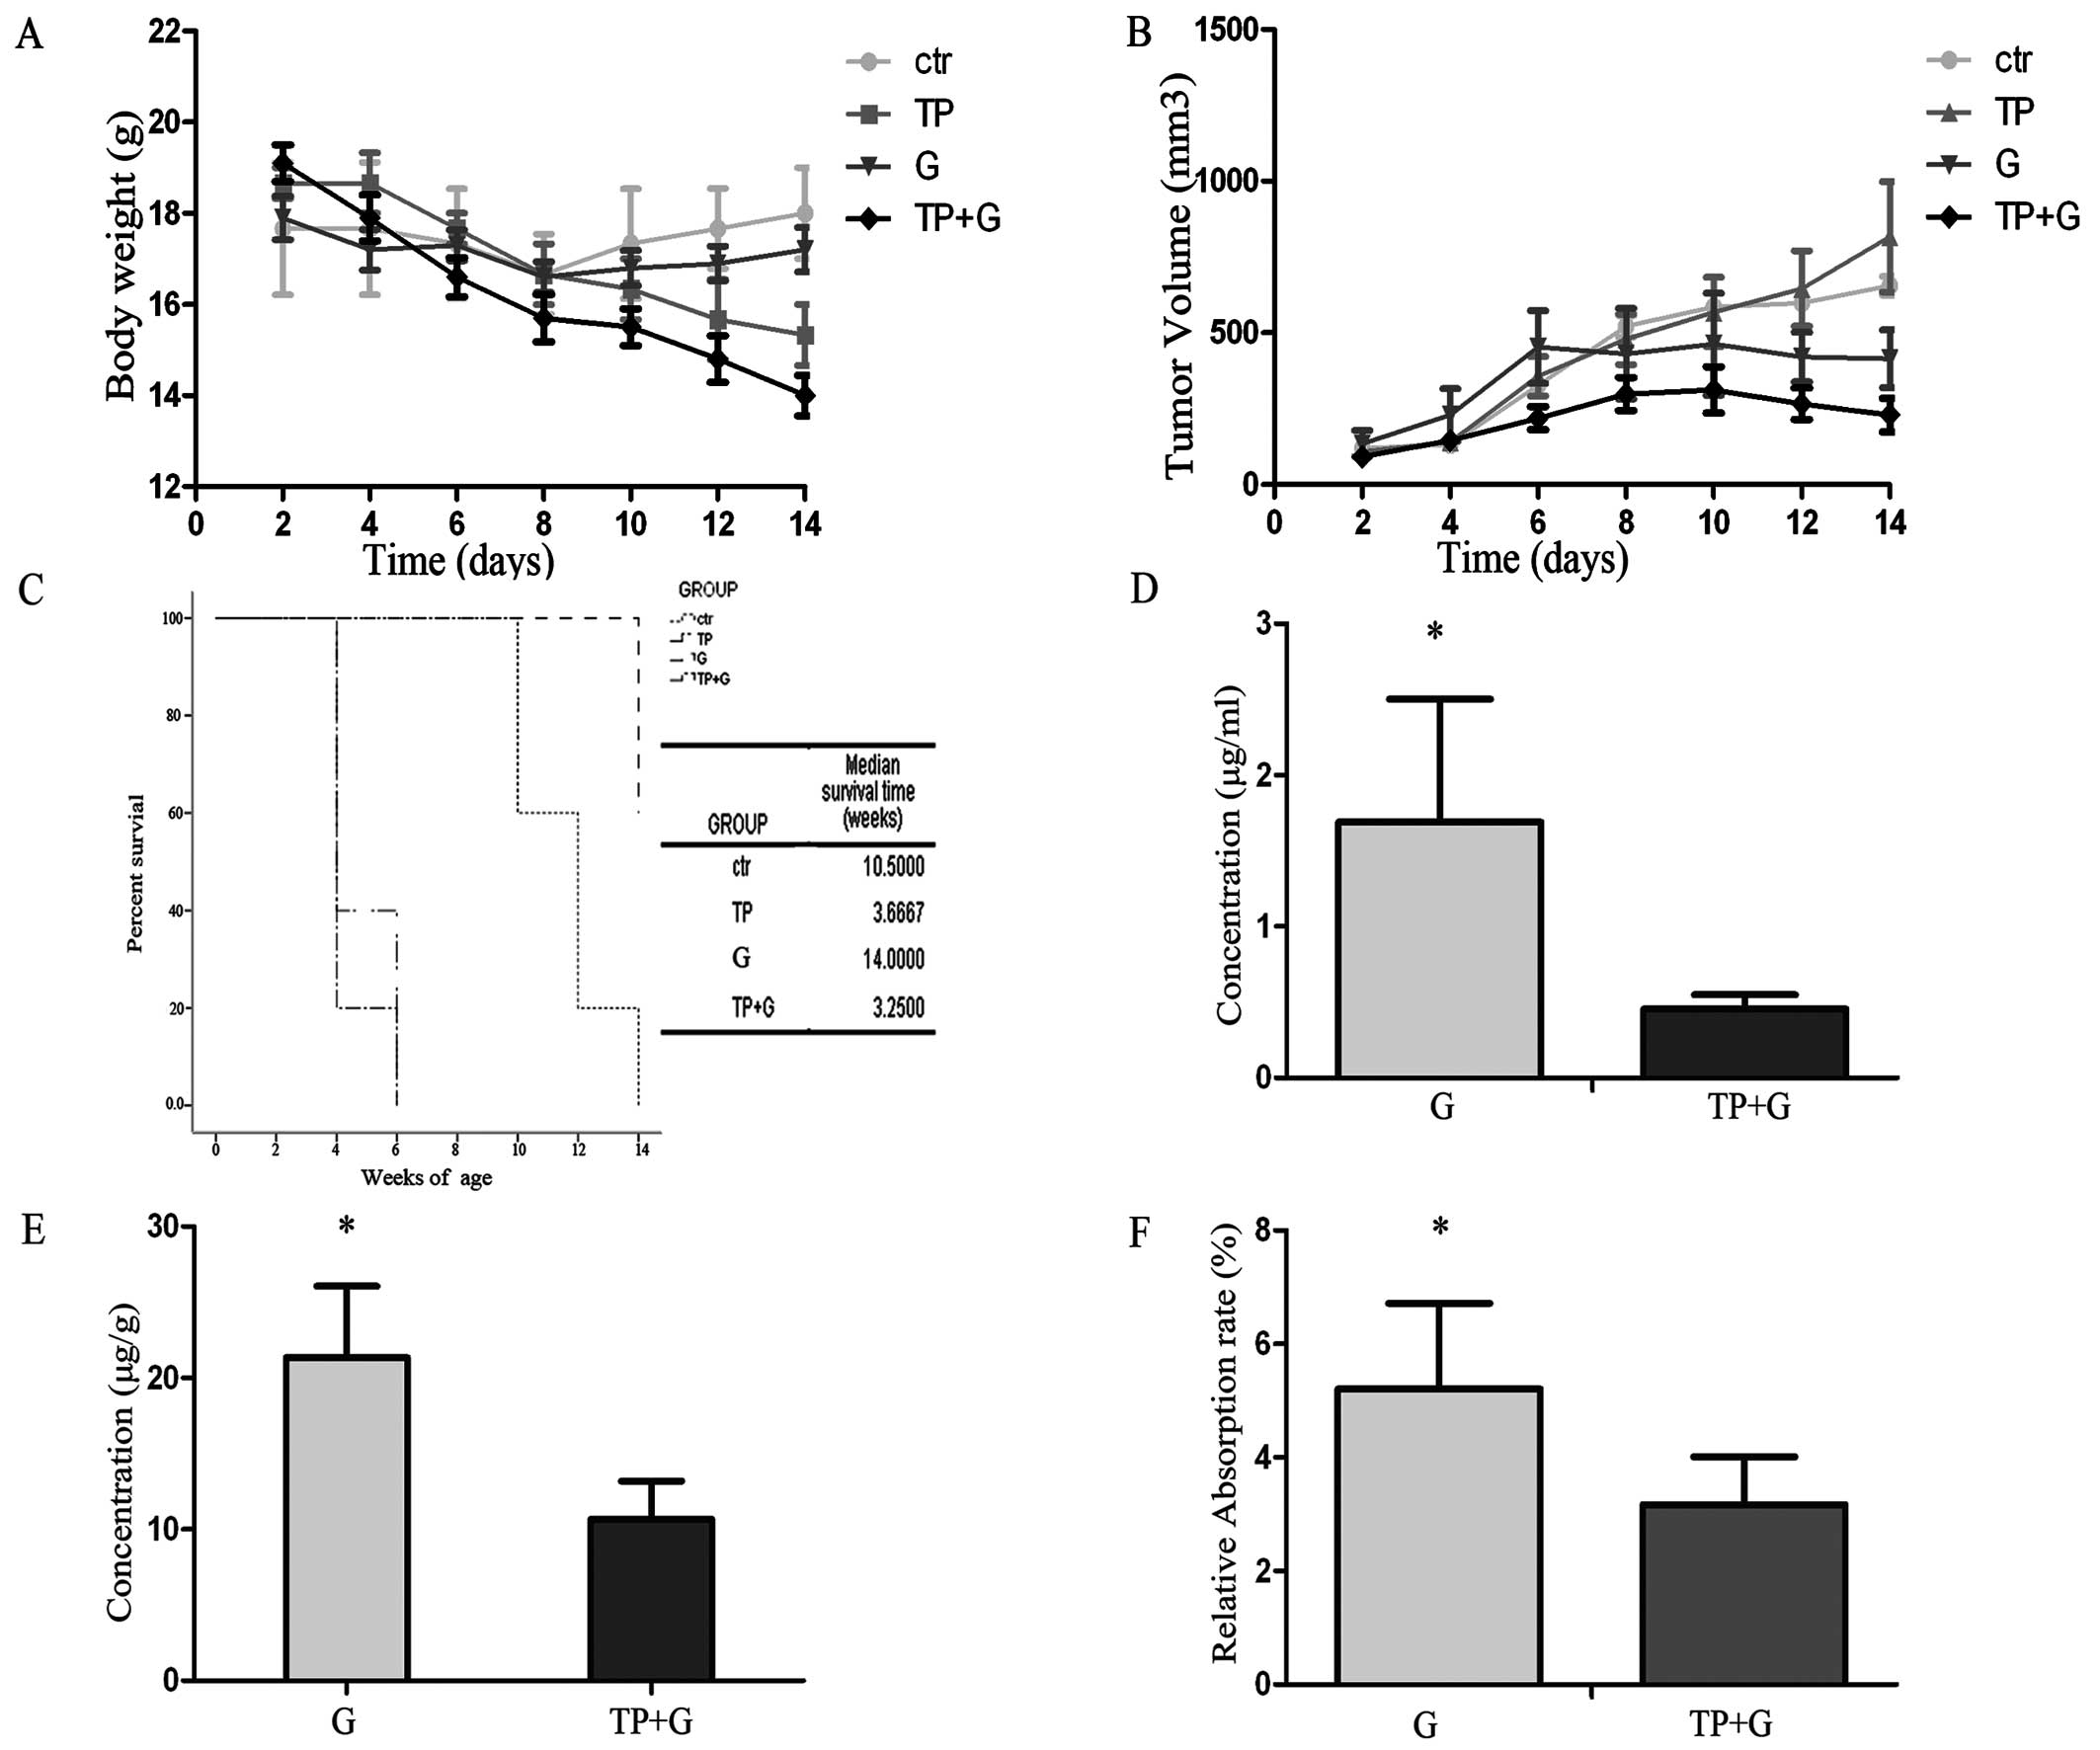
TP+G treatment fails in the lung cancer
mouse model
The TP+G group exhibited a significant reduction in
tumor volume and mouse body weight when compared to the other
groups (Fig. 5A and B). The tumor
inhibitory rate (IR) in the TP+G group was 52.7%, and this rate in
the G group was 34.28%. However, the body weight of mice in the
TP+G treatment group was markedly decreased. Additionally, this
group exhibited poor body condition and the shortest survival time
(Fig. 5C). The concentrations of
gefitinib in the serum and tumor tissues were measured by HPLC. The
gefitinib concentrations in the serum and tumor tissues were higher
in the gefitinib alone group when compared to the concentrations in
the combination therapy group (Fig. 5D
and E). The gefitinib relative absorption rate was calculated
according to the following formula: Relative absorption rate =
(gefitinib concentration in the serum)/(gefitinib concentration in
the tumor tissue). The relative absorpion rate in the G group was
higher than that in the TP+G group (Fig. 5F).
In the course of treatment, there was no
mutation in 18, 19, 20, 21 exons of EGFR as determined by
sequencing
During the treatment period, we extracted total DNA
from A549, G4-A549, (TP+G)4-A549, cells designed and synthesized
the primers for EGFR exons 18, 19, 20 and 21. Mutation analysis was
performed by direct sequencing of the four exons. No mutation was
detected throughout the treatment process.
Discussion
The present study results demonstrated that the use
of a combination treatment (chemotherapy + gefitinib) resulted in a
failed antitumor effect in vitro and in vivo. In the
in vitro studies, the gefitinib concentration in the cells
was significantly higher in the paclitaxel + cisplatin + gefitinib
(TP+G) group than that in the G group. Following the treatment time
extension, the TP+G treatment increased the cell viability while
the cellular concentration of gefitinib was not reduced. In the
A549 xenograft model, the gefitinib concentrations in the G group
in the serum and tumor tissues of the nude mice were higher than
these levels in the combination therapy group. However, the body
weight of mice in the TP+G group was markedly decreased with a poor
condition and the shortest survival time. Previous studies on the
combination of gefitinib and chemotherapy for initial treatment of
advanced NSCLC also found the failure for an improved response or
prolonged survival over chemotherapy alone (20). Similar results were also reported in
animal models (21,22). In regards to the failed combination
therapy, we hypothesized that the possible reason may be that the
chemotherapy drugs disturbed the cell membrane transport of
gefitinib consequently resulting in failure. A previous study
reported that one mechanism for resistance to EGFR-TKI is
associated with the downregulation of ABCG2 expression (23). In the present study, the results did
not demonstrate a decrease in the expression of ABCG2 following the
combination therapy. Furthermore, several studies have reported
that EGFR mutations or amplification can identify patients more
likely to benefit or cause drug-resistance from gefitinib
monotherapy (7,24,25).
To dismiss these confounding factors, including EGFR mutations, a
high EGFR copy number, we chose the A549 cell line which is known
to be EFGRWT. Moreover, a fluorescent derivative of
Tasigna was synthesized to study the cellular Tasigna concentration
(26). However, the fluorescent
derivative of Tasigna has a lower efficiency that could be
attributed to the structural alteration of the molecule, resulting
in decreased affinity to its target. The isotope derivative has the
same problem. In this study, we established an HPLC method for
determination of the content of gefitinib in the A549 cells.
In the in vivo studies, the gefitinib
concentration in the gefitinib group in the serum and tumor tissues
of nude mice were higher than these levels in the combination
therapy group. The major human P450 enzyme involved in the
metabolism of gefitinib is CYP3A4, demonstrating that CYP3A4 is
primarily responsible for the overall metabolism of gefitinib.
However, in the present study, there were no significant
differences in CYP3A4 protein expression in the liver tissues of
the nude mice. The results of such an analysis may be explained by
the fact that the chemotherapy seriously affected the
gastrointestinal function in the nude mice, resulting in a
reduction in gefitinib absorption, which eventually led to a higher
gefitinib concentration of serum and tumor tissues in the gefitinib
alone group. In addition, metabolism of gefitinib was fairly rapid
and complex (27). The content of
gefitinib could not be detected for >3 h by HPLC. Following
treatment of gefitinib, the mice were sacrificed no later than 2 h
afterwards and the gefitinib concentration was immediately detected
in the serum and tumor tissues. Although there are many reasons for
the failed combination therapy in vivo, decreased gefitinib
concentration in serum and tumor tissues could also have been a
reason.
For the in vitro assay, following the first
three treatments, the combination group demonstrated an obviously
inhibitory effect on cell proliferation compared to gefitinib
monotherapy. However, this effect was reversed after the fourth
treatment. Further analysis of the protein expression found that
levels of P-EGFR, P-IGF-1R, P-SRC and P-ERK were higher in the
fourth TP+G group than levels in the the fourth gefitinib alone
treatment and control groups. A previous study reported that SRC
can activate EGFR in colorectal cancer cell lines, and EGFR
overexpression is correlated with SRC activation (28). Through transactivation, as described
above, it appears that the effect of EGFR on tumorigenesis extends
beyond ligand-mediated effects. However, in the present study, we
were unable to detect any effect of SRC. Studies have found that
IGF-1R also activates P-AKT and P-ERK leading to increased cell
growth. By downregulating the expression of IGF-1R in the fourth
TP+G treatment group, drug resistance was successfully reversed.
Thus, we conclude that IGF-1R activation contributed to the drug
resistance in the fourth TP+G group. IGF-1R activation resulted in
a marked phosphorylation level of ERK and Akt. Both of them
transduce signals that trigger a cascade of cell viability
responses. The signals involved in cell growth possibily reversed
the effects of the high cellular concentration of gefitinib
resulting in final failure of the combination treatment. IGF-1R is
a transmembrane TK receptor which is activated by binding of its
ligands IGF-I and IGF-II. Extensive studies have established that
the receptor signaling plays an important role in tumorigenesis,
metastatic potential of tumor cells and neoplastic growth (29). The consequences of IGF-1R activation
by its ligands result in the recruitment of major adapter signaling
proteins which lead to interaction with Grb/SOS and ultimately
RAS/MAPK (ERK) signaling cascades and PI3-kinase/AKT activation
(30). Evidence suggests that
IGF-1R plays a role in maintaining the malignant phenotype
(31), and disruption of IGF-IR
activation has been shown to inhibit growth and motility of a wide
range of cancer cells in vitro and in mouse models (32). In our study, we first reported that
frequent use of the combined treatment with chemotherapy and
gefitinib in the A549 cell line induced IGF-1R activation which
resulted in the failed treatment. Furthermore, through paclitaxel,
cisplatin, gefitinib, paclitaxel + cisplatin (TP) and (TP+G)
separately stimulated, we confirmed that the treatment schedules of
TP+G caused IGF-1R activation. Although IGF-1R activation normally
requires the presence of insulin-like growth factor-1, there is
some precedent for IGF-1R activation without its cognate ligand
(33).
In summary, the combination therapy (TP+G) appears
to be ineffective for NSCLC treatment. In the in vivo assay,
decreased gefitinib concentrations in the serum and tumor tissues
could have been a reason for the failure of the combination
therapy. More importantly, frequent use of the combination
treatment in A549 lung cancer cells induced IGF-1R activation which
contributed to gefitinib resistance and gave rise to the failure of
the combination therapy. Although the exact molecular mechanism of
IGF-1R activation remains unclear, the present study provides
foundation for further study concerning the IGF activation
pathway.
Acknowledgements
This study was supported by the National Natural
Science Foundation of China (nos. 81071640 and 81000877), and the
National Basic Research Program of China (no. 2011CB935800). The
authors are grateful to all study participants.
Abbreviations:
|
EGF
|
epidermal growth factor
|
|
EGFR
|
epidermal growth factor receptor
|
|
IGF-1R
|
insulin-like growth factor receptor
1
|
|
G
|
gefitinib monotherapy
|
|
TP
|
paclitaxel + cisplatin
|
|
TP+G
|
paclitaxel + cisplatin + gefitinib
|
|
G4
|
the fourth gefitinib treatment
|
|
(TP+G)4
|
the fourth TP and gefitinib
treatment
|
|
HPLC
|
high performance liquid
chromatography
|
References
|
1
|
Jemal A, Siegel R, Ward E, et al: Cancer
statistics, 2008. CA Cancer J Clin. 58:71–96. 2008. View Article : Google Scholar
|
|
2
|
Mendelsohn J and Baselga J: The EGF
receptor family as targets for cancer therapy. Oncogene.
19:6550–6565. 2000. View Article : Google Scholar : PubMed/NCBI
|
|
3
|
de Bono JS and Rowinsky EK: The ErbB
receptor family: a therapeutic target for cancer. Trends Mol Med.
8(Suppl 4): S19–S26. 2002.PubMed/NCBI
|
|
4
|
Woodburn JR: The epidermal growth factor
receptor and its inhibition in cancer therapy. Pharmacol Ther.
82:241–250. 1999. View Article : Google Scholar : PubMed/NCBI
|
|
5
|
Gadducci A, Cosio S and Genazzani AR: Old
and new perspectives in the pharmacological treatment of advanced
or recurrent endometrial cancer: hormonal therapy, chemotherapy and
molecularly targeted therapies. Crit Rev Oncol Hematol. 58:242–256.
2006. View Article : Google Scholar
|
|
6
|
Nakagawa K, Tamura T, Negoro S, et al:
Phase I pharmacokinetic trial of the selective oral epidermal
growth factor receptor tyrosine kinase inhibitor gefitinib
(‘Iressa’, ZD1839) in Japanese patients with solid malignant
tumors. Ann Oncol. 14:922–930. 2003.
|
|
7
|
Fukuoka M, Yano S, Giaccone G, et al:
Multi-institutional randomized phase II trial of gefitinib for
previously treated patients with advanced non-small-cell lung
cancer. J Clin Oncol. 21:2237–2246. 2003. View Article : Google Scholar : PubMed/NCBI
|
|
8
|
Natale R, Skarin A, Maddox A, et al:
Improvement in symptoms and quality of life for advanced
non-small-cell lung cancer patients receiving ZD1839 (‘Iressa’) in
IDEAL 2. Proc Am Soc Clin Oncol. 21:292a2002.
|
|
9
|
Rivera F, Vega-Villegas ME and López-Brea
MF: Cetuximab, its clinical use and future perspectives. Anticancer
Drugs. 19:99–113. 2008. View Article : Google Scholar : PubMed/NCBI
|
|
10
|
Pirker R, Pereira JR, Szczesna A, et al:
Cetuximab plus chemotherapy in patients with advanced
non-small-cell lung cancer (FLEX): an open-label randomised phase
III trial. Lancet. 373:1525–1531. 2009. View Article : Google Scholar : PubMed/NCBI
|
|
11
|
Kris MG, Natale RB, Herbst RS, et al:
Efficacy of gefitinib, an inhibitor of the epidermal growth factor
receptor tyrosine kinase, in symptomatic patients with non-small
cell lung cancer: a randomized trial. JAMA. 290:2149–2158. 2003.
View Article : Google Scholar : PubMed/NCBI
|
|
12
|
Franceschi E, Cavallo G, Lonardi S, et al:
Gefitinib in patients with progressive high-grade gliomas: a
multicentre phase II study by Gruppo Italiano Cooperativo di
Neuro-Oncologia (GICNO). Br J Cancer. 96:1047–1051. 2007.
View Article : Google Scholar : PubMed/NCBI
|
|
13
|
Salzberg M, Rochlitz C, Morant R, et al:
An open-label, noncomparative phase II trial to evaluate the
efficacy and safety of docetaxel in combination with gefitinib in
patients with hormone-refractory metastatic prostate cancer.
Onkologie. 30:355–360. 2007. View Article : Google Scholar
|
|
14
|
Small EJ, Fontana J, Tannir N, et al: A
phase II trial of gefitinib in patients with non-metastatic
hormone-refractory prostate cancer. BJU Int. 100:765–769. 2007.
View Article : Google Scholar : PubMed/NCBI
|
|
15
|
Goncalves A, Fabbro M, Lhommé C, et al: A
phase II trial to evaluate gefitinib as second- or third-line
treatment in patients with recurring locoregionally advanced or
metastatic cervical cancer. Gynecol Oncol. 108:42–46. 2008.
View Article : Google Scholar : PubMed/NCBI
|
|
16
|
Giaccone G, González-Larriba J, Van
Oosterom A, et al: Combination therapy with gefitinib, an epidermal
growth factor receptor tyrosine kinase inhibitor, gemcitabine and
cisplatin in patients with advanced solid tumors. Ann Oncol.
15:831–838. 2004. View Article : Google Scholar : PubMed/NCBI
|
|
17
|
Giaccone G, Herbst RS, Manegold C, et al:
Gefitinib in combination with gemcitabine and cisplatin in advanced
non-small-cell lung cancer: a phase III trial - INTACT 1. J Clin
Oncol. 22:777–784. 2004. View Article : Google Scholar : PubMed/NCBI
|
|
18
|
Breathnach OS, Freidlin B, Conley B, et
al: Twenty-two years of phase III trials for patients with advanced
non-small-cell lung cancer: sobering results. J Clin Oncol.
19:1734–1742. 2001.PubMed/NCBI
|
|
19
|
McKillop D, Partridge EA, Hutchison M, et
al: Pharmacokinetics of gefitinib, an epidermal growth factor
receptor tyrosine kinase inhibitor, in rat and dog. Xenobiotica.
34:901–915. 2004. View Article : Google Scholar
|
|
20
|
Herbst RS, Giaccone G, Schiller JH, et al:
Gefitinib in combination with paclitaxel and carboplatin in
advanced non-small-cell lung cancer: a phase III trial - INTACT 2.
J Clin Oncol. 22:785–794. 2004. View Article : Google Scholar : PubMed/NCBI
|
|
21
|
Ciardiello F, Caputo R, Bianco R, et al:
Antitumor effect and potentiation of cytotoxic drugs activity in
human cancer cells by ZD-1839 (Iressa), an epidermal growth factor
receptor-selective tyrosine kinase inhibitor. Clin Cancer Res.
6:2053–2063. 2000.
|
|
22
|
Sirotnak FM, Zakowski MF, Miller VA, Scher
HI and Kris MG: Efficacy of cytotoxic agents against human tumor
xenografts is markedly enhanced by coadministration of ZD1839
(Iressa), an inhibitor of EGFR tyrosine kinase. Clin Cancer Res.
6:4885–4892. 2000.PubMed/NCBI
|
|
23
|
Ohtsuka K, Ohnishi H, Morii T, et al:
Downregulated ABCG2 enhances sensitivity to topoisomerase I
inhibitor in epidermal growth factor receptor tyrosine kinase
inhibitor-resistant non-small cell lung cancer. J Thorac Oncol.
5:1726–1733. 2010. View Article : Google Scholar : PubMed/NCBI
|
|
24
|
Cohen MH, Williams GA, Sridhara R, Chen G
and Pazdur R: FDA drug approval summary: gefitinib (ZD1839)
(Iressa®) tablets. Oncologist. 8:303–306. 2003.
View Article : Google Scholar : PubMed/NCBI
|
|
25
|
Miller VA, Kris MG, Shah N, et al:
Bronchioloalveolar pathologic subtype and smoking history predict
sensitivity to gefitinib in advanced non-small-cell lung cancer. J
Clin Oncol. 22:1103–1109. 2004. View Article : Google Scholar : PubMed/NCBI
|
|
26
|
Shukla S, Skoumbourdis AP, Walsh MJ, et
al: Synthesis and characterization of a BODIPY conjugate of the
BCR-ABL kinase inhibitor Tasigna (nilotinib): evidence for
transport of Tasigna and its fluorescent derivative by ABC drug
transporters. Mol Pharm. 8:1292–1302. 2011. View Article : Google Scholar : PubMed/NCBI
|
|
27
|
McKillop D, McCormick A, Miles GS, et al:
In vitro metabolism of gefitinib in human liver microsomes.
Xenobiotica. 34:983–1000. 2004. View Article : Google Scholar : PubMed/NCBI
|
|
28
|
Osherov N and Levitzki A:
Epidermal-growth-factor-dependent activation of the src-family
kinases. Eur J Biochem. 225:1047–1053. 1994. View Article : Google Scholar : PubMed/NCBI
|
|
29
|
Pollak M, Beamer W and Zhang JC:
Insulin-like growth factors and prostate cancer. Cancer Metastasis
Rev. 17:383–390. 1998. View Article : Google Scholar : PubMed/NCBI
|
|
30
|
Sachdev D and Yee D: The IGF system and
breast cancer. Endocr Relat Cancer. 8:197–209. 2001. View Article : Google Scholar
|
|
31
|
Pollak MN, Schernhammer ES and Hankinson
SE: Insulin-like growth factors and neoplasia. Nat Rev Cancer.
4:505–518. 2004. View
Article : Google Scholar : PubMed/NCBI
|
|
32
|
Baserga R: Targeting the IGF-1 receptor:
from rags to riches. Eur J Cancer. 40:2013–2015. 2004. View Article : Google Scholar : PubMed/NCBI
|
|
33
|
Frattali A and Pessin J: Relationship
between α subunit ligand occupancy and β subunit
autophosphorylation in insulin/insulin-like growth factor-1 hybrid
receptors. J Biol Chem. 268:7393–7400. 1993.
|