Introduction
Osteosarcoma (OS) is the most common type of primary
malignant bone tumor and generally follows an aggressive clinical
course (1). Although a 5-year
survival rate of up to 50–70% can be achieved by using current
treatment protocols, a substantial group of patients with
metastatic, recurrent and/or refractory disease remains without
effective treatment options (2). A
tumor is a genetic disease, which develops via a multi-step
process. Multiple mutations in genes related to growth control,
invasion and metastasis form the molecular genetic basis of
malignant transformation and tumor progression (3). Therefore, identification of target
genes involved in tumorigenesis is critical for the treatment of
OS.
Galectins constitute a family of 15 mammalian
galactoside-binding proteins that share a consensus amino acid
sequence in their carbohydrate binding sites. They are
multi-functional molecules and are expressed widely in human tumor
tissues. GAL1, 3, 4, 7 and 8 are expressed in human colorectal and
tongue cancer, and their expression correlates with alterations in
cancer cell growth, apoptosis and cell-matrix interactions and
angiogenesis, suggesting their use as biomarkers of tumor
progression (4,5). In addition, serum GAL2, 4 and 8 are
greatly increased in colon and breast cancer patients and promote
cancer cell adhesion to blood vascular endothelium (6). Proteomic analysis identified GAL1 as a
predictive biomarker in classic Hodgkin lymphoma (7) and nasopharyngeal carcinoma (8).
With respect to GAL1-mediated pro-oncogene effects,
it has been shown that GAL1 promotes hepatocellular carcinoma cell
adhesion, polarization and in vivo tumor growth, with
critical implications in liver pathophysiology (9). The expression and secretion of GAL1
can further contribute to the proliferation and invasion of
pancreatic cancer cells. GAL1 may provide a novel candidate target
for pancreatic cancer (10).
Interestingly, the galectin-binding ability of a glycoprotein is
not only a promising biomarker candidate but also may be related to
the pathophysiological state of the patient (11). In addition, the interaction between
cancer cells and their microenvironment is a vicious cycle that
enhances the survival and progression of cancer, resulting in
metastasis. Lung cancer-derived GAL1 was found to enhance
tumorigenesis of tumor-associated dendritic cells by expressing
heparin-binding EGF-like growth factor (12). GAL1 also functions as a major
glycome determinant regulating Th cell development, inflammation
and tumor immunity (13).
More importantly, the clinical management of OS
differs significantly from that of chondrosarcoma, and it is
extremely important to diagnose these two types of bone tumors
accurately. Fortunately, GAL1 has been indicated as a powerful
diagnostic marker that distinguishes chondroblastic OS from
conventional chondrosarcomas (14).
Upregulation of GAL1 may be one of the important mechanisms of
bitumen-induced carcinogenic potential in human OS cells (15). However, to date, little attention
has been devoted to the role and molecular mechanisms of GAL1 in
the tumorigenesis of OS. Thus, in the present study, we
investigated the expression of GAL1 protein in human OS using
immunohistochemical (IHC) assay through a tissue microarray
procedure, and explored the effects of shRNA-mediated GAL1
knockdown on the proliferative activities, invasive potential, cell
apoptosis and cycle distribution in OS cells in vitro and
in vivo.
Materials and methods
Materials
The human OS (MG-63 and U-2 OS) cell lines used in
the experiments were from the Institute of Biochemistry and Cell
Biology (Shanghai, China). Lentiviral-mediated GAL1 shRNA
(Lv-shGAL1) vector, negative control vector and virion-packaging
elements were from GeneChem (Shanghai, China). The primer of GAL1
was synthesized by ABI (Framingham, MA, USA). All antibodies used
were purchased from Cell Signaling Technologies (Boston, MA,
USA).
Drugs and reagents
Dulbecco’s modified Eagle’s medium (DMEM) and fetal
bovine serum (FBS) were from Thermo Fisher Scientific Inc.
(Waltham, MA, USA); TRIzol reagent and Lipofectamine 2000 were from
Invitrogen (Carlsbad, CA, USA); M-MLV reverse transcriptase was
from Promega (Madison, WI, USA); SYBR-Green Master Mixture was from
Takara (Otsu, Japan). Cell apoptosis kit [propidium iodide (PI),
RNase A, Annexin V-FITC] was from KeyGen Biology (Nanjing, China).
The ECL-Plus kit was from GE Healthcare (Piscataway, NJ, USA).
Clinical samples and data
Human OS tissues and the corresponding adjacent
non-cancerous tissues (ANCT) were obtained from 30 consecutive
cases admitted to our hospital from January 2006 to December 2010.
The present study was approved by the Medical Ethics Committee of
Shanghai University of Traditional Chinese Medicine, and written
informed consent was obtained from the patients or their parents
before sample collection. Two pathologists respectively reviewed
all of the cases.
Immunohistochemical staining
GAL1 antibody was used for IHC detection of protein
expression in the tissue microarrays. GAL1 antibody was used at a
1:100 dilution. Endogenous peroxidase was inhibited by incubation
with freshly prepared 3% hydrogen peroxide with 0.1% sodium azide.
Non-specific staining was blocked with 0.5% casein and 5% normal
serum. Tissue microarrays were incubated with biotinylated
antibodies and horseradish peroxidase. Staining was developed with
diaminobenzidine substrate and sections were counterstained with
hematoxylin. Phosphate-buffered saline (PBS) replaced the GAL1
antibody in the negative controls. The expression of GAL1 was
semi-quantitatively estimated as the total immunostaining scores.
Expression of GAL1 in each specimen was scored according to the
percentage of positively stained cells counted in five randomly
selected high magnification fields: (−) no expression; (+) positive
cell ratio ≤25%; (++) positive cell ratio 26–50%; and (+++)
positive cell ratio >50%.
Cell culture and transfection
MG-63 and U-2 OS cells were cultured in DMEM
supplemented with 10% heat-inactivated FBS, 100 U/ml of penicillin
and 100 μg/ml of streptomycin. They were all placed in a humidified
atmosphere containing 5% CO2 at 37°C. Lv-shGAL1 and the
negative control virus were transfected into OS cells. Cells were
subcultured at a 1:5 dilution in 300 μg/ml G418-containing medium.
Positive stable transfectants were selected and expanded for
further study. The clone in which the Lv-shGAL1 vector was
transfected was named the Lv-shGAL1 group, and the negative control
vector transfected clone was named the NC group.
Quantitative real-time PCR
To quantitatively determine the mRNA expression
level of GAL1 in OS cell lines, real-time PCR was used. Total RNA
of each clone was extracted with TRIzol according to the
manufacturer’s protocol. Reverse-transcription was carried out
using M-MLV, and cDNA amplification was carried out using the
SYBR-Green Master Mix kit according to the manufacturer’s protocol.
The GAL1 gene was amplified using specific oligonucleotide primers,
and the human glyceraldehyde-3-phosphate dehydrogenase (GAPDH) gene
was used as an endogenous control. The PCR primer sequences were as
follows: GAL1, 5′-GCGTGGCTG CTGGGAGGTATC-3′ and
5′-GGAACAGAAAGACTCCA ATG-3′; β-actin, 5′-CAACGAATTTGGCT-ACAGCA-3′
and 5′-AGGGGTCTACATGGCAACTG-3′. Data were analyzed using the
comparative Ct method (2−ΔΔCt). Three separate
experiments were performed for each clone.
Western blot assay
OS cells were harvested and extracted using lysis
buffer (Tris-HCl, SDS, mercaptoethanol and glycerol). Cell extracts
were boiled for 5 min in loading buffer, and then equal amounts of
cell extracts were separated on 15% SDS-PAGE gels. Separated
protein bands were transferred into polyvinylidene fluoride (PVDF)
membranes and the membranes were blocked in 5% skim milk powder.
The primary antibodies against p38MAPK, p-ERK, Ki-67, matrix
metallopeptidase-9 (MMP-9) and caspase-3 were diluted according to
the relevant instructions and incubated overnight at 4°C. Then,
horseradish peroxidase-linked secondary antibodies were added at a
dilution ratio of 1:1,000, and incubated at room temperature for 2
h. The membranes were washed with PBS for three times and the
immunoreactive bands were visualized using the ECL-Plus kit
according to the kit’s instructions. The relative protein level in
the different groups was normalized to the GAPDH concentration.
Three separate experiments were performed for each clone.
Colony formation assay
OS cells treated with Lv-shGAL1 were counted and
seeded in 12-well plates (in triplicate) at 100 cells/well. Fresh
culture medium was replaced every three days. Colonies were counted
only if they contained >50 cells, and the number of colonies was
counted from the 6th day after seeding. The cells were then stained
using crystal violet. The rate of colony formation was calculated
with the equation: Colony formation rate = (number of
colonies/number of seeded cells) × 100%.
Transwell invasion assay
Transwell filters were coated with Matrigel (3.9
μg/μl, 60–80 μl) on the upper surface of a polycarbonic membrane
(diameter 6.5 mm, pore size 8 μm). After incubation at 37°C for 30
min, the Matrigel solidified and served as the extracellular matrix
for analysis of tumor cell invasion. Harvested cells
(1×10⁵) in 100 μl of serum-free DMEM were added into the
upper compartment of the chamber. Conditioned medium (200 μl)
derived from NIH3T3 cells was used as a source of chemoattractant,
and was placed in the bottom compartment of the chamber. After a
24-h incubation at 37°C with 5% CO2, the medium was
removed from the upper chamber. The non-invaded cells on the upper
side of the chamber were scraped off with a cotton swab. The cells
that had migrated from the Matrigel into the pores of the inserted
filter were fixed with 100% methanol, stained with hematoxylin, and
mounted and dried at 80°C for 30 min. The number of cells invading
through the Matrigel was counted in three randomly selected visual
fields from the central and peripheral portion of the filter using
an inverted microscope (x200 magnification). Each assay was
repeated three times.
Cell apoptosis analysis
To detect cell apoptosis, OS cells were trypsinized,
washed with cold PBS and resuspended in binding buffer according to
the instructions of the apoptosis kit. FITC-Annexin V and PI were
added to the fixed cells for 20 min in darkness at room
temperature. Then, Annexin V binding buffer was added to the
mixture before the fluorescence was measured on a FACsort flow
cytometer. Cell apoptosis was analyzed using Cell Quest software
(Becton-Dickinson, USA). Three separate experiments were performed
for each clone.
Subcutaneous tumor model and gene
therapy
Six-week-old female immunodeficient nude mice
(BALB/c-nu) were bred at the laboratory animal facility (Institute
of Chinese Academy of Sciences, Shanghai), and were housed
individually in microisolator ventilated cages with free access to
water and food. Three mice were injected subcutaneously with
1×10⁷ OS cells (MG-63) in 50 μl of PBS pre-mixed with an
equal volume of Matrigel matrix (Becton-Dickinson). Mice were
monitored daily and developed subcutaneous tumors. When the tumor
size reached ~5 mm in length, they were surgically removed, cut
into 1–2 mm3 pieces, and re-seeded individually into
other mice. When the tumor size reached ~5 mm in length, the mice
were randomly assigned to the NC and Lv-shGAL1 group. In the
treatment group, 15 μl of Lv-shGAL1 was injected into the
subcutaneous tumors using a multi-site injection format. Injections
were repeated every other day after initial treatment. The tumor
volume every three days was measured with a caliper, using the
formula: Volume = (length × width)2/2.
Statistical analysis
SPSS 20.0 was used for statistical analysis.
Kruskal-Wallis H and Chi-square tests were used to analyze the
expression rate in all groups. One-way analysis of variance (ANOVA)
was used to analyze the differences between groups. The LSD method
of multiple comparisons was used when the probability for ANOVA was
statistically significant. Statistical significance was set at
P<0.05.
Results
The expression of GAL1 protein in human
OS
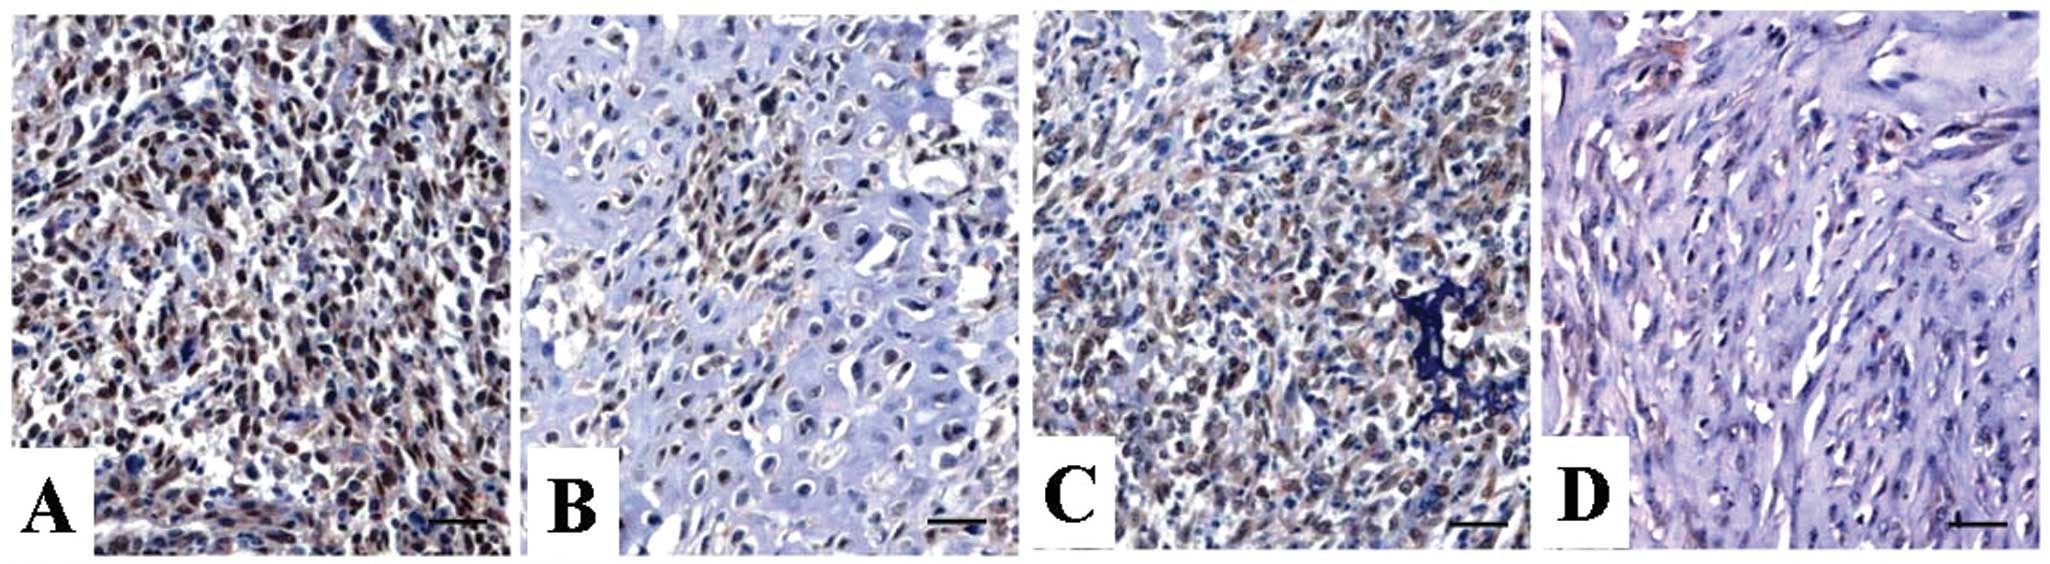
Expression of GAL1 protein was evaluated using IHC
staining. Positive expression of GAL1 protein was examined in the
nucleus and cytoplasm of OS tissues and ANCT (Fig. 1), and positive GAL1 expression was
detected in 63.3% (19/30) of OS tissues, compared with a positive
rate of 36.7% (11/30) in ANCT (P=0.029) (Table I).
 | Table IExpression of GAL1 protein in the
human OS tissues. |
Table I
Expression of GAL1 protein in the
human OS tissues.
| Target | Group | Total | GAL1 protein
expression (n) | Positive rate
(%) | χ2 | P-value |
|---|
|
|---|
| − | + | ++ | +++ |
|---|
| GAL1 | OS | 30 | 11 | 10 | 7 | 2 | 63.3 | 4.742 | 0.029 |
| ANCT | 30 | 19 | 7 | 4 | 0 | 36.7 | | |
Correlation of GAL1 expression with
clinicopathological characteristics
The association between GAL1 expression and various
clinicopathological factors was analyzed. As shown in Table II, increased expression of GAL1 was
closely correlated with distant metastasis of OS (P=0.022).
However, no significant association was found between GAL1
expression and other factors including age, gender of the patients,
and histology and Ennecking staging of the tumor (P>0.05,
respectively).
| Table IICorrelation of GAL1 expression with
clinicopathological factors of the OS patients. |
Table II
Correlation of GAL1 expression with
clinicopathological factors of the OS patients.
| | GAL1 expression | |
|---|
| |
| |
|---|
| Variables | Cases (n) | − | + | P-value |
|---|
| Total | 30 | 11 | 19 | |
| Age (years) | | | | 0.569 |
| <20 | 21 | 7 | 14 | |
| ≥20 | 9 | 4 | 5 | |
| Gender | | | | 0.648 |
| Male | 18 | 6 | 12 | |
| Female | 12 | 5 | 7 | |
| Histology | | | | 0.889 |
| Osteoblastic | 13 | 4 | 9 | |
|
Chondroblastic | 11 | 4 | 7 | |
| Fibroblastic | 4 | 2 | 2 | |
| Others | 2 | 1 | 1 | |
| Ennecking
staging | | | | 0.800 |
| I | 9 | 4 | 5 | |
| II | 16 | 5 | 11 | |
| III | 5 | 2 | 3 | |
| Distant
metastasis | | | | 0.022 |
| No | 11 | 7 | 4 | |
| Yes | 19 | 4 | 15 | |
Knockdown of GAL1 expression in OS
cells
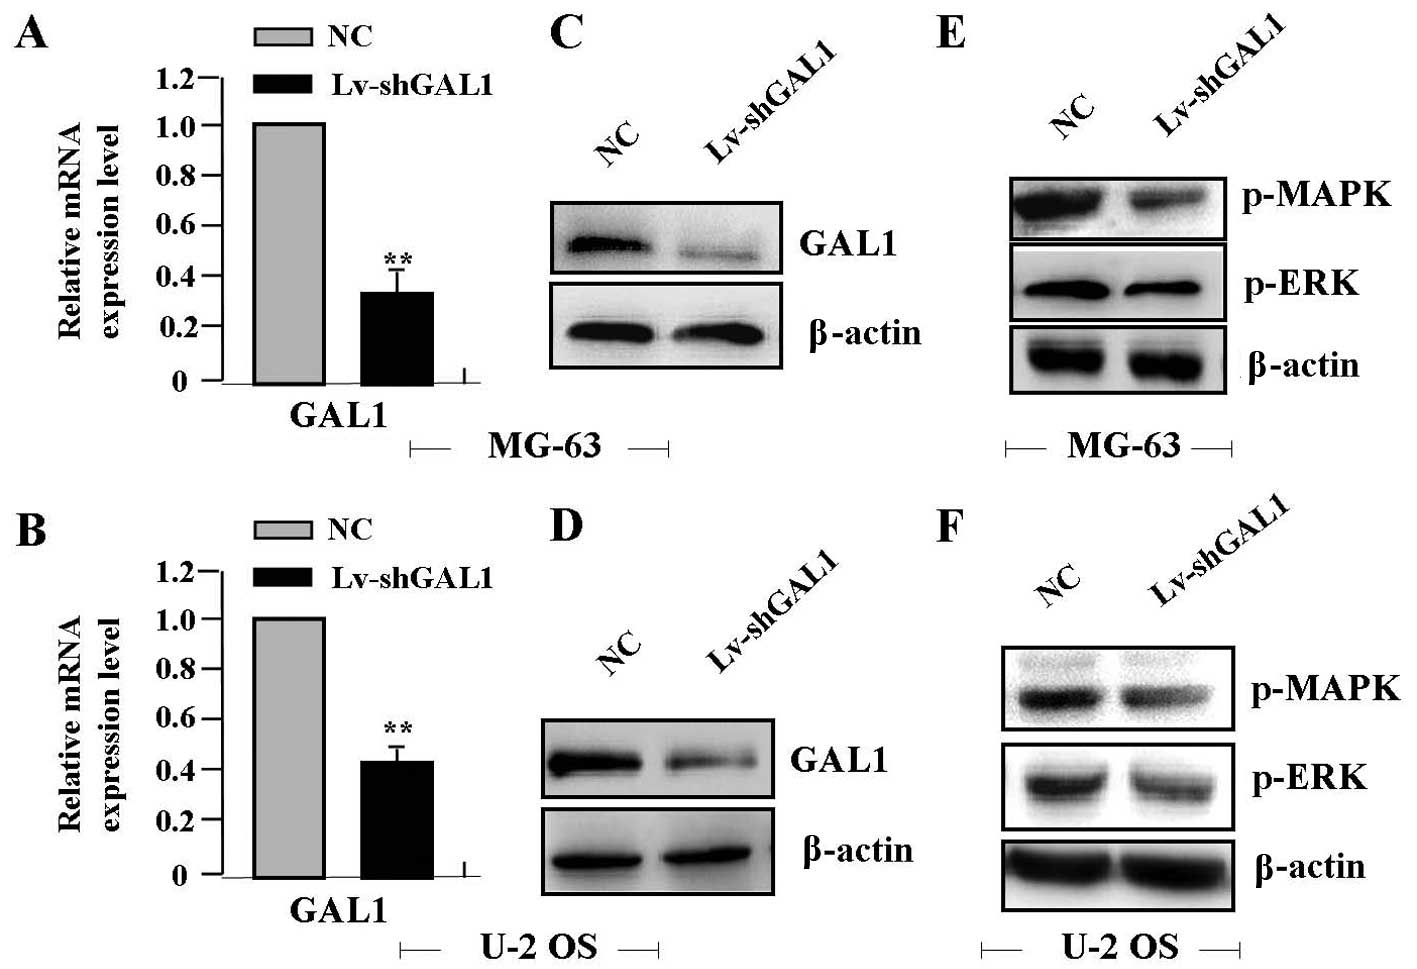
Real-time PCR showed a significantly lower level of
GAL1 mRNA in the Lv-shGAL1 group than that in the NC group (each
P<0.01) (Fig. 2A and B). The
protein expression levels of GAL1, p-MAPK and p-ERK, as indicated
by western blot assay were markedly decreased in the Lv-shGAL1
group in comparison with levels in the NC group (each P<0.01)
(Fig. 2C–F).
Effect of GAL1 knockdown on cell
independent growth
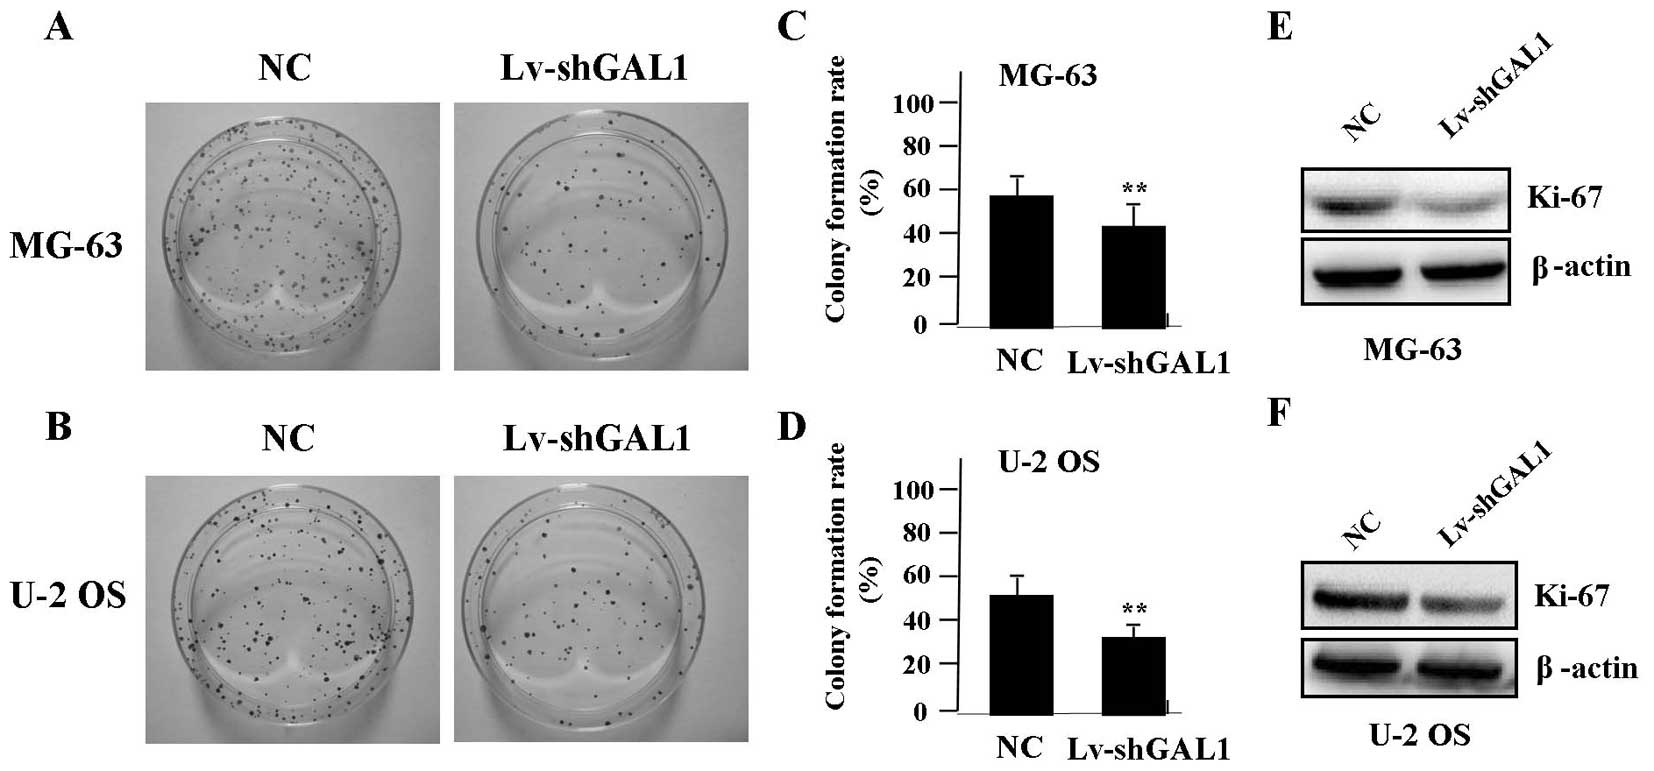
In order to test the effect of GAL1 knockdown on
cell growth, we investigated the independent growth of OS cells by
colony formation assay. We found that knockdown of GAL1
significantly diminished the independent growth of OS cells
(Fig. 3A–D, P<0.01). To
determine whether knockdown of GAL1 suppressed the endogenous
expression of Ki-67 through translational repression, the
expression of Ki-67 protein was examined by western blotting,
indicating that Ki-67 was decreased in the Lv-shGAL1 group compared
with the expression level in the NC group (P<0.01) (Fig. 3E and F).
Effect of GAL1 knockdown on cell
invasion
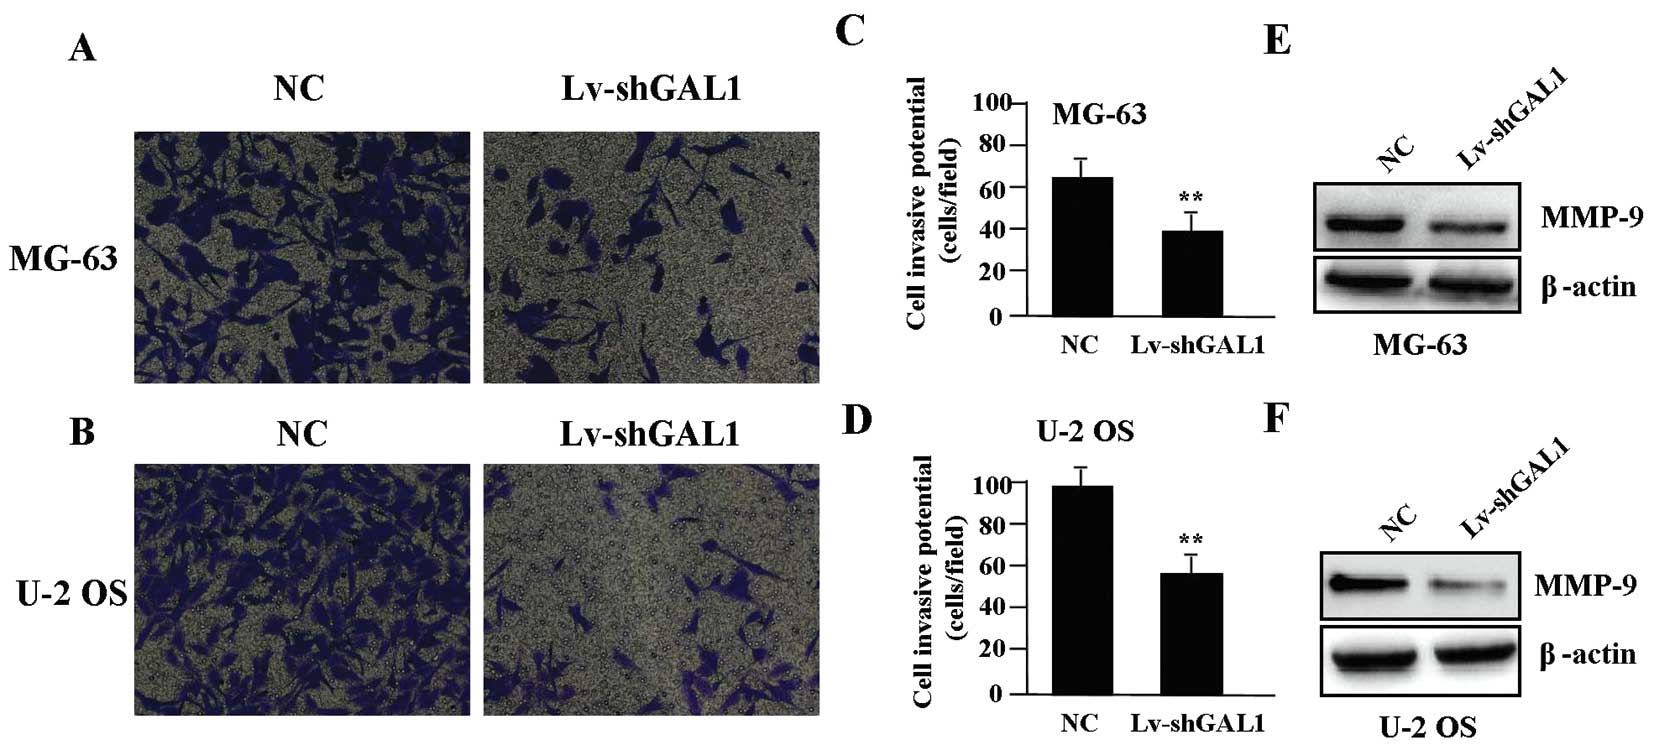
To determine the effect of GAL1 knockdown on cell
invasion, a Transwell assay was carried out. The invasive potential
was determined on the basis of the ability of cells to invade a
matrix barrier containing laminin and type IV collagen, major
components of the basement membrane. Representative micrographs of
Transwell filters are shown in Fig. 4A
and B. The invasive activity of OS cells was significantly
reduced in the Lv-shGAL1 group when compared with that in the NC
group (P<0.01) (Fig. 4C and D).
The endogenous expression of MMP-9 protein, evaluated by western
blotting, was significantly reduced in the Lv-shGAL1 group when
compared to that in the NC group (P<0.01) (Fig. 4E and F).
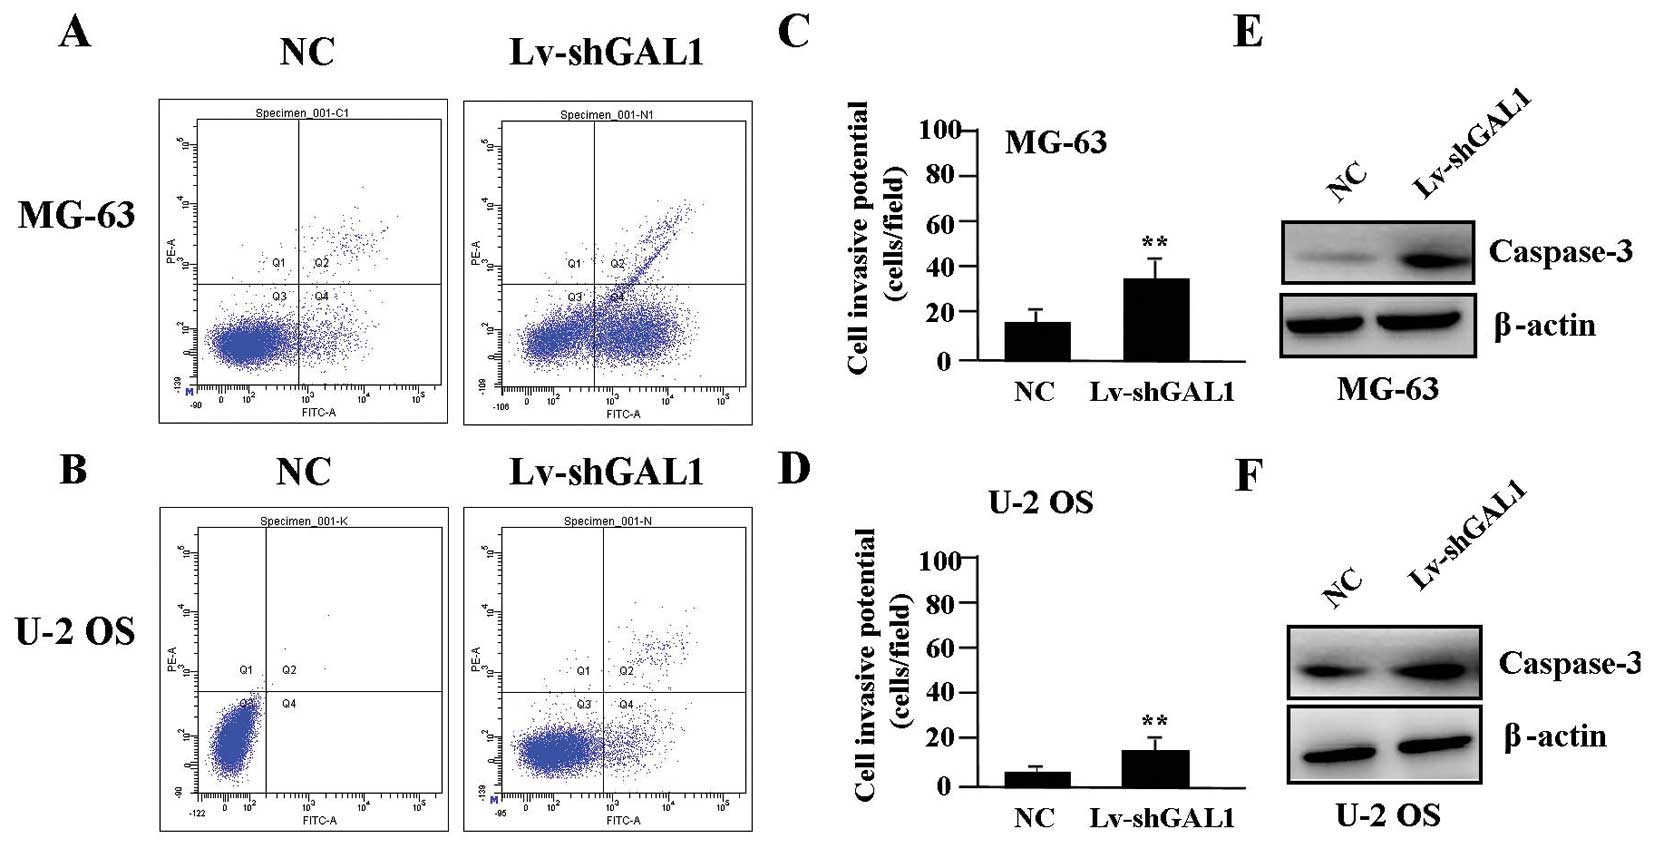
Effects of GAL1 knockdown on cell
apoptosis
To determine whether GAL1 knockdown affects cell
apoptosis, flow cytometric analysis with PI/FITC-Annexin V staining
was performed. The apoptotic rate of the OS cells was markedly
higher in the Lv-shGAL1 group than that in the NC group (P<0.01)
(Fig. 5A–D). The endogenous
expression of caspase-3 protein, evaluated by western blotting, was
significantly increased in the Lv-shGAL1 group when compared with
the expression level in the NC group (P<0.01) (Fig. 5E and F).
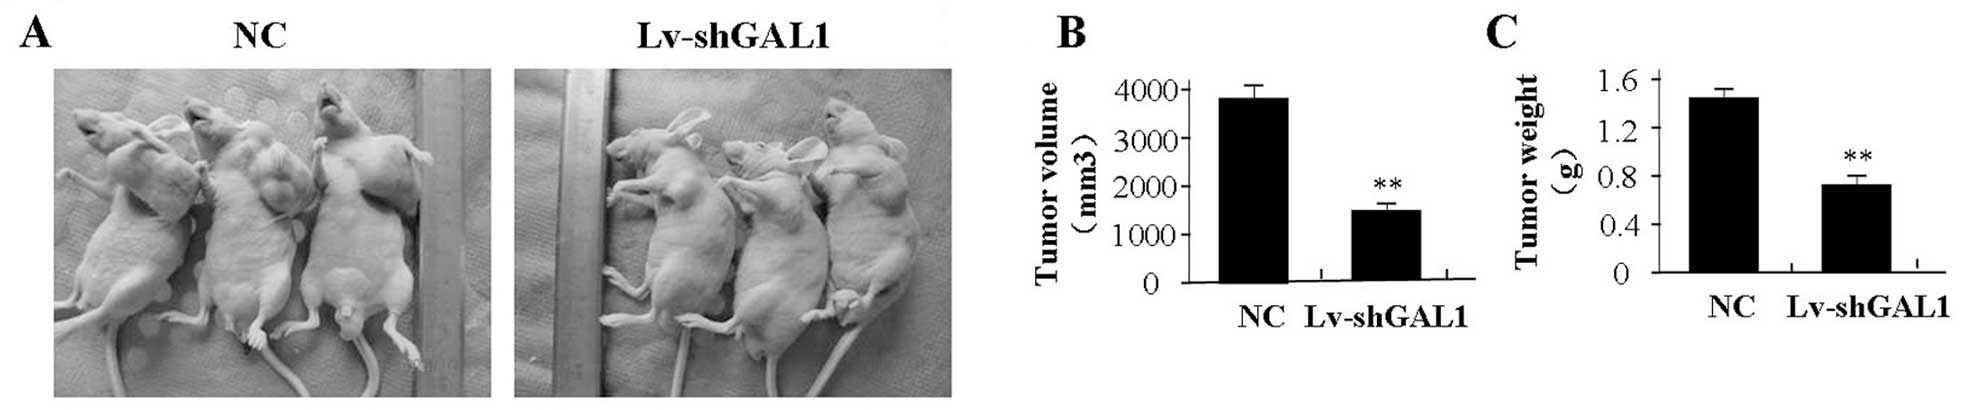
Effect of GAL1 knockdown on xenograft
tumor growth
Our in vitro experiments demonstrated the
inhibitory effect of GAL1 knockdown on tumor growth. Thus, we
further investigated the effect of GAL1 on MG-63 xenograft tumor
growth in vivo. The mean volume of the tumors in the
experimental mice before treatment was 75.85±19.35 mm3.
During the entire tumor growth period, the tumor growth activity
was assessed. The tumors treated with Lv-shGAL1 grew substantially
slower when compared to the rate of growth in the NC group
(Fig. 6A). When the tumors were
harvested, the average weight and volume of the tumors were
significantly smaller in the Lv-shGAL1 group than those of the NC
group (Fig. 6B and C).
Discussion
Galectin-1 (GAL1) is a 14-kDa laminin-binding
galectin involved in several biological events including regulation
of tumor proliferation and metastasis. It is upregulated in human
hepatocellular carcinoma (HCC), and is significantly associated
with tumor invasive characteristics such as vascular invasion,
suggesting it may be a new prognostic factor and a high-priority
therapeutic target for HCC (16).
Ovarian cancer patients with strong GAL1 peritumoral staining have
poorer progression-free survival than patients with weak
peritumoral staining, and inhibition of GAL1 results in the
inhibition of cell growth and proliferation (17). OS is the most common malignant bone
tumor in children and adolescents, unfortunately, with a poor
clinical prognosis. In the present study, we found that GAL1 was
highly expressed in the OS tissues compared with the ANCT, but the
correlation of GAL1 expression with clinical characteristics and
the poor overall survival of OS patients needs further study.
Furthermore, the primary roles of GAL1 in cancer
progression and metastasis are attributed to promotion of tumor
growth and angiogenesis and increased tumor cell adhesion and
invasion. GAL1 plays an important role in modulating HCC cell
adhesion, polarization and in vivo tumor growth with
critical implications in liver pathophysiology (9). Targeting GAL1 in carcinoma-associated
fibroblasts inhibits oral squamous cell carcinoma metastasis by
downregulating MCP-1/CCL2 expression (18). However, some reports show GAL1
inhibits the viability, proliferation and Th1 cytokine production
of non-malignant T cells in patients with leukemic cutaneous T-cell
lymphoma (19), and GAL1 silencing
imparts colorectal cancer with the ability to proliferate and
escape apoptosis (20). Further
research suggests that GAL1 plays vital pro-tumorigenic roles
within the tumor microenvironment (21), and stimulates the proliferation of
melanoma and neo-angiogenesis processes (22). In the present study, knockdown of
GAL1 inhibited the independent growth and invasive potential, and
induced apoptosis in OS cells in vitro and in vivo,
suggesting that GAL1 may represent a promising and effective target
for antitumor therapy.
MAPK and ERK are key regulators of oncogenic
phenotypes such as proliferation, invasion, angiogenesis and
inflammatory responses, which are the hallmarks of cancer. MAPK
targeting inhibits proliferation, invasiveness, metastasis and drug
resistance in bone sarcomas. A recent clinical trial demonstrated
some clinical benefits in patients with unresectable or metastatic
OS following MAPK/ERK targeting therapy (23). MAPK/ERK kinase
(MEK)-phosphoinositide 3-kinase feedback signaling determines the
susceptibility of breast cancer cells to MEK inhibition (24). Inhibition of PI3K/AKT and MAPK/ERK
pathways leads to cell cycle arrest and apoptosis in pancreatic
cancer (25). More importantly, to
explore novel molecular mechanisms underlying GAL1-mediated tumor
progression, we analyzed the MAPK/ERK signaling pathway using PCR
and western blotting. Our findings showed that knockdown of
endogenous GAL1 expression in MG-63 OS cells suppressed the
expression of MAPK/ERK with reduced proliferation and invasion of
the tumor cells, indicating that GAL1 may affect the biological
behaviors of OS cells via regulation of the MAPK/ERK signaling
pathway. Chung et al (26)
also suggested that p38 MAPK, ERK and COX-2 activation are novel
mediators for the GAL1-promoted tumor progression and
chemoresistance in lung cancer. GAL1 may be an innovative target
for combined modality therapy for lung cancer.
Ki-67 is a nuclear protein expressed in
proliferating cells and is required for maintaining cell
proliferation. It has been used as a marker for proliferation of OS
cells (27). MMP-9 is the key
enzyme involved in the degradation of type IV collagen, and a high
level of MMP-9 in tissues is interrelated with tumor growth and
invasion (28). In vitro
knockdown of endogenous GAL1 expression in MG-63 OS cells led to a
significant inhibition in the expression of Ki-67 and MMP-9, and
reduced proliferative activities and invasive potential of the
MG-63 cells. Hence, we speculate that GALI inhibits the
proliferation and metastasis of OS cells via downregulation of the
expression of Ki-67 and MMP-9.
In conclusion, our findings reveal that GAL1 is
highly expressed in human OS, and is correlated with distant
metastases of OS patients. Knockdown of GAL1 inhibits growth and
invasion and induces apoptosis in OS cells through the MAPK/ERK
pathway, suggesting that GAL1 may be a potential therapeutic target
for the treatment of cancer.
References
|
1
|
Carrle D and Bielack SS: Current
strategies of chemotherapy in osteosarcoma. Int Orthop. 30:445–451.
2006. View Article : Google Scholar : PubMed/NCBI
|
|
2
|
Bielack SS, Kempf-Bielack B, Delling G, et
al: Prognostic factors in high-grade osteosarcoma of the
extremities or trunk: an analysis of 1,702 patients treated on
neoadjuvant cooperative osteosarcoma study group protocols. J Clin
Oncol. 20:776–790. 2002. View Article : Google Scholar
|
|
3
|
Tajima Y, Yamazaki K, Makino R, et al:
Gastric and intestinal phenotypic marker expression in early
differentiated-type tumors of the stomach: clinicopathologic
significance and genetic background. Clin Cancer Res. 12:6469–6479.
2006. View Article : Google Scholar
|
|
4
|
Barrow H, Rhodes JM and Yu LG: The role of
galectins in colorectal cancer progression. Int J Cancer. 129:1–8.
2011. View Article : Google Scholar : PubMed/NCBI
|
|
5
|
Alves PM, Godoy GP, Gomes DQ, et al:
Significance of galectins-1, -3, -4 and -7 in the progression of
squamous cell carcinoma of the tongue. Pathol Res Pract.
207:236–240. 2011. View Article : Google Scholar : PubMed/NCBI
|
|
6
|
Barrow H, Guo X, Wandall HH, et al: Serum
galectin-2, -4, and -8 are greatly increased in colon and breast
cancer patients and promote cancer cell adhesion to blood vascular
endothelium. Clin Cancer Res. 17:7035–7046. 2011. View Article : Google Scholar : PubMed/NCBI
|
|
7
|
Kamper P, Ludvigsen M, Bendix K, et al:
Proteomic analysis identifies galectin-1 as a predictive biomarker
for relapsed/refractory disease in classical Hodgkin lymphoma.
Blood. 117:6638–6649. 2011. View Article : Google Scholar : PubMed/NCBI
|
|
8
|
Tang CE, Tan T, Li C, et al:
Identification of Galectin-1 as a novel biomarker in nasopharyngeal
carcinoma by proteomic analysis. Oncol Rep. 24:495–500.
2010.PubMed/NCBI
|
|
9
|
Espelt MV, Croci DO, Bacigalupo ML, et al:
Novel roles of galectin-1 in hepatocellular carcinoma cell
adhesion, polarization, and in vivo tumor growth. Hepatology.
53:2097–2106. 2011. View Article : Google Scholar : PubMed/NCBI
|
|
10
|
Xue X, Lu Z, Tang D, et al: Galectin-1
secreted by activated stellate cells in pancreatic ductal
adenocarcinoma stroma promotes proliferation and invasion of
pancreatic cancer cells: an in vitro study on the microenvironment
of pancreatic ductal adenocarcinoma. Pancreas. 40:832–839. 2011.
View Article : Google Scholar
|
|
11
|
Carlsson MC, Balog CI, Kilsgård O, et al:
Different fractions of human serum glycoproteins bind galectin-1 or
galectin-8, and their ratio may provide a refined biomarker for
pathophysiological conditions in cancer and inflammatory disease.
Biochim Biophys Acta. 1820:1366–1372. 2012. View Article : Google Scholar
|
|
12
|
Kuo PL, Huang MS, Cheng DE, et al: Lung
cancer-derived galectin-1 enhances tumorigenic potentiation of
tumor-associated dendritic cells by expressing heparin-binding
EGF-like growth factor. J Biol Chem. 287:9753–9764. 2012.
View Article : Google Scholar
|
|
13
|
Cedeno-Laurent F, Opperman M, Barthel SR,
Kuchroo VK and Dimitroff CJ: Galectin-1 triggers an
immunoregulatory signature in Th cells functionally defined by
IL-10 expression. J Immunol. 188:3127–3137. 2012. View Article : Google Scholar : PubMed/NCBI
|
|
14
|
Gomez-Brouchet A, Mourcin F, Gourraud PA,
et al: Galectin-1 is a powerful marker to distinguish
chondroblastic osteosarcoma and conventional chondrosarcoma. Hum
Pathol. 41:1220–1230. 2010. View Article : Google Scholar : PubMed/NCBI
|
|
15
|
Dhondge A, Surendran S, Seralathan MV, et
al: Cellular alterations and modulation of protein expression in
bitumen-challenged human osteoblast cells. Environ Sci Pollut Res
Int. 19:4030–4041. 2012. View Article : Google Scholar : PubMed/NCBI
|
|
16
|
Wu H, Chen P, Liao R, et al:
Overexpression of galectin-1 is associated with poor prognosis in
human hepatocellular carcinoma following resection. J Gastroenterol
Hepatol. 27:1312–1319. 2012. View Article : Google Scholar : PubMed/NCBI
|
|
17
|
Kim HJ, Jeon HK, Cho YJ, et al: High
galectin-1 expression correlates with poor prognosis and is
involved in epithelial ovarian cancer proliferation and invasion.
Eur J Cancer. 48:1914–1921. 2012. View Article : Google Scholar : PubMed/NCBI
|
|
18
|
Wu MH, Hong HC, Hong TM, et al: Targeting
galectin-1 in carcinoma-associated fibroblasts inhibits oral
squamous cell carcinoma metastasis by downregulating MCP-1/CCL2
expression. Clin Cancer Res. 17:1306–1316. 2011. View Article : Google Scholar : PubMed/NCBI
|
|
19
|
Cedeno-Laurent F, Watanabe R, Teague JE,
et al: Galectin-1 inhibits the viability, proliferation, and Th1
cytokine production of nonmalignant T cells in patients with
leukemic cutaneous T-cell lymphoma. Blood. 119:3534–3538. 2012.
View Article : Google Scholar : PubMed/NCBI
|
|
20
|
Satelli A and Rao US: Galectin-1 is
silenced by promoter hypermethylation and its re-expression induces
apoptosis in human colorectal cancer cells. Cancer Lett. 301:38–46.
2011. View Article : Google Scholar : PubMed/NCBI
|
|
21
|
Ito K, Stannard K, Gabutero E, et al:
Galectin-1 as a potent target for cancer therapy: role in the tumor
microenvironment. Cancer Metastasis Rev. 31:763–778. 2012.
View Article : Google Scholar : PubMed/NCBI
|
|
22
|
Mathieu V, de Lassalle EM, Toelen J, et
al: Galectin-1 in melanoma biology and related neo-angiogenesis
processes. J Invest Dermatol. 132:2245–2254. 2012. View Article : Google Scholar : PubMed/NCBI
|
|
23
|
Chandhanayingyong C, Kim Y, Staples JR, et
al: MAPK/ERK signaling in osteosarcomas, Ewing sarcomas and
chondrosarcomas: therapeutic implications and future directions.
Sarcoma. 2012:4048102012. View Article : Google Scholar : PubMed/NCBI
|
|
24
|
Mirzoeva OK, Das D, Heiser LM, et al:
Basal subtype and MAPK/ERK kinase (MEK)-phosphoinositide 3-kinase
feedback signaling determine susceptibility of breast cancer cells
to MEK inhibition. Cancer Res. 69:565–572. 2009. View Article : Google Scholar : PubMed/NCBI
|
|
25
|
Roy SK, Srivastava RK and Shankar S:
Inhibition of PI3K/AKT and MAPK/ERK pathways causes activation of
FOXO transcription factor, leading to cell cycle arrest and
apoptosis in pancreatic cancer. J Mol Signal. 5:102010. View Article : Google Scholar : PubMed/NCBI
|
|
26
|
Chung LY, Tang SJ, Sun GH, et al:
Galectin-1 promotes lung cancer progression and chemoresistance by
upregulating p38 MAPK, ERK, and cyclooxygenase-2. Clin Cancer Res.
18:4037–4047. 2012. View Article : Google Scholar : PubMed/NCBI
|
|
27
|
Tsimaratou K, Kletsas D, Kastrinakis NG,
et al: Evaluation of claspin as a proliferation marker in human
cancer and normal tissues. J Pathol. 211:331–339. 2007. View Article : Google Scholar : PubMed/NCBI
|
|
28
|
Cawston TE and Wilson AJ: Understanding
the role of tissue degrading enzymes and their inhibitors in
development and disease. Best Pract Res Clin Rheumatol.
20:983–1002. 2006. View Article : Google Scholar : PubMed/NCBI
|