Introduction
Prostate cancer (PCa) is currently the most commonly
diagnosed cancer and the third leading cause of cancer-related
deaths in males in developed countries, and the incidence is
increasing in Asian countries (1,2). PCa
is a hormone-associated disease that is dependent on signaling
through androgen receptors (ARs) triggered by dihydrotestosterone
(DHT). Our previous study focused on the role of PC-1, an
androgen-induced prostate-specific gene. PC-1, also known as PrLZ
(prostate leucine zipper gene), was first identified from 1,500
arrayed genes using cDNA differential expression microarray in
LNCaP and C4-2 cells (3). PC-1
belongs to the tumor protein D52 (TPD52) family that has been
reported to play important roles in exocytotic secretion and tumor
progression (4). Different from the
extensive expression of TPD52 in multiple tumor tissues and cell
lines, PC-1 is predominantly expressed in the prostate, with only
minimal expression in the gastrointestinal tract and other
secretory glandular tissues (3). We
previously revealed that PC-1 caused malignant transformation of
non-tumorigenic cells, promoted proliferation and survival in
vitro and tumorigenicity in vivo, and contributed to
androgen-independent progression and malignant phenotypes in
prostate cancer cells, indicating its potential linkage to the
progression of PCa (5–7). However, the detailed mechanism
explaining how PC-1 contributes to PCa progression remains unclear.
To explore the molecular mechanisms of PC-1-induced promotion of
PCa, differentially expressed genes in PC-1-overexpressing LNCaP
cells were scanned by an Affymetrix microarray. Expression of
EphA3, a member of the receptor tyrosine kinase (RTK) family, was
markedly increased in the LNCaP-PC-1 cells.
The EphA3 receptor has been reported to be
overexpressed in malignant melanoma and lymphoid tumors (8), and to be mutated in tumors of the lung
and breast (9). Soluble EphA3-Fc
receptors and anti-EphA3 antibody can inhibit proliferation of
tumor cells and decrease tumor volume in vivo (10,11).
In hematologic malignancies and glioblastoma, EphA3 is regarded as
a promising therapeutic target (12–14).
However, little is known concerning the function of EphA3 in PCa.
Under normal conditions, higher amounts of EphA3 are produced in
the bladder and prostate than in other human tissues (15). EphA3 expression was found to be
increased by 39-fold in androgen-independent PCa cells (LNCaP-C81)
compared with that in androgen-dependent PCa cells (LNCaP-C33)
(16).
In the present study, we aimed to ascertain whether
EphA3 is induced by the PCa-associated gene PC-1 and the functional
significance of EphA3 expression in PCa.
Materials and methods
Plasmid construction and RNAi
analysis
The coding region of the human EphA3 cDNA was cloned
into the EcoRI and BamHI sites of pcDNA3.1(−)/Myc-His
B vector (Invitrogen). The following double-stranded
oligonucleotides were cloned into the pGP-U6-Hygro siRNA expression
vector (Shanghai GenePharma Co., Ltd., Shanghai, China): EphA3,
5′-CACCGC GGTCAGCATCACAACTAATTTCAAGAGAATTAGTTGT
GATGCTGACCGCTTTTTTG-3′. The negative control oligo,
5′-CACCGTTCTCCGAACGTGTCACGTTTCAAGAGAAC
GTGACACGTTCGGAGAACTTTTTTG-3′, had no significant homology to any
human coding cDNA. All oligos were inserted into the pGP-U6-Hygro
vector, and then transiently transfected into 293T cells to examine
the efficiency of RNAi by western blot analysis.
Cell culture, transfection and generation
of stable cell lines
LNCaP and C4-2B cell lines were a generous gift from
Leland Chung (Emory University, Atlanta, GA, USA). The LNCaP-PC-1
cell line was maintained in this laboratory, cultured in RPMI-1640
(Invitrogen) with 10% fetal bovine serum (FBS; HyClone). All cells
were cultured at 37°C, with 5% CO2. The EphA3 cDNA
vector was transfected into LNCaP cells using Lipofectamine 2000
(Invitrogen) according to the manufacturer’s protocol. An empty
vector was used as a control. Transfected LNCaP cells were selected
in the presence of 1,000 μg/ml G418 (Sigma). Stable clones were
selected after 5 weeks, and clones overexpressing EphA3 were
examined by western blot analysis.
Microarray hybridization and
analysis
Total RNA from cultured LNCaP-PC-1 or control
LNCaP-Neo cells was isolated individually using TRIzol reagent
(Invitrogen, Carlsbad, CA, USA) and quantified
spectrophotometrically at 260/280 nm. The integrity of all RNA
samples was evaluated on a 1% agarose gel, and all RNA samples were
found to be pure with no degradation caused by the isolation
procedure. Affymetrix GeneChips (Human Genome U133 Plus 2.0 arrays;
Affymetrix, Santa Clara, CA, USA) were used for hybridization and
data collection. The protocol was performed by the Microarray
Facility at the Shanghai Biochip Co., Ltd., Shanghai, China.
Cell growth assays
To obtain growth curves, 2–3×10³
cells/well were seeded in 96-well plates. Cell growth was measured
using 3-(4,5-dimethylthiazol-2-yl)-2,5-diphenyltetrazolium bromide
(MTT) assays according to the manufacturer’s instructions
(Amresco). Before testing, 20 μl of MTT reagent (2.5 mg/ml MTT in
PBS; Amresco, Inc., Solon, OH, USA) was added, and the cells were
incubated for a further 4 h at 37°C. Then 150 μl of dissolving
reagent DMSO (Amresco) was added to dissolve the formazan crystals.
The absorbance was detected at a wavelength of 490 nm on a
microplate reader.
Soft agar assays
A total of 2–6×10³ cells were resuspended
in 3 ml of 0.35% low melting point agarose (BD Biosciences) in
RPMI-1640/10% FBS and plated on top of a 2-ml underlayer of 0.5%
agarose in the same medium in 6-well culture plates. After 3 weeks,
the colonies containing >50 cells were counted.
Xenograft assays in nude mice
Male nude athymic BALB/c mice, 6–8 weeks old (Vital
River Experimental Animals Technique Ltd., Beijing, China) were
injected s.c. on the side of the abdomen with a total of
8×10⁶ cells in an exponential growth phase suspended in
200 μl serum-free RPMI-1640 containing Matrigel (1:1, v/v; BD
Biosciences). Tumor volume measurements were recorded once a week
and calculated as follows: L × W × H × 0.5236.
Human prostate cancer tissue microarray
and immunohistochemical staining
Two human prostate cancer tissue microarrays (Shanxi
Chaoying Biotechnology Co., Ltd., Xi’an, China) were used to
detected the expression of EphA3. A total of 110 formalin-fixed,
paraffin-embedded benign prostate hyperplasia (BPH) prostate cancer
tissues and corresponding normal epithelia were included in the
tissue microarray. Another microarray contained 207 dots of 69
clinical cases including normal prostate, BPH, prostate cancer and
adjacent normal prostate tissues in triplicate. Briefly,
immunohistochemical (IHC) analysis was conducted as follows.
Following deparaffinization, the samples were treated for antigen
retrieval by the microwave method. A monoclonal antibody to EphA3
(Santa Cruz Biotechnology, Santa Cruz, CA, USA) (1:100) was used.
Staining intensity and the percentage of immunoreactive cells were
quantitated using image analysis (n=8 images), and then the slides
were sealed with Crystal/Mount (Thermo Fisher Scientific,
Pittsburgh, PA, USA) and analyzed separately by two
pathologists.
Western blot analysis
Protein extracts were separated by SDS-PAGE and
transferred to polyvinylidene difluoride membranes (Millipore,
Bedford, MA, USA). Blots were blocked in the nitrocellulose
membranes (Amersham Biosciences), then probed with antibodies
against EphA3 (1:1000;), β-actin (1:2,000; Santa Cruz
Biotechnology), phospho-Akt (pAkt; 1:1,000; Cell Signaling
Technology), total Akt (1:1,000; Cell Signaling Technology) and
tublin (1:1,000; Cell Signaling Technology). After a series of
washes, blots were incubated with goat anti-mouse or anti-rabbit
IgG antibody conjugated to horseradish peroxidase (Beijing
Zhongshan Golden Bridge Biotechnology Co., Ltd., Beijing, China)
then detected using an enhanced chemiluminescence kit (Pierce).
Statistical analysis
Analyses were conducted using the statistical
software SPSS13.0. All tests of significance were set at P<0.05.
Data analyses over time were undertaken by repeated measures
analysis. For the staining of tissue microarrays, the average
optical density, integral optical density, and area density data
were subjected to ANOVA analysis, with the post hoc Scheffe test
used for multiple comparisons between groups.
Results
EphA3 is induced by PC-1 in prostate
cancer cells
Our previous results indicated the potential linkage
of PC-1 to the progression of PCa in vitro and in
vivo. In order to gain more insight into the molecular
mechanisms of PC-1-induced promotion of PCa, we analyzed RNA from
LNCaP-PC-1 and control LNCaP-Neo cells. Three cultures for each
cell line were used for the RNA extraction. RNA was labeled and
hybridized to Affymetrix U133 Plus 2.0 GeneChips. For each gene,
the difference in expression level and the statistical significance
of this difference were calculated. One hundrend and ninety-one
genes were evaluated for 1.4-fold relative increases and decreases
in expression levels. These included 30 upregulated and 161
downregulated genes. Representative tumor-associated genes are
shown in Table I. Expression levels
of several oncogenes, such as RAP2B, MAF and NDRG (downstream of
N-Myc), were increased by PC-1, while expression levels of several
tumor suppressors including ST7 were decreased. Expression of
apoptosis-associated genes, such as FAF1, CASP9, TNFRSF21 (DR6) was
downregulated in the PC-1-overexpressing LNCaP cells. Expression
levels of differentiation-associated genes, such as Nkx3.1, JAG1
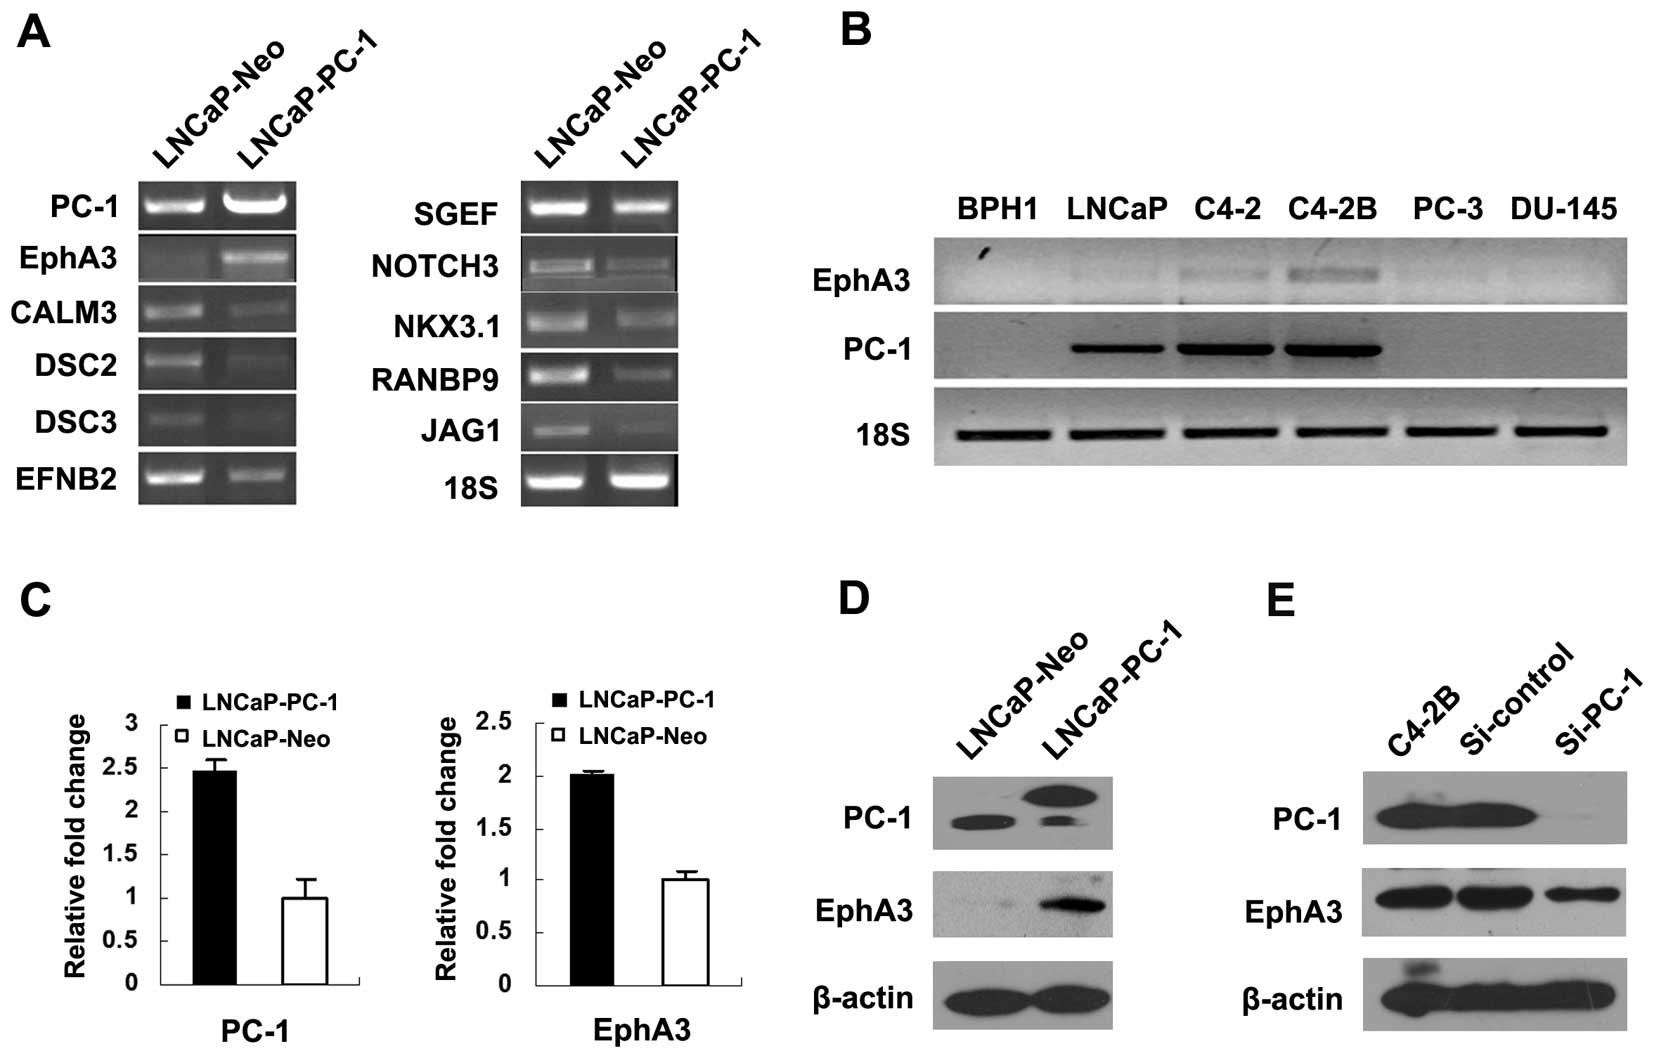
and NOTCH3, were decreased by PC-1 as well. The data of the
microarray were validated by RT-PCR and a portion of the results is
shown in Fig. 1A. Notably, one of
the migration and metastasis-associated genes, EphA3, was increased
by 42-fold in the LNCaP-PC-1 cells.
 | Table IRepresentative genes differentially
expressed between PC-1-overexpressing LNCaP and control cells. |
Table I
Representative genes differentially
expressed between PC-1-overexpressing LNCaP and control cells.
| Gene symbol | Description | Representative public
ID | Fold-change |
|---|
| Oncogene/tumor
suppressor genes |
| MAF | v-maf
musculoaponeurotic fibrosarcoma oncogene homolog (avian) | AF055376 | 2.6 |
| NDRG1 | N-myc downstream
regulated gene 1 | NM_006096 | 1.9 |
| RAP2B | RAP2B, member of the
RAS oncogene family | AW005535 | 1.6 |
| ST7 | Suppression of
tumorigenicity 7 | NM_018412 | −1.7 |
|
Differentiation-associated genes |
| NKX3.1 | NK3 transcription
factor related, locus 1 (Drosophila) | AF247704 | −1.4 |
| SPATS2 | Spermatogenesis
associated, serine-rich 2 | NM_023071 | −1.4 |
| TEX27 | Testis expressed
sequence 27 | NM_021943 | −1.4 |
| NCoA2 | Nuclear receptor
coactivator 2 | NM_006540 | −1.7 |
| CALR | Calreticulin | NM_004343 | −1.6 |
| JAG1 | Jagged 1 (Alagille
syndrome) | U77914 | −2.1 |
| NOTCH3 | Notch homolog 3
(Drosophila) | NM_000435 | −1.7 |
| Migration and
metastasis-associated genes |
| EphA3 | Eph receptor
A3 | AF213459 | 42.2 |
| TUBA3 | Tubulin, α 3 | AF141347 | 1.7 |
| CDC42EP3 | CDC42 effector
protein (Rho GTPase binding) 3 | AL136842 | 1.5 |
| ROCK1 | Rho-associated,
coiled-coil containing protein kinase 1 | AV683882 | −1.4 |
| ITGA6 | Integrin, α 6 | AV733308 | −1.5 |
|
Apoptosis-associated genes |
| FAF1 | Fas
(TNFRSF6)-associated factor 1 | NM_007051 | −1.5 |
| PAK2 | p21
(CDKN1A)-activated kinase 2 | AI076186 | −1.5 |
| CASP9 | Caspase-9,
apoptosis-related cysteine protease | AB015653 | −1.4 |
| BAG2 | BCL2-associated
athanogene 2 | AF095192 | −1.5 |
| MDC1 | Mediator of DNA
damage checkpoint 1 | AI673553 | −2.1 |
| DDA3 | Differential
display and activated by p53 | BC001425 | −1.4 |
| TNFRSF21 | Tumor necrosis
factor receptor superfamily, member 21 | BE568134 | −1.6 |
Real-time PCR and western blot analysis were
performed to confirm the PC-1-induced expression of EphA3. The
results showed that EphA3 was induced by PC-1 in LNCaP cells at the
mRNA (Fig. 1C) and protein
(Fig. 1D) levels. We also detected
the expression of PC-1 and EphA3 in six different prostate cell
lines. As shown in Fig. 1B, no PC-1
or EphA3 expression was noted in benign prostatic hyperplasia
(BPH1) cells. The LNCaP cell line, established from a metastatic
deposit in a lymph node, is androgen-dependent, non-metastatic, and
weakly tumorigenic (17). The LNCaP
lineage-derived sublines C4-2 and C4-2B, obtained from tumor-stoma
interaction, possess the capabilities of androgen-independent
growth and distant organ metastasis (18,19).
The mRNA expression of PC-1 increased progressively in the LNCaP,
C4-2 and C4-2B cells. PC-3 and DU145 are two prostate cancer cell
lines derived from lumbar and central nervous system metastasis,
respectively, and are both androgen-independent. There was minimal
expression of EphA3 and undetectable PC-1 expression in these two
cell lines. Consistent with the mRNA level, the EphA3 protein was
increased in the PC-1-overexpressing LNCaP cells compared with the
control. PC-1-targeted siRNA was used to suppress the PC-1
expression in C4-2B cells. The amount of EphA3 protein was
decreased in the si-PC-1-transfected C4-2B cells compared with the
negative RNAi control and parental C4-2B cells. In another part of
our study, a 2011-bp length of the EphA3 promoter sequence was
cloned into a luciferase report gene vector, and PC-1 was found to
enhance the activity of the EphA3 promoter in luciferase assays,
suggesting that PC-1 may induce the EphA3 expression through
increasing the promoter activity (20). Taken together, these results above
indicate that EphA3 is induced by PC-1 in prostate cancer
cells.
Overexpression of EphA3 enhances the
proliferation and survival of LNCaP cells
In view of the fact that PC-1 promoted prostate
cancer progression and PC-1-induced EphA3 expression, we were
interested in investigating the role of EphA3 in prostate cancer.
For this purpose, EphA3 stably expressing and control LNCaP cell
lines were constructed by transfection of an EphA3-expressing
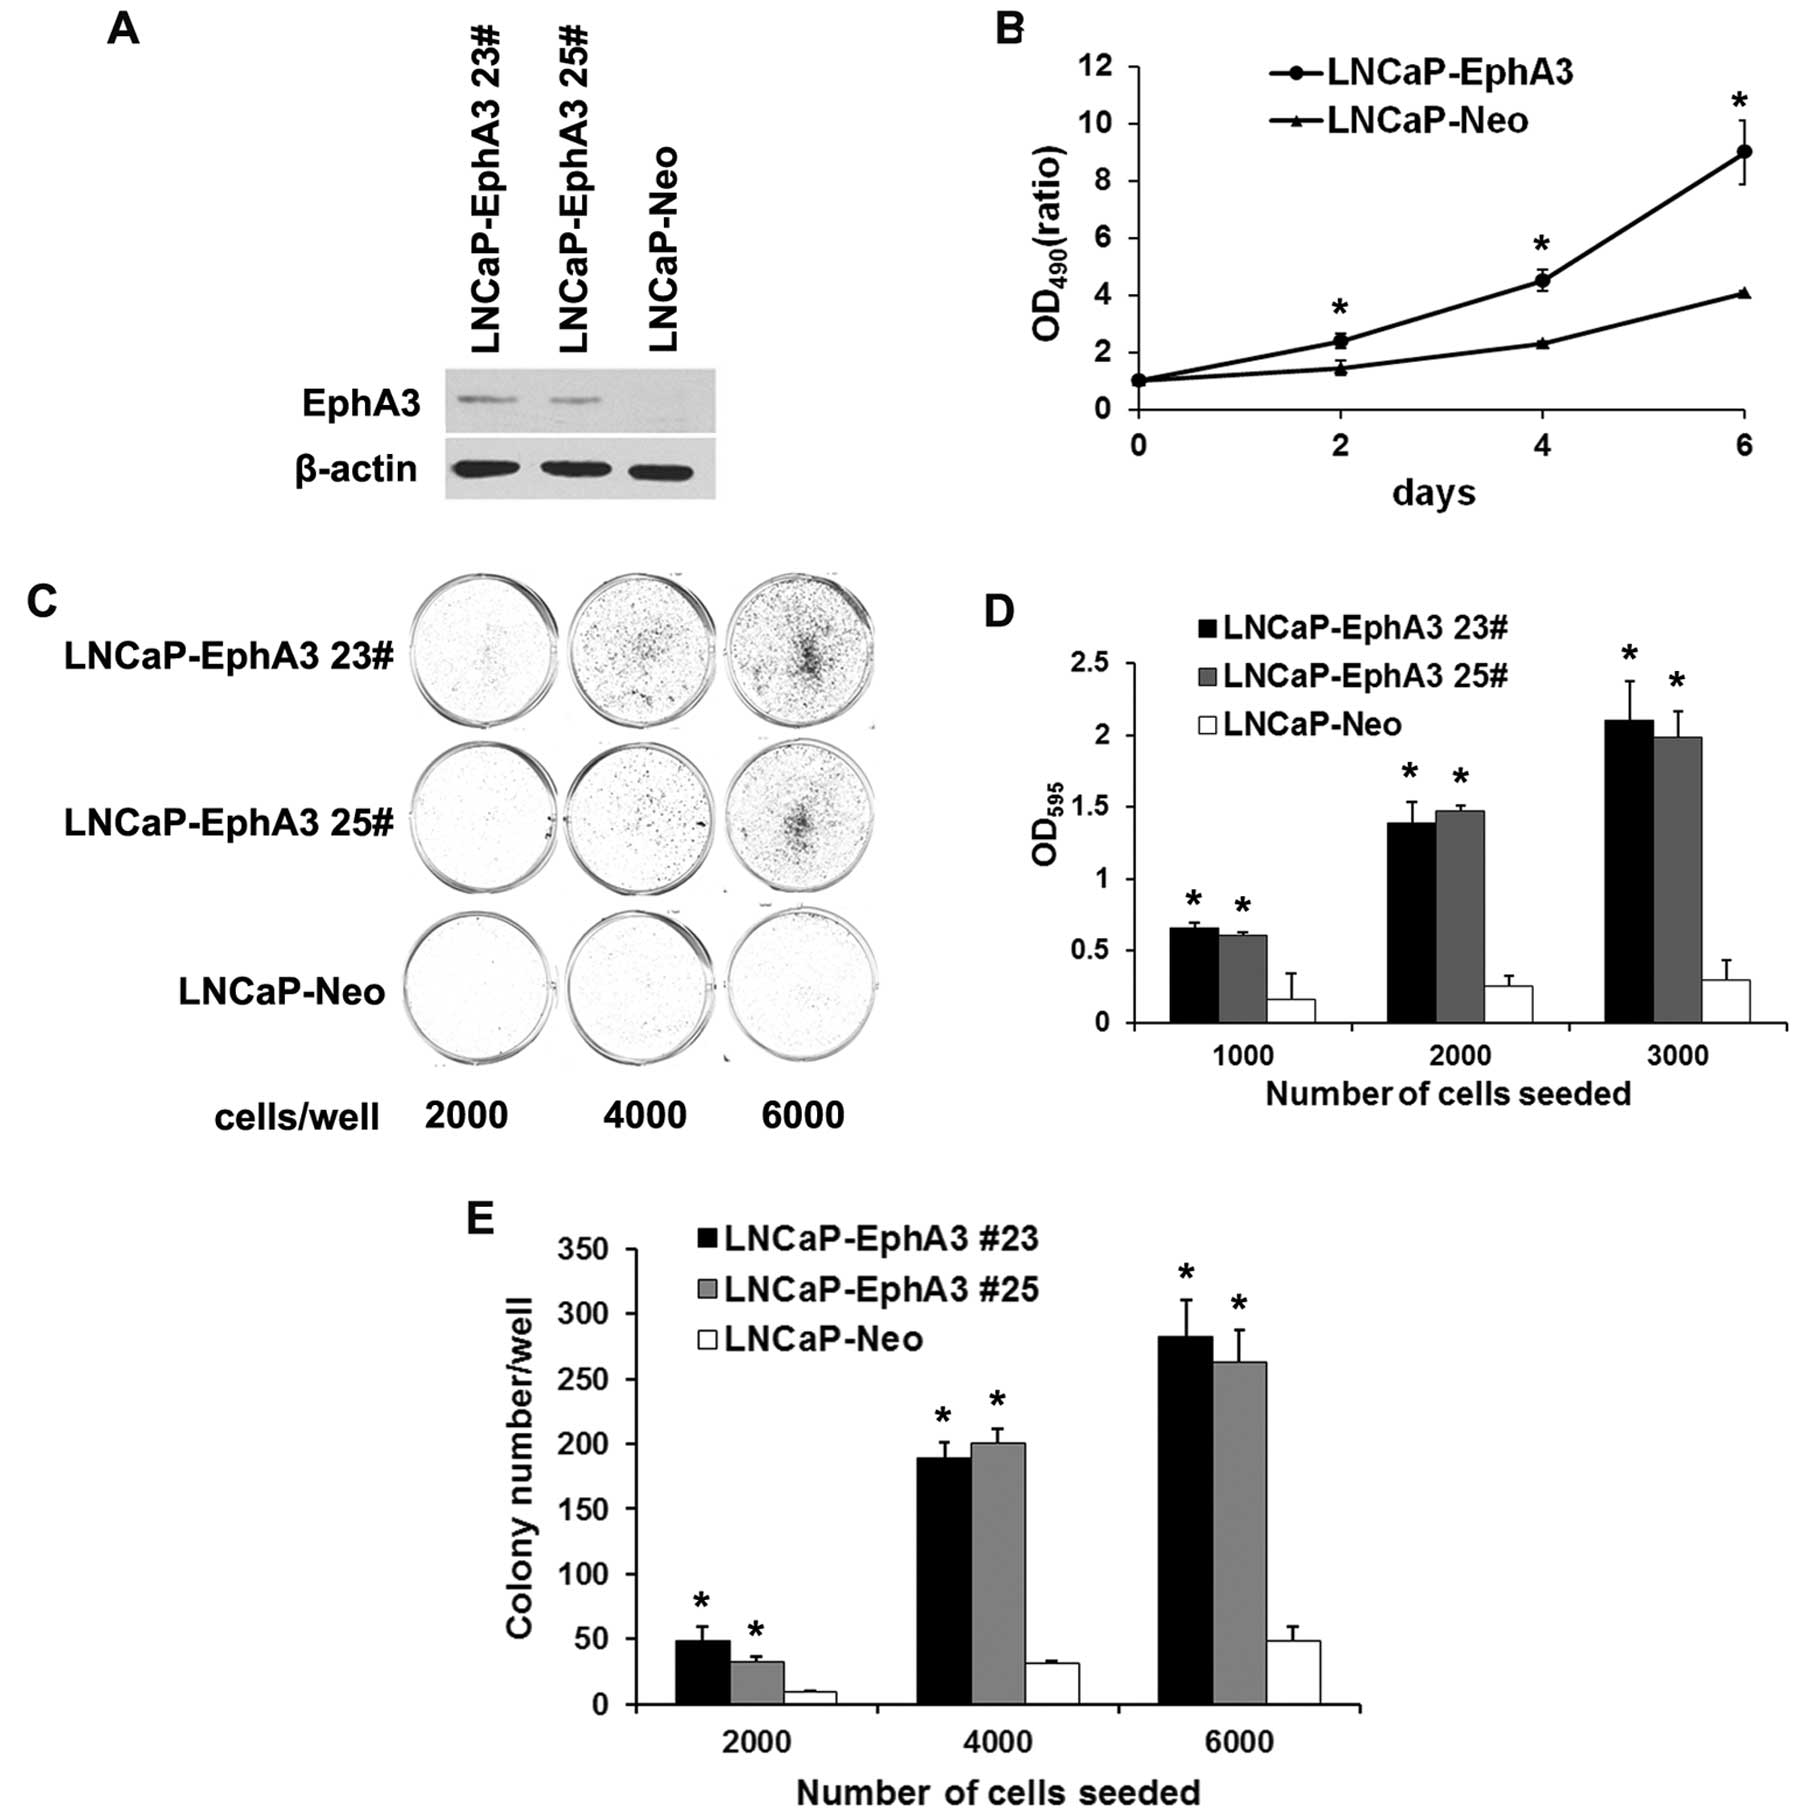
vector or a mock vector. Two LNCaP-EphA3 clones (#23 and #25) were
determined to have higher levels of EphA3 expression than the
control cells (LNCaP-Neo) (Fig.
2A). MTT assays were performed to evaluate the growth of the
transfected cells. The growth rate of the LNCaP-EphA3 cells
increased by 1.6-, 2.0- and 2.2-fold compared with the control at
2, 4 and 6 days, respectively (Fig.
2B). In the plate colony-formation assay, it was found that
EphA3 markedly enhanced the colony-formation ability of the LNCaP
cells. LNCaP-EphA3 cells formed more and larger colonies than the
control after 10 days in culture (Fig.
2C and D). Based on these results, the effect of EphA3
expression on the anchorage-independent growth of LNCaP cells was
evaluated in colony formation assays. As shown in Fig. 2E, LNCaP-EphA3 cells exhibited
enhanced clonogenicity in semi-solid agar compared with the
mock-transfected control cells. These results suggest that
overexpression of EphA3 enhances the proliferation and survival of
LNCaP cells.
Knockdown of EphA3 suppresses the
proliferation and survival of C4-2B cells
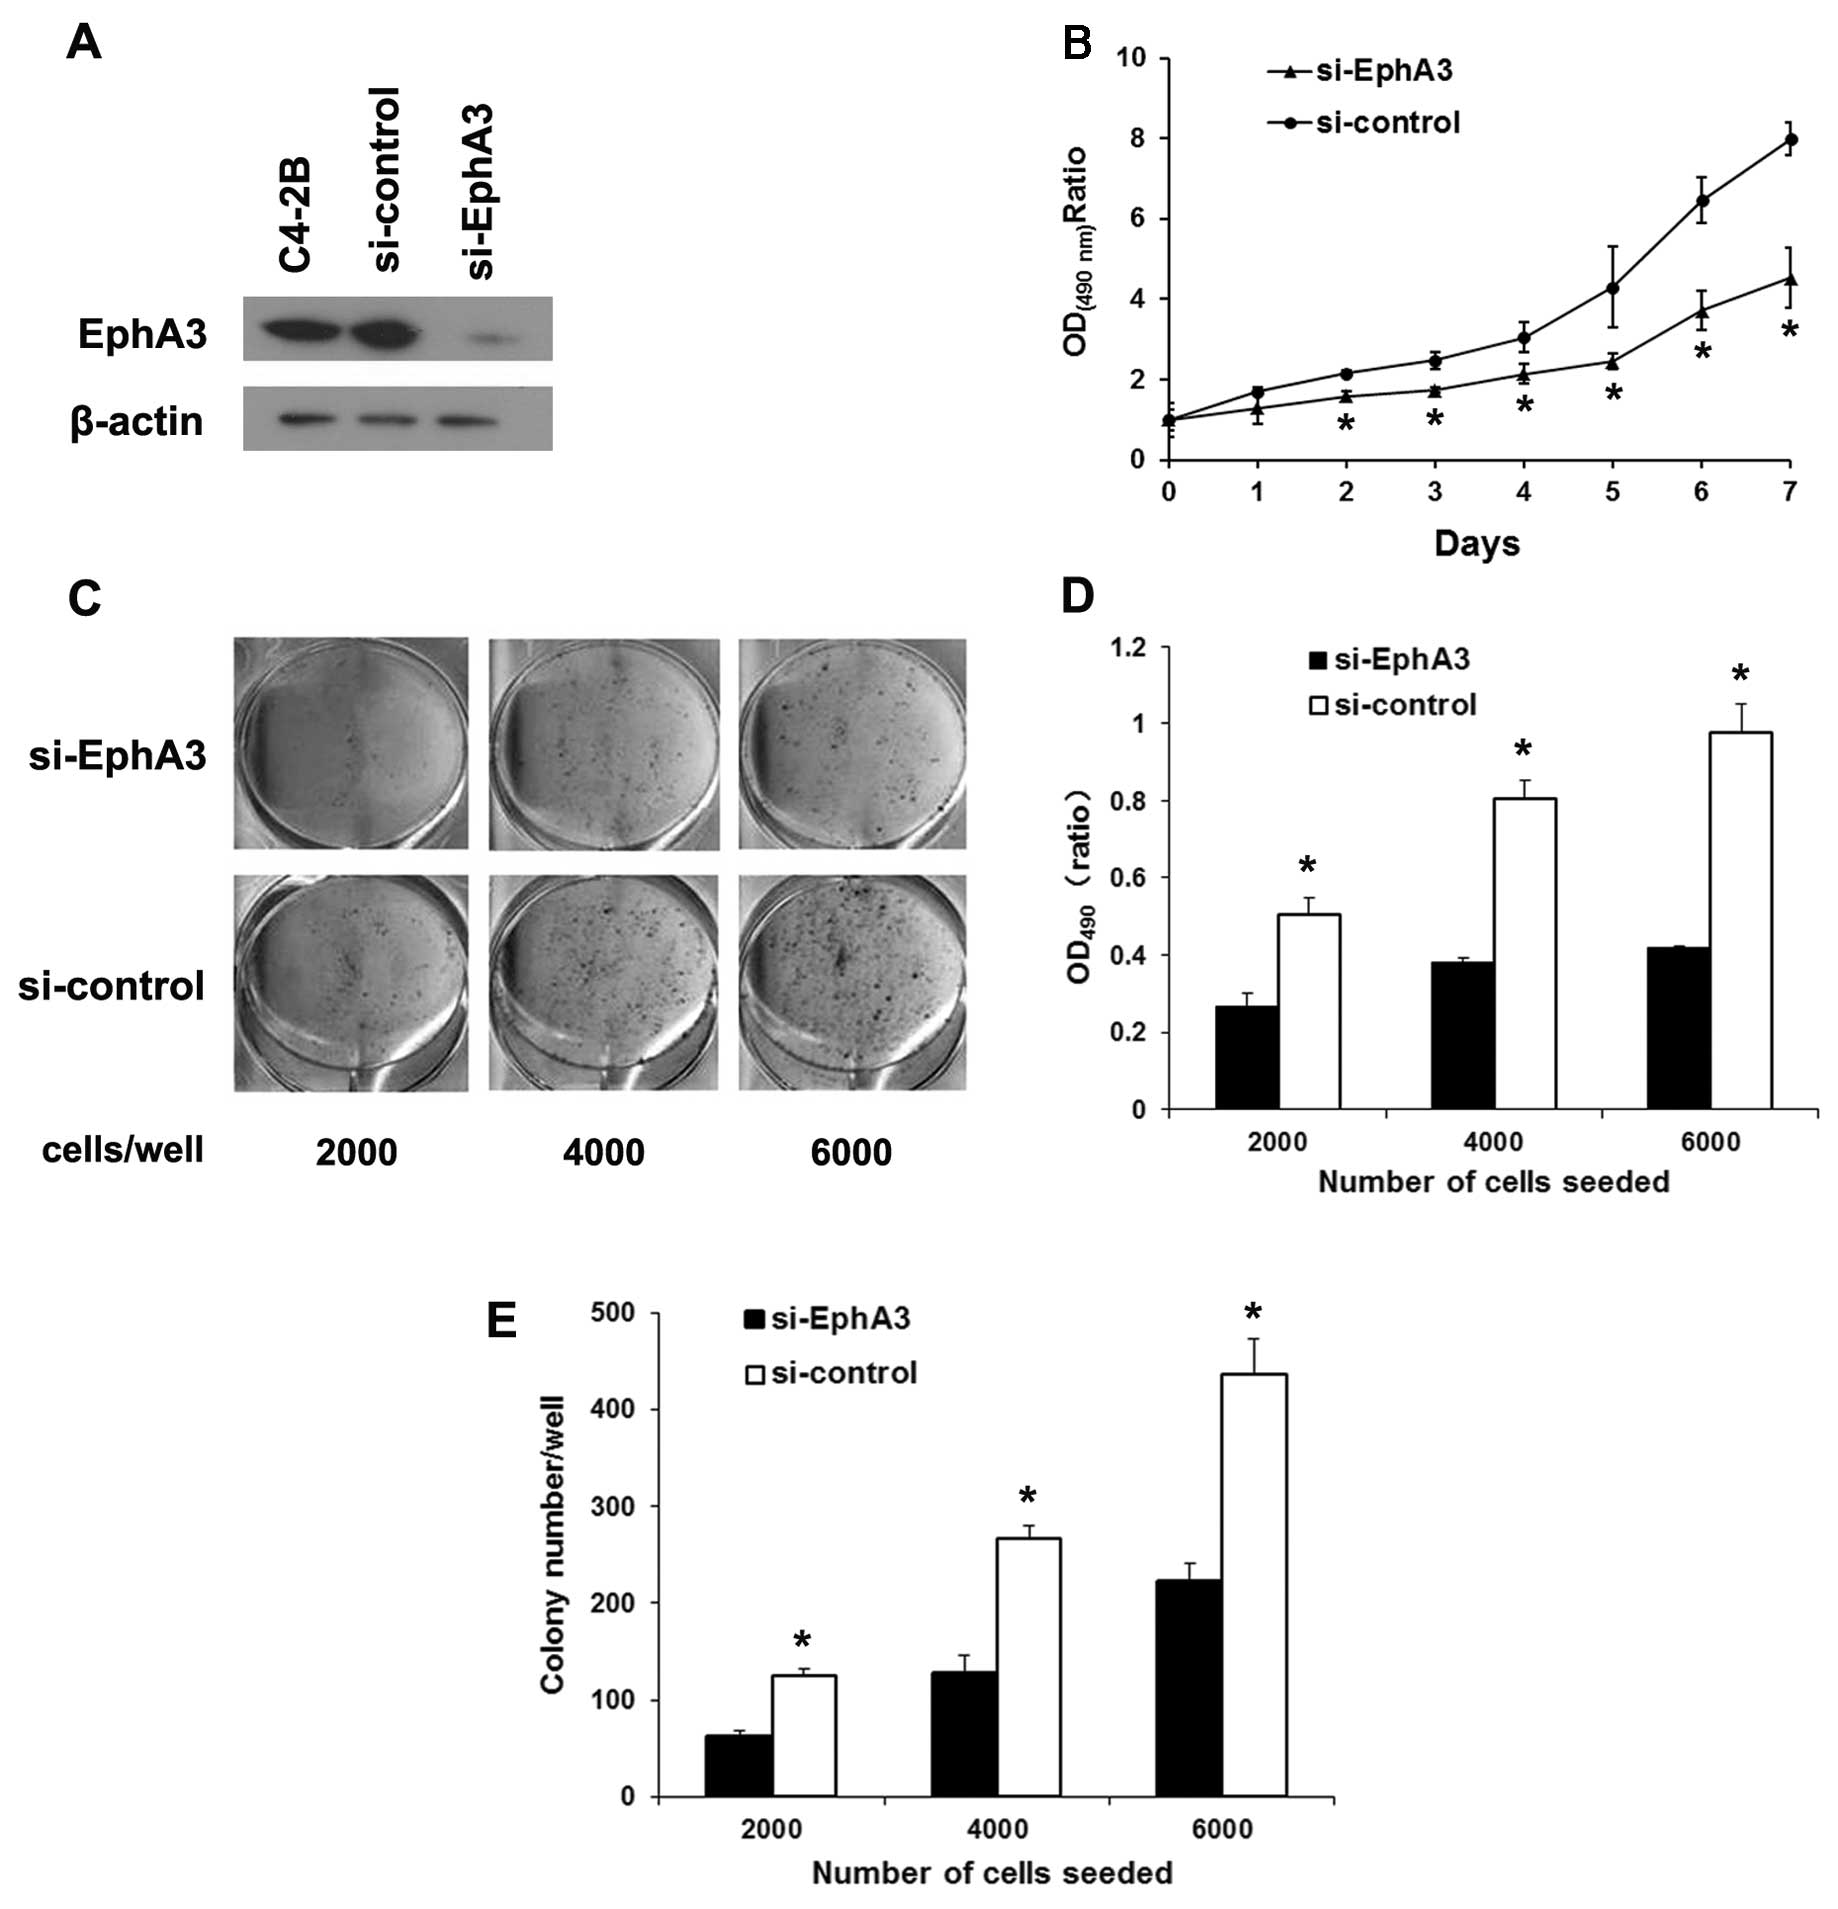
Due to its high expression of EphA3 protein in C4-2B
cells, they were chosen to construct the EphA3 knockdown cell
model. EphA3 targeted siRNA was transfected into C4-2B cells, and
the expression of EphA3 was markedly suppressed compared with the
si-control and parental cells (Fig.
3A). In the MTT assay, the growth rate of the
si-EphA3-transfected cells was decreased compared with this rate in
the si-control cells (Fig. 3B). In
the plate colony-formation assay, EphA3 suppression led to a
markedly reduction in colony-formation ability of the C4-2B cells
(Fig. 3C and D). Similarly, EphA3
suppression decreased the clonogenicity of the C4-2B cells compared
with that noted in the control cells (Fig. 3E). These results suggest that
knockdown of EphA3 suppresses the proliferation and survival of
C4-2B cells, coinciding with the results in the LNCaP cells.
EphA3 enhances the tumorigenicity of
prostate cancer cells in vivo
EphA3 enhances the proliferation and survival of
prostate cancer cell in vitro. Furthermore, we determined
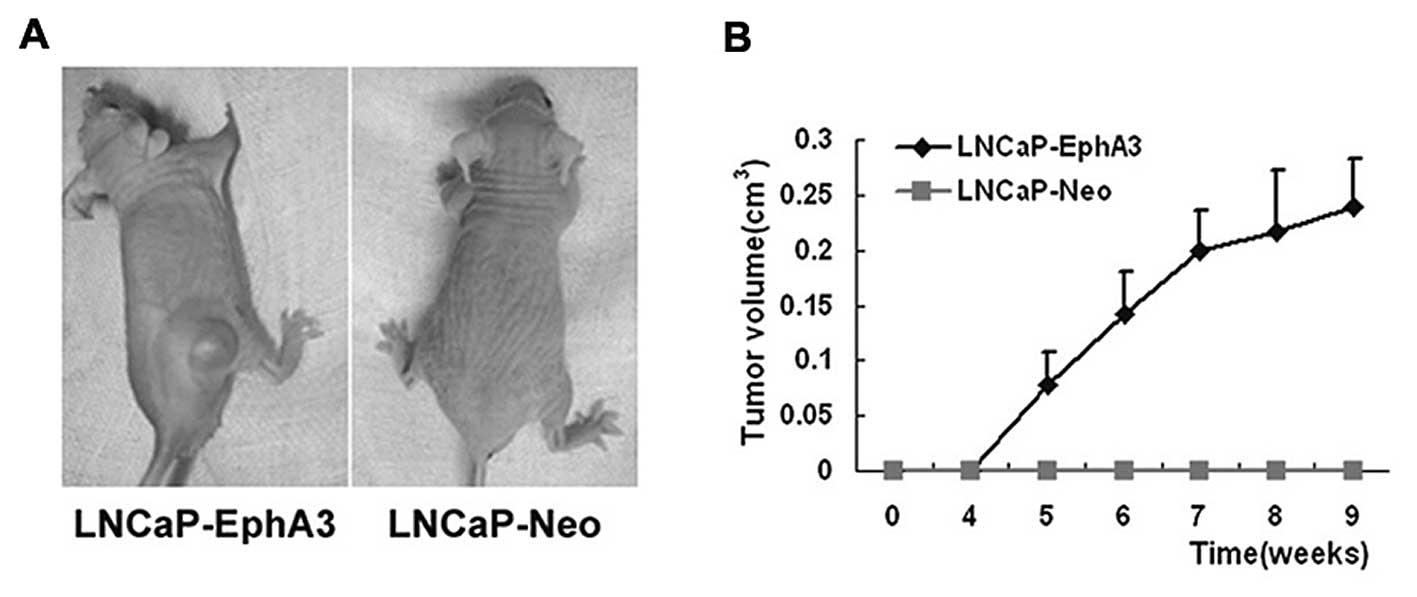
the in vivo tumor growth and tumor take of
EphA3-overexpressing LNCaP cells in nude mice. Similar to PC-1,
data from the s.c. model indicated that ectopic EphA3 expression
facilitated the tumor take rate and accelerated tumor growth in the
LNCaP-EphA3 cells (Fig. 4A).
Detectable tumors were observed within 5 weeks after injection
(Fig. 4B). Visible tumors were
noted in 4/7 mice by the end of 9 weeks. In contrast, the control
LNCaP cells did not form tumors. In addition, tumor-bearing mice
also exhibited a more emaciated phenotype than mice without tumors.
These data indicate that EphA3 enhances the tumorigenicity of
prostate cancer cells in vivo.
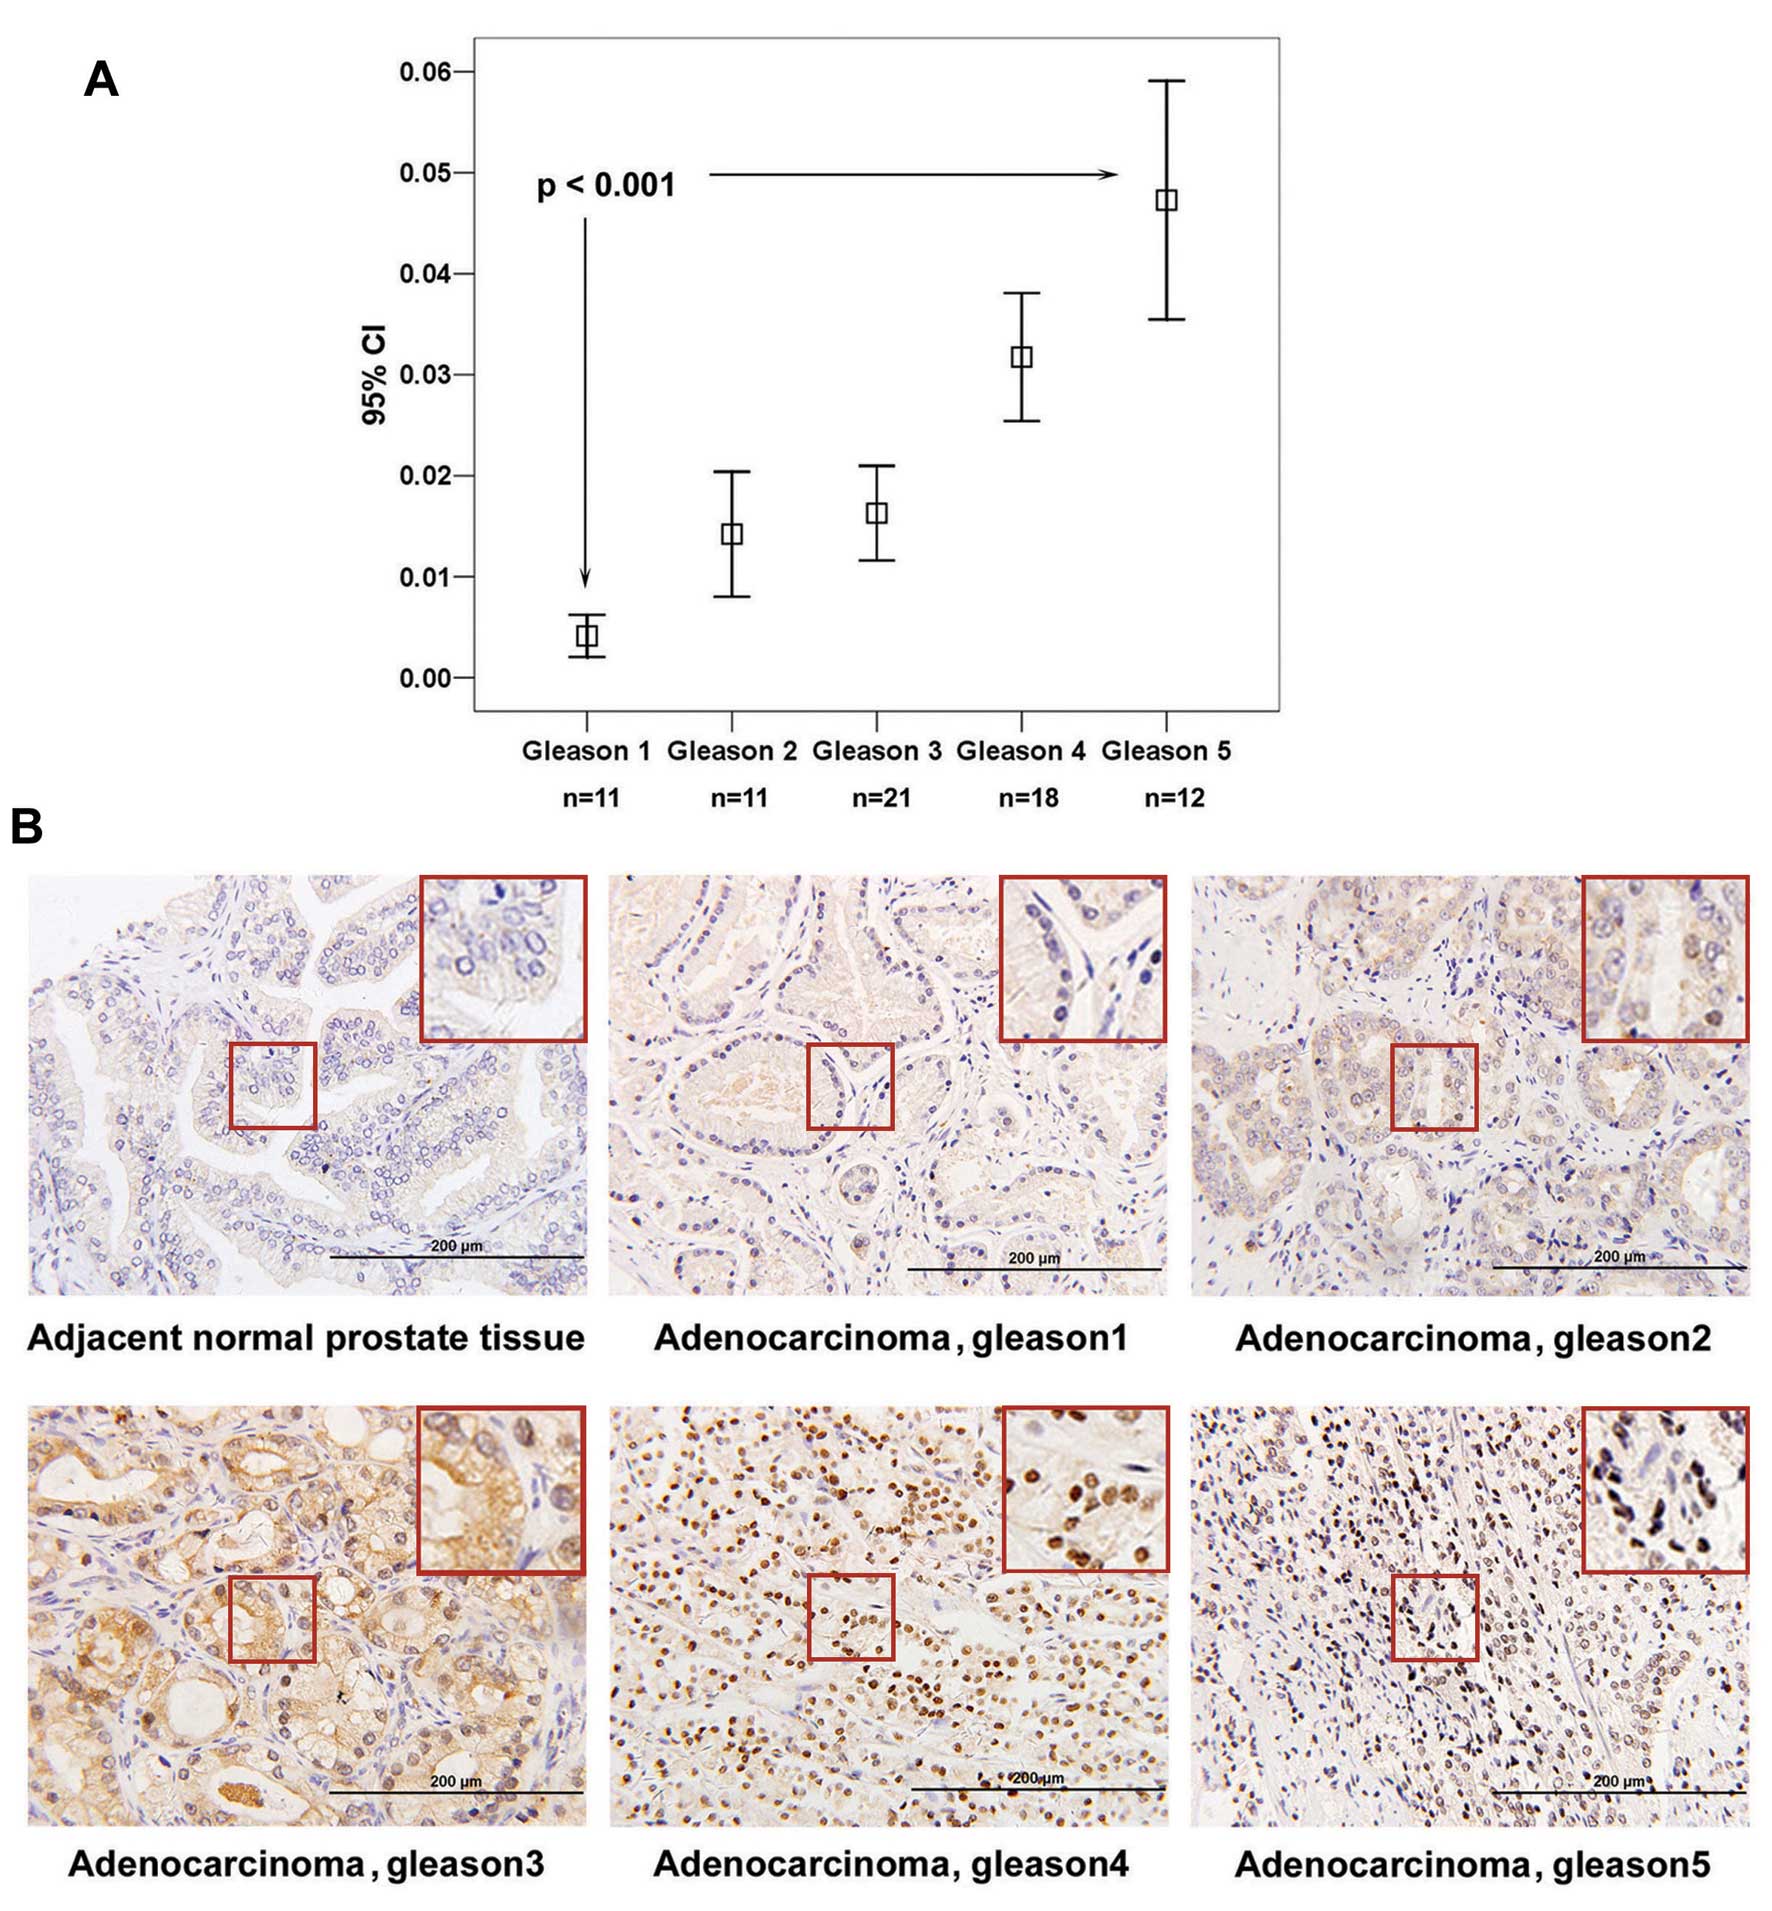
EphA3 is overexpressed in clinical
prostate cancer specimens and its expression and cellular
localization are correlated with the Gleason grade of prostate
cancer
A tissue array containing 110 clinical specimens of
BPH, PCa and adjacent normal prostate tissues, was analyzed by
immunohistochemistry. Excluding 4 cases of non-adenocarcinoma,
medium to strong expression of EphA3 was observed in 59/73 (80.8%)
cancer tissues, while weak expression of EphA3 was detected in 8/27
(29.6%) normal prostate tissues (Table
II). Immunohistochemisty staining was quantitated using image
analysis software, and statistical analyses identified a positive
correlation between levels of EphA3 and the Gleason grade of PCa
(Fig. 5A). Cellular localization of
EphA3 was also found to change as the grade of PCa increased. EphA3
was expressed preferentially in the cytoplasm in Gleason 1 samples,
EphA3 was distributed equally between the cytoplasm and nucleus in
Gleason 2 and 3 samples, predominantly nuclear staining was
observed in Gleason 4 samples, and a nodular expression pattern was
observed in a cluster of cell nuclei in Gleason 5 samples (Fig. 5B). To confirm these results, a
second tissue array containing 207 dots of 69 clinical specimens
(triplicate for each), including normal prostate, BPH, PCa, and
adjacent normal prostate tissues was assembled and analyzed.
Results consistent with the first array were observed (data not
shown). EphA3 was overexpressed in PCa specimens and its expression
increased and its cellular localization changed as the Gleason
grade was elevated.
| Table IIExpression of EphA3 in human prostate
specimens. |
Table II
Expression of EphA3 in human prostate
specimens.
| | Expression of
EphA3 |
|---|
| |
|
|---|
| Cases, n | Positive, n
(%) | Negative, n
(%) |
|---|
| Normal | 27 | 8 (29.6) | 19 (70.4) |
| BPH | 6 | 1 (16.7) | 5 (83.3) |
| Cancer | 73 | 59 (80.8)a | 14 (19.2) |
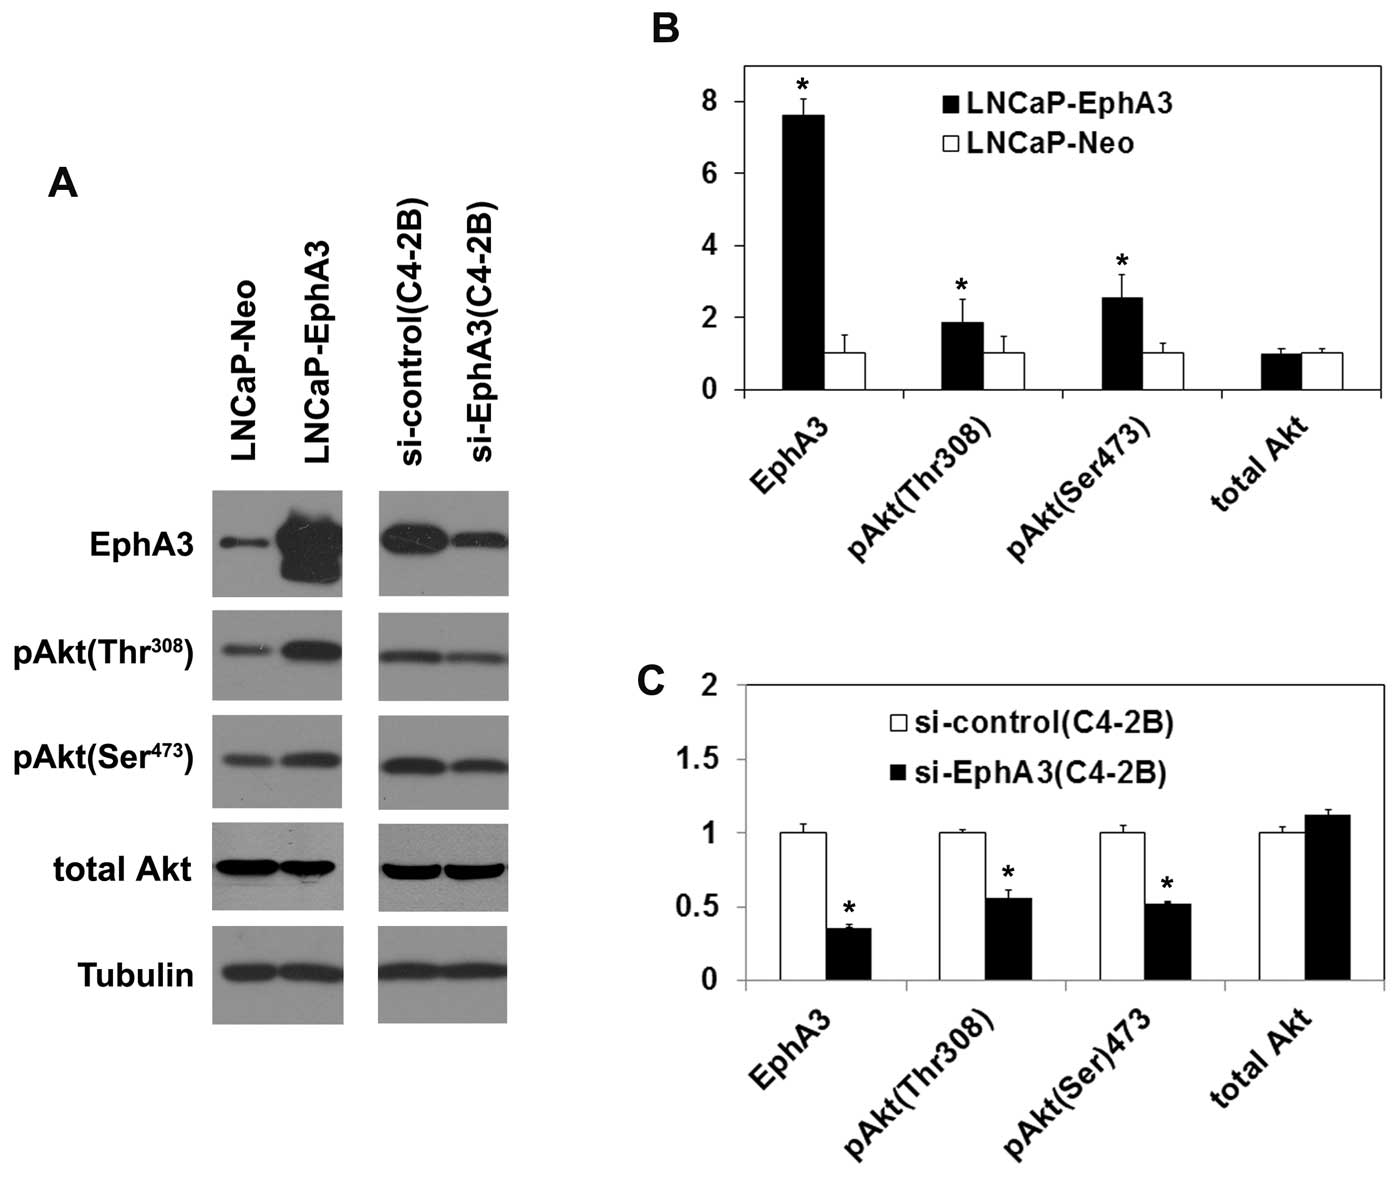
EphA3 activates the Akt signaling
pathway
The Akt signaling pathway has been
well-characterized for its role in promoting cell growth, invasion
and metastasis during tumorigenesis (21–23).
We examined the impact of EphA3 on the Akt pathway. Overexpression
of EphA3 was found to increase the phosphorylation of Akt at Ser473
and Thr308 in LNCaP cells. The phosphorylation of Akt was deduced
with inhibition of EphA3 in the C4-2B cells (Fig. 6A). The quantitation of the
expression of the genes showed that the expression levels of EphA3,
pAkt (Ser473), pAkt (Thr308) changed significantly (Fig. 6B and C). These results indicate that
EphA3 activates the Akt signaling pathway.
Discussion
EphA3 is a member of the Eph receptor subfamily, the
largest family of vertebrate receptor protein tyrosine kinases.
Increasing evidence has demonstrated a strong correlation between
dysregulation of Eph family members and tumorigenesis and
progression. EphA3 was originally isolated from the membrane of
pre-B cell acute lymphoblastic leukemia cells and was associated
with axon-guiding events (24).
More recently, EphA3 has been found to be related with multiple
tumors, such as malignant melanoma, lymphoid tumors, lung and
breast cancer. Although several studies have reported that EphA3 is
expressed at higher levels in PCa cells, there is limited data
regarding the functional significance of EphA3 expression. Even in
other types of tumors, the role of EphA3 has not been investigated
as extensively as other members of the Eph receptor family. The
present study represents the first investigation of EphA3 function
in the development and progression of PCa.
In the present study, EphA3 was identified in a
comparative gene array analysis of PC-1-overexpressing LNCaP and
control cells. PC-1 is a novel isolated prostate-specific gene
(17). Contrary to its low
expression in the androgen-dependent human prostate cancer cell
line LNCaP, the level of PC-1 is differentially elevated in the
lineage-related but androgen-independent C4-2 human prostate cancer
cells, which are capable of forming tumors in castrated mice
(25). PC-1 expression enhanced the
proliferation and invasion capability in vitro and also
increased the tumorigenicity in an in situ prostate cancer
animal model, which indicated that PC-1 expression contributes to
the malignancy progression of prostate cancer (26).
In the present study, EphA3 was not detected in
cells derived from BPH, yet was expressed at high levels in PCa
cell lines, LNCaP and C4-2B. EphA3 expression was also detected in
PCa patient tissues, and not in adjacent normal tissues or BPH
tissue specimens. A positive correlation between the extent of
EphA3 expression and the Gleason grade of PCa was also observed,
which is consistent with data from melanoma cell lines derived from
distant metastases that have been shown to express higher levels of
EphA3 compared to primary melanomas (27). In vitro and in vivo
assays also demonstrated that overexpression of EphA3 enhanced the
survival and tumorigenicity of PCa cells. Based on these data, as
well as evidence that EphA3 can induce the malignant transformation
of NIH3T3 cells (28), we conclude
that EphA3 is a potential oncogene that has an important role in
the development and malignant progression of PCa. The Akt signaling
pathway plays an important role in promoting cell growth, invasion
and metastasis during tumorigenesis (21–23).
In the present study, EphA3 increased phosphorylation of Akt in
LNCaP and C4-2B cells, suggesting the association of EphA3-induced
progression of PCa with activation of the Akt pathway.
In conclusion, we demonstrate that EphA3 is induced
by PC-1 and is able to promote the development and progression of
PCa. These findings offer the the potential to identify novel
therapeutic targets of EphA3-positive prostate cancers to improve
patient treatment and survival.
Acknowledgements
The present study was supported in part by the
National Science and Technology Major Project of the Ministry of
Science and Technology of China (2012ZX10003008002 to S.H.L.) and
the National Natural Science Foundation of China (81372770 to
J.G.Z. and 81371740 to J.W.).
References
|
1
|
Jemal A, Bray F, Center MM, Ferlay J, Ward
E and Forman D: Global cancer statistics. CA Cancer J Clin.
61:69–90. 2011. View Article : Google Scholar
|
|
2
|
Baade PD, Youlden DR, Cramb SM, Dunn J and
Gardiner RA: Epidemiology of prostate cancer in the Asia-Pacific
region. Prostate Int. 1:47–58. 2013. View Article : Google Scholar : PubMed/NCBI
|
|
3
|
Wang R, Xu J, Saramaki O, et al: PrLZ, a
novel prostate-specific and androgen-responsive gene of the TPD52
family, amplified in chromosome 8q21.1 and overexpressed in human
prostate cancer. Cancer Res. 64:1589–1594. 2004. View Article : Google Scholar
|
|
4
|
Li L, Xie H, Liang L, et al: Increased
PrLZ-mediated androgen receptor transactivation promotes prostate
cancer growth at castration-resistant stage. Carcinogenesis.
34:257–267. 2013. View Article : Google Scholar
|
|
5
|
Zhang H, Wang J, Pang B, et al: PC-1/PrLZ
contributes to malignant progression in prostate cancer. Cancer
Res. 67:8906–8913. 2007. View Article : Google Scholar : PubMed/NCBI
|
|
6
|
Wang J, Zhang H, Liang RX, et al:
Identification and characterization of the novel human prostate
cancer-specific PC-1 gene promoter. Biochem Biophys Res Commun.
357:8–13. 2007. View Article : Google Scholar : PubMed/NCBI
|
|
7
|
Yu L, Shi QG, Qian XL, et al: PC-1
enhances c-myc gene expression in prostate cancer cells. Yi Chuan.
32:348–352. 2010.(In Chinese).
|
|
8
|
Wimmer-Kleikamp SH and Lackmann M:
Eph-modulated cell morphology, adhesion and motility in
carcinogenesis. IUBMB Life. 57:421–431. 2005. View Article : Google Scholar : PubMed/NCBI
|
|
9
|
Wood LD, Calhoun ES, Silliman N, et al:
Somatic mutations of GUCY2F, EPHA3, and NTRK3 in human cancers. Hum
Mutat. 27:1060–1061. 2006. View Article : Google Scholar : PubMed/NCBI
|
|
10
|
Brantley DM, Cheng N, Thompson EJ, et al:
Soluble Eph A receptors inhibit tumor angiogenesis and progression
in vivo. Oncogene. 21:7011–7026. 2002. View Article : Google Scholar : PubMed/NCBI
|
|
11
|
Vearing C, Lee FT, Wimmer-Kleikamp S, et
al: Concurrent binding of anti-EphA3 antibody and ephrin-A5
amplifies EphA3 signaling and downstream responses: potential as
EphA3-specific tumor-targeting reagents. Cancer Res. 65:6745–6754.
2005. View Article : Google Scholar : PubMed/NCBI
|
|
12
|
Keane N, Freeman C, Swords R and Giles FJ:
EPHA3 as a novel therapeutic target in the hematological
malignancies. Expert Rev Hematol. 5:325–340. 2012. View Article : Google Scholar : PubMed/NCBI
|
|
13
|
Guan M, Liu L, Zhao X, et al: Copy number
variations of EphA3 are associated with multiple types of
hematologic malignancies. Clin Lymphoma Myeloma Leuk. 11:50–53.
2011. View Article : Google Scholar : PubMed/NCBI
|
|
14
|
Day BW, Stringer BW, Al-Ejeh F, et al:
EphA3 maintains tumorigenicity and is a therapeutic target in
glioblastoma multiforme. Cancer Cell. 23:238–248. 2013. View Article : Google Scholar : PubMed/NCBI
|
|
15
|
Hafner C, Schmitz G, Meyer S, et al:
Differential gene expression of Eph receptors and ephrins in benign
human tissues and cancers. Clin Chem. 50:490–499. 2004. View Article : Google Scholar : PubMed/NCBI
|
|
16
|
Singh AP, Bafna S, Chaudhary K, et al:
Genome-wide expression profiling reveals transcriptomic variation
and perturbed gene networks in androgen-dependent and
androgen-independent prostate cancer cells. Cancer Lett. 259:28–38.
2008. View Article : Google Scholar
|
|
17
|
Zhang D, He D, Xue Y, et al: PrLZ protects
prostate cancer cells from apoptosis induced by androgen
deprivation via the activation of Stat3/Bcl-2 pathway. Cancer Res.
71:2193–2202. 2011. View Article : Google Scholar : PubMed/NCBI
|
|
18
|
van Bokhoven A, Varella-Garcia M, Korch C,
et al: Molecular characterization of human prostate carcinoma cell
lines. Prostate. 57:205–225. 2003.PubMed/NCBI
|
|
19
|
Wu X, Gong S, Roy-Burman P, Lee P and
Culig Z: Current mouse and cell models in prostate cancer research.
Endocr Relat Cancer. 20:R155–R170. 2013. View Article : Google Scholar : PubMed/NCBI
|
|
20
|
Wu RQ, Li QM, Shi QG, Zhang H, Qian XL, Yu
L and Zhou JG: PC-1 can enhance transcription of EphA3, a member of
RTK family, in prostate cancer cells. Chin J Biochem Mol Biol.
25:633–639. 2009.
|
|
21
|
Jeong SJ, Pise-Masison CA, Radonovich MF,
Park HU and Brady JN: Activated AKT regulates NF-kappaB activation,
p53 inhibition and cell survival in HTLV-1-transformed cells.
Oncogene. 24:6719–6728. 2005. View Article : Google Scholar : PubMed/NCBI
|
|
22
|
Viglietto G, Motti ML, Bruni P, et al:
Cytoplasmic relocalization and inhibition of the cyclin-dependent
kinase inhibitor p27Kip1 by PKB/Akt-mediated
phosphorylation in breast cancer. Nat Med. 8:1136–1144. 2002.
View Article : Google Scholar : PubMed/NCBI
|
|
23
|
Vivanco I and Sawyers CL: The
phosphatidylinositol 3-kinase AKT pathway in human cancer. Nat Rev
Cancer. 2:489–501. 2002. View
Article : Google Scholar : PubMed/NCBI
|
|
24
|
Wicks IP, Wilkinson D, Salvaris E and Boyd
AW: Molecular cloning of HEK, the gene encoding a receptor tyrosine
kinase expressed by human lymphoid tumor cell lines. Proc Natl Acad
Sci USA. 89:1611–1615. 1992. View Article : Google Scholar : PubMed/NCBI
|
|
25
|
Wang R, Xu J, Mabjeesh N, et al: PrLZ is
expressed in normal prostate development and in human prostate
cancer progression. Clin Cancer Res. 13:6040–6048. 2007. View Article : Google Scholar : PubMed/NCBI
|
|
26
|
Li L, Zhang D, Zhang L, et al: PrLZ
expression is associated with the progression of prostate cancer
LNCaP cells. Mol Carcinog. 48:432–440. 2009. View Article : Google Scholar : PubMed/NCBI
|
|
27
|
Easty DJ and Bennett DC: Protein tyrosine
kinases in malignant melanoma. Melanoma Res. 10:401–411. 2000.
View Article : Google Scholar : PubMed/NCBI
|
|
28
|
Li QM, Wu RQ, Pan DR and Zhou JG:
Construction and analysis of EphA3 gene stable-expressed NIH3T3
cell model. Lett Biotech. 20:609–611. 2009.
|