Introduction
Molecular analysis of human and experimental animal
cancer models has established that they arise as a result of the
deregulation of intricate mechanisms that control cell growth and
differentiation. A major theme emerging from such studies is that
mutations of both oncogenes and tumor-suppressor genes are required
for malignancy, both being necessary for cell transformation and
the latter for the expression of the malignant phenotype (1). According to Knudson’s ‘two hit’
hypothesis, many types of human cancers are thought to develop by
genetic alterations of putative tumor-suppressor genes that require
a biphasic process to eliminate both alleles. Most frequently one
of these two events involves the loss of one allele due to
chromosomal deletion (2). This
allelic alteration may occur either by microsatellite instability
(MSI) or loss of heterozygosity (LOH) (3).
It is unclear whether allelic imbalance is the cause
or the result of carcinogenesis, but it is probably the most common
genetic factor associated with cancer. Identifying markers that
have the potential to predict tumorigenic behavior is important in
breast cancer due to the variability in clinical disease
progression (4). Genetic
alterations during neoplastic progression may appear as changes in
total DNA content, single genes, or gene expression (5). Oncogenic alterations are thought to be
prognostic indices for patients with breast cancer. During the
multistage process of mammary carcinogenesis, stepwise accumulation
of genetic changes causes uncontrolled growth, disruption of normal
glandular architecture, and invasion of epithelial cells into the
adjacent stroma, which ultimately leads to the subversion of
orderly epithelial tissue organization. This subversion is a
hallmark of malignancy and plays a crucial role in tumor
progression (6). It also produces
frequent allelic losses at various chromosomal regions, such as 1p,
3p, 6q, 8p, 11, 13q, 16q, 17 and 18q, associated with breast cancer
(7–9).
Chromosome 11 is unique in this context, as at least
three separate regions of LOH/MSI have been identified
(11p15-p15.5, 11q13-q13.3 and 11q23-q24), pointing to a potentially
complicated role of this chromosome in breast carcinogenesis
(10,11). Cytogenetic studies and
microcell-mediated transfer of human chromosome 11 into tumor cell
lines have provided additional evidence of the presence of
tumor-suppressor genes on chromosome 11 in melanoma, breast cancer
and cervical cancer (12,13). There are many important families of
genes, such as FGF, CCND1, FADD, BAD and GAD2, that are located on
chromosome 11 and play a crucial role in breast cancer progression
(14,15). Among them, different members of the
fibroblast growth factor (FGF) family of genes are clustered around
the human chromosome 11q13 amplicon, commonly altered during breast
cancer progression (16).
Currently, it is well established that activation of various
proto-oncogenes, such as c-MYC, c-ERBB-2/NEU and FGF3/INT2, could
trigger uncontrolled cell growth and cancer development, but among
them FGF3/INT2 gene amplification is found to be a better
independent prognostic indicator of human breast cancer (17).
We previously reported chromosomal alterations along
11q23-q24 loci following radiation and estrogen treatment (18) but there is no report available
concerning the chromosomal locus 11q13 and alteration of FGF3 gene
(11q13) expression. Therefore, to assess the effect of ionizing
radiation and estrogen at chromosome 11q13 loci and the subsequent
role of FGF3 gene expression, we utilized a human breast cancer
model derived from irradiated, transformed and tumorigenic MCF-10F
cell lines treated with different doses of high-LET (α-particle)
radiation and estrogen exposure (19).
Materials and methods
Cell lines
The recently established radiation-induced breast
carcinogenic model based on the MCF-10F cell line was cultured and
used in this study as presently described (19,20).
From such a model, the following cell lines were used as control:
MCF-10F cell line (passage 40); MCF-10F cell line treated with
17β-estradiol [estrogen (E); 10−8 M; Sigma Chemical Co.,
St. Louis, MO, USA], named Estrogen (19). The experimental cell lines used in
this study were as follows: MCF-10F cell line irradiated with a
double dose of 60 cGy of α particles, namely 60 cGy/60 cGy
(Alpha3), which was anchorage-independent but non-tumorigenic in
nude mice (19); MCF-10F cell line
subjected to a double dose of 60 cGy of α particles and treated
with estrogen before each radiation exposure, named 60 cGy+E/60 cGy
+ E (Alpha 5), which was anchorage-independent and produced tumors
in nude/SCID mouse and after injection gave rise to Tumor2.
Phenotypic characteristics of these cell lines and their genetic
alterations including differentially expressed genes and expression
of various proteins have been previously described (21–24).
DNA isolation
Cell cultures were treated with 1 ml of lysis buffer
[100 mM NaCl, 20 mM Tris-HCl (pH 8.0), 25 mM EDTA (pH 8.0), 0.5%
sodium dodecyl sulfate] with 200 mg/ml of proteinase K and RNase
(100 μg/ml), and incubated overnight at 37°C with constant gentle
agitation (25). Then, they were
purified and dissolved in TE buffer following standard procedures
(26).
Selection of markers for microsatellite
polymorphism
Four polymorphic dinucleotide (CA)n
repeat microsatellite markers from chromosome 11q13-q13.3 were
selected (Research Genetics, Huntsville, AL, USA). They were
selected on the basis of their maximum heterozygosity (>0.70)
and their location near mapped, known tumor-suppressor genes,
oncogenes or other cancer-related genes (Table IA). The sequences of microsatellite
oligonucleotide primers were obtained from the GDB database
(http://www.ncbi.nlm.nih.gov/tools/primer-blast)
(Table IB). We also tested D2S123
(2p16, 0.77, dinucleotide, 197–227 bp), a CA repeat marker linked
to the HMSH2 gene, mapped at 2p16, where LOH is rarely
encountered (data not shown).
 | Table ICharacteristics of selected repeat
markers (CA)n and sequence of sense and antisense
primers of microsatellite markers and other important genes located
on chromosome 11q13-q13.3. |
Table I
Characteristics of selected repeat
markers (CA)n and sequence of sense and antisense
primers of microsatellite markers and other important genes located
on chromosome 11q13-q13.3.
| A, Characteristics
of selected repeat markers (CA)n on chromosome
11q13-q13.3 |
|---|
|
|---|
| Chromosomal
locus | Map
positiona | Maximum
heterozygosity | Type of
sequence | Size range [base
pairs (bp)] |
|---|
| D11S2179 | 11q13-q13.3 | 0.792 | Dinucleotide | 123–133 |
| FGF3 | 11q13 | 0.853 | Dinucleotide | 198–220 |
| INT2 | 11q13 | 0.788 | Dinucleotide | 364–379 |
| PYGM(CA) | 11q13.1 | 0.761 | Dinucleotide | 152–160 |
|
| B, Sequence of
sense and antisense primers of microsatellite markers and other
important genes located at chromosome 11q13-q13.3 |
|
| Chromosomal
locus | Primer sequence
sense (5′→3′)/antisense (5′→3′) | Important genes
within these marker regions |
|
| D11S2179 |
TAGGCAATACAGCAAGACCCTG/GCACTGGAATACGATTCTAGCAC | bad, Sfg in breast
cancer |
| FGF3 |
ATTTCCAGAGCCAGCTCAAA/CTTTAATGTTGTGATGACACAAAGC | ccnd1, fadd, bad,
gad2 |
| INT2 |
TCTGCCTCCTGGGTTCAAG/AGGAAAGACAAGGTTGTAGG | ccnd1, int2,
fgfr |
| PYGM(CA) |
CTAGCAGAGTCCACCTACTG/GCTGTCAGGTAGCAACTGAC | gad2 in breast
cancer, Tsg |
PCR-single strand conformation
polymorphism analysis
PCR-single strand conformation polymorphism (SSCP)
analysis was carried out in a volume of 30 μl containing 50–100 ng
of genomic DNA, 1.5 mM MgCl2, 50 mM KCl, 10 mM Tris-HCl
(pH 8.3), 200 μM of each dNTP, 0.8 μM of each primer (Research
Genetics), and 0.75 units of AmpliTaq polymerase (Perkin-Elmer
Corp., Foster City, CA, USA) (27).
One of the primers was 5′-end-labeled with [γ-32p] ATP
at 3000 Ci/mmol (Amersham Pharmacia Biotech., Skokie, IL, USA) by
T4-polynucleotide kinase (Amersham Life Science,
Arlington Heights, IL, USA). After a 5-min pre-incubation period at
94°C, DNA was amplified for 35 cycles consisting of 45 sec at 94°C,
45 sec at 55°C, and 1 min at 72°C, followed by a 7-min final
extension at 72°C using the GeneAmp® PCR System 2400
(Perkin Elmer/Applied Biosystems, Foster City, CA, USA). PCR
products were processed by diluting 1:1 in denaturing loading
buffer (95% formamide, 20 mM EDTA, 0.05% xylene cyanol FF, and
0.05% bromophenol blue); denaturing at 95°C for 5 min and then
frozen at 4°C. Two microliters of the aliquot was loaded and
electrophoresed on 6% polyacrylamide gels containing 8.3 M urea for
2–3 h at 40 W. The gel was fixed in 10% methanol-10% acetic acid,
dried and exposed to Kodak X-omat-AR film (Eastman Kodak Co.,
Rochester, NY, USA) at −70°C with an intensifying screen for 12–16
h. PCR reaction was always repeated 2–3 times with different
adjacent passages of cells to get consistent results.
Assessment of allelic losses
MSI/LOH were screened by PCR amplification of
microsatellite markers. MSI was defined as a shift of a specific
allelic band or a change (increase or decrease) in the broadness of
a specific allelic band in the auto-radiogram, whereas LOH was
defined as a total loss (complete deletion) or a 50% or more
reduction (in signal density) in one of the heterozygous alleles in
the autoradiogram. It was first scored by visual inspection of the
autoradiogram, and then band intensity was quantified in a
densitometric scanner (model 300A) by Image Quant (ver. 3.3; both
from Molecular Dynamics). Optical density range of 0.01 to 4.0 was
chosen in OD units, whereas spatial resolution was selected at 100
points/cm in both directions (x and y). Resolution (signal) was
selected at 4096 levels (12-bit) of optical density.
Determination of protein expression by
immunofluorescence technique
Exponentially growing cells were plated on a glass
chamber slide (Nunc Inc., Naperville, IL, USA) as previously
described (28), at a density of
1×10⁴ cells/ml of growth medium. Three independent
biological experiments were performed. FGF3 protein expression was
detected using the primary antibody (sc-135; in a 1:500 dilution
from the original stock concentration; Santa Cruz Biotechnology,
Santa Cruz, CA, USA). Rhodamine-conjugated secondary antibody was
from Jackson ImmunoResearch Lab., West Grove, PA, USA. Slides were
mounted using Vectashield mounting medium (Vector Laboratories,
Burlingame, CA, USA). Cells were examined using Zeiss Axiovert 100
TV microscope (Carl Zeiss, Thornwood, NY, USA) using a 40× 11.3 NA
objective lens equipped with a laser scanning confocal attachment
(LSM 410; Carl Zeiss, Thornwood, NY, USA). Staining intensity and
fluorescent (argon/krypton laser, 488 nm) images of the cells were
generated and quantified as previously described (19,24,28). A
semi-quantitative estimation based on relative staining intensity
of protein expression was determined for the parental,
non-tumorigenic and tumorigenic cell lines. The number of
immunoreactive cells (30 cells/field) was counted in 5 randomly
selected microscopic fields per sample. Standard error of the mean
values are shown in the representative figures. Statistical
analysis was carried out with the F-test (randomized block) and
comparisons between groups with the Bonferroni t-test with
P<0.05 considered to indicate a statistically significant
difference (29).
Fluorescent-labeled probe preparation for
microarray analysis
Poly(A) mRNA from normal, radiation- and
estrogen-treated breast cancer cell lines was isolated using
QIA-direct mRNA isolation kit (Qiagen). Fluorescent-labeled cDNA
was prepared from 1 μg of each of these poly(A) mRNAs using oligo
dT-primed polymerization and Superscript II reverse transcriptase
kit (Life Technologies), in the presence of either Cy3- or
Cy5-labeled dCTP following the usual procedure as described in
http://cmgm.stanford.edu/pbrown/protocols.html. The
appropriate Cy3- and Cy5-labeled probes were pooled and hybridized
to a microarray in glass coverslips for 16 h at 65°C and then
washed with high stringency for analysis.
Analysis of gene expression by Affymetrix
HG-U133A Plus 2.0 GeneChip microarray
The breast cancer model (Alpha model) containing the
i) MCF-10F, ii) Estrogen iii) Alpha3, iv) Alpha5 and v) Tumor2 cell
lines was used to analyze gene expression by Affymetrix U133A
oligonucleotide microarray (Affymetrix, Santa Clara, CA, USA),
which contains 14,500 genes. Arrays were quantitatively analyzed
for gene expression using the Affymetrix GeneChip®
operating software (GCOS) with dual global scaling option in a
Genes@Work software platform of discovery algorithm SPLASH
(structural pattern localization analysis by sequential histograms)
with a false discovery rate of 0.05 (30,31).
Results
A study of allelic losses and altered gene
expression in the human breast Alpha model was analyzed in this
study. Identification of allelic losses at the specific chromosomal
region of 11q13-q13.3 using a total of four microsatellite markers
from chromosome 11q13 was used to assess the allelic alterations in
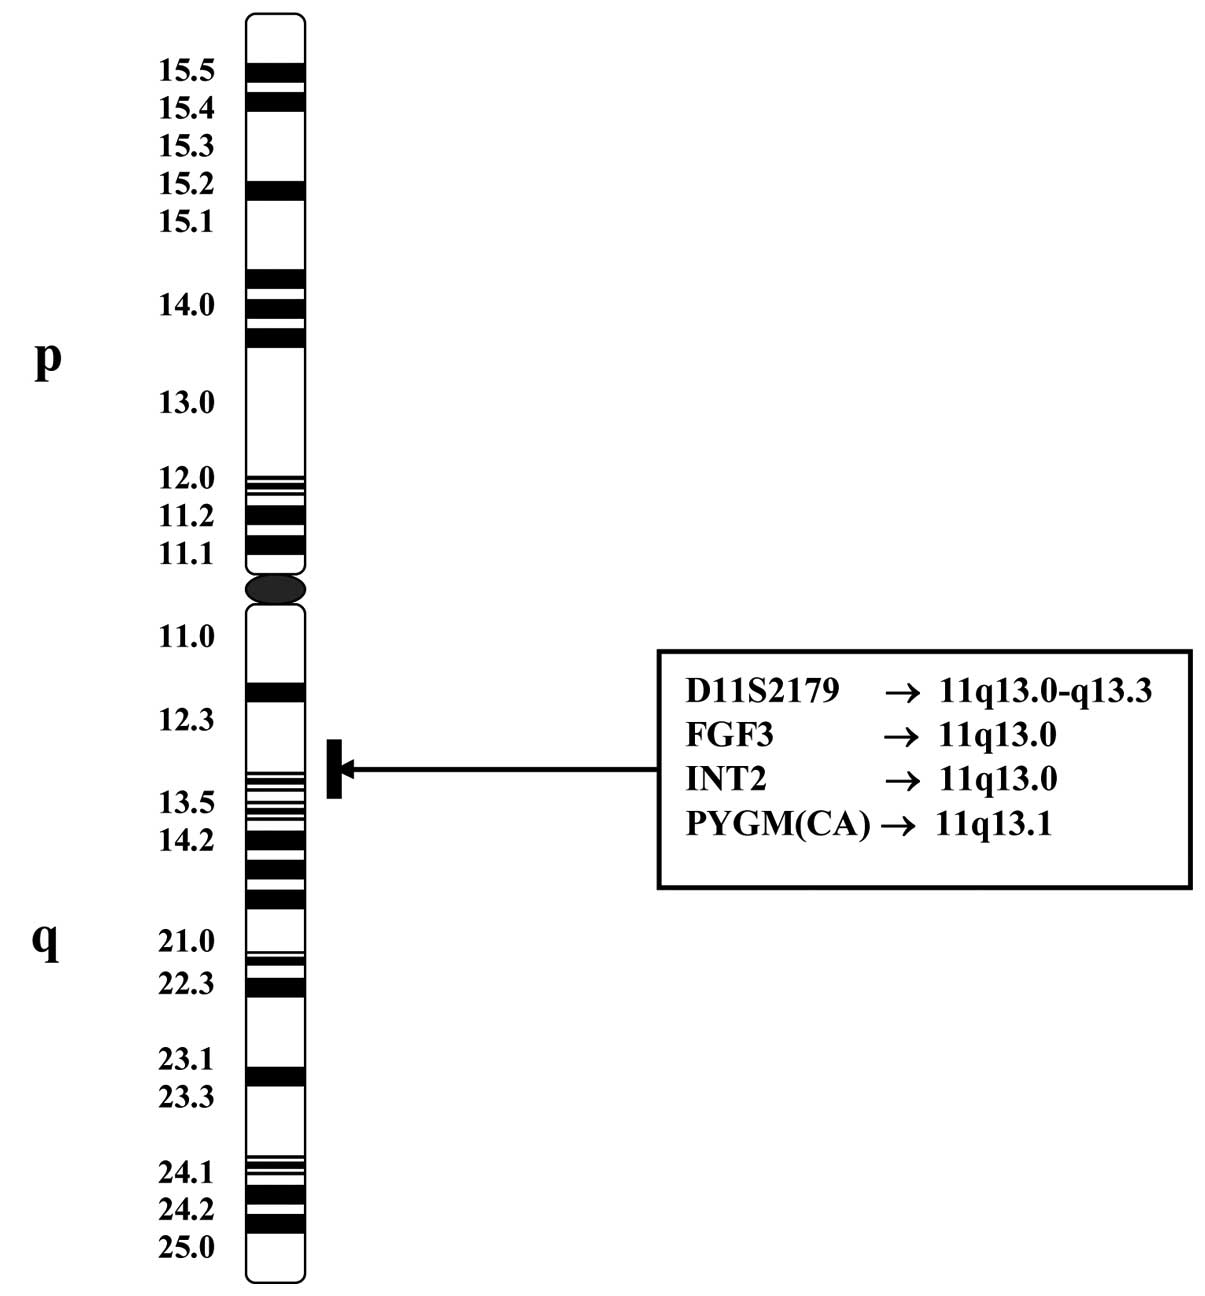
an established breast cancer model. Fig. 1 corresponds to the map of chromosome
11 showing the putative positions of the (CA)n repeat
microsatellite markers used in this study. Bold black vertical
lines indicate regions of possible map positions of the markers.
The different degrees of allelic imbalance were expressed in the
form of MSI or LOH. This research also focused on the differential
gene expression of FGF3 and associated genes at locus 11q13.
Table IA documents the
characteristics of selected repeat markers (CA)n on
chromosome 11q13-q13.3 and Table IB
documents the sequence of sense and antisense primers of the
microsatellite markers and other important genes located at
chromosome 11q13-q13.3.
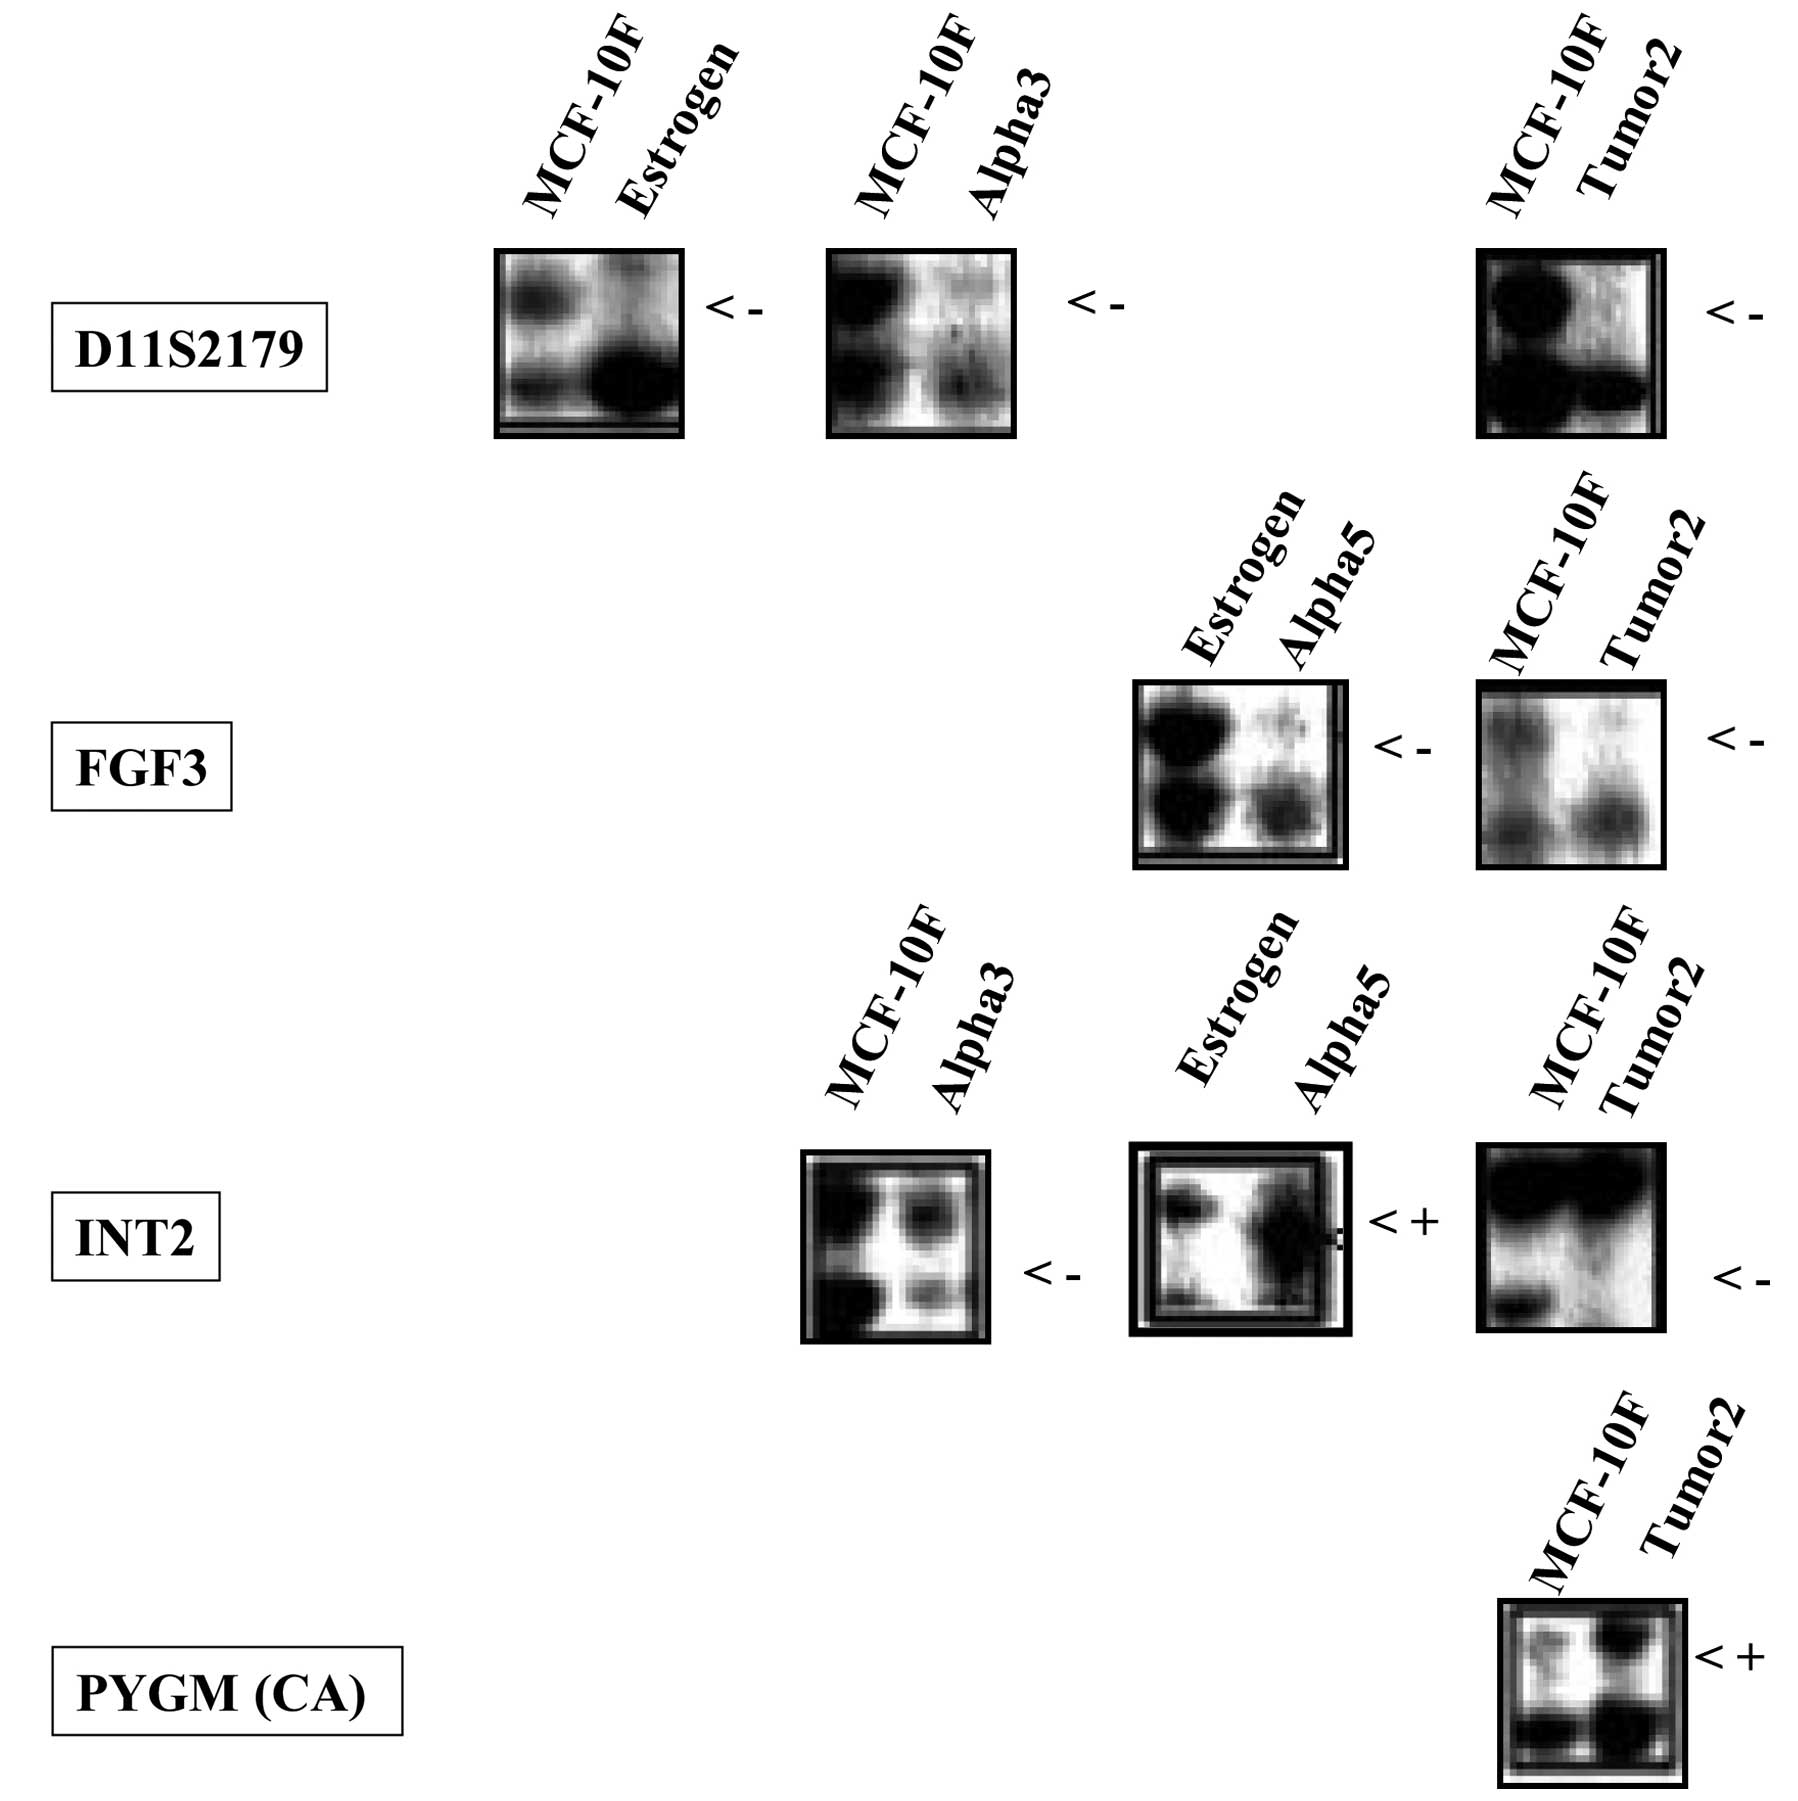
Fig. 2 shows the
frequency of MSI and LOH at the respective loci of (CA)n
repeat markers of chromosome 11q in irradiated, tumorigenic and
tumor cell lines. It was found that alterations were more
pronounced in cell lines exposed to double doses of radiation, as
well as those in which estrogen was added and in the tumor cell
line Tumor2 compared to control MCF-10F cell lines. These changes
were directly correlated with the phenotypic characteristics of the
cell lines as they progressed through different stages of
transformation to become tumorigenic.
The presence of MSI and LOH screened at the
respective loci of (CA)n repeat markers of chromosome
11q13-q13.3 in irradiated, tumorigenic and tumor cell lines is
shown in Table IIA. The MCF-10F
cell line treated with estrogen (Estrogen) was altered in the form
of LOH at locus 11q13.3 (D11S2179) when compared with the control
MCF-10F cells. The same locus was also altered in the form of LOH
in the Alpha3 and Tumor2 cell lines with respect to the control
MCF-10F. Similarly, the presence of LOH was also identified at
locus 11q13 (FGF3) in the Alpha5 and Tumor2 cell lines when
compared with the Estrogen and MCF-10F cell lines. The locus 11q13
(INT-2) also showed both LOH and MSI in the different irradiated
and tumorigenic cell lines when compared to the control MCF-10F and
Estrogen cell lines; Alpha3 and Tumor2 cell lines showed LOH, and
MSI was observed in the Alpha5 cell line at this specific locus.
Similarly, MSI was noted at locus 11q13.1 [PYGM(CA)] only in the
Tumor2 cell line when compared with the MCF-10F cell line.
| Table IIAllelic imbalance and fold change and
pair-wise analysis of FGF3 and associated genes in the human breast
cancer cell lines. |
Table II
Allelic imbalance and fold change and
pair-wise analysis of FGF3 and associated genes in the human breast
cancer cell lines.
| A, Allelic
imbalance in the radiated and estrogen-treated human breast cell
lines as detected using different microsatellite markers on
chromosome 11q13-q13.3 |
|---|
|
|---|
| | Cell lines |
|---|
| |
|
|---|
| Markers | Map position | MCF-10F | Estrogen | Alpha3 | Alpha5 | Tumor2 |
|---|
| D11S2179 | 11q13-q13.3 | △ | □ | □ | ⋄ | □ |
| FGF3 | 11q13 | △ | △ | △ | □ | □ |
| INT-2 | 11q13 | △ | △ | □ | ○ | □ |
| PYGM(CA) | 11q13.1 | △ | △ | △ | △ | ○ |
|
| B, Fold change and
pair-wise analysis of differential expression of FGF3 and
associated genes in human breast cell lines identified by
Affymetrix HG-U133A Plus 2.0 GeneChip microarray |
|
| | Cell lines |
| |
|
| Gene | Genebank |
MCF10F/Estrogen | MCF10F/Alpha3 |
Estrogen/Alpha5 | Alpha3/Alpha5 | Alpha5/Tumor2 | Alpha3/Tumor2 |
|
| Fibroblast growth
factor binding protein1 | NM_005130 | −1.2 (↓) | −21.1 (↓) | −9.2 (↓) | 2.0 (↑) | 4.2 (↑) | 8.3 (↑) |
| Fibroblast growth
factor 2 (basic) | M27968 | −1.3 (↓) | 4.4 (↑) | 3.0 (↑) | −2.0 (↓) | −2.8 (↓) | −5.5 (↓) |
| Fibroblast growth
factor 2 (basic) | NM_002006 | 1.9 (↑) | 5.8 (↑) | 3.1 (↑) | 1.0 (↑) | −3.4 (↓) | −3.3 (↓) |
| Fibroblast growth
factor 3 | NC_000011.9 | −1.5 (↓) | 4.8 (↑) | 3.6 (↑) | −1.8 (↓) | −2.3 (↓) | −5.8 (↓) |
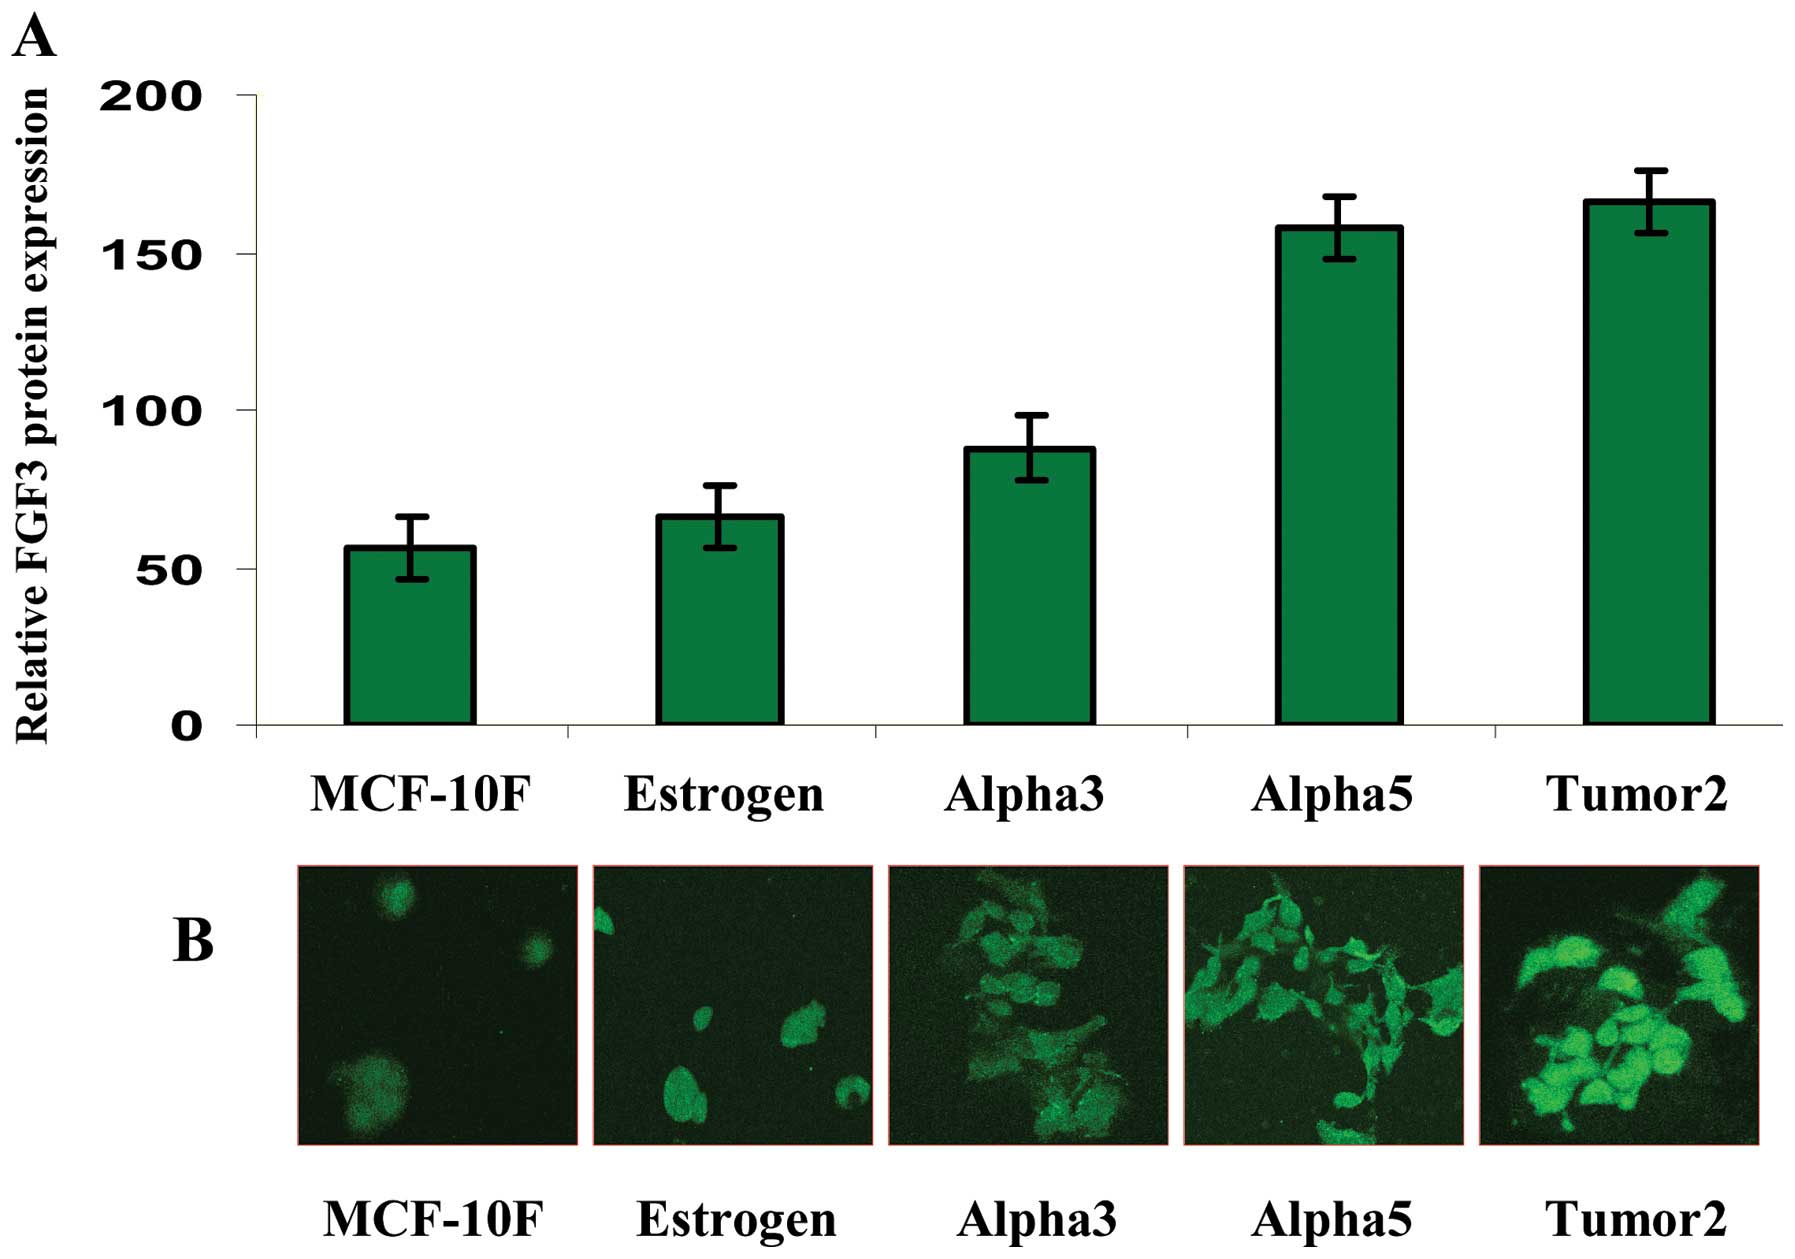
Fig. 3A shows a
histogram representing the average and standard error of FGF3
protein expression in the MCF-10F, Estrogen, Alpha3, Alpha5 and
Tumor2 cell lines as determined by immunofluorescence staining by
confocal microscopy. Representative images of FGF3 protein
expression in the MCF-10F, Estrogen, Alpha3, Alpha5 and Tumor2 cell
lines are shown in Fig. 3B. The
results revealed higher protein expression in the Alpha5 and Tumor2
cell lines when compared with the control MCF-10F cells.
Analysis of gene expression by microarray showed
gene expression of FGF3 (11q13) and associated genes such as FGFBP1
and FGF2 in cell lines of the established Alpha model as shown in
Table IIB. Fold change and
pair-wise analysis of the differential expression of FGF3 and
associated genes in the human breast cell lines were identified by
microarray. Results of the pair-wise comparison of the cell lines
examined for the expression of FGF3 and other associated genes were
studied in pairs of cell lines as follows: MCF-10F/Estrogen,
MCF-10F/Alpha3, Estrogen/Alpha5, Alpha3/Alpha5, Alpha5/Tumor2 and
Alpha3/Tumor2. Results indicated that the pair-wise comparison did
not reveal a significant alteration in FGFBP1 gene expression
between the MCF-10F/Estrogen and Alpha3/Alpha5 cell lines, whereas
an ~21-, 9-, 4- and 8-fold alteration in the MCF-10F/Alpha3,
Estrogen/Alpha5, Alpha5/Tumor2 and Alpha3/Tumor2 combinations,
respectively, was noted. Similarly, between the MCF-10F/Alpha3 and
Alpha3/Tumor2 combinations an ~6- and 5-fold change in FGF2 gene
expression, respectively, was noted. Finally, combinations of
MCF-10F/Alpha3 and Alpha3/Tumor2 cell lines revealed a 5- and
3-fold alteration in FGF3 gene expression, respectively, whereas
there were no significant alterations in the other combinations
with respect to this particular gene.
Discussion
The carcinogenic progression of breast tissues is a
complex multi-stage process involving various morphological and
genetic alterations including activation of oncogenes and loss or
inactivation of tumor-suppressor genes. Thus, tumor cells may have
altered genes related to their cell cycle (19,21).
An array of genetic anomalies during tumor progression increases
the probability of random rearrangements, which favor chromosomal
disintegration that leads to LOH, also favoring mitotic
recombination, which leads to MSI (22,32).
Our previous study indicated that the combined
treatment of ionizing radiation and estrogen yielded different
stages in a malignantly transformed breast cancer cell model, which
we called the Alpha model system (19). Utilizing this model system, a
progressive degree of allelic alterations at 11q13-q13.3 and
differential expression of FGF3 and associated genes were detected
in the parental, non-tumorigenic and malignantly transformed cell
lines originally derived from the parental MCF-10A cell line
(20).
Specific microsatellite markers belonging to this
particular region were selected on the basis of their role in
cell-cycle regulation, DNA replication, DNA repair, or signal
transduction of gene proteins (33,34).
Therefore, allelic alterations were more pronounced and deleterious
when MCF-10F cell lines were exposed to double doses of radiation
and treated with estrogen in comparison to the cell lines that were
treated with only double doses of radiation without estrogen.
It is now well established that estrogen may play a
dual role in affecting breast cancer risk (35). It may serve as a pre-initiator,
initiator and promoter of breast cancer by DNA damage and mutations
in cells or may reduce breast cancer risk during pregnancy,
pre-pubertal period and childhood (36,37).
Therefore, these results indicate the importance of estrogen in
breast tumor progression. Moreover, studies from other laboratories
have already placed various putative tumor-suppressor genes in this
larger overlapping area (38–40),
which is consistent with our present observation. Again,
microcell-mediated chromosome transfer of an intact copy of
chromosome 11 into tumorigenic HeLa cells has provided additional
support for the presence of a tumor-suppressor gene in this
chromosomal region (11,41).
LOH/MSI in this region have been identified in
several esophageal and laryngeal squamous cell carcinomas, human
renal cell carcinoma, prostate and ovarian cancers as well
(42–45). There is also an increasing body of
evidence indicating the existence of various driver genes in this
region. They show genetic and epigenetic alterations in cancer or
cancer-predisposing syndromes (39). 11q13 amplification has also been
reported in the local recurrence of human primary breast cancer
(46).
Identification of numerous LOH/MSI in the same
region (11q13-q13.3 loci) by various independent laboratories has
supported the importance of this region in breast cancer. Although,
the precise mechanism of the high rate of LOH/MSI in this
particular region is not known, it is evident from different
observations that more than one tumor-suppressor gene reside in
this region, which also highlights the relevance and usefulness of
this model. Their altered imprinting may lead to tumorigenesis by
involving a gene activation hypothesis (47).
Notably there are many important families of genes
such as FGF, CCND1, FADD, BAD and GAD2 located around 11q13-q13.3
with a crucial role in breast cancer progression (14,15).
Yet, among them, different members of the FGF family of genes are
most important as their amplification is found to be a better
independent prognostic indicator of human breast cancer (17,48).
In addition, INT-2/FGF3 gene amplications were found to be good
indicators of prognosis, potentially in premenopausal patients, and
also in lymph node-positive and steroid receptor-negative patients
(17). Int-2/FGF3 amplification and
progesterone receptor status together proved to be the only
independent variable predictive of metastasis-free survival
(17). Again, progression in MCF-7
breast cancer cell tumorigenicity also showed the amplification of
FGF3 and FGF-4 genes (49). Along
with amplification of the FGF family of genes, the fibroblast
growth factor receptor (FGFR) cascade also plays crucial roles in
tumor cell proliferation, angiogenesis, migration and survival.
Accumulating evidence suggests that in some tumor types, FGFRs are
bona fide oncogenes to which cancer cells are addicted. Since FGFR
inhibition can reduce proliferation and induce cell death in a
variety of in vitro and in vivo tumor models
harboring FGFR aberrations, a growing number of research groups
have selected FGFRs as targets for anticancer drug development
(50).
In can be concluded that characterization of this
specific locus and alteration of the FGF3 family of genes at this
locus is important. Moreover, evaluation of this gene(s) could be
used as an additional parameter to identify appropriate target(s)
for therapeutic intervention that contribute to radiation-induced
breast carcinogenesis. This has broad implications in diagnosing
the clinical and pathological aspects of breast cancer, a
heterogeneous disease.
Acknowledgements
The support provided by FONDECYT no. 1120006
(G.M.C.) and MINEDUC-Universidad de Tarapacá (G.M.C.) is greatly
appreciated. We also thank Dr Manikandan Jayapal and Dr Praksah
Hande of the National University of Singapore for analysis of the
Affymetrix microarray data. We are sincerely grateful for the
technical assistance of Ricardo Ponce Cusi.
References
|
1
|
Levine AJ: The tumor suppressor genes.
Annu Rev Biochem. 62:623–651. 1993. View Article : Google Scholar : PubMed/NCBI
|
|
2
|
Knudson AG Jr: Genetics and etiology of
human cancer. Adv Hum Genet. 8:1–66. 1977.PubMed/NCBI
|
|
3
|
Knudson AG Jr: Mutation and cancer:
statistical study of retinoblastoma. Proc Natl Acad Sci USA.
68:820–823. 1971. View Article : Google Scholar : PubMed/NCBI
|
|
4
|
Wolman SR, Pauley RJ, Mohamad AN, Dawson
PJ, Visscher DW and Sarkar FH: Genetic markers as prognostic
indicators in breast cancer. Cancer. 70:1765–1774. 1992. View Article : Google Scholar : PubMed/NCBI
|
|
5
|
Mitelman F: Catalogue of Chromosome
Aberration in Cancer. 4th edition. Willey-Liss; New York, NY:
1991
|
|
6
|
Lengauer C, Kinzler KW and Vogelstein B:
Genetic instabilities in human cancers. Nature. 396:643–649. 1998.
View Article : Google Scholar : PubMed/NCBI
|
|
7
|
Devilee P, Van den Broek M,
Kuipers-Dijkshoorn N, Kolluri R, Khan PM, Pearson PL and Cornelisse
CJ: At least four different chromosomal regions are involved in
loss of heterozygosity in human breast carcinoma. Genomics.
5:554–560. 1989. View Article : Google Scholar : PubMed/NCBI
|
|
8
|
Anderson TI, Gaustad A, Ottestad L,
Farrants GW, Nesland JM, Tveit KM and Borresen AL: Genetic
alterations of the tumor suppressor gene regions 3p, 11p, 17p, and
17q in human breast carcinomas. Genes Chromosomes Cancer.
4:113–121. 1992. View Article : Google Scholar : PubMed/NCBI
|
|
9
|
Roy D, Calaf G and Hei TK: Frequent
allelic imbalance on chromosome 6 and 17 correlate with
radiation-induced neoplastic transformation of human breast
epithelial cells. Carcinogenesis. 22:1685–1692. 2001. View Article : Google Scholar
|
|
10
|
Winqvist R, Mannermaa A, Alavaikko M,
Blanco G, Kiviniemi H, Taskinen PJ, Kiviniemi H, Newsham I and
Cavenee W: Refinement of regional loss of heterozygosity for
11p15.5 in human breast tumors. Cancer Res. 53:4486–4488.
1993.PubMed/NCBI
|
|
11
|
Hampton G, Mannermaa A, Winqvist R,
Alavaikko M, Blanco G, Taskinen PJ, Kiviniemi H, Newsham I, Cavenee
W and Evans GA: Loss of heterozygosity in sporadic human breast
carcinoma: a common region between 11q22 and 11q23.3. Cancer Res.
54:4586–4589. 1994.PubMed/NCBI
|
|
12
|
Negrini M, Sabbioni S, Possati L, Rattan
S, Corallini A, Barbanti-Brodano G and Croce CM: Suppression of
tumorigenecity of breast cancer cells by microcell-mediated
chromosome transfer: studies on chromosome 6 and 11. Cancer Res.
54:1331–1336. 1994.PubMed/NCBI
|
|
13
|
Rosa-Rosa JM, Pita G, González-Neira A,
Milne RL, Fernandez V, Ruivenkamp C, van Asperen CJ, Devilee P and
Benitez J: A 7 Mb region within 11q13 may contain a high penetrance
gene for breast cancer. Breast Cancer Res Treat. 118:151–159. 2009.
View Article : Google Scholar : PubMed/NCBI
|
|
14
|
Karlsson E, Waltersson MA, Bostner J,
Pérez-Tenorio G, Olsson B, Hallbeck AL and Stäl O: High-resolution
genomic analysis of the 11q13 amplicon in breast cancers identifies
synergy with 8p12 amplification, involving the mTOR targets S6K2
and 4EBP1. Genes Chromosomes Cancer. 50:775–787. 2011. View Article : Google Scholar : PubMed/NCBI
|
|
15
|
Lizard-Nacol S, Lidereau R, Collin FA,
Arnal M, Hahnel L, Roignot P, Cuisenier J and Guerrin J: Benign
breast disease: absence of genetic alterations at several loci
implicated in breast cancer malignancy. Cancer Res. 55:4416–4419.
1995.PubMed/NCBI
|
|
16
|
Fantl V, Smith R, Brookes S, Dickson C and
Peters G: Chromosome 11q13 abnormalities in human breast cancer.
Cancer Surv. 18:77–94. 1993.PubMed/NCBI
|
|
17
|
Champème MH, Bièche I, Hacène K and
Lidereau R: Int-2/FGF3 amplification is a better independent
predictor of relapse than c-myc and c-erbB-2/neu amplifications in
primary human breast cancer. Mod Pathol. 7:900–905. 1994.PubMed/NCBI
|
|
18
|
Roy D, Calaf GM, Hande MP and Hei TK:
Allelic imbalance at 11q23–q24 chromosome associated with estrogen
and radiation-induced breast cancer progression. Int J Oncol.
28:667–674. 2006.
|
|
19
|
Calaf GM and Hei TK: Establishment of a
radiation- and estrogen-induced breast cancer model.
Carcinogenesis. 21:769–776. 2000. View Article : Google Scholar : PubMed/NCBI
|
|
20
|
Soule H, Vazquez J, Long A, Albert S and
Brennan MA: A human cell line from a pleural effusion derived from
a breast carcinoma. J Natl Cancer Inst. 51:1409–1416.
1973.PubMed/NCBI
|
|
21
|
Roy D, Calaf GM and Hei TK: Profiling of
differentially expressed genes induced by high linear energy
transfer radiation in breast epithelial cells. Mol Carcinogen.
31:192–203. 2001. View
Article : Google Scholar : PubMed/NCBI
|
|
22
|
Roy D, Calaf G and Hei TK: Allelic
imbalance at 11p15.5–15.4 correlated with c-Ha-ras mutation during
radiation-induced neoplastic transformation of human breast
epithelial cells. Int J Cancer. 103:730–737. 2003.
|
|
23
|
Calaf GM, Roy D and Hei TK: Immunochemical
analysis of protein expression in breast epithelial cells
transformed by estrogens and high linear energy transfer (LET)
radiation. Histochem Cell Biol. 124:261–274. 2005. View Article : Google Scholar : PubMed/NCBI
|
|
24
|
Calaf G and Hei TK: Oncoprotein expression
in human breast epithelial cells transformed by high-LET radiation.
Int J Radiat Biol. 77:31–40. 2001. View Article : Google Scholar : PubMed/NCBI
|
|
25
|
Gross-Bellard M, Oudet P and Chambon P:
Isolation of high-molecular-weight DNA from mammalian cells. Eur J
Biochem. 36:32–38. 1973. View Article : Google Scholar : PubMed/NCBI
|
|
26
|
Sambrook J, Fritsch EF and Maniatis T:
Molecular Cloning A Laboratory Manual. 3. 2nd edition. Cold Spring
Harbor Laboratory Press; Plainview, NY: pp. 16261989
|
|
27
|
Jaeckel S, Epplen JT, Kauth M, Miterski B,
Tschentscher F and Epplen C: Polymerase chain reaction-single
strand conformation polymorphism or how to detect reliably and
efficiently each sequence variation in many samples and many genes.
Electrophoresis. 19:3055–3061. 1998. View Article : Google Scholar
|
|
28
|
Calaf GM and Roy D: Gene and protein
expressions induced by 17beta-estradiol and parathion in cultured
breast epithelial cells. Mol Med. 13:255–265. 2007. View Article : Google Scholar : PubMed/NCBI
|
|
29
|
Calaf GM and Roy D: Cell adhesion proteins
altered by 17β estradiol and parathion in breast epithelial cells.
Oncol Rep. 19:165–169. 2008.
|
|
30
|
Califano A: SPLASH: structural pattern
localization analysis by sequential histograms. Bioinformatics.
16:341–357. 2000. View Article : Google Scholar : PubMed/NCBI
|
|
31
|
Calaf GM, Roy D, Narayan G and Balajee AS:
Differential expression of cell adhesion molecules in an ionizing
radiation-induced breast cancer model system. Oncol Rep.
30:285–291. 2013.PubMed/NCBI
|
|
32
|
Bieche I and Lidereau R: Genetic
alterations in breast cancer. Genes Chromosomes Cancer. 14:227–251.
1995. View Article : Google Scholar
|
|
33
|
Parsons R, Li GM, Longley MJ, Fang WH,
Papadopoulos N, Jen J, De la Chapelle A, Kinzler KW, Vogelstein B
and Modrich P: Hypermutability and mismatch repair deficiency in
RER+ tumor cells. Cell. 75:1227–1236. 1993. View Article : Google Scholar : PubMed/NCBI
|
|
34
|
Dedhar S: Cell-substrate interactions and
signaling through ILK. Curr Opin Cell Biol. 12:250–256. 2000.
View Article : Google Scholar : PubMed/NCBI
|
|
35
|
Hilakivi-Clarke L: Estrogens, BRCA1, and
breast cancer. Cancer Res. 60:4993–5001. 2000.PubMed/NCBI
|
|
36
|
Liehr JG: Is estradiol a genotoxic
mutagenic carcinogen? Endocr Rev. 21:40–54. 2000.PubMed/NCBI
|
|
37
|
Berkey CS, Frazier AL, Gardner JD and
Colditz GA: Adolescence and breast carcinoma risk. Cancer.
85:2400–2409. 1999. View Article : Google Scholar : PubMed/NCBI
|
|
38
|
Nagahata T, Hirano A, Utada Y, Tsuchiya S,
Takahashi K, Tada T, Makita M, Kasumi F, Akiyama F, Sakamoto G,
Nakamura Y and Emi M: Correlation of allelic losses and
clinicopathological factors in 504 primary breast cancers. Breast
Cancer. 9:208–215. 2002. View Article : Google Scholar : PubMed/NCBI
|
|
39
|
Wilkerson PM and Reis-Filho JS: The
11q13-q14 amplicon: clinicopathological correlations and potential
drivers. Genes Chromosomes Cancer. 52:333–355. 2013. View Article : Google Scholar : PubMed/NCBI
|
|
40
|
Holm K, Staaf J, Jönsson G,
Vallon-Christersson J, Gunnarsson H, Arason A, Magnusson L,
Barkardottir RB, Hegardt C, Ringnér M and Borg A: Characterization
of amplification patterns and target genes at chromosome 11q13 in
CCND1-amplified sporadic and familial breast tumors. Breast Cancer
Res Treat. 133:583–594. 2012. View Article : Google Scholar : PubMed/NCBI
|
|
41
|
Saxon PJ, Srivatsan ES and Stanbridge EJ:
Introduction of human chromosome 11 via microcell transfer controls
tumorigenic expression of HeLa cells. EMBO J. 5:3461–3466.
1986.PubMed/NCBI
|
|
42
|
Shi ZZ, Jiang YY, Hao JJ, Zhang Y, Zhang
TT, Shang L, Liu SG, Shi F and Wang MR: Identification of putative
target genes for amplification within 11q13.2 and 3q27.1 in
esophageal squamous cell carcinoma. Clin Transl Oncol. 8:606–615.
2013.PubMed/NCBI
|
|
43
|
Jarmuz-Szymczak M, Pelinska K,
Kostrzewska-Poczekaj M, Bembnista E, Giefing M, Brauze D,
Szaumkessel M, Marszalek A, Janiszewska J, Kiwerska K, Bartochowska
A, Grenman R, Szyfter W and Szyfter K: Heterogeneity of 11q13
region rearrangements in laryngeal squamous cell carcinoma analyzed
by microarray platforms and fluorescence in situ hybridization. Mol
Biol Rep. 40:4161–4171. 2013. View Article : Google Scholar : PubMed/NCBI
|
|
44
|
Su T, Han Y, Yu Y, Tan X, Li X, Hou J, Du
Y, Shen J, Wang G, Ma L, Jiang S, Zhang H and Cao G: A
GWAS-identified susceptibility locus on chromosome 11q13.3 and its
putative molecular target for prediction of postoperative prognosis
of human renal cell carcinoma. Oncol Lett. 6:421–426. 2013.
|
|
45
|
Chung CC, Boland J, Yeager M, Jacobs KB,
Zhang X, Deng Z, Matthews C, Berndt SI and Chanock SJ:
Comprehensive resequence analysis of a 123-kb region of chromosome
11q13 associated with prostate cancer. Prostate. 72:476–486. 2012.
View Article : Google Scholar : PubMed/NCBI
|
|
46
|
Champème MH, Bièche I, Lizard S and
Lidereau R: 11q13 amplification in local recurrence of human
primary breast cancer. Genes Chromosomes Cancer. 12:128–133.
1995.PubMed/NCBI
|
|
47
|
Feinberg AP: Genomic imprinting and gene
activation in cancer. Nat Genet. 4:110–113. 1993. View Article : Google Scholar : PubMed/NCBI
|
|
48
|
Naidu R, Wahab NA, Yadav M, Kutty MK and
Nair S: Detection of amplified int-2/FGF-3 gene in primary breast
carcinomas using differential polymerase chain reaction. Int J Mol
Med. 8:193–198. 2001.PubMed/NCBI
|
|
49
|
Hajitou A, Deroanne C, Noël A, Collette J,
Nusgens B, Foidart JM and Calberg-Bacq CM: Progression in MCF-7
breast cancer cell tumorigenicity: compared effect of FGF-3 and
FGF-4. Breast Cancer Res Treat. 60:15–28. 2000. View Article : Google Scholar : PubMed/NCBI
|
|
50
|
Dienstmann R, Rodon J, Prat A,
Perez-Garcia J, Adamo B, Felip E, Cortes J, Iafrate AJ, Nuciforo P
and Tabernero J: Genomic aberrations in the FGFR pathway:
opportunities for targeted therapies in solid tumors. Ann Oncol.
20:552–563. 2014. View Article : Google Scholar : PubMed/NCBI
|