Introduction
Cyclooxygenase (COX) is the key enzyme required for
the conversion of arachidonic acid to prostaglandins (PGs). Two COX
isoforms have been identified and are referred to as constitutive
COX (COX-1) and inducible COX (COX-2). COX-1 is constitutively
expressed in many tissues and plays important roles in the control
of homeostasis (1). On the other
hand, COX-2 is an inducible enzyme that is activated in response to
extracellular stimuli, such as growth factors and pro-inflammatory
cytokines (2). Some investigators
have demonstrated that COX-2 is constitutively overexpressed in a
variety of epithelial malignancies, such as lung, breast, pancreas,
colon, esophagus, and head and neck cancers, and COX-2
overexpression is usually associated with a poor prognosis
(3–6).
Regulatory T cells (Tregs) were initially
characterized as having a CD4+CD25+
phenotype, and these cells are thought to modulate the antitumor
immune response (7). Tregs can
suppress the activity of cytotoxic T cells through direct
cell-to-cell contact or via the release of cytokines. The most
specific Treg cell marker identified to date is a nuclear
transcription factor known as Foxp3 (8,9). A
high density of tumor-infiltrating Foxp3+ Tregs is
reportedly associated with a higher risk of recurrence and a poor
overall survival among patients with non-small cell lung cancer
(NSCLC) (10). In 2010, we
demonstrated that the tumor-infiltrating Foxp3+ Treg
count (Foxp3 score) was positively correlated with the intratumoral
COX-2 expression level and was associated with a poor
recurrence-free survival period, particularly among patients with
node-negative NSCLC (11).
Recently, numerous single nucleotide polymorphisms
(SNPs) in the COX-2 gene have been identified, and these
SNPs may contribute to differential gene expression and enzyme
activities (12,13). In NSCLC, Bi et al (14) reported that a certain COX-2
SNP was a potential predictor of survival in patients with locally
advanced NSCLC who were treated with chemoradiotherapy or
radiotherapy alone. However, whether COX-2 genetic variants
influence the function of COX-2 in NSCLC remains unclear. In the
present study, we analyzed five types of COX-2 SNPs and
evaluated whether the COX-2 SNPs were correlated with the
intratumoral expression levels of COX-2, Foxp3+ Tregs
and Ki-67 in NSCLC.
Patients and methods
Study population
Blood and tumor samples were obtained from 80
consecutive patients with NCSLC who underwent a complete resection
with systematic lymph node dissection at Kawasaki Medical School
Hospital between August 2011 and March 2013. None of the patients
had received either radiotherapy or chemotherapy prior to surgery.
This study was conducted with the approval of the institutional
Ethics Committee of Kawasaki Medical School, and informed consent
for the use of blood and tumor specimens was obtained from each of
the patients. The histological diagnosis of the tumors was based on
the criteria of the World Health Organization, and the TNM stage
was determined according to the criteria established in 2009.
Genotyping of COX-2 SNPs
Blood samples were collected at the time of
pre-operation. Genomic DNA was isolated from whole peripheral blood
and was subjected to DNA amplification using a DNA Extractor
WB-Rapid kit. The genomic DNA region containing the SNP was
amplified using a polymerase chain reaction (PCR) performed using
an Ampdirect Plus kit. The PCR primers used for the detection of
the COX-2 −1195G/A, −1290A/G, −765G/C, 1759G/A and 8473T/C
SNPs were as follows: −1195F, 5′-TCCACTTCTTTTCTGGTGTGTG-3′ and
−1195R, 5′-CTGGGCTTATTGGGGCTAA-3′; −1290F, 5′-CCA
CTTCTTTTCTGGTGTGTG-3′ and −1290R; 5′-GGGAGATT TTGACAGTTGGAA-3′;
−765F, 5′-CCAAAATAATCCACG CATCA-3′ and −765R;
5′-TACCTTCACCCCCTCCTTG-3′; 1759F, 5′-GGGCTGTCCCTTTACTTCATT-3′ and
1759R, 5′-GACTCCTTTCTCCGCAACA-3′; 8473F, 5′-TGTCACAA
GATGGCAAAATGC-3′ and 8473R, 5′-GCTTTTACAGGTG ATTCTACCCTATGA-3′,
respectively.
DNA sequencing
The polymorphisms were analyzed using the ABI
PRISM® 310 Genetic Analyzer (Applied Biosystems, Foster
City, CA, USA). The results were analyzed using GeneMapper
Software, ver. 4.0 (Applied Biosystems).
Immunohistochemical study
Immunohistochemical analyses were performed using
resected paraffin-embedded lung cancer tissues. After microtome
sectioning, the slides were processed for COX-2, Foxp3 and Ki-67
staining using an automated immunostainer (NexES; Ventana, Tucson,
AZ, USA). The streptavidin-biotin-peroxidase detection technique
using diaminobenzidine as a chromogen was applied. The primary
antibodies were used according to the manufacturer’s instructions
(COX-2, clone CX-294, 1/50 dilution; DakoCytomation; Foxp3, clone
22510, 1/100 dilution; Abcam; Ki-67, MIB-1, 1/100 dilution;
DakoCytomation). The expression of each marker protein was examined
and evaluated according to a previously reported original protocol.
The slides were examined by an investigator who had no knowledge of
the corresponding clinicopathological data.
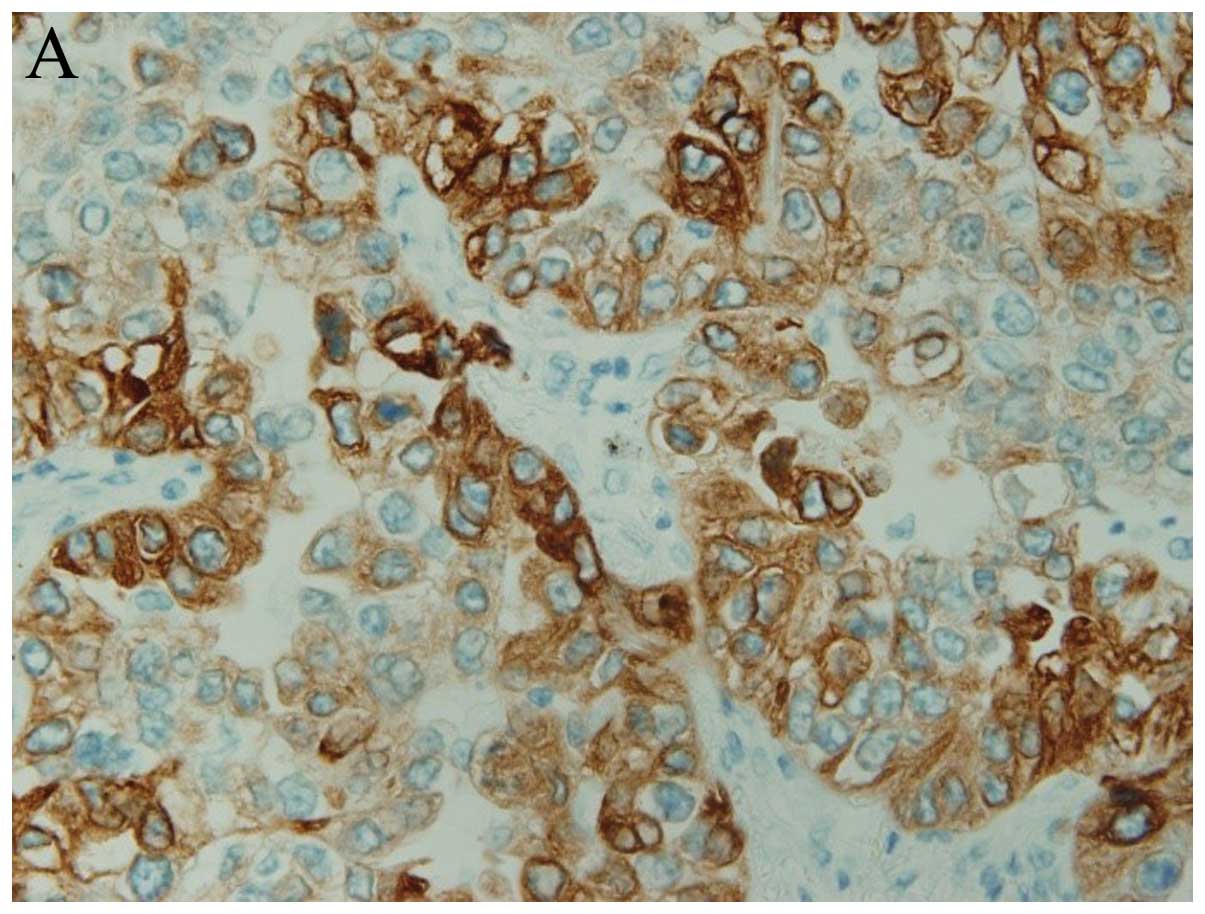
For COX-2, the slides were scored according to the
intensity of staining (0–3), and the percentages of cells with
scores of 0 (0%), 1 (1–9%), 2 (10–49%), and 3 (50–100%) were
determined. The immunohistochemistry (IHC) score (0–9) was defined
as the product of the intensity and the percentage of stained
cells. COX-2 expression was judged as positive when the IHC score
was ≥4 (groups 3 and 4) (Fig. 1A)
(15).
To evaluate Treg immunostaining, 10 high-power field
(HPF) digital images of the tumor areas were selected, and the
absolute number of Foxp3-positive lymphocytes in these 10 HPF
digital images was determined. The number of immunostained Foxp3
cells was then determined by averaging the 10 HPF digital image
cell counts, resulting in the Treg score (Fig. 1B) (16).
The labeling index of Ki-67 was measured by
determining the percentage of cells with positively stained nuclei.
Ki-67 expression was judged as positive when >10% of the cancer
cell nuclei showed positive staining (Fig. 1C) (17).
Statistical analysis
All the statistical analyses were performed using
the SPSS statistical package (version 17.0; SPSS, Chicago, IL,
USA). The Chi-square test and the Fisher’s exact test were used to
examine the association between COX-2 SNPs and various
clinicopathological parameters and protein expression levels
evaluated using IHC. The vascular score was presented as the mean ±
SD, and the difference between groups was analyzed using an
unpaired Student’s t-test. The significance level was P<0.05. A
prognostic evaluation was performed using the disease-free survival
(DFS) period. The DFS was defined as the time from surgical
resection until lung cancer recurrence or non-lung cancer-related
death. To explore the association between DFS and COX-2
SNPs, a Kaplan-Meier survival analysis was performed by stratifying
significant predictor variables that had been identified using the
COX proportional hazards model. Two-sided P-values of <0.05 were
considered to be statistically significant.
Results
Patient characteristics
The patient characteristics are documented in
Table I. The mean age of the 80
patients was 69.9 years, and 50 of the patients were male. The
histological type was adenocarcinoma in 61 cases, squamous cell
carcinoma in 17 cases, and other types in 2 cases. The median
follow-up period was 24 months (range, 9–30 months).
 | Table IPatient characteristics. |
Table I
Patient characteristics.
| Characteristics | No. of patients | Percentage |
|---|
| Gender |
| Male | 50 | 62.5 |
| Female | 30 | 37.5 |
| Age, mean ± SD | 69.9±9.6 | |
| Histology |
| Adenocarcinoma | 61 | 76.3 |
| Squamous cell
carcinoma | 17 | 21.3 |
| Large cell
carcinoma | 1 | 1.2 |
| Pleomorphic
carcinoma | 1 | 1.2 |
| Pathological
stage |
| IA | 41 | 51.2 |
| IB | 19 | 23.8 |
| IIA+IIB | 12 | 15.0 |
| IIIA+IIIB | 8 | 10.0 |
| Adjuvant
chemotherapy |
| (+) | 20 | 25.0 |
| (−) | 60 | 75.0 |
Relationship between the expression
status of COX-2 and the Foxp3-positive lymphocyte count
An immunohistochemical study showed that COX-2 was
positive in 27 cases and negative in 53 cases. In the
COX-2-positive group, the mean Treg score was 9.22. Conversely, in
the COX-2-negative group, the mean Treg score was 3.47. The Treg
score was significantly and positively correlated with the COX-2
expression level (P<0.001).
Associations between genotypes and
clinicopathological findings
The associations between the COX-2 genotypes
and the clinicopathological findings are shown in Table II. For the −1195G/A polymorphism,
the AA genotype was observed in 53 cases and the GA/GG genotype was
observed in 27 cases. Pleural invasion was significantly higher in
the AA group than that in the GA/GG group (P=0.040). For the
1759G/A polymorphism, the GG genotype was observed in 56 cases and
the GA/AA genotype was observed in 24 cases. The GA/AA group
contained more patients who were over 70 years of age than the GG
group. For the other genotypes, however, no significant
correlations were found between the COX-2 genotypes and the
clinicopathological findings.
| Table IIAssociation between COX-2
genotypes and clinicopathological findings. |
Table II
Association between COX-2
genotypes and clinicopathological findings.
| −1195G/A | −1290A/G | −765G/C |
|---|
|
|
|
|
|---|
| Factor | AA | GG+GA | P-value | AA | GG+GA | P-value | GG | CC+GC | P-value |
|---|
| Age (years) | | | 0.943 | | | 0.651 | | | 0.459 |
| <70 | 24 | 12 | | 27 | 9 | | 28 | 8 | |
| ≥70 | 29 | 15 | | 31 | 13 | | 31 | 13 | |
| Gender | | | 0.360 | | | 0.698 | | | 0.646 |
| Male | 35 | 15 | | 37 | 13 | | 36 | 14 | |
| Female | 18 | 12 | | 21 | 9 | | 23 | 7 | |
| Histology | | | 0.378 | | | 0.895 | | | 0.994 |
|
Adenocarcinoma | 42 | 19 | | 44 | 17 | | 45 | 16 | |
| Squamous cell
carcinoma | 9 | 8 | | 12 | 5 | | 12 | 5 | |
| Others | 2 | 0 | | 2 | 0 | | 2 | 0 | |
| Pleural
invasion | | | 0.040 | | | 0.822 | | | 0.624 |
| Negative | 31 | 22 | | 38 | 15 | | 40 | 13 | |
| Positive | 22 | 5 | | 20 | 7 | | 19 | 8 | |
| Vascular
invasion | | | 0.686 | | | 0.291 | | | 0.779 |
| Negative | 30 | 14 | | 34 | 10 | | 33 | 11 | |
| Positive | 23 | 13 | | 24 | 12 | | 26 | 10 | |
| Nodal status | | | 0.116 | | | 0.985 | | | 0.934 |
| N0 | 48 | 21 | | 50 | 19 | | 51 | 18 | |
| N1/N2 | 5 | 6 | | 8 | 3 | | 8 | 3 | |
|
| 1759G/A | 8473T/C |
|
|
|
| Factor | GG | AA+GA | P-value | TT | CC+TC | P-value |
|
| Age (years) | | | 0.019 | | | 0.503 |
| <70 | 29 | 6 | | 27 | 9 | |
| ≥70 | 27 | 18 | | 30 | 14 | |
| Gender | | | 0.614 | | | 0.848 |
| Male | 34 | 16 | | 36 | 14 | |
| Female | 22 | 8 | | 21 | 9 | |
| Histology | | | 0.863 | | | 0.788 |
|
Adenocarcinoma | 43 | 18 | | 45 | 16 | |
| Squamous cell
carcinoma | 11 | 6 | | 12 | 5 | |
| Others | 2 | 0 | | 2 | 0 | |
| Pleural
invasion | | | 0.642 | | | 0.242 |
| Negative | 38 | 15 | | 40 | 13 | |
| Positive | 18 | 9 | | 17 | 10 | |
| Vascular
invasion | | | 0.281 | | | 0.862 |
| Negative | 33 | 11 | | 31 | 13 | |
| Positive | 23 | 13 | | 26 | 10 | |
| Nodal status | | | 0.620 | | | 0.907 |
| N0 | 49 | 20 | | 49 | 20 | |
| N1/N2 | 7 | 4 | | 8 | 3 | |
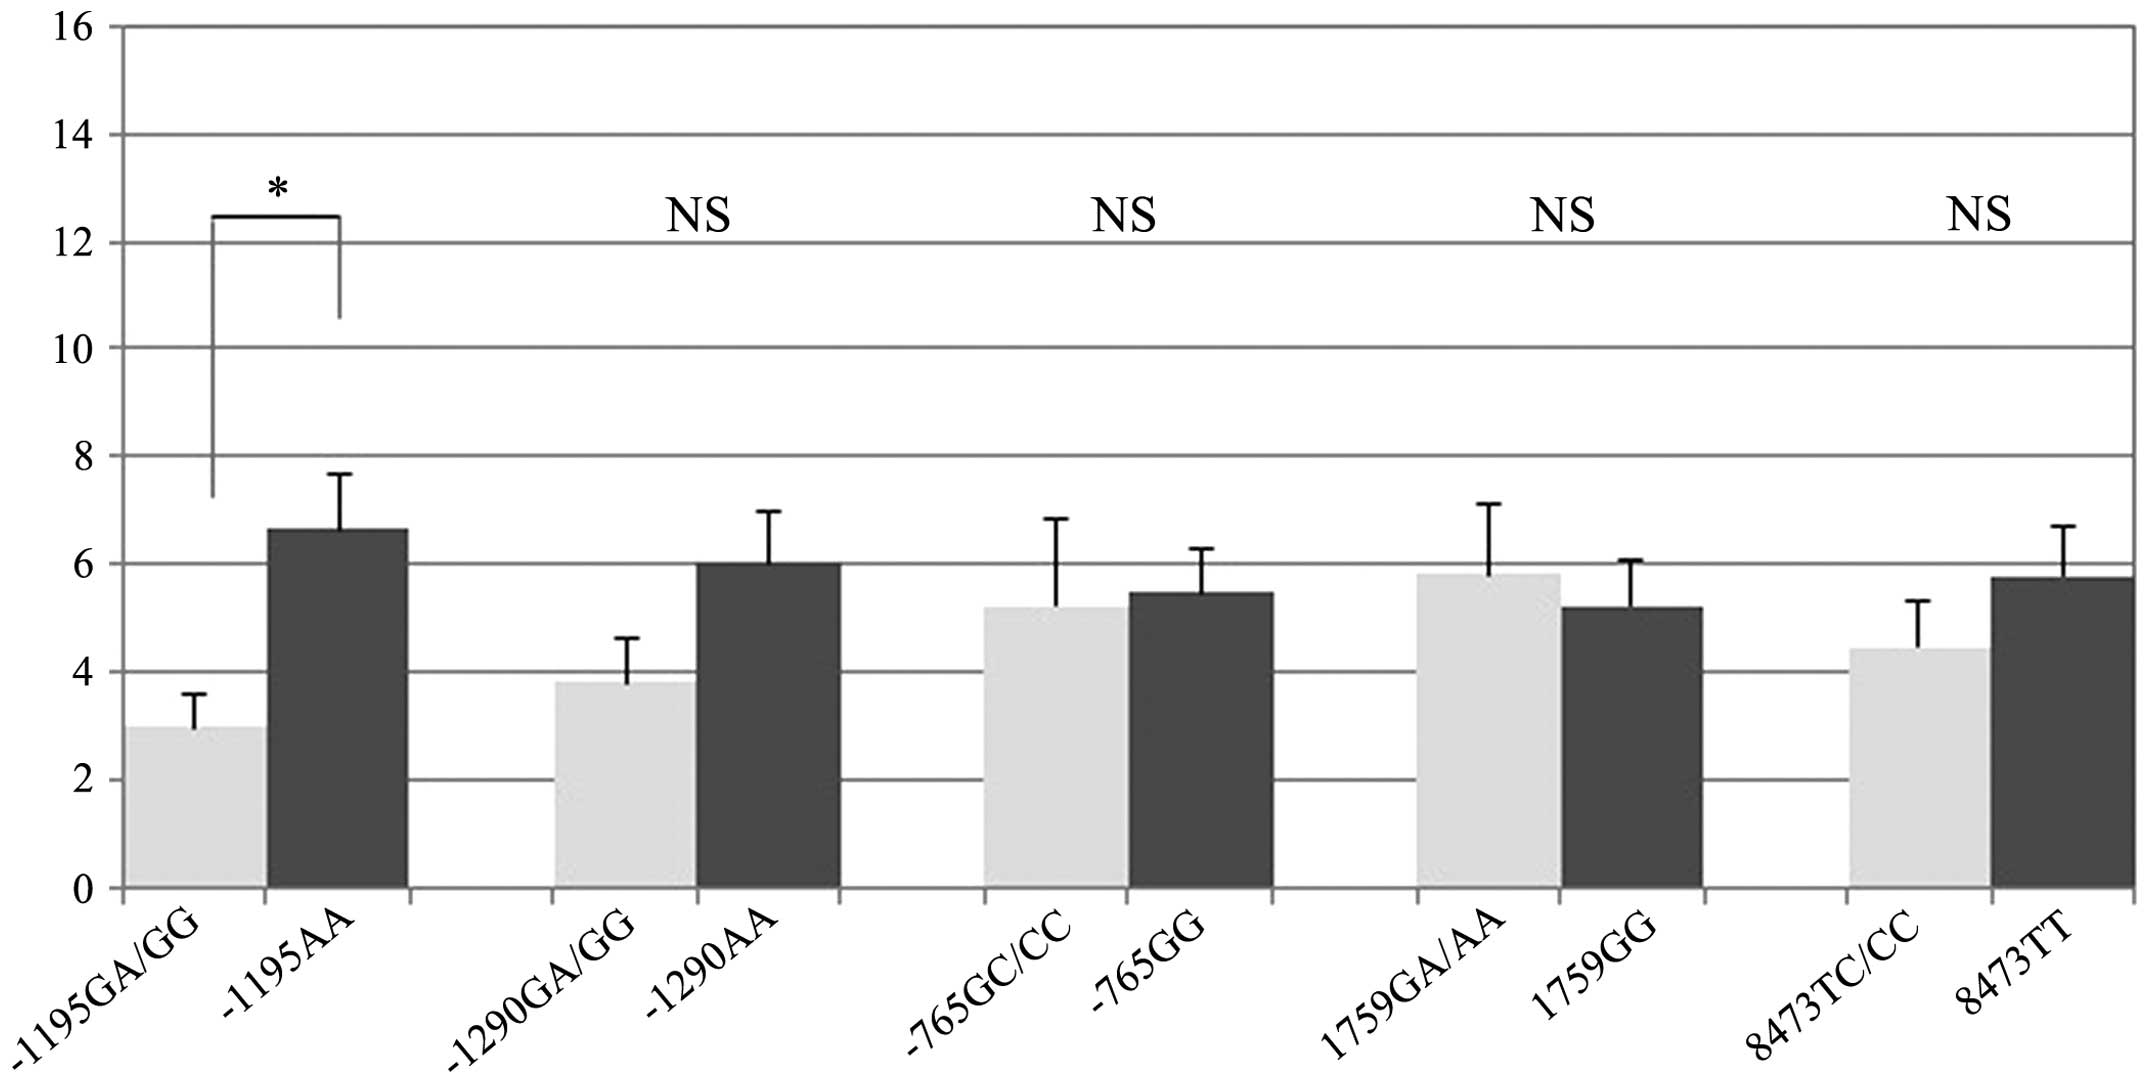
Associations between genotypes and COX-2,
Treg and Ki-67 expression levels
The associations between the COX-2 genotypes
and the expression levels of COX-2, Tregs and Ki-67 are shown in
Table III. No significant
correlations were found between the COX-2 genotypes and the
COX-2 score or the Ki-67 labeling index. For the −1195G/A
polymorphism, however, the mean Treg score was 6.6 in the AA group
and 3.0 in the GA/GG group. The mean Treg score was significantly
higher in the AA group (P=0.003). Other polymorphisms showed no
significant associations with the Treg score (Fig. 2).
| Table IIIAssociation between COX-2
genotypes and COX-2, Treg and Ki-67 expression. |
Table III
Association between COX-2
genotypes and COX-2, Treg and Ki-67 expression.
| −1195G/A | −1290A/G | −765G/C |
|---|
|
|
|
|
|---|
| Factor | AA | GG+GA | P-value | AA | GG+GA | P-value | GG | CC+GC | P-value |
|---|
| COX-2 score | 2.9 | 2.9 | 0.932 | 3.3 | 2.8 | 0.205 | 2.8 | 3.1 | 0.947 |
| Treg score | 6.6 | 3.0 | 0.003 | 6.0 | 3.8 | 0.063 | 5.5 | 5.2 | 0.382 |
| Ki-67 labeling
index | 28.7 | 30.0 | 0.792 | 28.3 | 31.0 | 0.571 | 29.5 | 28.4 | 0.832 |
|
| 1759G/A | 8473T/C |
|
|
|
| Factor | GG | AA+GA | P-value | TT | CC+TC | P-value |
|
| COX-2 score | 2.7 | 3.3 | 0.730 | 2.8 | 3.0 | 0.150 |
| Treg score | 5.2 | 5.8 | 0.653 | 5.8 | 4.5 | 0.108 |
| Ki-67 labeling
index | 27.0 | 33.7 | 0.198 | 29.6 | 28.2 | 0.786 |
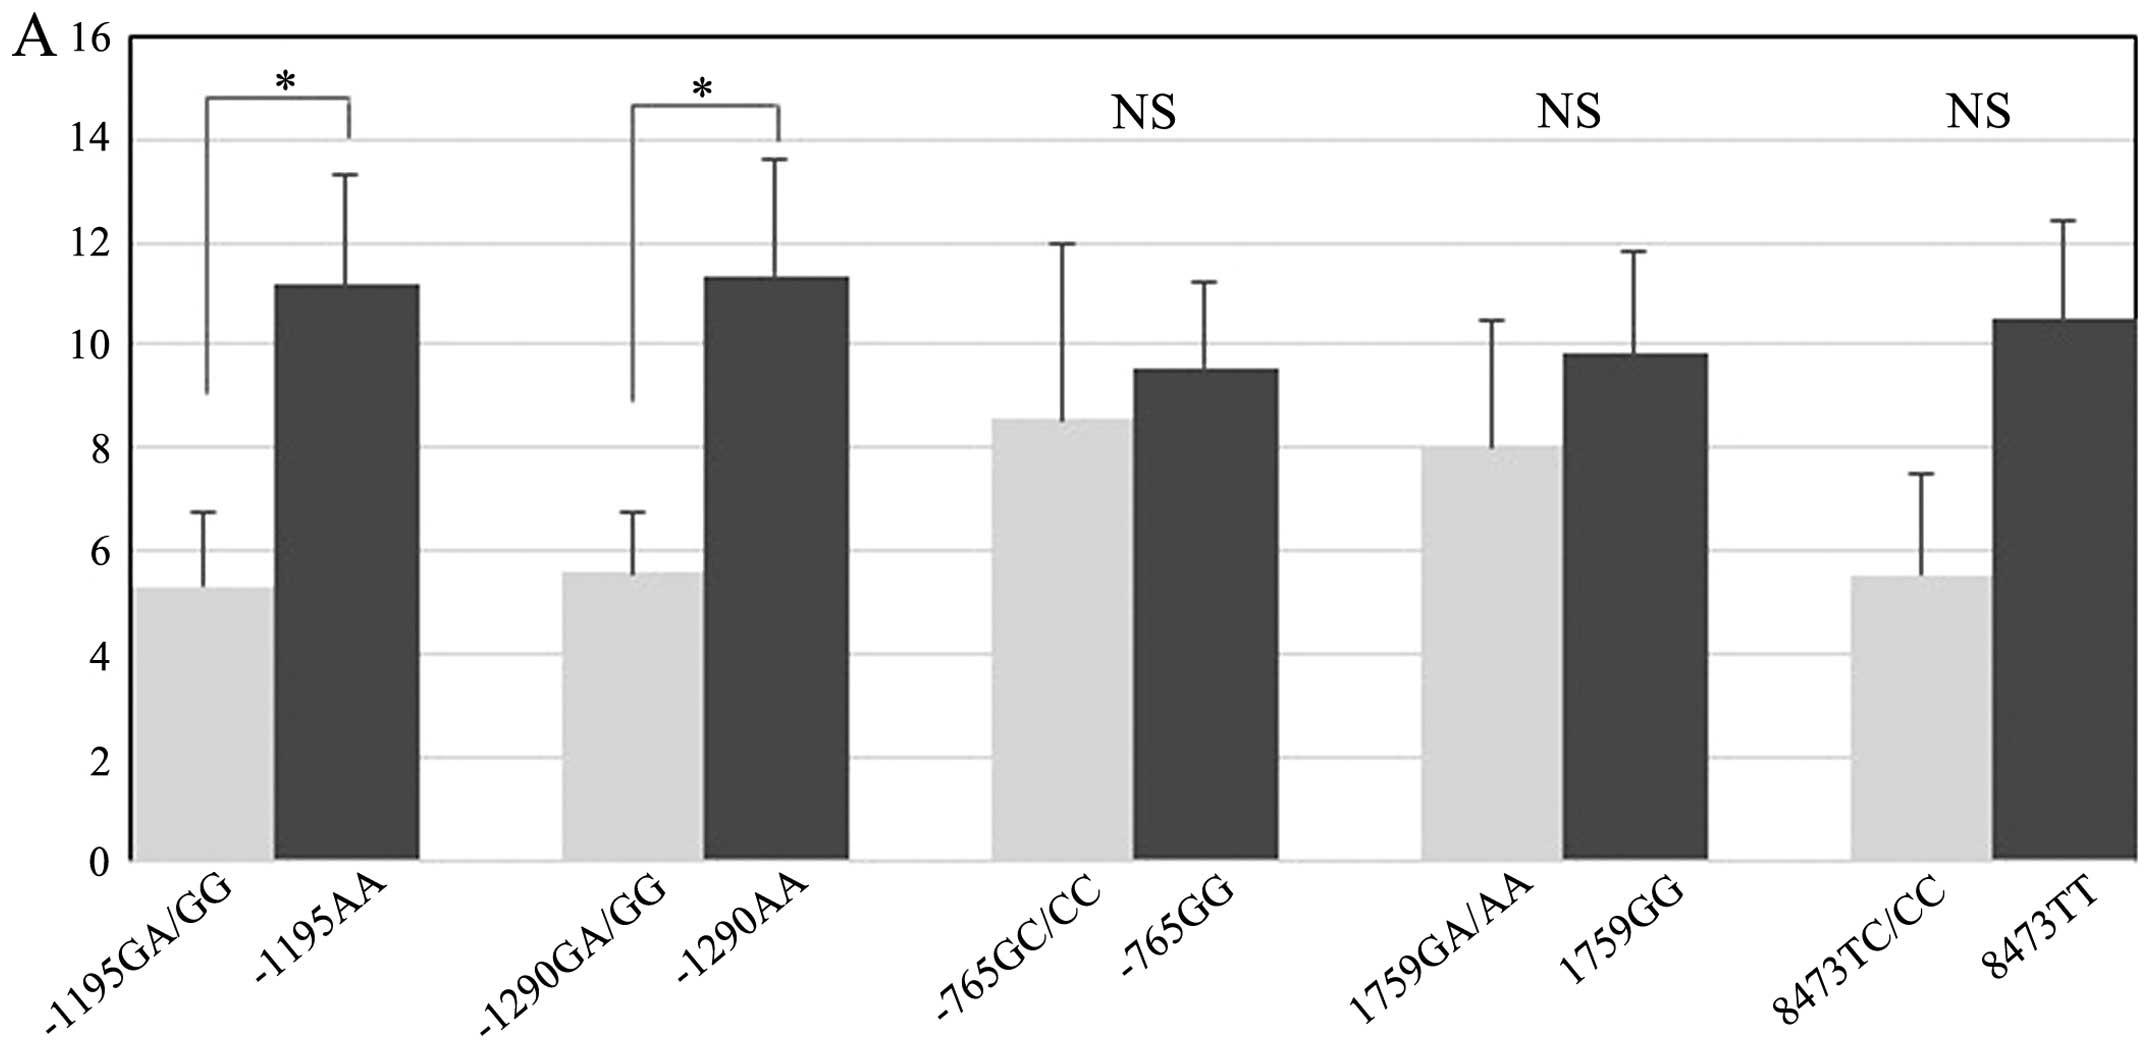
Associations between COX-2 genotypes and
Treg score according to the COX-2 expression level
Next, we evaluated whether the influence of the
COX-2 genotype on the Treg score differed according to the COX-2
expression level (Table IV and
Fig. 3). In the COX-2-positive
expression group, a significant difference in the Treg scores was
observed between the genotypes with the −1195G/A and −1290G/A
polymorphisms. For the −1195G/A polymorphism, the mean Treg score
was 11.2 in the AA group and 5.3 in the GA/GG group (Fig. 3A). The Treg score of the AA group
was significantly higher than that of the GA/GG group (P=0.03). For
the −1290G/A polymorphism, the mean Treg score was 11.4 in the AA
group and 5.6 in the GA/GG group (Fig.
3A). The Treg score for the AA group was significantly higher
than that for the GA/GG group (P=0.033). On the other hand, in the
COX-2-negative expression group, a significant difference in the
Treg scores was only observed for the −1195G/A polymorphism. The
mean Treg score was 4.3 in the AA group and 1.8 in the GA/GG group
(Fig. 3B). Similar to the
COX-2-positive expression group, the Treg score of the AA group was
significantly higher than that of the GA/GG group (P=0.011). These
results showed that the −1195AA genotype group had a significantly
higher Treg score than the GA/GG group, regardless of the
intratumoral COX-2 expression level. For the other COX-2
SNPs, significant differences in the Treg scores were not found
when the data were examined according to genotype.
| Table IVAssociations between COX-2 genotypes
and Treg score in regards to COX-2 expression. |
Table IV
Associations between COX-2 genotypes
and Treg score in regards to COX-2 expression.
| | COX-2-negative
group | COX-2-positive
group |
|---|
| |
|
|
|---|
| Genotype | N | n | Treg score | P-value | n | Treg score | P-value |
|---|
| −1195G/A | | | | 0.011 | | | 0.030 |
| AA | 53 | 35 | 4.3±5.1 | | 18 | 11.2±9.0 | |
| GG+GA | 27 | 18 | 1.8±1.6 | | 9 | 5.3±4.2 | |
| −1290A/G | | | | 0.211 | | | 0.033 |
| AA | 58 | 41 | 3.8±4.6 | | 17 | 11.4±9.3 | |
| AG+GG | 22 | 12 | 2.3±3.1 | | 10 | 5.6±3.6 | |
| −765G/C | | | | 0.346 | | | 0.797 |
| GG | 59 | 41 | 3.7±4.8 | | 18 | 9.6±7.1 | |
| GC+CC | 21 | 12 | 2.8±2.2 | | 9 | 8.6±10.2 | |
| 1759G/A | | | | 0.340 | | | 0.576 |
| GG | 56 | 38 | 3.1±3.9 | | 18 | 9.8±8.5 | |
| GA+AA | 24 | 15 | 4.5±5.3 | | 9 | 8.0±7.6 | |
| 8473T/C | | | | 0.521 | | | 0.088 |
| TT | 57 | 37 | 3.2±4.7 | | 20 | 10.5±8.7 | |
| TC+CC | 23 | 16 | 4.0±3.5 | | 7 | 5.6±5.1 | |
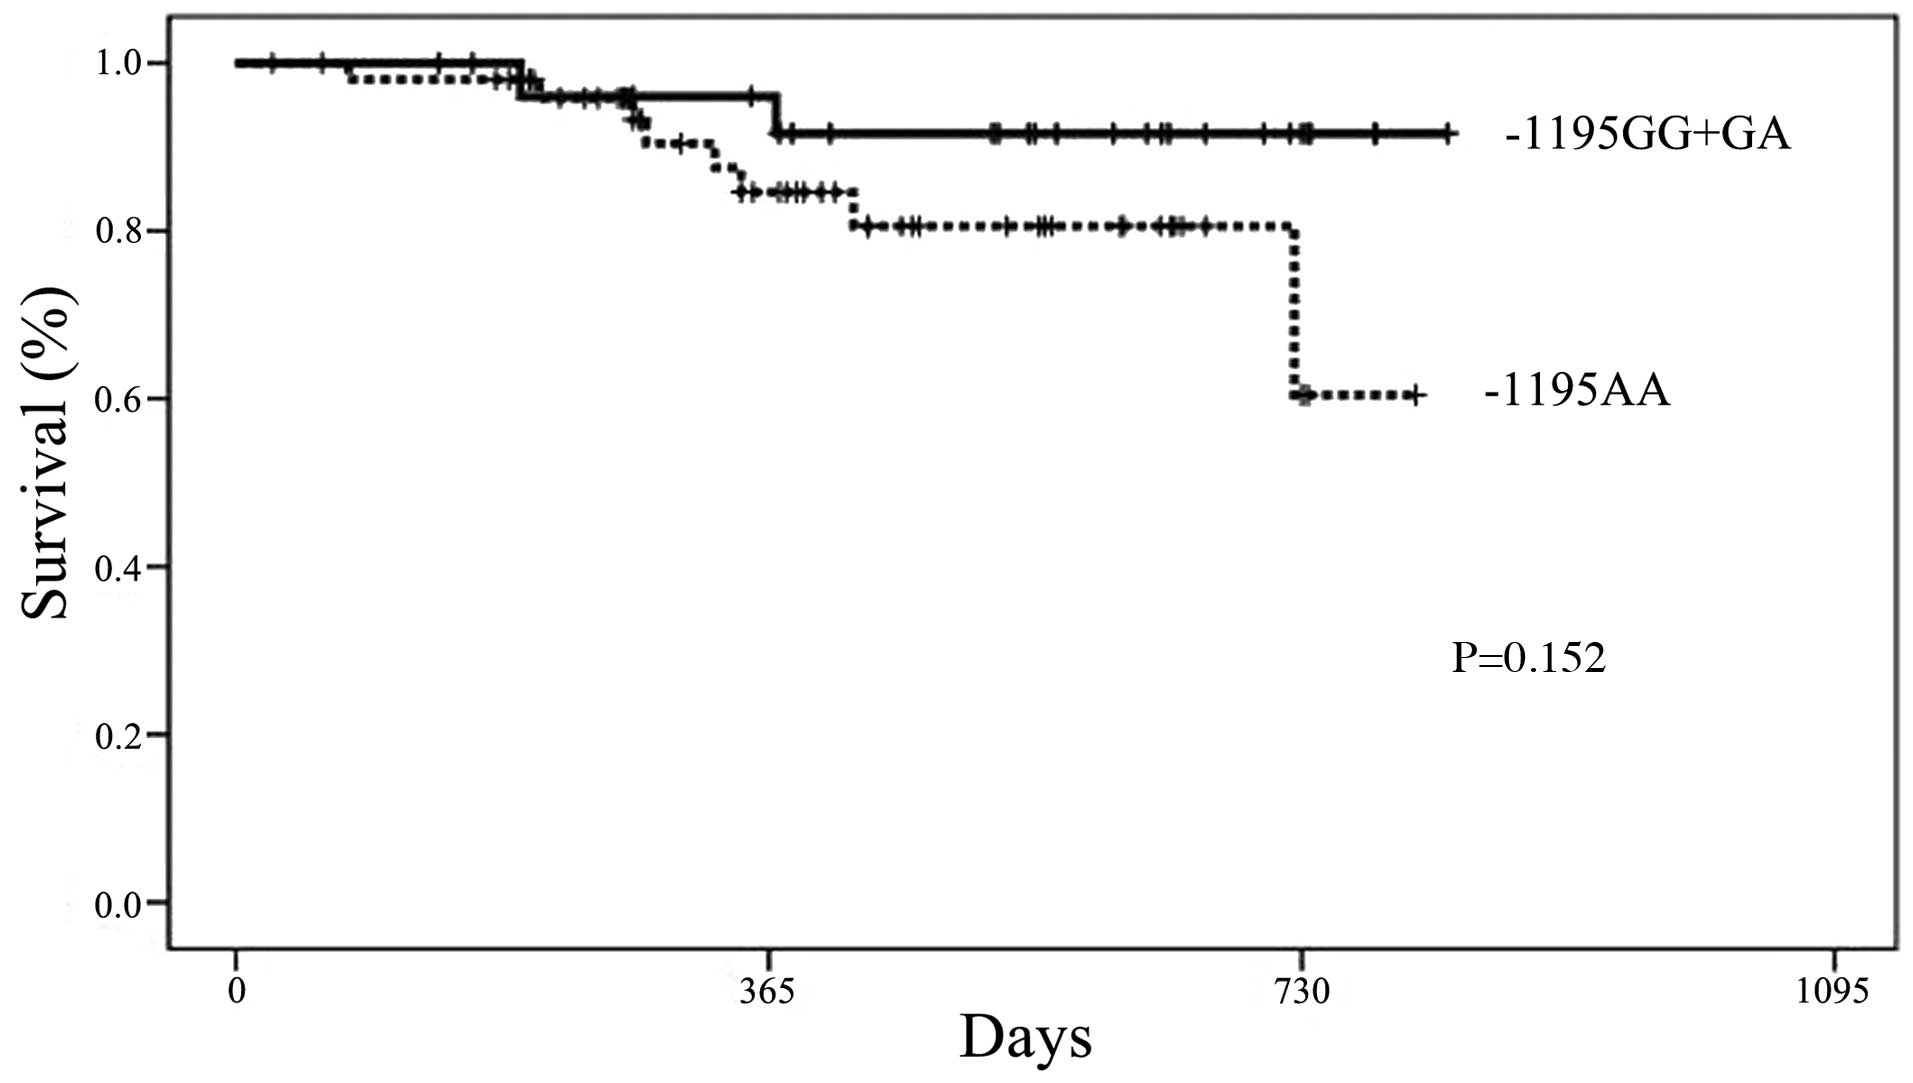
Association between genotypes and
DFS
The DFS period of the −1195AA genotype group was
shorter than that of the GA/GG genotype group; however, the
difference was not significant (Fig.
4). For the other COX-2 SNPs, no differences in the DFS
period were observed when the data were examined according to
genotype.
Discussion
In 2010, we demonstrated that the tumor-infiltrating
Foxp3+ Tregs count (Treg score) was positively
correlated with the intratumoral COX-2 expression level and was
associated with a poor recurrence-free survival period, in
particular among patients with node-negative NSCLC (11). In the present study, we examined
whether COX-2 SNPs are associated with the expression of
COX-2, Foxp3+ Treg and Ki-67 in 80 consecutive NSCLC
patients who underwent resection. Our results showed that the AA
genotype of the −1195G/A SNP in the COX-2 promoter region
significantly contributed to the increased tumor-infiltrated
Foxp3-positive lymphocyte count and indicated that NSCLC with an AA
genotype for the −1195G/A SNP had a shorter DFS, compared with the
GA/GG genotype.
A few studies have described different COX-2 SNPs
and the associated clinical outcomes for several types of cancer.
Li et al (18) reported that
COX-2 SNPs were associated with the prognosis of patients with
colorectal cancer. Bi et al (14) showed that genetic polymorphisms in
COX-2 were associated with survival in patients with locally
advanced NSCLC who had undergone chemoradiotherapy or radiotherapy
alone They reported that the AA genotype of the −1195G/A SNP in the
COX-2 promoter region significantly contributed to an
unfavorable overall survival and progression-free survival,
compared with the other genotype. Our results were similar to their
results, but this study is the first to point out that the
COX-2 polymorphism is associated with the Treg score in
NSCLC.
The genotype frequencies for COX-2 −1195G/A
SNPs in this study were equivalent to those in a previous study
(19). Regarding the function of
the −1195G/A polymorphism in COX-2, the −1195G to A change
reportedly creates a c-MYB binding site in the COX-2
promoter region, thereby increasing the promoter activity (12). Compared with the −1195G-containing
counterparts, the −1195AA carriers showed a significantly higher
COX-2 expression level (12). In
the present study, no significant correlations were found between
the COX-2 expression level and the genotype of COX-2.
However, the Treg score for the AA genotype of the −1195G/A
polymorphism was significantly higher than that for the GA/GG
group. Furthermore, the AA genotype group showed a significantly
higher Treg score than the GA/GG group, regardless of the
intratumoral COX-2 expression. These results suggest that the
polymorphism may influence the inducing capacity of Tregs into
NSCLC, as well as the prognosis of patients with NSCLC as a result
of the infiltration of Tregs. To validate our hypothesis, the
quantity or biological activity of prostaglandin E2
(PGE2) may need to be measured in lung tumor tissue,
followed by an investigation of the correlation between
COX-2 SNPs and intratumoral PGE2, which is
converted from arachidonic acid in the presence of COX-2 as a
catalytic substance and is considered to stimulate the infiltration
of Tregs into tumor tissue (6).
Recently, a clinical trial by Cancer and Leukemia
Group B demonstrated that among patients with increased COX-2
expression levels, survival was better among those who received
treatment with a COX-2 inhibitor than among those who did not
receive this treatment (15).
Considering the present results, it may be necessary to investigate
the COX-2 −1195 genetic polymorphism status when deciding
upon a treatment strategy for NSCLC in the future.
This study has several limitations. First, the
sample size may not be sufficiently large. The sample size of this
study was smaller than that of a previous study (14) in which the correlation between the
outcome of patients with unresectable NSCLC and the COX-2
polymorphism status was investigated. Second, the present study
included only cases of resectable, relatively early-stage NSCLC and
did not include any advanced NSCLC cases. Thus, our results may not
be representative of NSCLC in general. Our results should thus be
validated for a range of disease stages in the future.
In conclusion, our results showed significant
differences in intratumoral Treg expression among NSCLC patients
with different COX-2 −1195G/A genotypes. The
tumor-infiltrating Treg count was significantly higher among the
−1195AA genotype group, regardless of the COX-2 expression level.
These findings suggest that the COX-2 −1195G/A polymorphism
is a potential regulator of the infiltration of Tregs into NSCLC
and that it may affect patient prognosis through its influence on
Treg infiltration in NSCLC.
Acknowledgements
The authors thank Keiko Isoda for the technical
assistance.
References
|
1
|
Griswold DE and Adams JL: Constitutive
cyclooxygenase (COX-1) and inducible cyclooxygenase (COX-2):
rationale for selective inhibition and progress to date. Med Res
Rev. 16:181–206. 1996. View Article : Google Scholar : PubMed/NCBI
|
|
2
|
Dubois RN, Abramson SB, Crofford L, et al:
Cyclooxygenase in biology and disease. FASEB J. 12:1063–1073.
1998.PubMed/NCBI
|
|
3
|
Hida T, Yatabe Y, Achiwa H, et al:
Increased expression of cyclooxygenase 2 occurs frequently in human
lung cancers, specifically in adenocarcinomas. Cancer Res.
58:3761–3764. 1998.PubMed/NCBI
|
|
4
|
Hwang D, Scollard D, Byrne J and Levine E:
Expression of cyclooxygenase-1 and cyclooxygenase-2 in human breast
cancer. J Natl Cancer Inst. 90:455–460. 1998. View Article : Google Scholar : PubMed/NCBI
|
|
5
|
Ogino S, Kirkner GJ, Nosho K, et al:
Cyclooxygenase-2 expression is an independent predictor of poor
prognosis in colon cancer. Clin Cancer Res. 14:8221–8227. 2008.
View Article : Google Scholar : PubMed/NCBI
|
|
6
|
Wang D and DuBois RN: Eicosanoids and
cancer. Nat Rev Cancer. 10:181–193. 2010. View Article : Google Scholar : PubMed/NCBI
|
|
7
|
Curiel TJ: Tregs and rethinking cancer
immunotherapy. J Clin Invest. 117:1167–1174. 2007. View Article : Google Scholar : PubMed/NCBI
|
|
8
|
Kim JM and Rudensky A: The role of the
transcription factor Foxp3 in the development of regulatory T
cells. Immunol Rev. 212:86–98. 2006. View Article : Google Scholar : PubMed/NCBI
|
|
9
|
Hori S, Nomura T and Sakaguchi S: Control
of regulatory T cell development by the transcription factor Foxp3.
Science. 299:1057–1061. 2003. View Article : Google Scholar : PubMed/NCBI
|
|
10
|
Petersen RP, Campa MJ, Sperlazza J, et al:
Tumor infiltrating Foxp3+ regulatory T-cells are
associated with reccurence in pathologic stage l NSCLC patients.
Cancer. 107:2866–2872. 2006. View Article : Google Scholar : PubMed/NCBI
|
|
11
|
Shimizu K, Nakata M, Hirami Y, Yukawa T,
Maeda A and Tanemoto K: Tumor-infiltrating Foxp3+
regulatory T cells are correlated with cyclooxygenase-2 expression
and are associated with recurrence in resected non-small cell lung
cancer. J Thorac Oncol. 5:585–590. 2010.PubMed/NCBI
|
|
12
|
Zhang X, Miao X, Tan W, et al:
Identification of functional genetic variants in cyclooxygenase-2
and their association with risk of esophageal cancer.
Gastroenterology. 129:565–576. 2005.PubMed/NCBI
|
|
13
|
Zhao D, Xu D, Zhang X, et al: Interaction
of cyclooxygenase-2 variants and smoking in pancreatic cancer: a
possible role of nucleophosmin. Gastroenterology. 136:1659–1668.
2009. View Article : Google Scholar : PubMed/NCBI
|
|
14
|
Bi N, Yang M, Zhang L, et al:
Cyclooxygenase-2 genetic variants are associated with survival in
unresectable locally advanced non-small cell lung cancer. Clin
Cancer Res. 16:2383–2390. 2010. View Article : Google Scholar : PubMed/NCBI
|
|
15
|
Edelman MJ, Watson D, Wang X, et al:
Eicosanoid modulation in advanced lung cancer: cyclooxygenase-2
expression is a positive predictive factor for celecoxib +
chemotherapy - Cancer and Leukemia Group B Trial 30203. J Clin
Oncol. 26:848–855. 2008. View Article : Google Scholar : PubMed/NCBI
|
|
16
|
Perrone G, Ruffini PA, Catalano V, et al:
Intratumoural FOXP3-positive regulatory T cells are associated with
adverse prognosis in radically resected gastric cancer. Eur J
Cancer. 44:1875–1882. 2008. View Article : Google Scholar : PubMed/NCBI
|
|
17
|
Martin B, Paesmans M, Mascaux C, et al:
Ki-67 expression and patient survival in lung cancer: systematic
review of the literature with meta-analysis. Br J Cancer.
91:2018–2025. 2004. View Article : Google Scholar : PubMed/NCBI
|
|
18
|
Li S, Zhao X, Wu Z, et al: Polymorphisms
in arachidonic acid metabolism-related genes and the risk and
prognosis of colorectal cancer. Fam Cancer. 12:755–765. 2013.
View Article : Google Scholar : PubMed/NCBI
|
|
19
|
Shi J, Misso NL, Kedda MA, et al:
Cyclooxygenase-2 gene polymorphisms in an Australian population:
association of the −1195G>A promoter polymorphism with mild
asthma. Clin Exp Allergy. 38:913–920. 2008. View Article : Google Scholar : PubMed/NCBI
|