Introduction
Gastrointestinal subepithelial tumors (SETs) include
mesenchymal tumors, such as gastrointestinal stromal tumors
(GISTs), myogenic and neurogenic tumors, which collectively account
for 54% of all SETs, followed in frequency by heterotopic
pancreases, cysts, lipomas, carcinoid tumors, lymphangiomas and
hemangiomas (1). GISTs are the most
common type of SET, and they exhibit malignant potential, thus
requiring a multidisciplinary approach to optimize their management
(2). Minimally invasive local
resection techniques, such as endoscopic full-thickness resection
(EFTR), have been developed for the treatment of intramural GISTs
(3).
However, it is important to diagnose SETs
preoperatively, since doing so can help to avoid unnecessary
resection and enable optimal surgical resection, thereby reducing
the number of unresectable or metastatic GIST cases. According to
major guidelines such as the National Comprehensive Cancer Network
(NCCN), the European Society for Medical Oncology (ESMO), the
definitive final diagnosis of SETs should be based on
immunohistochemistry (4–8). Immunohistochemical staining of various
cellular proteins can be performed on tissue samples to provide
diagnostic information. The most important markers used to evaluate
hypoechoic intramural masses are CD-117 (c-kit), CD-34, smooth
muscle actin and S-100 (9,10). c-kit is a transmembrane receptor
with tyrosine kinase activity that is highly sensitive and specific
for GISTs. CD-34 is also expressed in ~80% of GISTs. Positive
staining for smooth muscle actin suggests the presence of a
leiomyoma, and the presence of S-100 suggests a neural origin or a
schwannoma. A preliminary study suggested that Ki-67 index (a
marker of cell proliferation) immunohistochemical staining improves
the ability to diagnose malignant GISTs (11). Moreover, the clinical behavior of
GISTs is quite variable and can be difficult to predict on the
basis of available clinical and histologic features. Nonetheless, a
consensus conference proposed a strategy for predicting the
malignant behavior of GISTs based on the size (<2, 2–5,
>5–10, or >10 cm) and mitotic count on histology [<5,
6–10, or >10/50 high-power fields (HPFs)], with the
understanding that no GIST can be defined as benign on the basis of
the currently available diagnostic testing (9).
Recently, several tissue sampling methods have been
proposed for the diagnosis of SETs, with endoscopic ultrasound
(EUS)-guided fine-needle aspiration (FNA) emerging as a standard
method. However, the diagnostic yield of EUS-FNA, including spindle
cell neoplasms (‘suspicious’), has generally been suboptimal
(66–83.9%) and has partially depended on the location, size and
characteristics of the target tissues, as well as certain technical
and procedural factors (12–14).
In particular, the immunohistological (IH) analysis needed for a
definitive final diagnosis has revealed the low diagnostic rate of
EUS-FNA (34–61.6%) (13,14). We previously developed a bloc biopsy
method involving submucosal endoscopy with a mucosal flap (SEMF)
(15), called tunneling bloc biopsy
(TBB), to obtain core biopsy specimens under direct vision from
growing endoluminal SETs (16). To
date, no studies have investigated whether the amount of tissue
sample can affect the accuracy of histological diagnostic methods,
including IH analysis, mitotic count and histological Ki-67
staining.
The aim of the present study was to investigate the
amount of GIST tissue needed for histological data: mitotic count
and Ki-67 index by analyzing samples acquired using FNA and
applying our TBB method.
Materials and methods
Materials
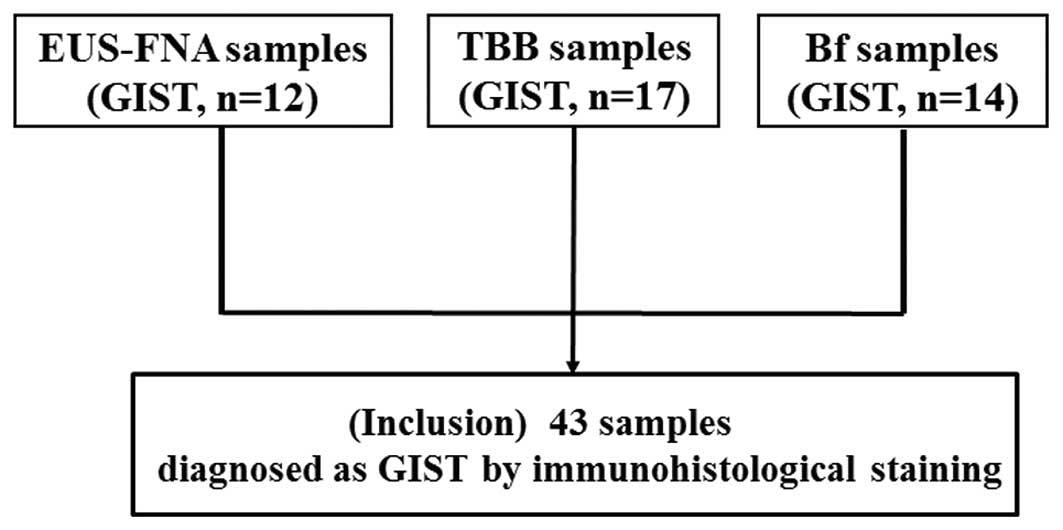
Between November 2008 and May 2014, 43 samples
acquired by the following three tissue sampling methods: FNA, TBB
and the use of biopsy forceps followed by TBB (Bf), which were
diagnosed definitely as GISTs by IH staining were utilized. The 43
samples consisted of 12 FNA, 17 TBB and 14 Bf samples (Fig. 1). The present study was designed as
a retrospective study and was conducted at a single academic
medical center, Kagawa University Hospital, Japan. The present
study was approved by the Clinical Ethics Committee of Kagawa
University Hospital. The clinical application of TBB and Bf
sampling methods was previously approved by the above ethics
committee on November, 2011. All of the patients provided written
informed consent to undergo the tissue sampling methods.
Analysis methods
The length of the major axis, the length of the
minor axis, and the overlay area of each one piece of specimen
(OPS) from the three tissue sampling methods were measured using
digital imaging software (cellSens Standard; Olympus, Tokyo, Japan)
on hematoxylin and eosin (H&E)-stained or IH tissue sections.
The cellSens Standard software introduces interactive measurement
capabilities for distances and polygons. The overlay area of each
OPS was calculated by polygon measurement. Additionally,
associations between sampling methods and histological data were
analyzed comparatively.
Evaluation items
First, we calculated the mean of each parameter
(major and minor axes, overlay area) of each OPS acquired using
three sampling methods (FNA, TBB and Bf). The evaluable rates of
histological analysis involving mitotic count/50 HPF and Ki-67 (M1B
labeling) among the three sampling methods were investigated.
We defined OPS as a ‘Successful Sample’ when the
sample was suitable for histological analysis of mitotic count and
Ki-67 index. Comparing ‘Successful Samples’ with ‘Unsuccessful
Samples’, we calculated the mean differences between their major
and minor axis lengths and overlay areas, and thereby calculated
the cut-off values of overlay areas that distinguished the two
classes of samples.
Second, in the resected GIST cases (n=16), we
calculated the concordance rate regarding mitotic count/50 HPF,
Ki-67 index between the diagnosis of each sampling method and
post-surgical examination of the resected tumors.
Evaluation of histological findings
The degree of mitotic index, indicating the average
number of mitotic cells in 50 HPFs (×40 objective and ×10 ocular
lens), was estimated by the visual impressions of two expert
pathologists (Y.K. and R.H.) without counting the actual numbers of
tumor cells. The cell blocks documented an equivalent morphology,
which was characterized by monotonous sheets and groups of
spindle-shaped cells with oval nuclei and well-defined cellular
borders. Immunohistochemical procedures were performed on the 3-μm
serial sections, utilizing the following commercially obtained
antisera: CD117 [w.d. (working dilution), 1:50], smooth muscle
actin (SMA; w.d., 1:50), vimentin (w.d., 1:200), S-100 (w.d.,
1:400), Ki-67 (MIB-1; w.d., 1:50), desmin (w.d., ready to use) (all
obtained from DakoCytomation, Copenhagen, Denmark) and CD34 (w.d.,
ready to use) (Leica Biosystems, Newcastle, UK). The growth
fraction, determined by Ki-67 abundance as the MIB-1
labeling-index, was low, showing <10% positively labeled
nuclei.
Techniques of tissue sampling
methods
Endoscopic ultrasound-guided
fine-needle aspiration
With patients in the left lateral decubitus position
under conscious sedation, EUS-FNA was performed using a
conventional convex scanner echo endoscope (UCT-240-AL5; Olympus)
connected to an ultrasound scanner (ProSound SSD-α10; Aloka, Tokyo,
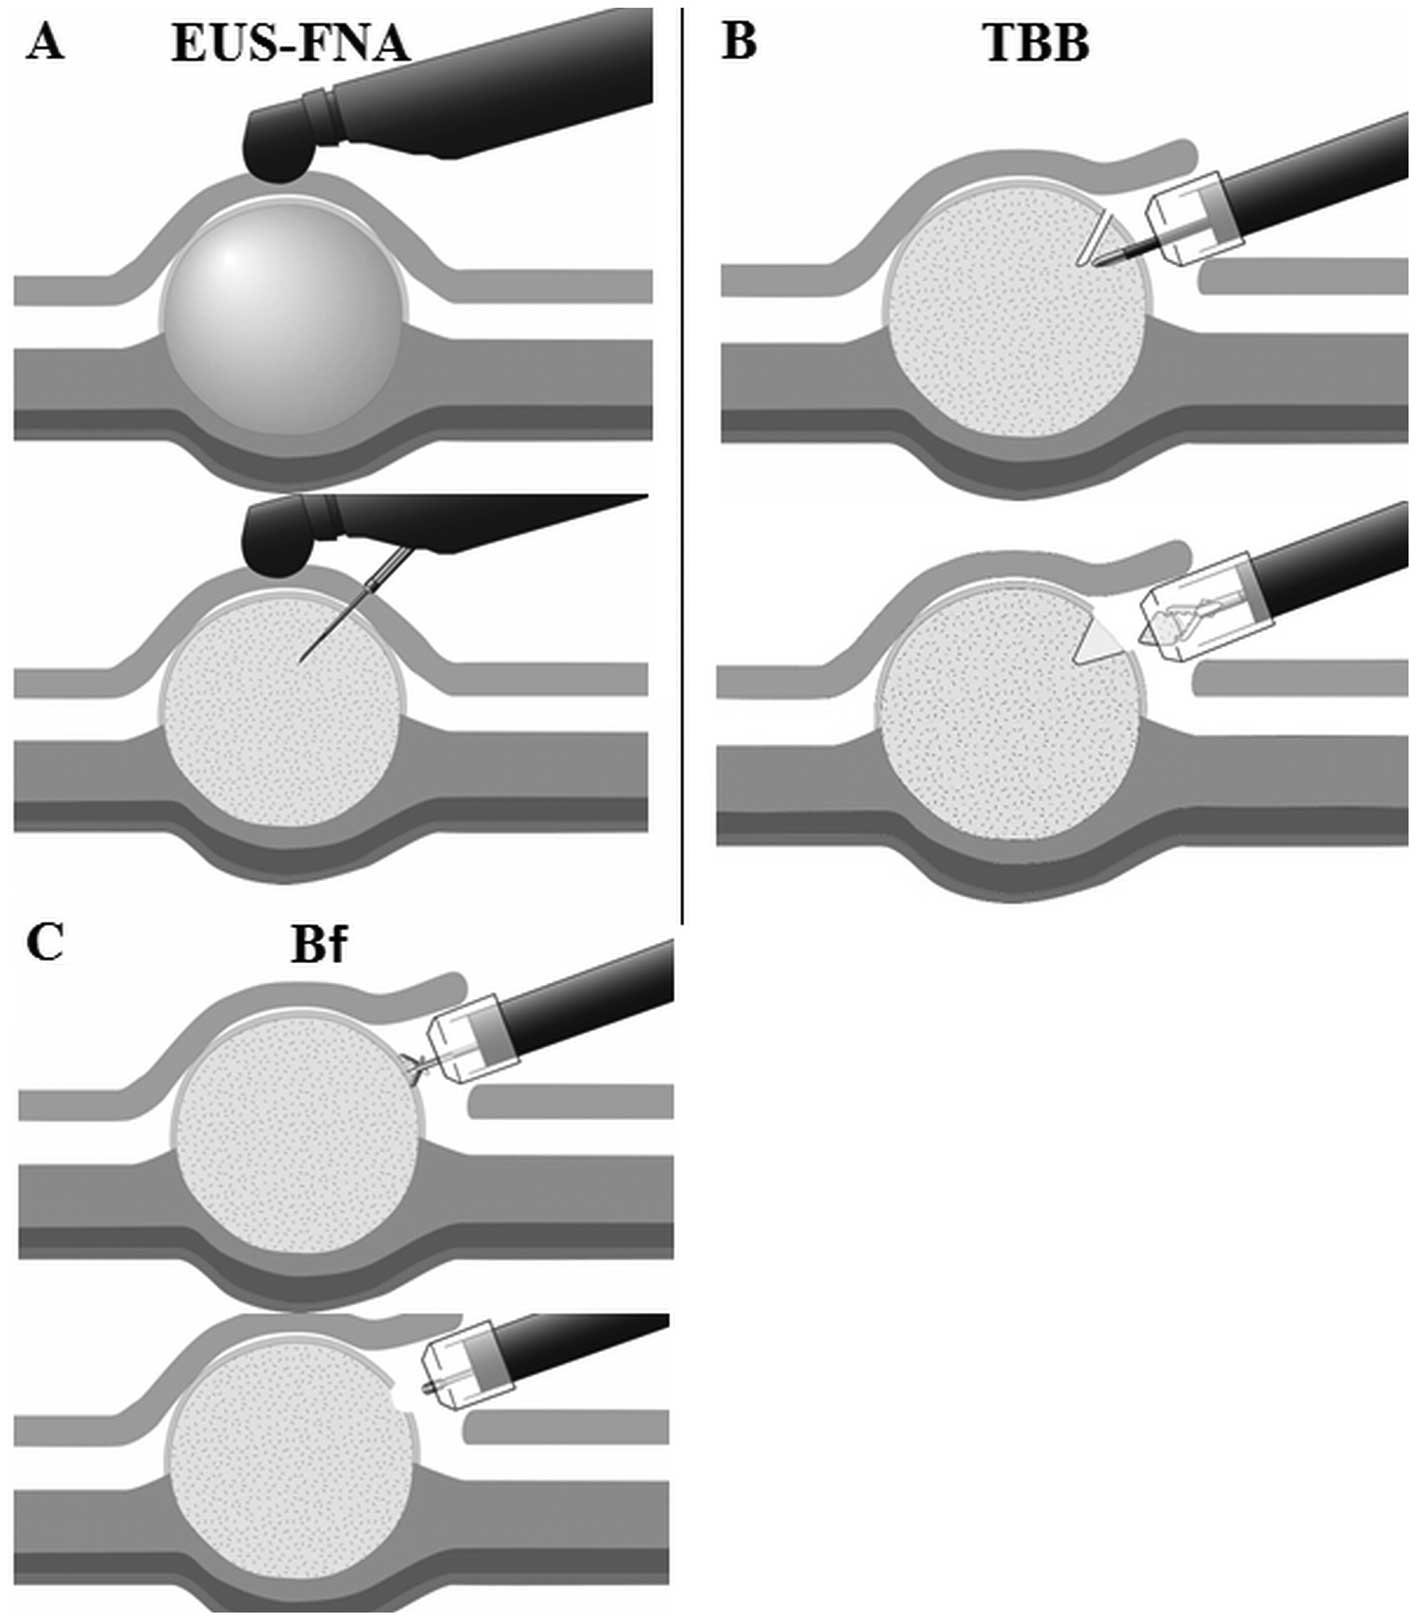
Japan). Tissue samples were obtained with disposable 19-, 22- or
25-gauge aspiration needles (Expect™ standard type; Boston
Scientific, Tokyo, Japan) (FNA sample) (Fig. 2A). Color flow and Doppler sonography
was performed to exclude intervening vascular structures and to
select a vessel-free needle track to avoid vessel puncture. EUS-FNA
was performed as previously described (17). Briefly, after advancing the needle
into the lesion under EUS visualization, the central stylet was
removed, a 10-ml syringe with extension tubing was attached to the
hub of the needle, and suction was applied as the needle was moved
backward and forward within the lesion. During each puncture
session, the needle was moved in various directions >10 times
within the lesion, before being retracted into the catheter and the
entire catheter being removed. Saline containing the aspirated
material was transferred to a Petri dish and was examined
macroscopically by an on-site cytopathologist to determine whether
the tissue sample was cytologically adequate; if deemed inadequate
after two punctures, an additional puncture was performed with a
larger needle. All of the EUS-FNA procedures were performed by an
endosonographer and an experienced endoscopist (H. Kamada), who has
successfully performed more than 200 EUS-FNA procedures.
Tunneling bloc biopsy
Patients were administered intravenous midazolam
(0.05 mg/kg) and pethidine (50 mg) prior to TBB, which consisted of
five major procedures (16).
Briefly, in the first step, after placing several dots around the
tumor at a margin of ~5 mm, with one dot at the top of the tumor, a
small incision was made to create a 10-mm opening flap, followed by
submucosal injection of 0.4% hyaluronate sodium solution (MucoUp;
Johnson & Johnson K.K., Tokyo, Japan) with a needle knife
(KD-441Q; Olympus). In the second step, SEMF (15), a short 10-mm tunnel through the
opening flap was created by additional submucosal dissection to
approach the tumor. In the third step, bloc biopsy, the tumor was
visually identified and exposed, and a bloc specimen measuring ~5 ×
5 × 2 (major axis × minor axis × depth, mm) (TBB sample) (Fig. 2B) was obtained using the needle
knife on the electrosurgical unit (VIO300D; ERBE Elektromedizin,
Tübingen, Germany) in EndoCut mode (effect 2, duration 3) while
minimizing tissue crushing. Separation of the bloc specimen from
the tumor required a 2-mm-deep spindle-shaped incision. In this
step, a bloc specimen was simultaneously acquired using biopsy
forceps (Radial Jaw™ 4 Standard Capacity; Boston Scientific) (Bf
sample) (Fig. 2C). In the fourth
step, tissue collection, the specimen was detached from the tumor
with grasping forceps (FG-6U-1) or hemostatic forceps (FD-410 LR)
(both from Olympus) and was collected into the transparent cap that
was longer at the tip (Elastic Touch F-030; TOP Corporation, Tokyo,
Japan). All of the procedures were performed by an experienced
endoscopist (H. Kobara), who has successfully performed more than
200 gastric endoscopic submucosal dissection (ESD) cases. Bleeding
was controlled in all of the procedures using hemostatic forceps
(FD-410 LR).
Statistical analysis
Summary statistics (mean, range) were calculated for
each tissue sampling method. The results were compared using
Fisher’s exact test, as appropriate. The cut-off values between
‘Successful Samples’ and ‘Unsuccessful Samples’ were chosen using
the likelihood ratio test by logistic regression analysis,
calculating the balanced error rate (BER), odds ratio (OR),
receiver operating characteristic (ROC) curve, and area under the
ROC curve (AUC). All of the data analyses were performed using
STATA software, version 7.0 (StataCorp, College Station, TX, USA),
and a P-value <0.05 was considered to indicate a statistically
significant result.
Results
Assessment of mean parameters
The parameters of the 43 specimens adequate for IH
staining, obtained with the FNA needles, TBB and Bf, were
calculated as follows. The mean major axis lengths were 1.598 mm
(range, 0.16–3.8), 3.765 mm (range, 1.7–6.4) and 1.829 mm (range,
1.1–2.6), respectively. The mean minor axis lengths were 0.486 mm
(range, 0.1–0.8), 2.382 mm (range, 1.4–4.2) and 1.214 mm (range,
0.6–2.1), respectively. The mean overlay areas by polygon
measurement were 0.907 mm2 (range, 0.098–3.11), 4.864
mm2 (range, 1.4–12.1) and 1.478 mm2 (range,
0.35–3.1), respectively (Table I).
Representative digital slides obtained using the three sampling
methods are presented in Fig.
3A–D.
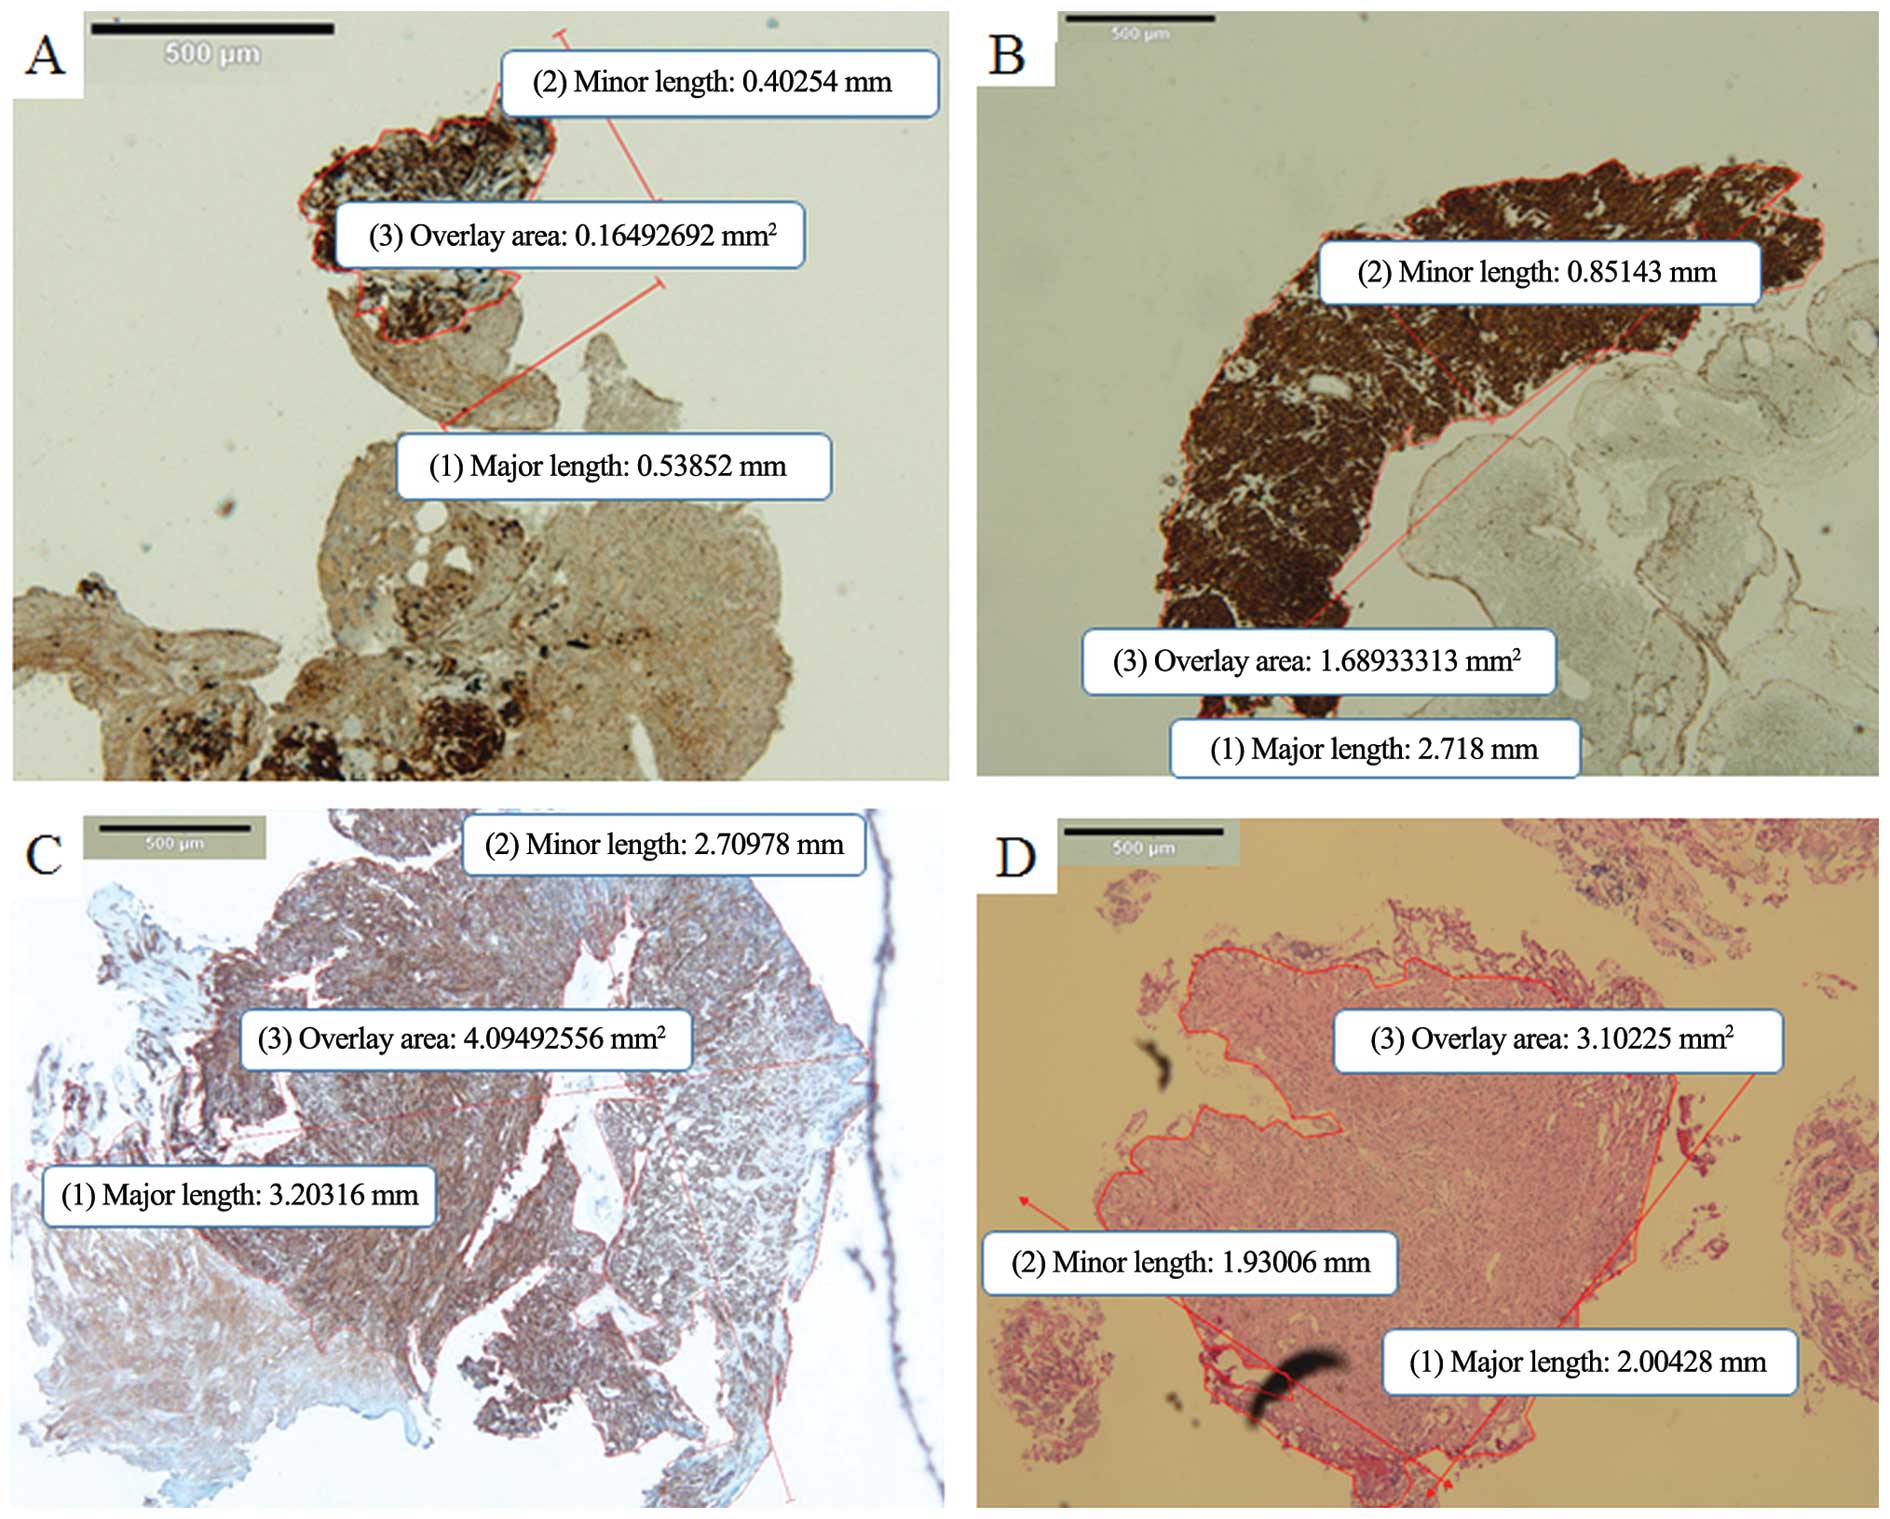 | Figure 3Presentation of tissue samples for
each sampling methods. (A) Representative digital slide of a
specimen obtained by EUS-FNA. The mean major length, the mean minor
length (mm), and overlay area (mm2) of one piece of
specimen, measured using digital imaging software (cellSens
Standard) were 0.54, 0.4 and 0.165, respectively (c-kit staining;
magnification, ×4). This sample was judged as inadequate for
histological analysis of mitotic count and Ki-67. (B)
Representative digital slide of a sufficient specimen obtained by
EUS-FNA. The mean major length, the mean minor length (mm) and
overlay area (mm2) of one bloc specimen were 2.72, 0.85
and 1.689, respectively (c-kit staining; magnification, ×4). (C)
Representative digital slide of a sufficient specimen obtained by
tunneling bloc biopsy. The mean major length, the mean minor length
(mm) and overlay area (mm2) of one bloc specimen were
3.20, 2.71 and 4.094, respectively (c-kit staining; magnification,
×4). (D) Representative digital slide of a sufficient specimen
obtained by biopsy forceps of Bf method. The mean major length, the
mean minor length (mm) and overlay area (mm2) of one
bloc specimen were 2.00, 1.93 and 3.102, respectively (hematoxylin
and eosin staining; magnification, ×4). FNA, fine-needle
aspiration. |
 | Table IComparison of adequate specimens for
the immunohistological analysis according to the sampling
method. |
Table I
Comparison of adequate specimens for
the immunohistological analysis according to the sampling
method.
| Parameters | Mean major lengths, n
(mm) | Mean minor lengths, n
(mm) | Mean overlay areas by
polygon measurement (mm2) |
|---|
| FNA (n=12) | 1.598 | 0.486 | 0.907 |
| TBB (n=17) | 3.765 | 2.382 | 4.864 |
| Bf (n=14) | 1.829 | 1.214 | 1.478 |
| Total (n=43) | 2.397 | 1.361 | 2.416 |
Associations between sampling methods and
histological parameters
We analyzed the evaluable rates by mitotic count/50
HPF and Ki-67 index of the 43 tissue samples. The evaluable rates
by mitotic count and Ki-67 index were, respectively, 75% (9/12) and
83.3% (10/12) for FNA samples, 100% (17/17) and 100% (17/17) for
TBB samples, and 100% (14/14) and 100% (14/14) for Bf samples
(Table II). There were no
significant differences between three sampling methods in regards
to the evaluable rates (FNA vs. TBB vs. Bf; P>0.05, Fisher’s
exact test).
| Table IIThe evaluable rates of tissue samples
according to the sampling method and histological parameters in the
gastrointestinal stromal tumors. |
Table II
The evaluable rates of tissue samples
according to the sampling method and histological parameters in the
gastrointestinal stromal tumors.
| Parameters | Mitotic counts/50
HPF, % (n) | Ki-67 (M1B) index, %
(n) |
|---|
| FNA (n=12) | 75 (9) | 83.3 (10) |
| TBB (n=17) | 100 (17) | 100 (17) |
| Bf (n=14) | 100 (14) | 100 (14) |
| Total (n=43) | 93 (40) | 93 (40) |
Identification of appropriate tissue
amounts for histological analysis
The mean major and minor axes (mm) and overlay areas
(mm2) of the ‘Successful Samples’ were 2.688, 1.562 and
2.847 (n=40), while those of the ‘Unsuccessful Samples’ were 0.423,
0.29 and 0.127 (n=3), respectively (Table III). Representative digital slide
of a small specimen obtained by EUS-FNA is shown in Fig. 3A.
| Table IIIComparison of sufficient specimens
needed for overall histological data (immunohistological staining,
mitotic count and Ki-67) for each sampling method. |
Table III
Comparison of sufficient specimens
needed for overall histological data (immunohistological staining,
mitotic count and Ki-67) for each sampling method.
| Mean major × minor
axis lengths (mm), overlay areas (mm2), (n) |
|---|
|
|
|---|
| Successful Samples
(n=40) | Unsuccessful
Samples (n=3) |
|---|
| FNA (n=12) | 1.99 × 0.55, 1.17
(n=9) | 0.42 × 0.29, 0.123
(n=3) |
| TBB (n=17) | 3.77 × 2.38, 4.86
(n=17) | -, (n=0) |
| Bf (n=14) | 1.83 × 1.21, 1.48
(n=14) | -, (n=0) |
| Total (n=43) | 2.69 × 1.56, 2.85
(n=40) | 0.42 × 0.29, 0.123
(n=3) |
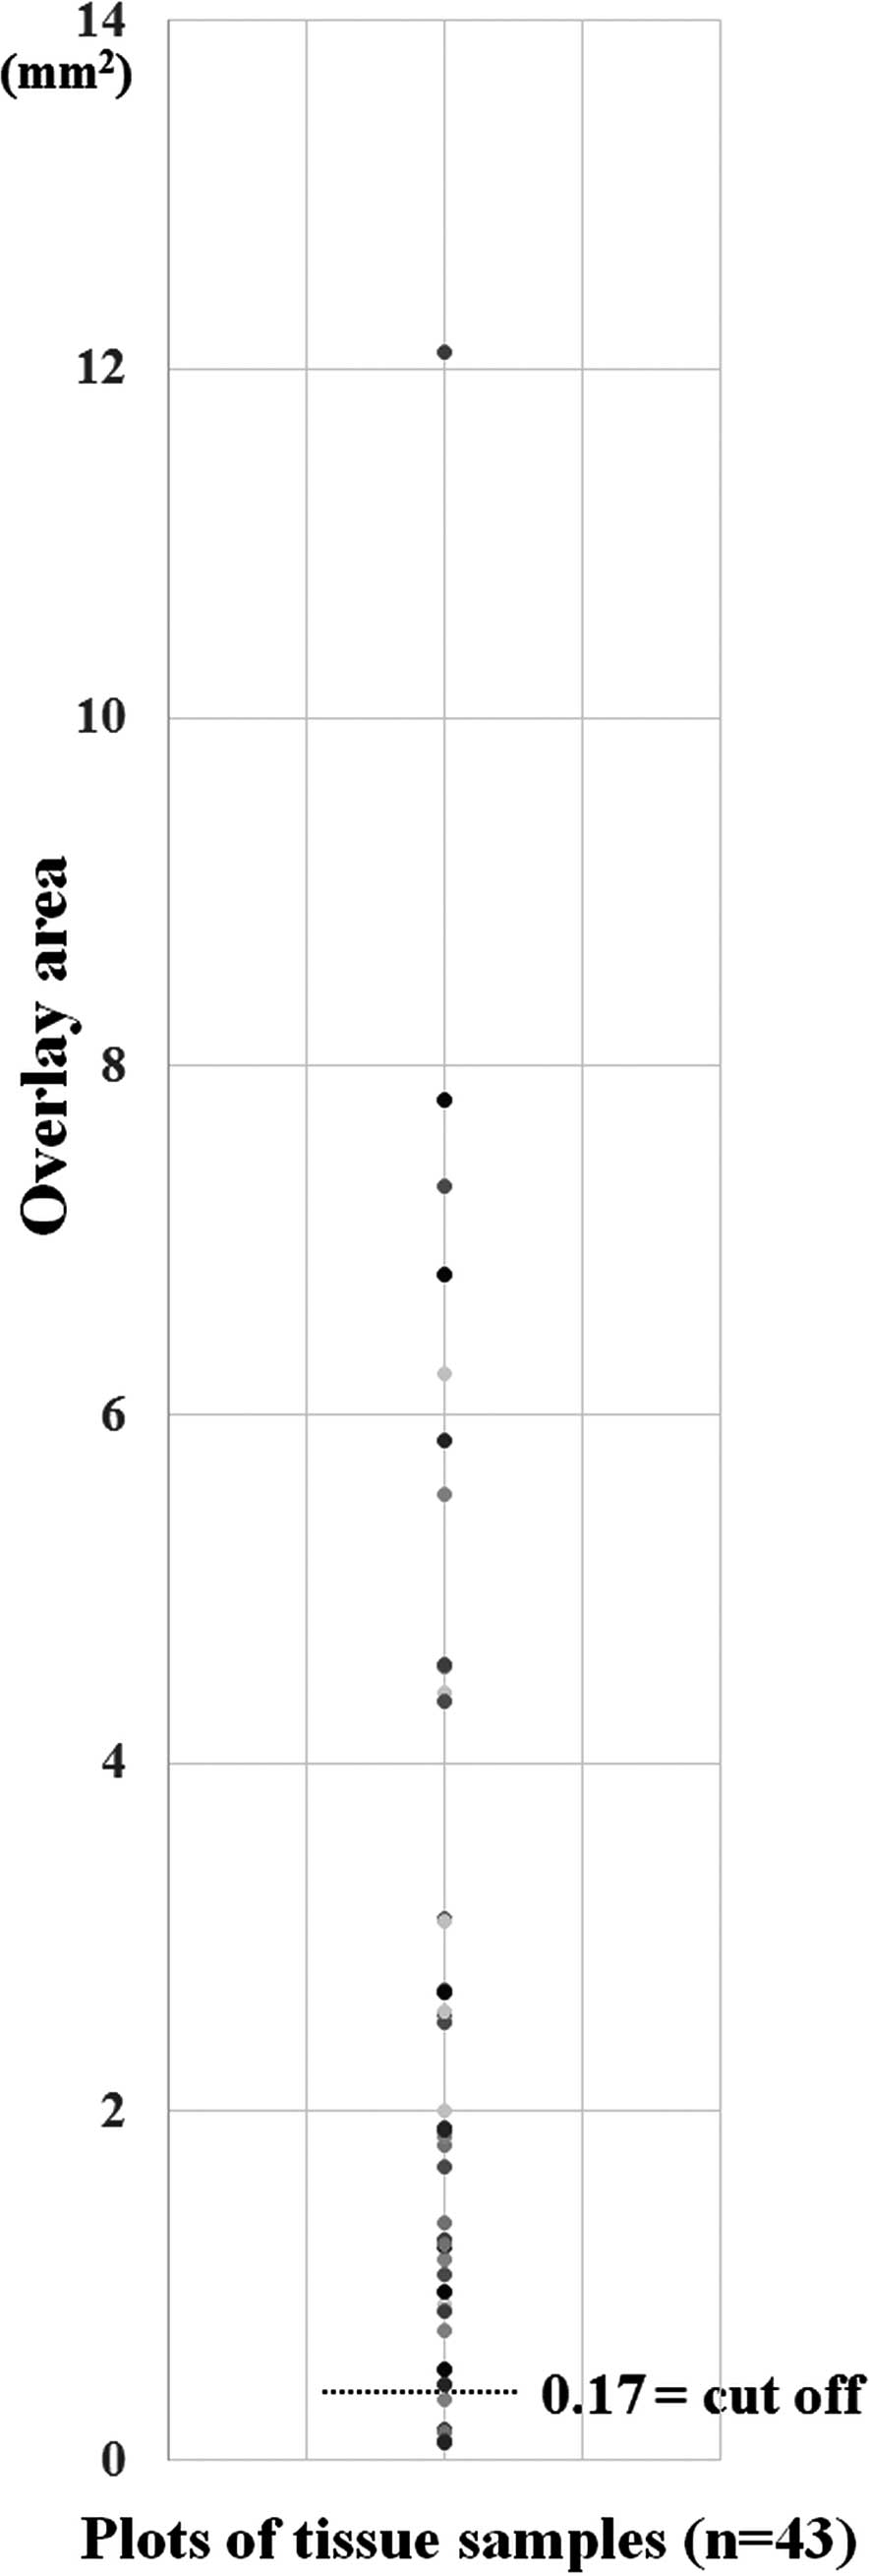
Comparing ‘Successful Samples’ with ‘Unsuccessful
Samples’ yielded cut-off values (BER, OR and AUC) of 0.17
mm2 (0, ∞, 1) for the overlay area (logistic regression
analysis by likelihood ratio test) (Fig. 4).
Concordance rate between pre- and
post-operative samples in the GISTs
In the 16 resected GIST cases, the concordance rates
regarding mitotic count were 50% (5/10) in FNA, 92.3% (12/13) in
TBB and 90.9% (10/11) in Bf. Comparing the three sampling methods,
TBB was significantly better than FNA (TBB vs. FNA; P=0.035,
Fisher’s exact test). The concordance rates regarding the Ki-67
index were 60% (6/10) in FNA, 92.3% (12/13) in TBB and 90.9%
(10/11) in Bf. There were no significant differences among the
three sampling methods in regards to Ki-67 concordance (FNA vs. TBB
vs. Bf; P>0.05, Fisher’s exact test) (Fig. 5).
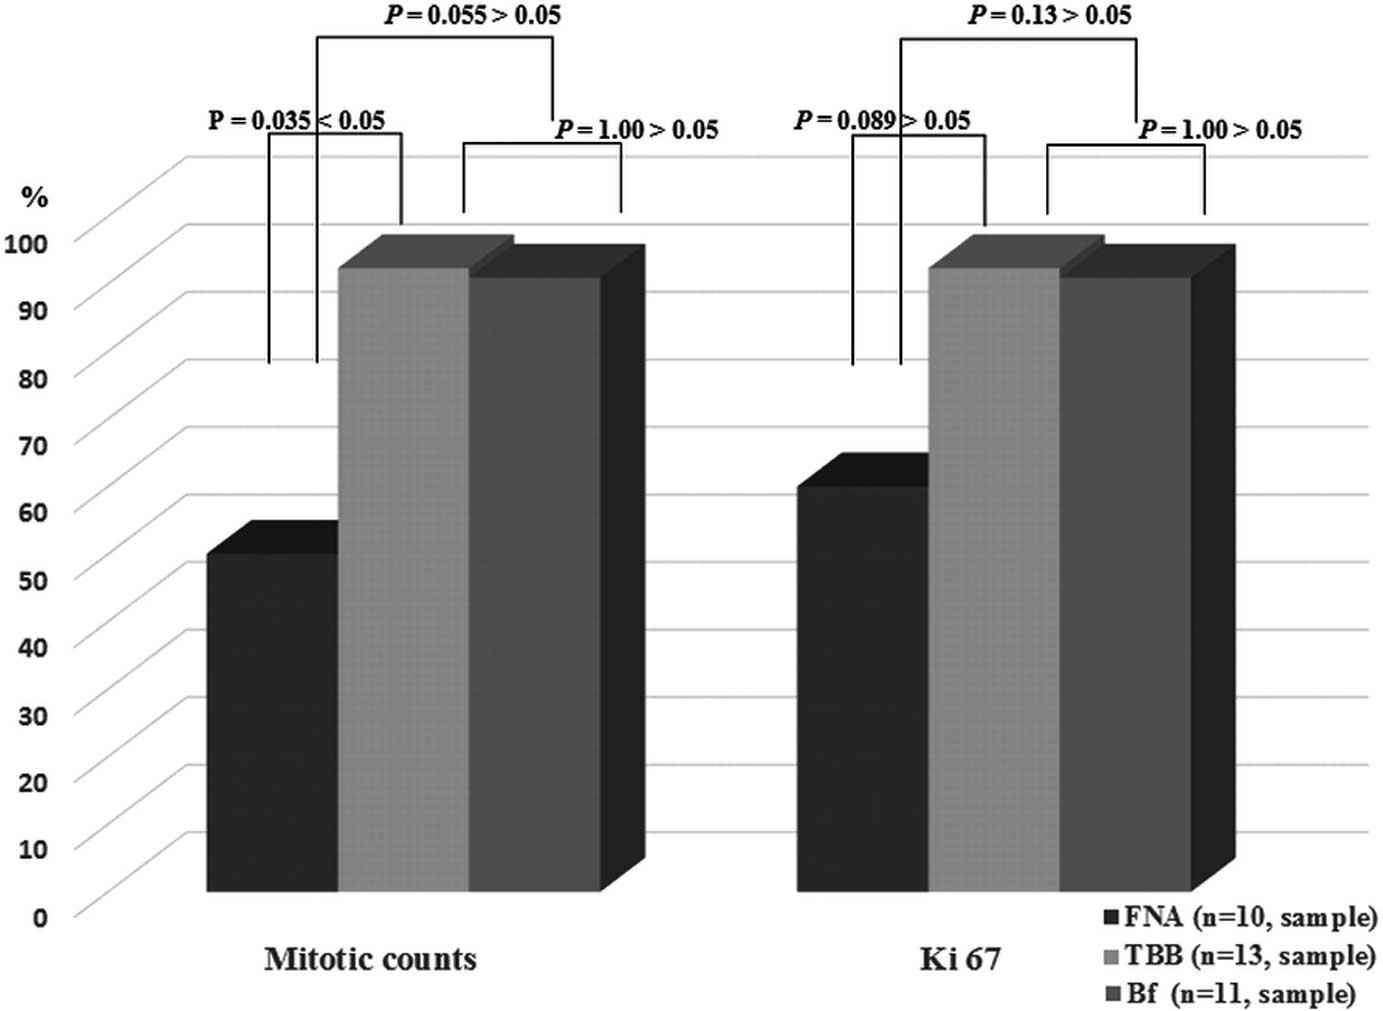 | Figure 5The concordance rate between pre- and
post-operative samples in surgically resected GIST cases (n=16).
The concordance rates in regards to the mitotic count were 50%
(5/10) in FNA, 92.3% (12/13) in TBB and 90.9% (10/11) in Bf,
respectively. Comparing the three sampling methods, TBB had a
significant difference over FNA (TBB vs. FNA; P=0.035 <0.05,
Fisher’s exact test). The concordance rates in regards to Ki-67
were 60 (6/10) in FNA, 92.3% (12/13) in TBB and 90.9% (10/11) in
Bf, respectively. There were no significant differences between the
three sampling methods (FNA vs. TBB vs. Bf; P>0.05, Fisher’s
exact test). GIST, gastrointestinal stromal tumor; FNA, fine-needle
aspiration; TBB, tunneling bloc biopsy; Bf, use of biopsy forceps
followed by TBB. |
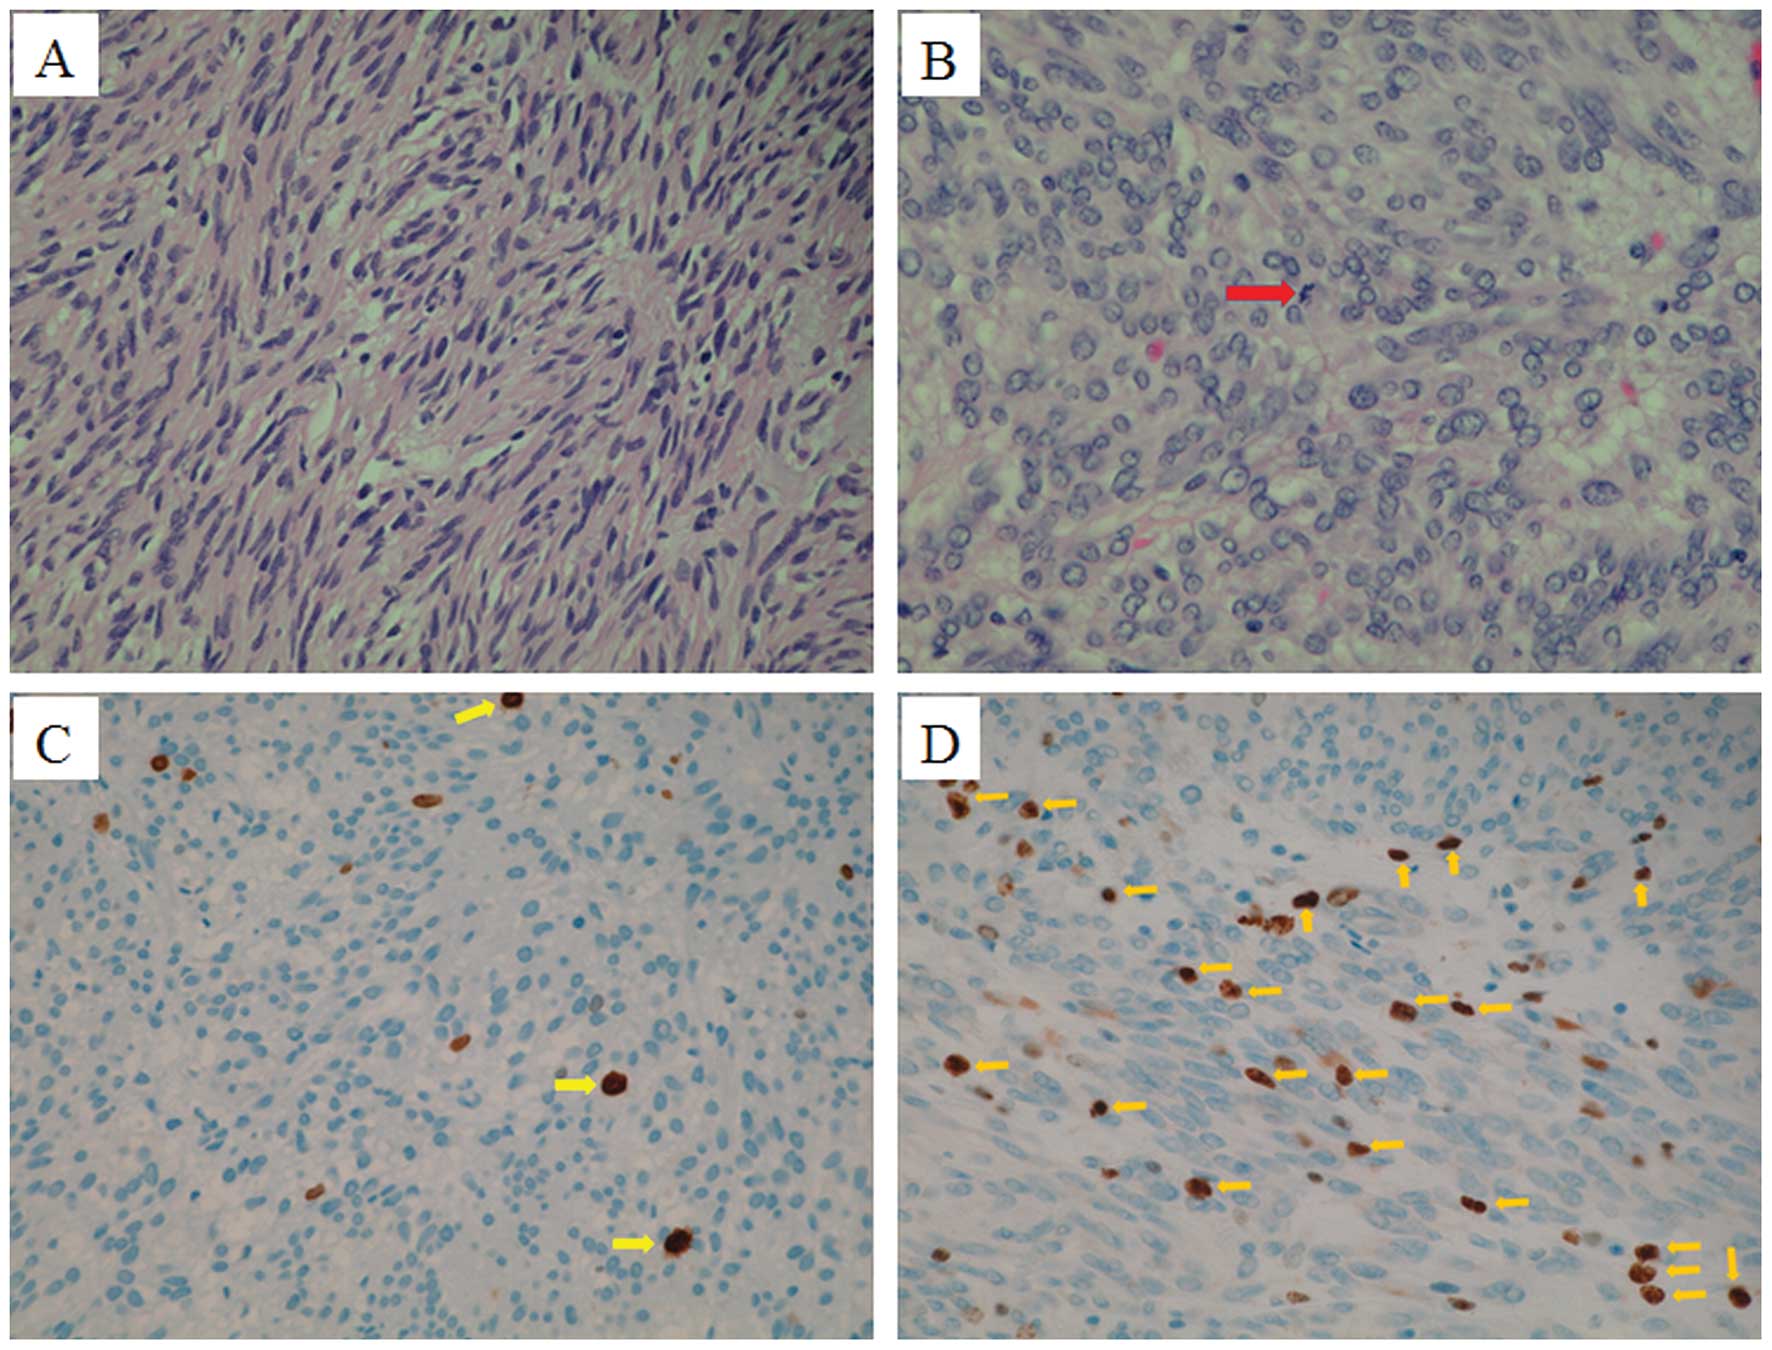
The discordances between pre- and post-operative
samples were refined as follows. Three FNA samples were too small
for evaluation by mitotic count/50 HPF (sample number, major ×
minor axes, overlay area: sample 1, 0.54 × 0.4 mm, 0.16
mm2; sample 2, 0.16 × 0.1 mm, 0.11 mm2;
sample 3, 0.57 × 0.37 mm, 0.098 mm2). Two samples
obtained by FNA, one sample obtained by TBB, and one sample
obtained by Bf had discrepancies with the post-operative sample. In
all of these four samples, mitotic count/50 HPF <1 was converted
to >5, Ki-67 index <5% was converted to >10%. The
representative digital slides of TBB and FNA samples are shown in
Fig. 6A–D.
Discussion
An optimal tissue sampling strategy for the
diagnosis of SETs is needed to determine the most appropriate
management plan (e.g., surgical resection or observation). Since
each type of SET lesion can have a different prognosis, different
therapeutic options are required. The acquired tissue samples
should be appropriate materials for immunohistochemical staining
for proteins such as CD-117 (c-kit), CD-34, smooth muscle actin and
S-100, to differentiate between various SETs. Additionally, in GIST
cases, the material should enable pathologists to evaluate mitotic
count by histology, based on major consensus conferences (NCCN,
ESMO) (4,6), and the risk classification of GIST
(9,18).
The present study, by analyzing the acquired samples
with EUS-FNA, TBB and Bf, has presented findings regarding the
appropriate amounts of tissue samples required for IH diagnosis,
cell count and Ki-67.
Differences in tissue amounts between
sampling methods
The mean major and minor axis lengths (mm) and
overlay area (mm2) by polygon analysis were in the order
of TBB > Bf > FNA (major axis, 3.765 vs. 1.829 vs. 1.598;
minor axis, 2.382 vs. 1.214 vs. 0.486; area, 4.864 vs. 1.478 vs.
0.907). Sakamoto et al previously reported that the mean
maximum size of fragments obtained with 25- and 22-gauge FNA
needles and with a 19-gauge Trucut needle were 0.4 mm (range,
0.2–1.1 mm); 0.7 mm (range, 0.3–1.4 mm); and 2.7 mm (range, 0.8–3.6
mm), respectively (19).
The outer diameters of 25-, 22- and 19-gauge FNA
needles (Expect™ standard type) are generally 0.52, 0.72 and 1.10
mm, respectively. The outer diameter of the needle will be
equivalent to the minor axis length in samples such as ours. In the
present study, the mean minor lengths obtained with the 25-, 22-
and 19-gauge FNA needles were 0.38 (n=4), 0.56 (n=6) and 0.49 mm
(n=2), which did not show a tendency toward similarity with the
outer diameter of each size of needle. Additionally, since the
major axis lengths obtained with FNA needles depend on the depth of
the puncture needle, based on the size of the targeted tumor, the
caliber of the FNA needle would not affect the length of the
acquired specimens. Therefore, there were no significant
differences in the major axis lengths among the 25-, 22- and
19-gauge needles (2.19 vs. 1.30 vs. 1.16 mm). In contrast, the mean
lengths of the specimens obtained by TBB were 3.77 mm on the major
axis and 2.38 mm on the minor axis, and these were the largest
specimens among the 3 tissue sampling methods. The mean lengths of
specimens obtained with the use of the Bf method were 1.83 mm
(major) and 1.21 mm (minor). Since the cup size of the biopsy
forceps (Radial Jaw™ 4 Standard Capacity) used in the present study
was ~2.36 × 1.83 mm, the size of the Bf specimens was slightly
smaller than expected from the caliber of the devices.
Histological analysis of the acquired
tissue samples
Regarding the assessment of the mitotic count/50 HPF
and Ki-67 index, the evaluable rate of the FNA samples was 75%
(9/12), which was lower than the 100% observed with both TBB
(17/17) and Bf (14/14). Three samples in the FNA group were judged
unevaluable since they were too small. Accordingly, although these
samples were diagnosed definitively as GISTs by IH staining, they
could not be given a risk classification of GIST. This finding
suggested that the FNA samples had some limitations in diagnosing
the risk classification of GIST.
Notably, two samples obtained by FNA, one sample
obtained by TBB, and one sample obtained by Bf had discrepancies
between pre- and post-operative histological findings regarding the
mitotic count/50 HPF and the Ki-67 index. This finding demonstrated
that cell proliferation of GISTs could be expressed differently at
each site within the tumor. Therefore, we must recognize that
pre-operative diagnosis by tissue sampling methods with regard to
GIST risk classification may be rarely discordant with the final
definitive diagnosis.
Appropriate tissue amounts for
histological analysis
Comparing ‘Successful Samples’ with ‘Unsuccessful
Samples’, we calculated the cut-off value for the overlay area of
OPS as 0.17 mm2, suggesting the appropriate amount of
OPS needed for IH diagnosis, cell count and Ki-67. The mean overlay
areas of OPS acquired by TBB and Bf were 4.86 and 1.48
mm2. Consequently, the cut-off value revealed that the
amounts of tissue acquired by Bf can be sufficient for the
assessment of mitotic count and Ki-67 without the need for the
amounts of tissue obtained by TBB.
Strengths and limitations of each
sampling method
Although EUS-FNA, which has the advantages of being
rapid and convenient, has emerged as a standard method, appropriate
tissue samples can occasionally not be acquired due to too little
material and technical issues. The first prospective study of the
diagnostic yield of EUS-FNA with a commercially available needle in
patients with gastric SETs was reported in 2009 (20). However, the diagnostic yield of
EUS-FNA was not satisfactory (63%; 31/49) since the tissue samples
obtained were too small to determine their mitotic indices
reliably. Diagnostic accuracy <60% has been reported by others
(21,22). Therefore, further developments in
needle devices and technical skills are required to minimize
sampling errors.
In contrast, a key advantage of TBB and Bf is its
use of a lateral approach with submucosal endoscopy with a mucosal
flap safety valve (SEMF), making it easy to create a platform that
provides an operative field and to manage hemostasis while
obtaining a core specimen of sufficient size (~5 mm) for IH
analysis under direct vision (23).
Owing to this technical advantage, TBB and Bf demonstrated higher
rates of overall diagnosis including cell counts and Ki-67 than
FNA. However, these methods have a limitation of indicating for
primarily intraluminal growing GISTs excluding extraluminal growing
GISTs. According to growth pattern of SETs, appropriate sampling
methods have to be introduced.
In conclusion, while the amounts of tissues obtained
by TBB and Bf are excessively unnecessary for the histological
assessment of the mitotic count and Ki-67 index, developments of
the FNA method are needed to minimize sample error. Considering the
technical aspects, as well as the size of specimens, could help to
guide therapeutic planning and improve the diagnostic yield for GI
subepithelial tumors.
Acknowledgements
The authors wish to thank the Departments of
Gastroenterology and Diagnostic Pathology of Kagawa University
Hospital for their contributions to the present study.
References
|
1
|
Hwang JH and Kimmey MB: The incidental
upper gastrointestinal subepithelial mass. Gastroenterology.
126:301–307. 2004. View Article : Google Scholar
|
|
2
|
Blay JY, Bonvalot S, Casali P, et al:
Consensus meeting for the management of gastrointestinal stromal
tumors. Report of the GIST Consensus Conference of 20–21 March
2004, under the auspices of ESMO. Ann Oncol. 16:566–578. 2005.
View Article : Google Scholar : PubMed/NCBI
|
|
3
|
Mori H, Kobara H, Kobayashi M, et al:
Establishment of pure NOTES procedure using a conventional flexible
endoscope: review of six cases of gastric gastrointestinal stromal
tumors. Endoscopy. 43:631–634. 2011. View Article : Google Scholar : PubMed/NCBI
|
|
4
|
Demetri GD, Benjamin RS, Blanke CD, et al:
NCCN Task Force report: management of patients with
gastrointestinal stromal tumor (GIST) - update of the NCCN clinical
practice guidelines. J Natl Compr Canc Netw. 5(Suppl 2): S1–S29.
2007.
|
|
5
|
National Comprehensive Cancer Network.
Clinical Practice Guidelines in Oncology for Soft Tissue Sarcoma
Version 2. National Comprehensive Cancer Network; Fort Washington,
PA: 2009
|
|
6
|
Casali PG, Jost L, Reichardt P, Schlemmer
M and Blay JY; ESMO Guidelines Working Group. Gastrointestinal
stromal tumours: ESMO clinical recommendations for diagnosis,
treatment and follow-up. Ann Oncol. 20(Suppl 4): S64–S67. 2009.
|
|
7
|
Blackstein ME, Blay JY, Corless C, et al:
Gastrointestinal stromal tumours: consensus statement on diagnosis
and treatment. Can J Gastroenterol. 20:157–163. 2006.PubMed/NCBI
|
|
8
|
Nishida T, Hirota S, Yanagisawa A, et al:
Clinical practice guidelines for gastrointestinal stromal tumor
(GIST) in Japan: English version. Int J Clin Oncol. 13:416–430.
2008. View Article : Google Scholar : PubMed/NCBI
|
|
9
|
Fletcher CD, Berman JJ, Corless C, et al:
Diagnosis of gastrointestinal stromal tumors: a consensus approach.
Hum Pathol. 33:459–465. 2002. View Article : Google Scholar : PubMed/NCBI
|
|
10
|
Stelow EB, Stanley MW, Mallery S, Lai R,
Linzie BM and Bardales RH: Endoscopic ultrasound-guided fine-needle
aspiration findings of gastrointestinal leiomyomas and
gastrointestinal stromal tumors. Am J Clin Pathol. 119:703–708.
2003. View Article : Google Scholar : PubMed/NCBI
|
|
11
|
Ando N, Goto H, Niwa Y, et al: The
diagnosis of GI stromal tumors with EUS-guided fine needle
aspiration with immunohistochemical analysis. Gastrointest Endosc.
55:37–43. 2002. View Article : Google Scholar : PubMed/NCBI
|
|
12
|
Sepe PS, Moparty B, Pitman MB, et al:
EUS-guided FNA for the diagnosis of GI stromal cell tumors:
sensitivity and cytologic yield. Gastrointest Endosc. 70:254–261.
2009. View Article : Google Scholar : PubMed/NCBI
|
|
13
|
Hoda KM, Rodriguez SA and Faigel DO:
EUS-guided sampling of suspected GI stromal tumors. Gastrointest
Endosc. 69:1218–1223. 2009. View Article : Google Scholar : PubMed/NCBI
|
|
14
|
Mekky MA, Yamao K, Sawaki A, et al:
Diagnostic utility of EUS-guided FNA in patients with gastric
submucosal tumors. Gastrointest Endosc. 71:913–919. 2010.
View Article : Google Scholar : PubMed/NCBI
|
|
15
|
Sumiyama K, Gostout CJ, Rajan E, et al:
Submucosal endoscopy with mucosal flap safety valve. Gastrointest
Endosc. 65:688–694. 2007. View Article : Google Scholar : PubMed/NCBI
|
|
16
|
Kobara H, Mori H, Fujihara S, et al: Bloc
biopsy by using submucosal endoscopy with a mucosal flap method for
gastric subepithelial tumor tissue sampling (with video).
Gastrointest Endosc. 77:141–145. 2013. View Article : Google Scholar
|
|
17
|
Lai R, Stanley MW, Bardales R, Linzie B
and Mallery S: Endoscopic ultrasound-guided pancreatic duct
aspiration: diagnostic yield and safety. Endoscopy. 34:715–720.
2002. View Article : Google Scholar : PubMed/NCBI
|
|
18
|
Miettinen M and Lasota J: Gastrointestinal
stromal tumors: pathology and prognosis at different sites. Semin
Diagn Pathol. 23:70–83. 2006. View Article : Google Scholar : PubMed/NCBI
|
|
19
|
Sakamoto H, Kitano M, Komaki T, et al:
Prospective comparative study of the EUS guided 25-gauge FNA needle
with the 19-gauge Trucut needle and 22-gauge FNA needle in patients
with solid pancreatic masses. J Gastroenterol Hepatol. 24:384–390.
2009. View Article : Google Scholar
|
|
20
|
Polkowski M, Gerke W, Jarosz D, et al:
Diagnostic yield and safety of endoscopic ultrasound-guided trucut
biopsy in patients with gastric submucosal tumors: a prospective
study. Endoscopy. 41:329–334. 2009. View Article : Google Scholar : PubMed/NCBI
|
|
21
|
Fu K, Eloubeidi MA, Jhala NC, Jhala D,
Chhieng DC and Eltoum IE: Diagnosis of gastrointestinal stromal
tumor by endoscopic ultrasound-guided fine needle aspiration biopsy
- a potential pitfall. Ann Diagn Pathol. 6:294–301. 2002.
View Article : Google Scholar : PubMed/NCBI
|
|
22
|
Fernández-Esparrach G, Sendino O, Solé M,
et al: Endoscopic ultrasound-guided fine-needle aspiration and
trucut biopsy in the diagnosis of gastric stromal tumors: a
randomized crossover study. Endoscopy. 42:292–299. 2010. View Article : Google Scholar : PubMed/NCBI
|
|
23
|
Kobara H, Mori H, Rafiq K, et al:
Submucosal tunneling techniques: current perspectives. Clin Exp
Gastroenterol. 7:67–74. 2014. View Article : Google Scholar : PubMed/NCBI
|