Introduction
Cancer cells exhibit an altered metabolism
characterized by high rates of glucose consumption and glycolysis
(1,2). Glucose-addicted cancer cells were
found to be very sensitive to glucose concentration levels. Glucose
deprivation may induce growth inhibition and death of cancer cells
(3–5). Enhanced glucose requirement of cancer
cells is associated with increased glucose transport across the
plasma membrane, which is mediated by a family of facilitated
glucose transporter proteins, known as glucose transporters (GLUTs)
(6–9). In mammals, 14 GLUTs have been
identified and each possesses a different affinity for glucose and
other hexoses (9,10). The results of recent studies have
demonstrated that the expression of glucose transporters,
particularly GLUT1, is increased in a variety of malignancies
including breast, endometrial, head and neck, salivary gland,
colorectal, gastric, lung and thyroid cancers (11–16).
The overexpression of GLUT1 is often associated with enhanced
invasive potential and poor prognosis. GLUT1 expression has also
been shown to correlate with the level of tumor hypoxia. Hypoxia
inducible factor (HIF) is responsible for the transcription
activation of a number of glycolytic genes as well as GLUT1
(17).
Results of epidemiological studies indicate that
obesity and diabetes are associated with an increased risk of
several types of cancer, including colonic, esophageal, gastric,
liver, pancreatic, kidney, endometrial, breast, and bladder cancer
(18–23). Chronic high blood glucose level
seems to be a key factor of cancer progression (24). However, whether diabetes or
hyperglycemia increases the risk of thyroid cancer has not been
extensively studied. The relationship between chronic high glucose
level and thyroid cancer are not fully elucidated and the results
of available studies are controversial (25).
The aim of the present study was to investigate the
relationship between the expression of GLUT1 and glucose uptake as
well as viability of thyroid cancer cells growing in hypoglycemia,
normoglycemia and hyperglycemia conditions.
Materials and methods
Reagents and antibodies
Chemicals were obtained from Sigma-Aldrich (St.
Louis, MO, USA) except as noted. Cell culture reagents and
materials were purchased from Invitrogen (Carlsbad, CA, USA),
Cytogen (Sinn, Germany) and Corning Inc. (Corning, NY, USA). The
antibodies from Santa Cruz Biotechnology, Inc., (Santa Cruz, CA,
USA) used were: mouse monoclonal anti-GLUT3, rabbit polyclonal
anti-HIF1α, mouse monoclonal anti-β-actin, goat polyclonal
anti-rabbit IgG-HRP and goat polyclonal anti-mouse IgG-HRP. The
polyclonal rabbit anti-GLUT1 antibodies were from Abcam (Cambridge,
UK). Mouse monoclonal anti-AKT1 and rabbit polyclonal
anti-phospho-AKT1 (Ser473) were from Cell Signaling Technology,
Inc. (Beverly, MA, USA).
Cell culture and treatment
FTC-133 (follicular) and 8305c (anaplastic) thyroid
cancer cells were obtained from the European Collection of Cell
Cultures (ECACC) (Wiltshire, UK). The cells were grown in
Dulbecco’s minimal essential medium (DMEM) supplemented with 2 mM
glutamine and 10% fetal bovine serum (FBS) in a humidified
atmosphere containing 5% CO2 at 37°C. Hypoxic treatment
conditions were based on normal oxygen conditions with the chemical
hypoxic agent cobalt chloride (CoCl2) being added to the
medium. CoCl2 was used at a final concentration of 100
μM. To assess the impact of hypoglycemia, normoglycemia and
hyperglycemia on cell viability and glucose uptake cells were grown
for 48 h in medium containing 2, 5 or 25 mM glucose,
respectively.
Silencing of GLUT1
For reduction of GLUT1 expression Silencer Select
siRNA was used (ID: s12926; Ambion Life Technologies, Carlsbad, CA,
USA). In the negative control experiments scrambled non-silencing
siRNA was used (Silencer Select Negative Control no. 1; Ambion,
Life Technologies, Carlsbad, CA, USA). Transfections were carried
out using Lipofectamine™ RNAiMAX (Invitrogen) following the
manufacturer’s instructions. The cells were treated with 30 nM of
siRNAs, and the effect of interference was assessed after 48 or 72
h. Cell lysates were collected and reverse transcription PCR
(RT-PCR) and western blotting were performed to assess the
effectiveness of RNAi.
RT-PCR
RNA was isolated from the FTC-133 and 8305c cells
using the total RNA isolation kit (A&A Biotechnology, Gdynia,
Poland) according to the manufacturer’s instructions. First-strand
cDNAs were obtained by the reverse transcription of 1 μg of total
RNA using a High-Capacity cDNA Reverse Transcription kit (Applied
Biosystems, Foster City, CA, USA) following the manufacturer’s
instructions. Real-time amplification of the cDNA was performed
using a TaqMan® Gene Expression Assay (Applied
Biosystems). The fluorogenic, FAM-labeled probes and the
sequence-specific primers for SLC2A1 (gene coding GLUT1) and
the internal control glyceraldehyde-3-phosphate dehydrogenase
(GAPDH) were obtained as inventoried assays (Hs00982681 and
Hs99999905, respectively). GLUT mRNA levels normalized to GAPDH
mRNA levels were calculated using the formula: 2−ΔCt,
where ΔCt = CtGLUT1 − CtGAPDH. Relative
amounts of mRNA in GLUT1 siRNA-treated cells are indicated as a
percentage of the amount of mRNA in control cells.
Isolation of the plasma membrane
proteins
Surface proteins were isolated from cells by
affinity chromatography on streptavidin-agarose after plasma
membrane protein biotinylation.
The cells grown on the 100-mm Petri dishes were
washed twice with ice-cold phosphate-buffered saline (PBS) and
incubated with 250 μg/ml
N-hydroxysucinimide-long-chain-biotin (NHS-LC-biotin; Thermo
Scientific, Waltham, MA, USA) in PBS for 1 h at 4°C. To stop the
biotinylation, monolayers were rinsed three times with ice-cold PBS
containing 15 mM glycine. The cells were then scraped on ice in
PBS, the number of cells were counted and the same amount of cells
(107) was added to each tube and centrifuged at 200 × g
for 5 min. Cell pellets were lysed with RIPA buffer (0.15 M NaCl,
50 mM HEPES pH 7.1, 1% Triton X-100, 0.5% DOC, 0.1% SDS, 10 mM
EDTA, 2 mM PMSF) and centrifuged at 9,000 × g for 3 min. The
supernatants were transferred to new vials with 100 μl
streptavidin-agarose beads (Sigma-Aldrich, St. Louis, MO, USA) and
gently mixed overnight at 4°C. After centrifugation, the
supernatants were removed, the beads were washed five times with 1
ml 0.15 M NaCl, 10 mM Tris-HCl pH 7.0 containing 2 mM PMSF, and
once again with PBS. The final pellet was resuspended in 200 μl
Laemmli’s buffer (1.2-fold concentration without mercaptoethanol)
and incubated for 30 min at 65°C. The supernatants containing
solubilized cell surface proteins were separated from the beads by
centrifugation, collected and run on SDS-PAGE.
Western blotting
Proteins of the cell lysates and cell surface
protein samples were resolved by 10% SDS-PAGE and electroblotted
onto Immobilon-P transfer membranes. The blots were incubated with
primary antibodies for 2 h in room temperature. After washing three
times with Tris-buffered saline (TBS) the blots were incubated for
1 h with goat anti-mouse or anti-rabbit secondary antibodies
conjugated with horseradish peroxidase. Proteins were visualized on
X-ray film by an enhanced chemiluminescence method. For loading
control, the blots were reprobed with anti-β-actin antibody
following a stripping protocol. Gel-Pro Analyzer software version
3.0 (Media Cybernetics, Inc., Bethesda, MD, USA) was used for the
densitometric analysis of the protein bands.
Cell viability assay
Cell viability was assessed using the MTT assay.
Cells were plated in 96-well plates at a density of 10,000 or
15,000 for FTC-133 and 8305c, respectively and cultivated for 24 h
in standard conditions. The medium was replaced with a new medium
and the cells were appropriately treated with different glucose
concentrations, CoCl2 and siRNA. Twenty microliters of
0.05% [3-(4,5-dimethylthiazol-2-yl)-2,5 diphenyltetrazolium bromide
MTT] (Sigma) in PBS was added to each well and the cells were
incubated for 3 h in 37°C. The medium was then removed and 50 μl of
DMSO was added. Absorbance of the formazan product was measured at
590 nm by a microtiter plate reader (Bio-Rad, Hercules, CA, USA)
with a blank (medium alone) as the background control.
2-NBDG assay
To analyze glucose uptake the fluorescent glucose
analog, 2-(N-[7-nitrobenz-2-oxa-1,3-diazol-4-yl]
amino)-2-deoxyglucose (2-NBDG), which allows for direct
quantification of glucose incorporation in living cells by flow
cytometry, was used (26). Cells
grown for 48 h in medium containing 2, 5 or 25 mM glucose were
washed with Dulbecco’s phosphate-buffered saline (DPBS) and medium
containing 0.25 mM glucose and 300 μM 2-NBDG was added. After 40
min incubation the cells were washed twice with DPBS, trypsinized,
centrifuged and resuspended in DPBS. In the flow cytometer, optical
filters were set up such that 2-NBDG was measured using the green
fluorescence (520 nm) channel FL1. The results were collected as
the median fluorescent signal from a population of 104
cells.
Statistical analysis
Experimental data are presented as the means ± SD.
For comparison of groups, the Student’s t-test was used. P<0.05
was considered to indicate a statistically significant result.
Results
Glucose-dependent HIF1α and GLUT1
expression in normoxic and hypoxic conditions
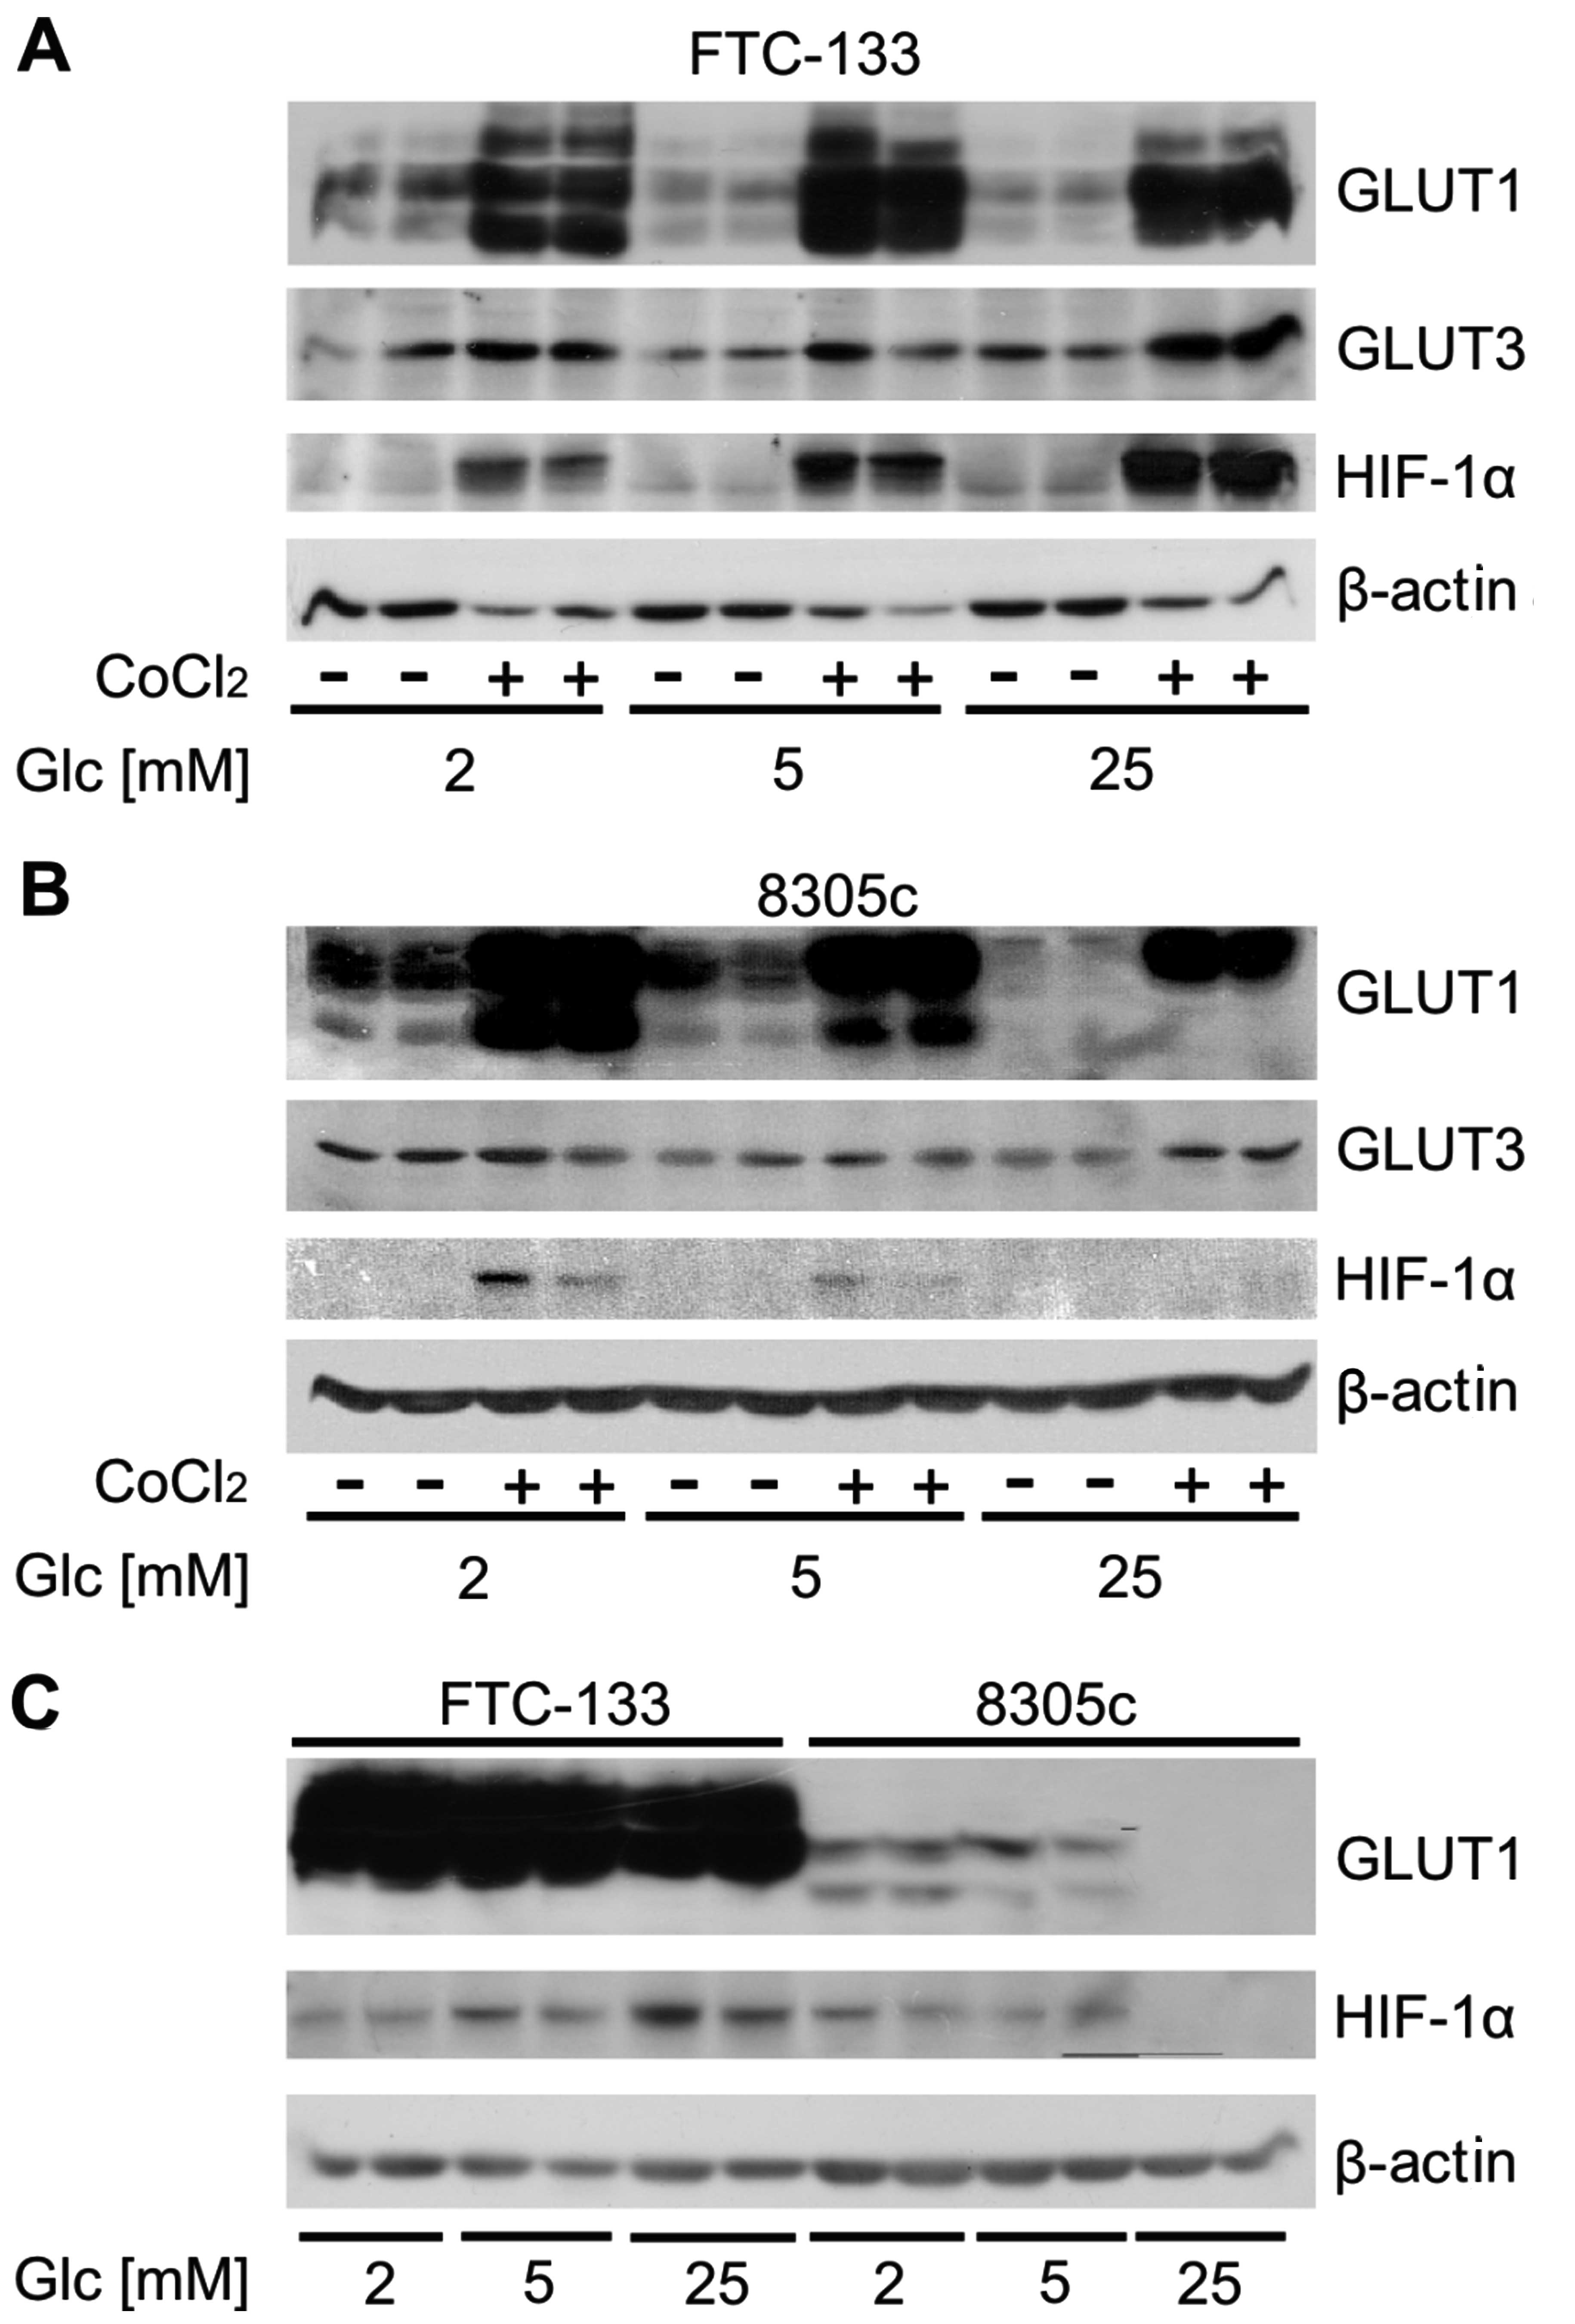
To determine whether the glucose concentration
affected the level of GLUT1 expression FTC-133 and 8503c cells were
grown for 48 h in medium containing 2, 5 or 25 mM glucose,
resembling hypoglycemic, normoglycemic and hyperglycemic
conditions. The cells were or were not treated for 48 h with 100 μM
cobalt chloride to induce hypoxic conditions. In cell lysates the
expression of GLUT1, GLUT3 and HIF1α were analyzed by western
blotting (Fig. 1A and B). The
results showed that the total GLUT1 expression in the two cell
types was higher than that in GLUT3. Numerous immunoreactive bands
were present in GLUT1 immunoblot analysis due to glycosylation of
GLUT1. For FTC-133 the expression of HIF1α was much higher in cells
treated with cobalt chloride compared to cells growing under
normoxic conditions. A significant increase in the level of this
protein under normoxic and hypoxic conditions with the increasing
glucose concentration was observed. GLUT1 expression was also
higher in cells incubated with cobalt chloride compared to cells in
normoxia. However, the expression of this protein did not exhibit a
positive correlation with glucose concentration. GLUT3 expression
was higher in cells treated with 25 mM glucose compared to cells
grown in hypoglycemia or normoglycemia. HIF1α expression in 8305c
cells under normoxic conditions was undetectable. The cobalt
chloride treatment caused an increase in the expression of this
protein, however, in contrast to FTC-133 cells, the expression was
inversely correlated with glucose concentration. The expression of
GLUT1 also decreased with the increasing glucose concentration in
the media. No difference in the expression of GLUT3 was
detected.
The cell lines used in the present study showed
significant differences in the level of total GLUT1 expression,
which is particularly evident in the hypoxic conditions. FTC-133
showed a much higher expression of GLUT1 than that in 8305c cells
(Fig. 1C).
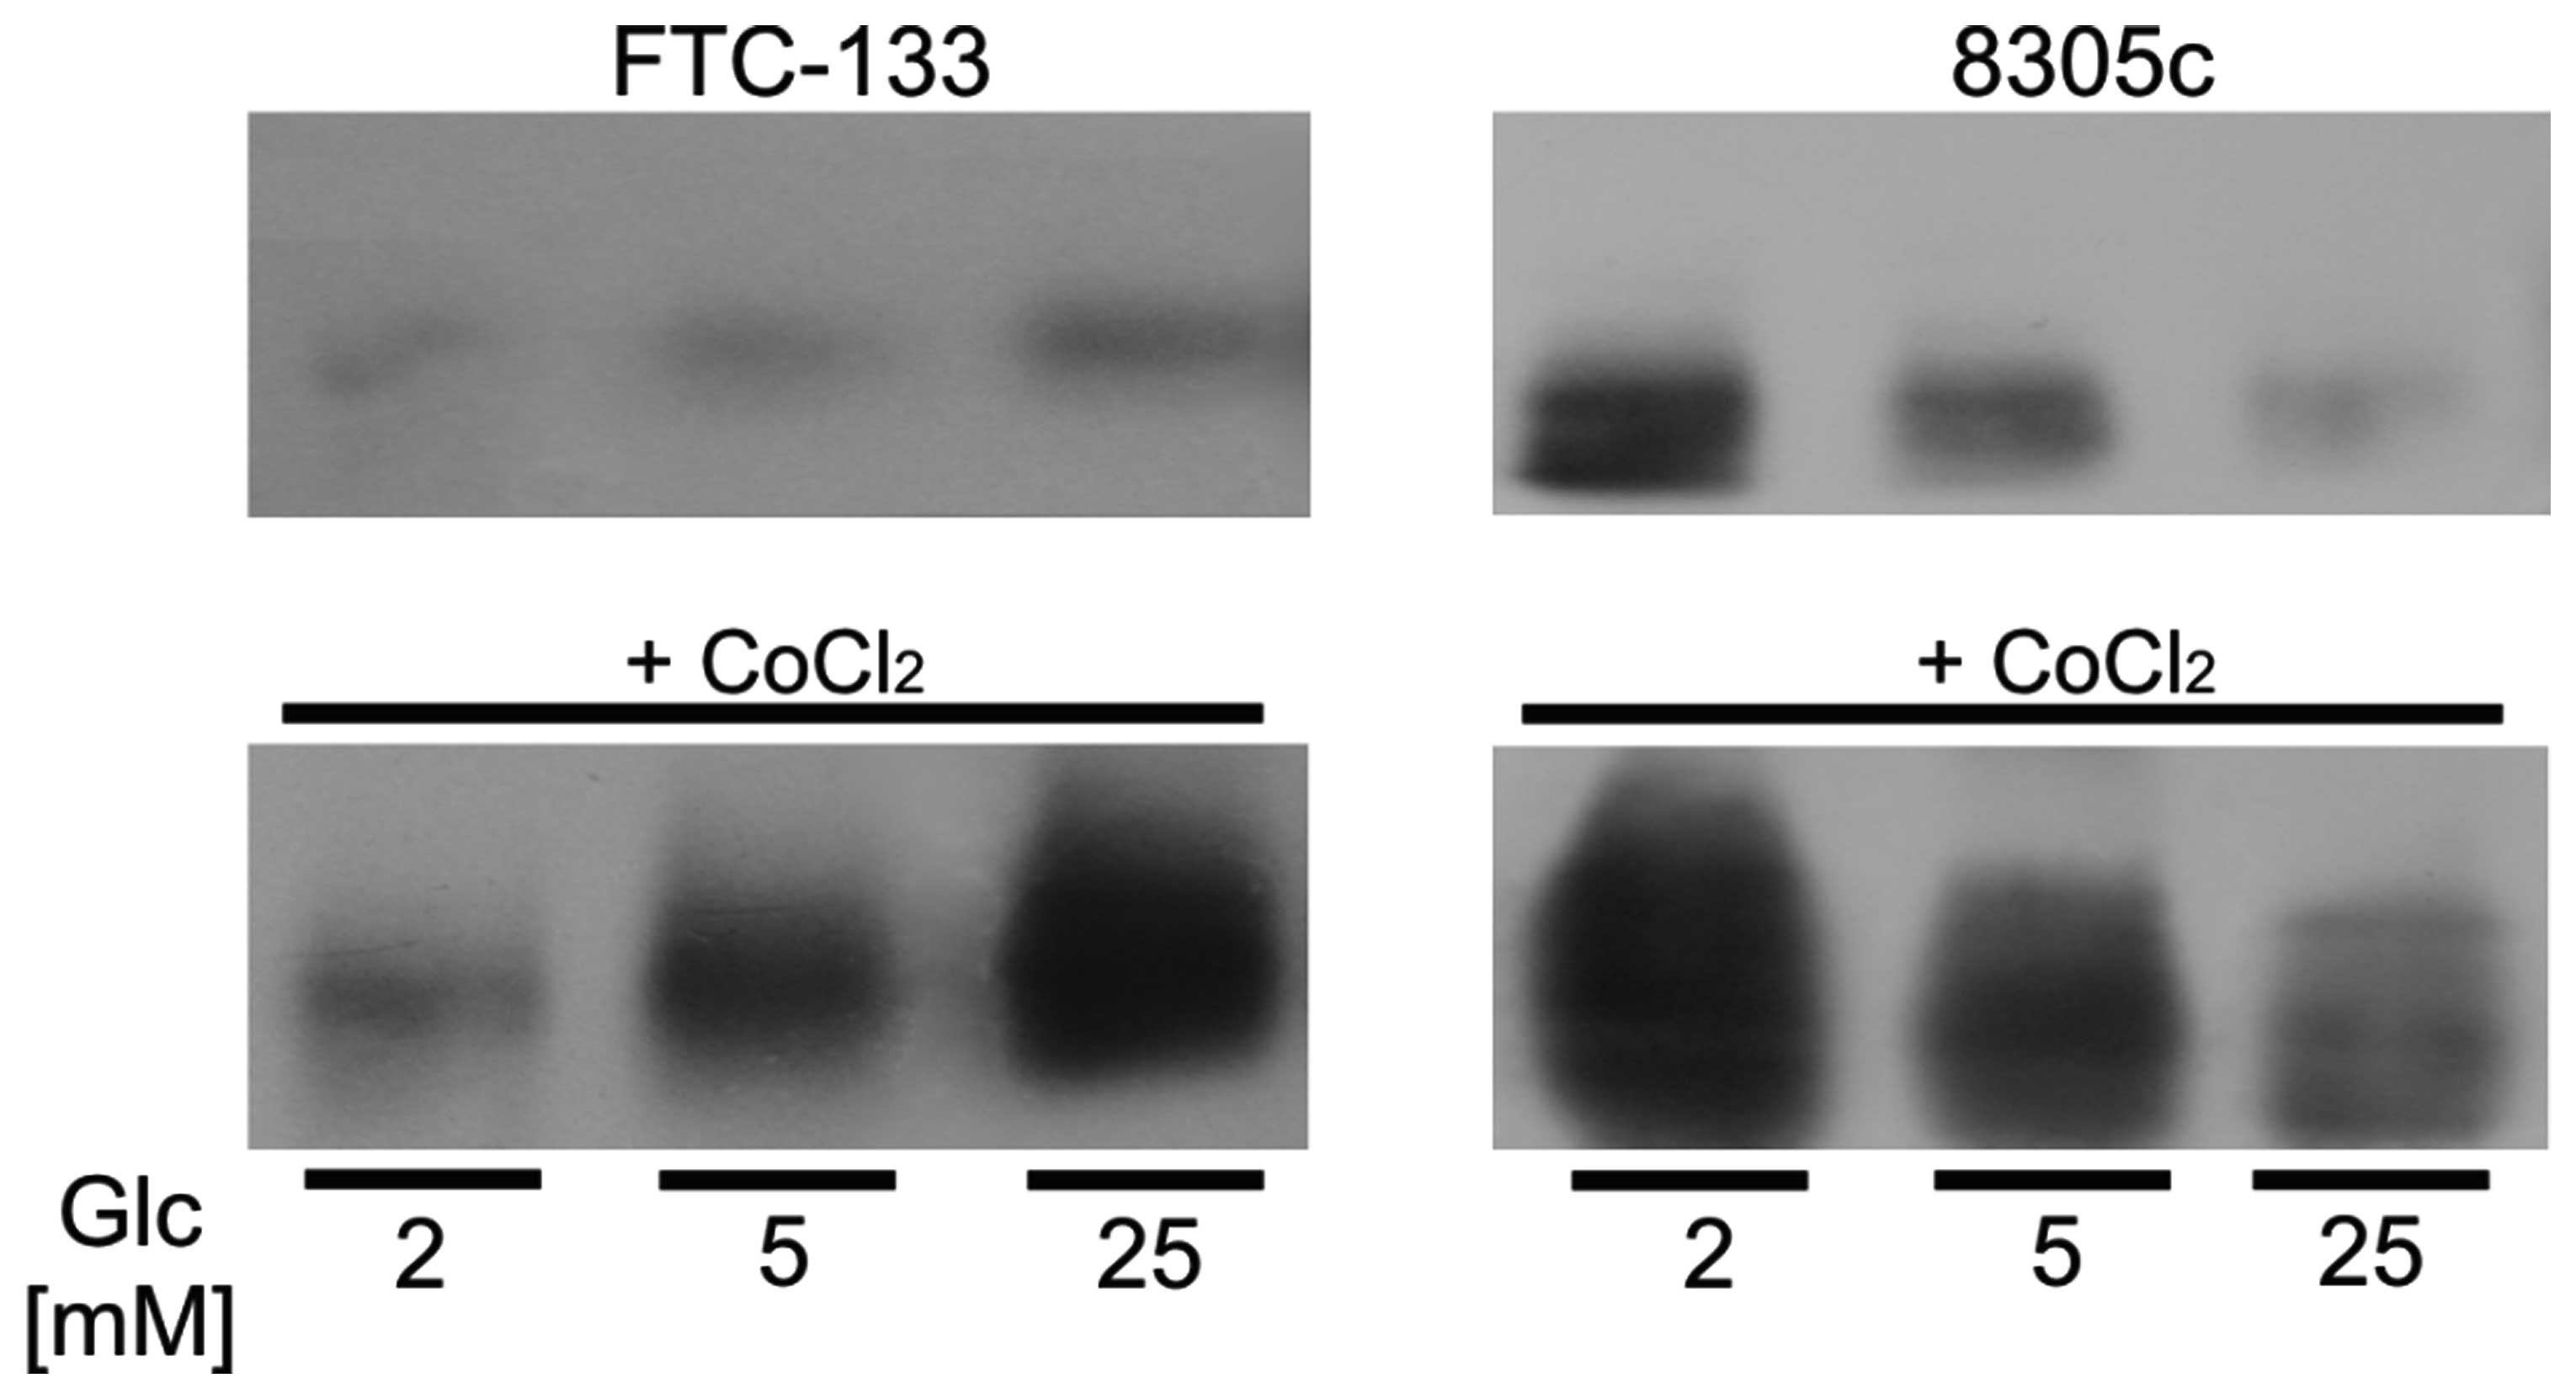
To estimate the plasma membrane level of GLUT1 the
surface protein fractions of cells treated with different glucose
concentration for 48 h were isolated. Western blot analyses showed
that in FTC-133 cells plasma membrane GLUT1 expression increased
with the increasing glucose concentration. The opposite results
were obtained for 8305c cells, in which GLUT1 level in plasma
membrane decreased with the increasing glucose level (Fig. 2). The plasma membrane expression
levels of GLUT1 in the two cell types were correlated with the
expression of HIF1α.
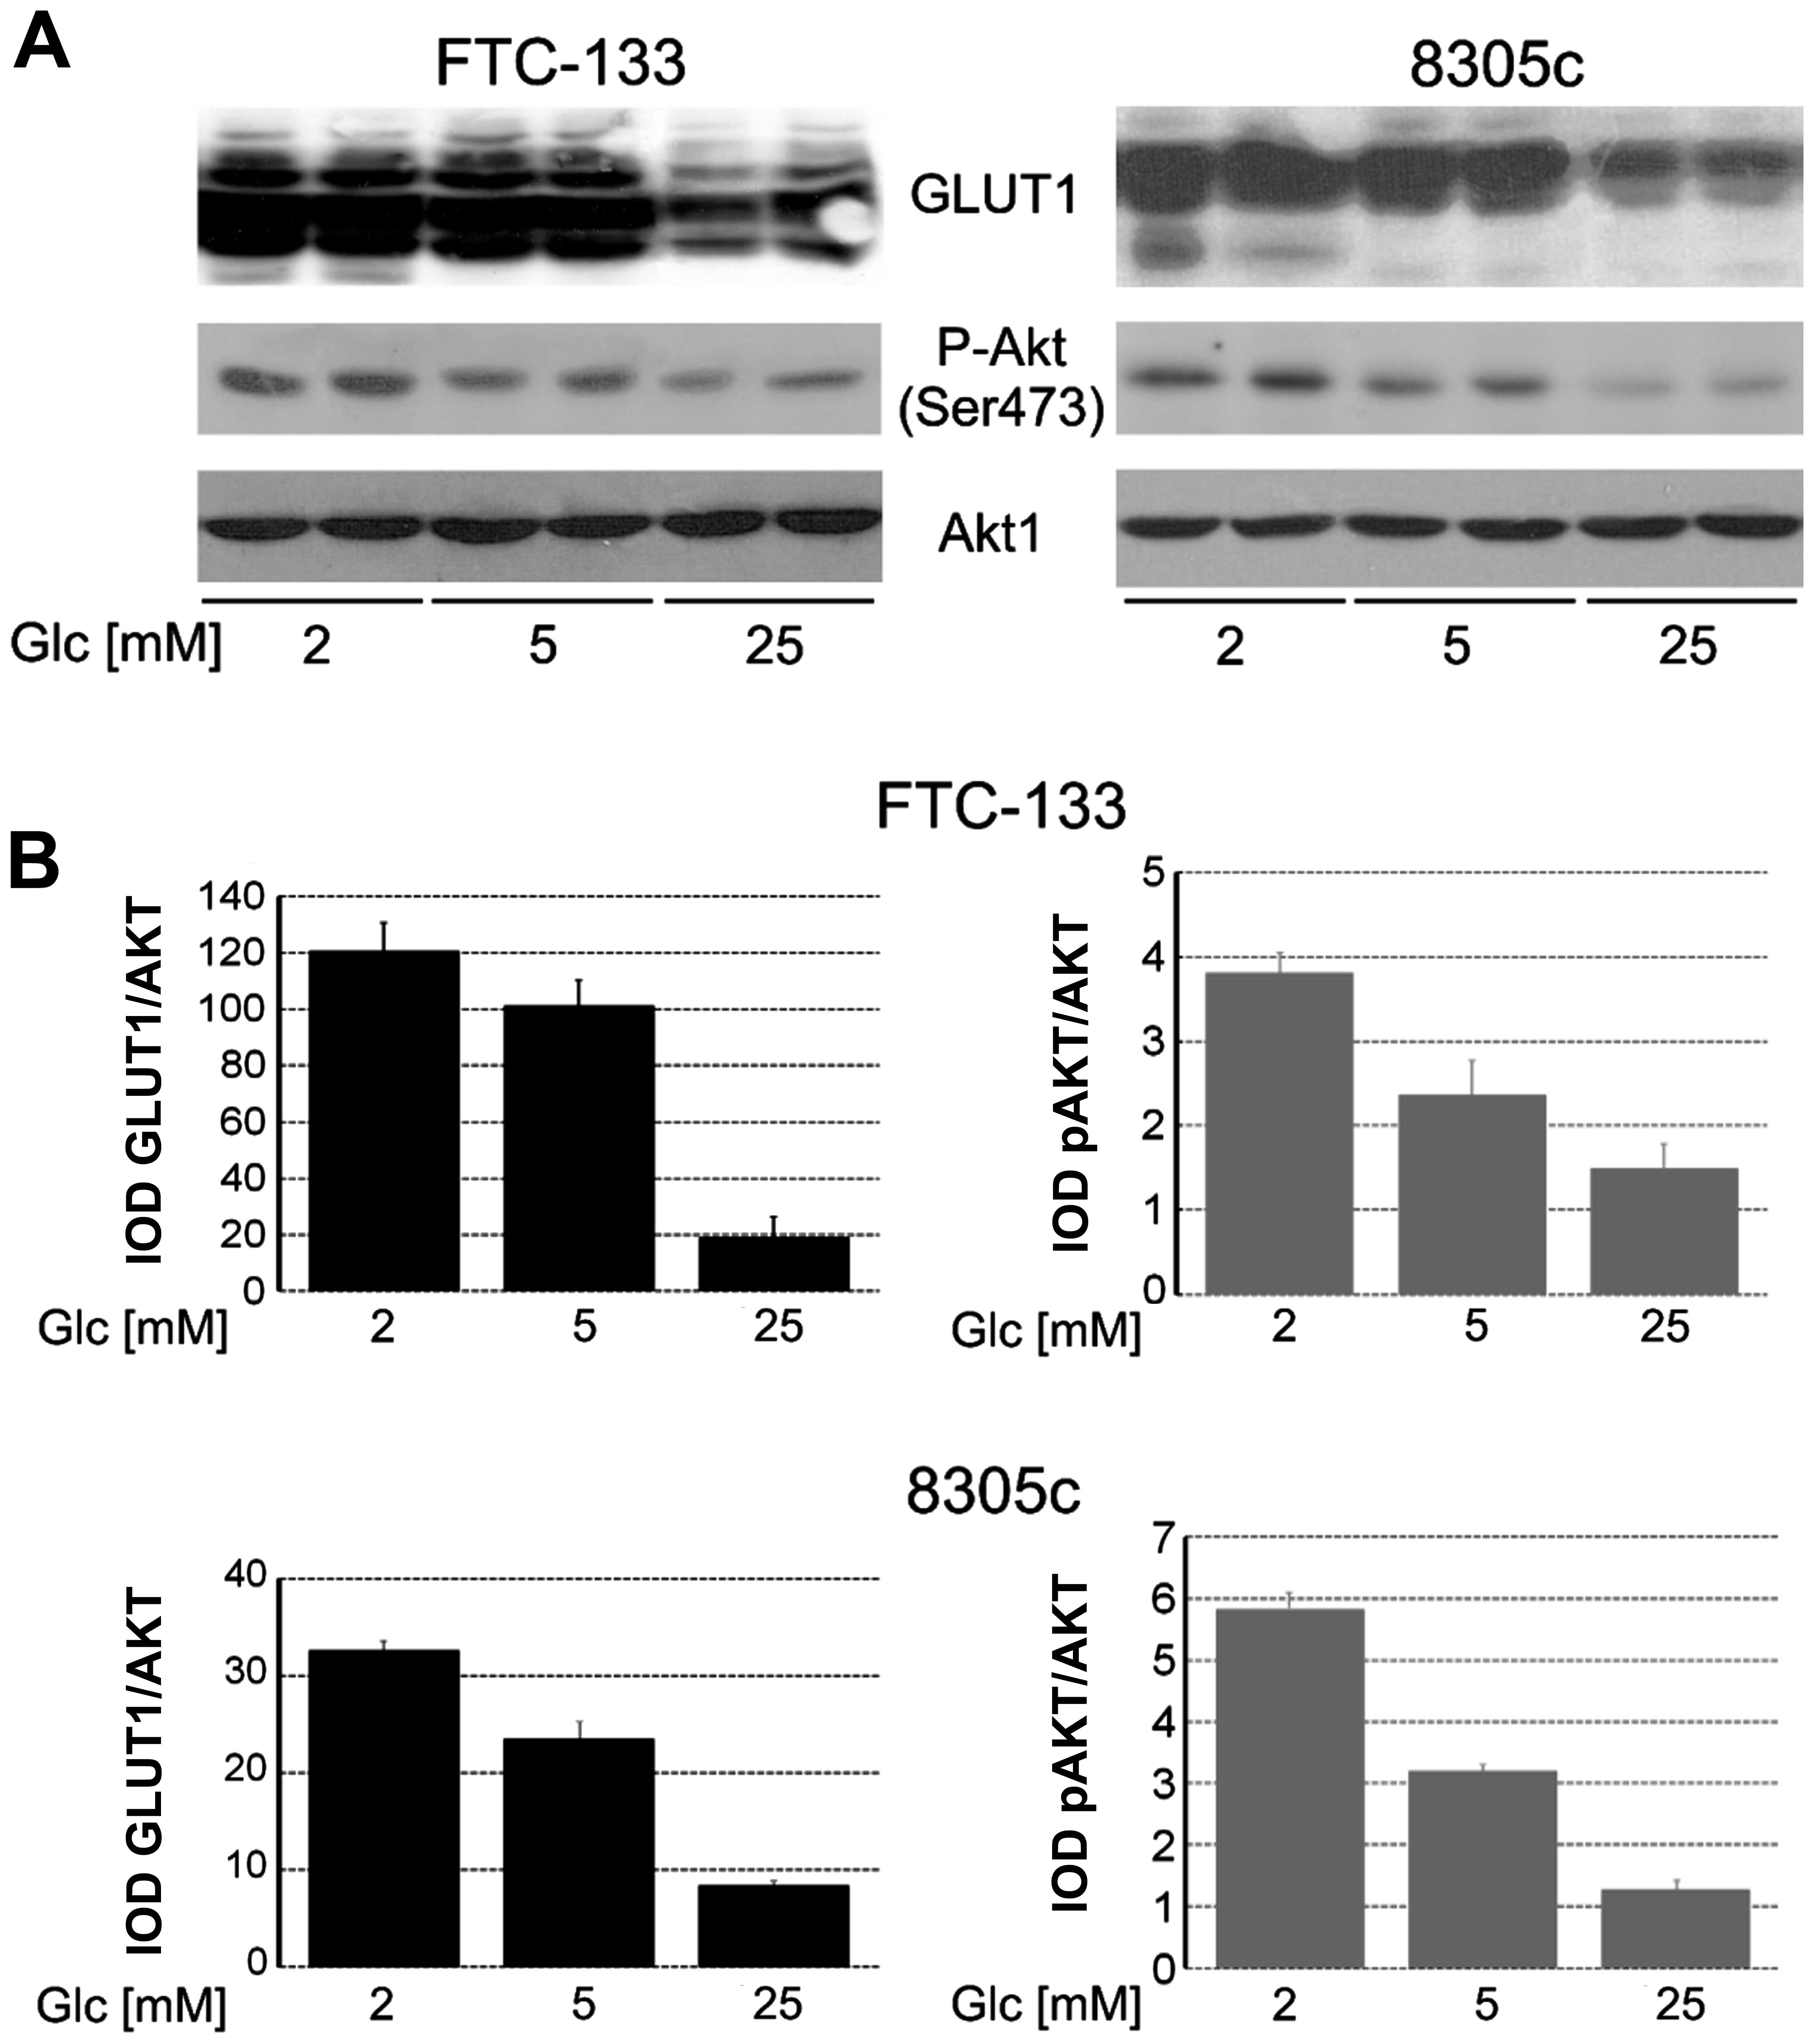
Glucose-dependent changes in AKT1
phosphorylation
In cells growing in hypoglycemia, normoglycemia and
hyperglycemia for 48 h, the expression and phosphorylation of AKT1
were analyzed (Fig. 3). The results
showed that in FTC-133 and 8305c, AKT1 expression was unchanged in
all the glucose conditions but phosphorylation of Ser473 was higher
in cells growing in low-glucose medium compared to cells in
hyperglycemia. Glucose-dependent changes in AKT1 phosphorylation
were correlated with total GLUT1 expression.
Impact of glucose concentration in medium
on cell viability and glucose analog uptake
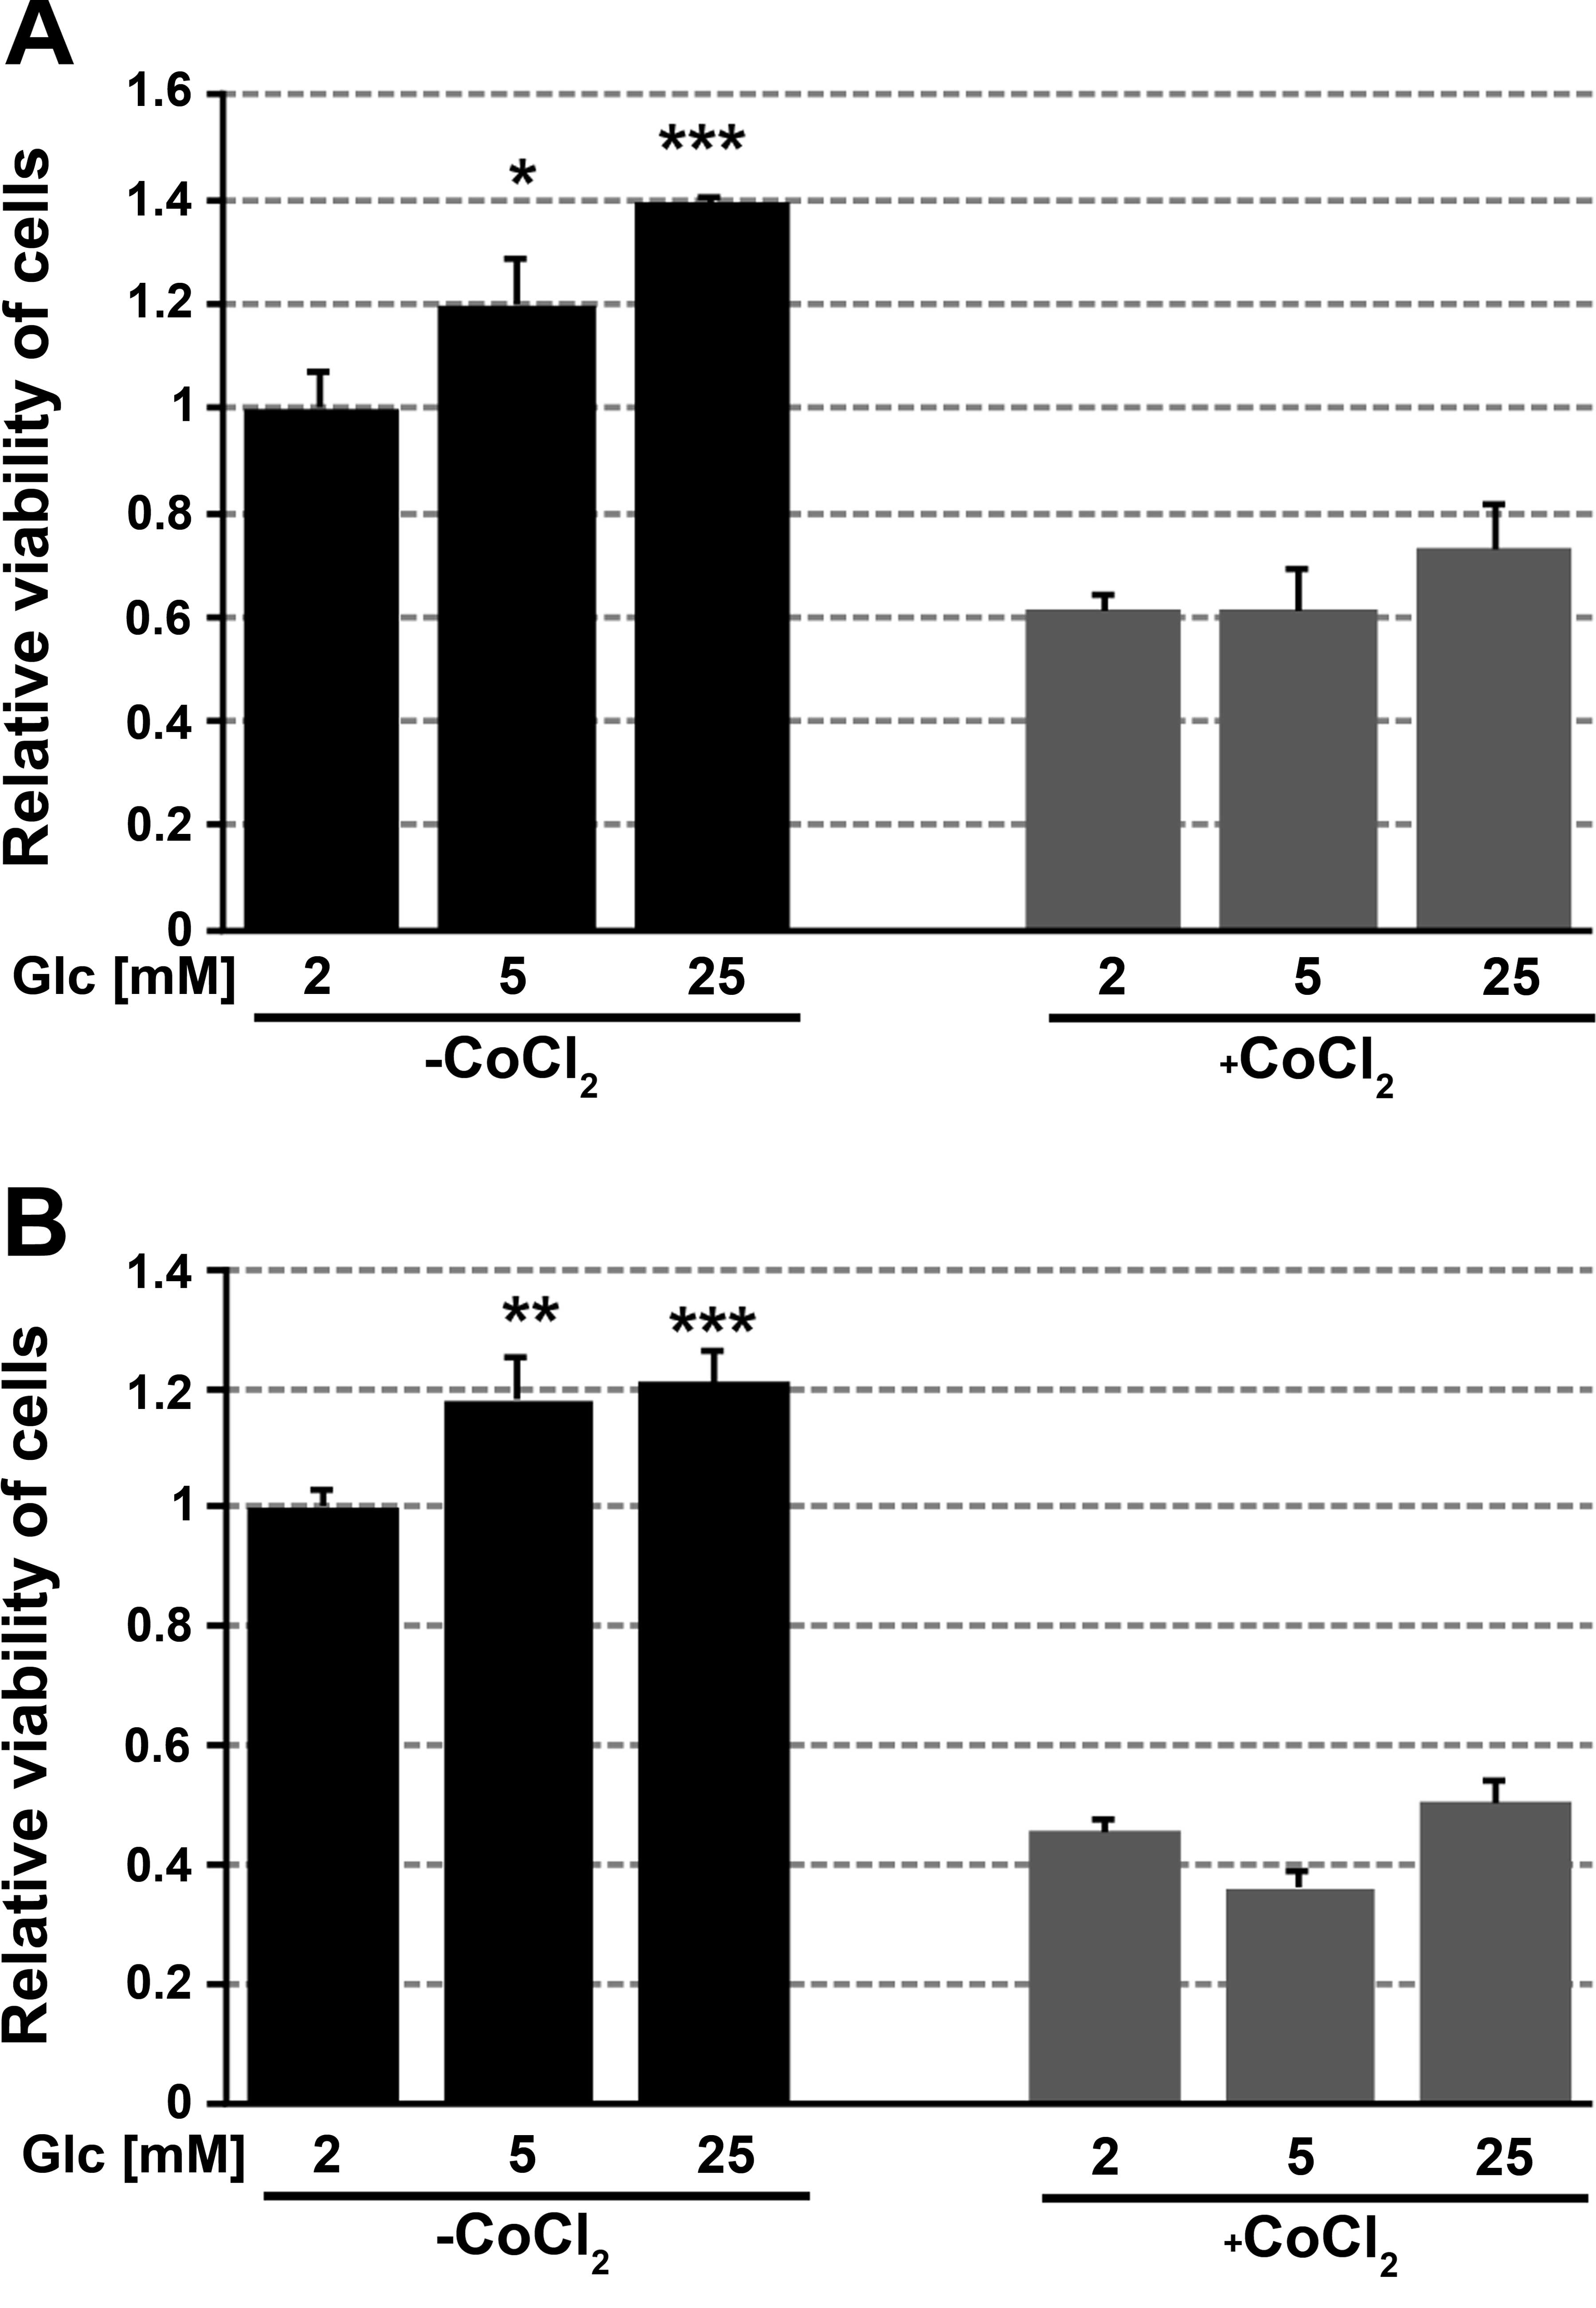
Viability of cells growing for 48 h in medium
containing 2, 5 or 25 mM glucose in normoxia or hypoxia was
assessed using the MTT assay. The viability of cells growing in
chemically induced hypoxia, i.e., in medium containing cobalt
chloride was significantly lower compared with cells growing in
normoxia. For FTC-133 and 8305c cells growing in normoxia, the
increase in viability (20–40%) was correlated with an increase in
glucose concentration. There was no impact of glucose concentration
on the viability of cells growing in hypoxic conditions (Fig. 4).
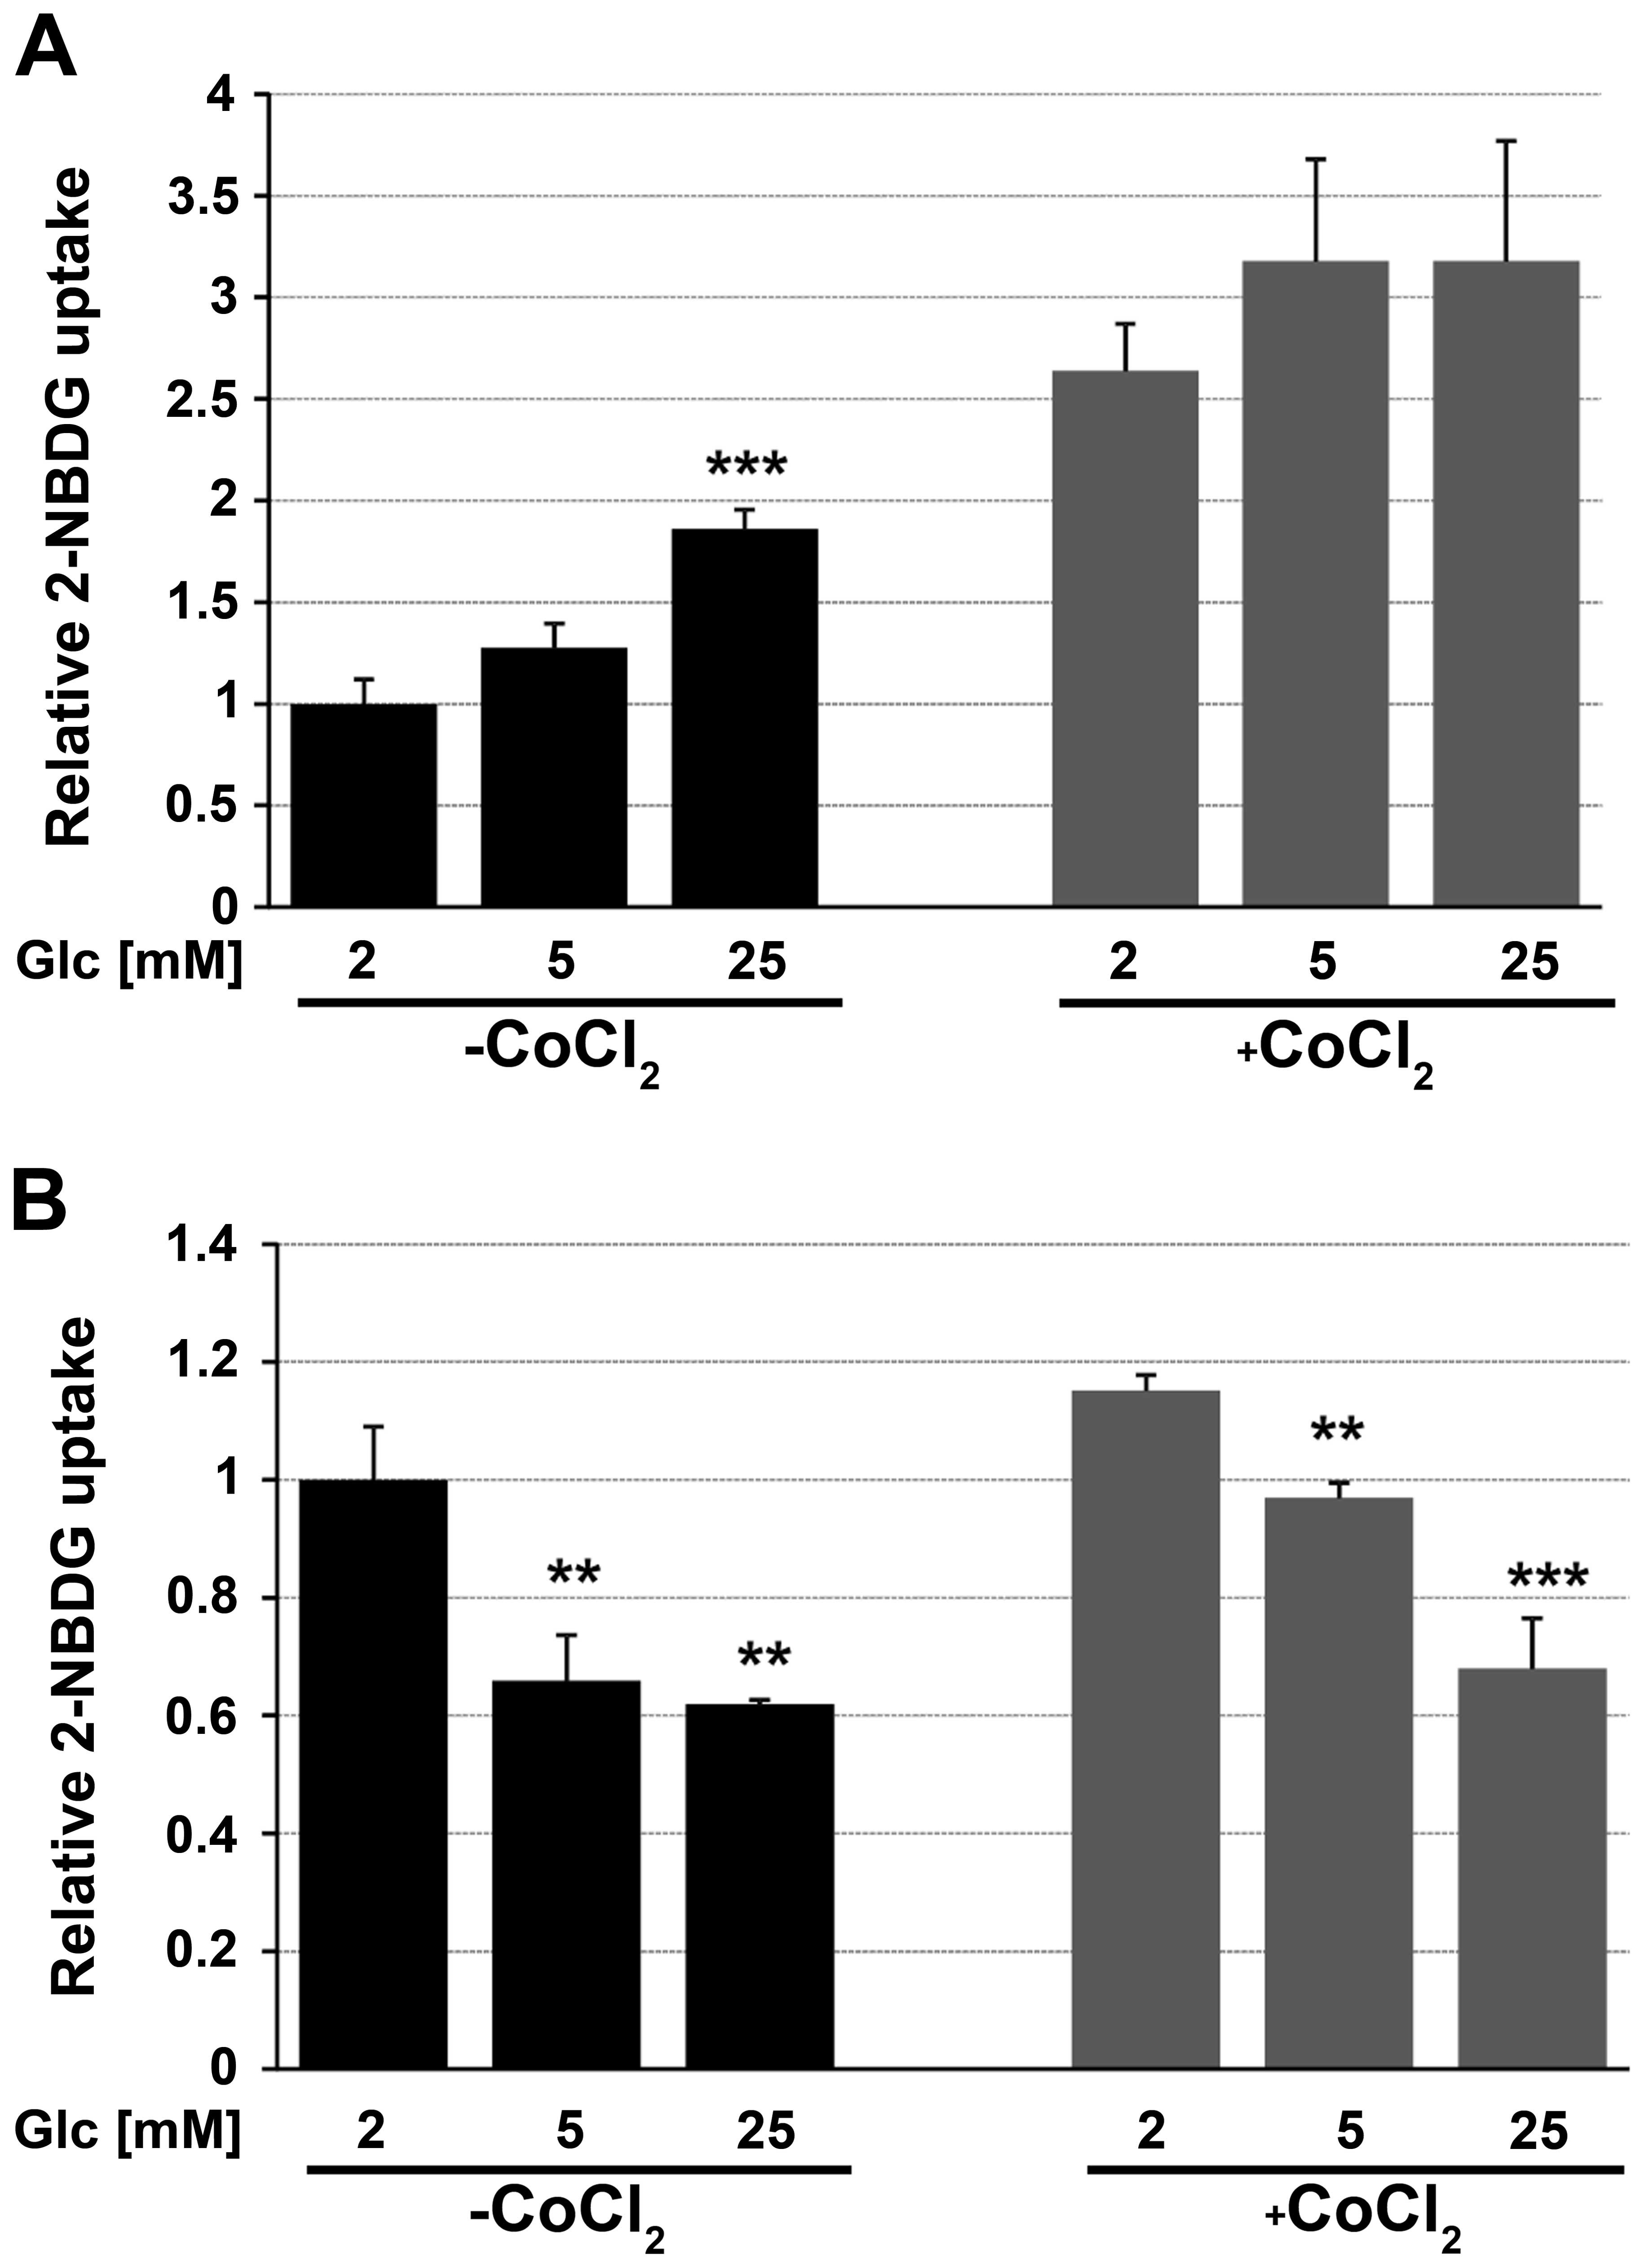
The 2-NBDG uptake of cells growing in hypoglycemia,
normoglycemia and hyperglycemia for 48 h was quantified by flow
cytometry (Fig. 5). FTC-133 cells
growing in hyperglycemic conditions showed greater 2-NBDG uptake
level than cells growing in medium with low-glucose concentration.
The opposite results were obtained for 8305c cells. A significant
decrease in the glucose uptake level was observed in cells growing
in high glucose compared to ones in low glucose.
Impact of GLUT1 downregulation on cell
viability and glucose analog uptake
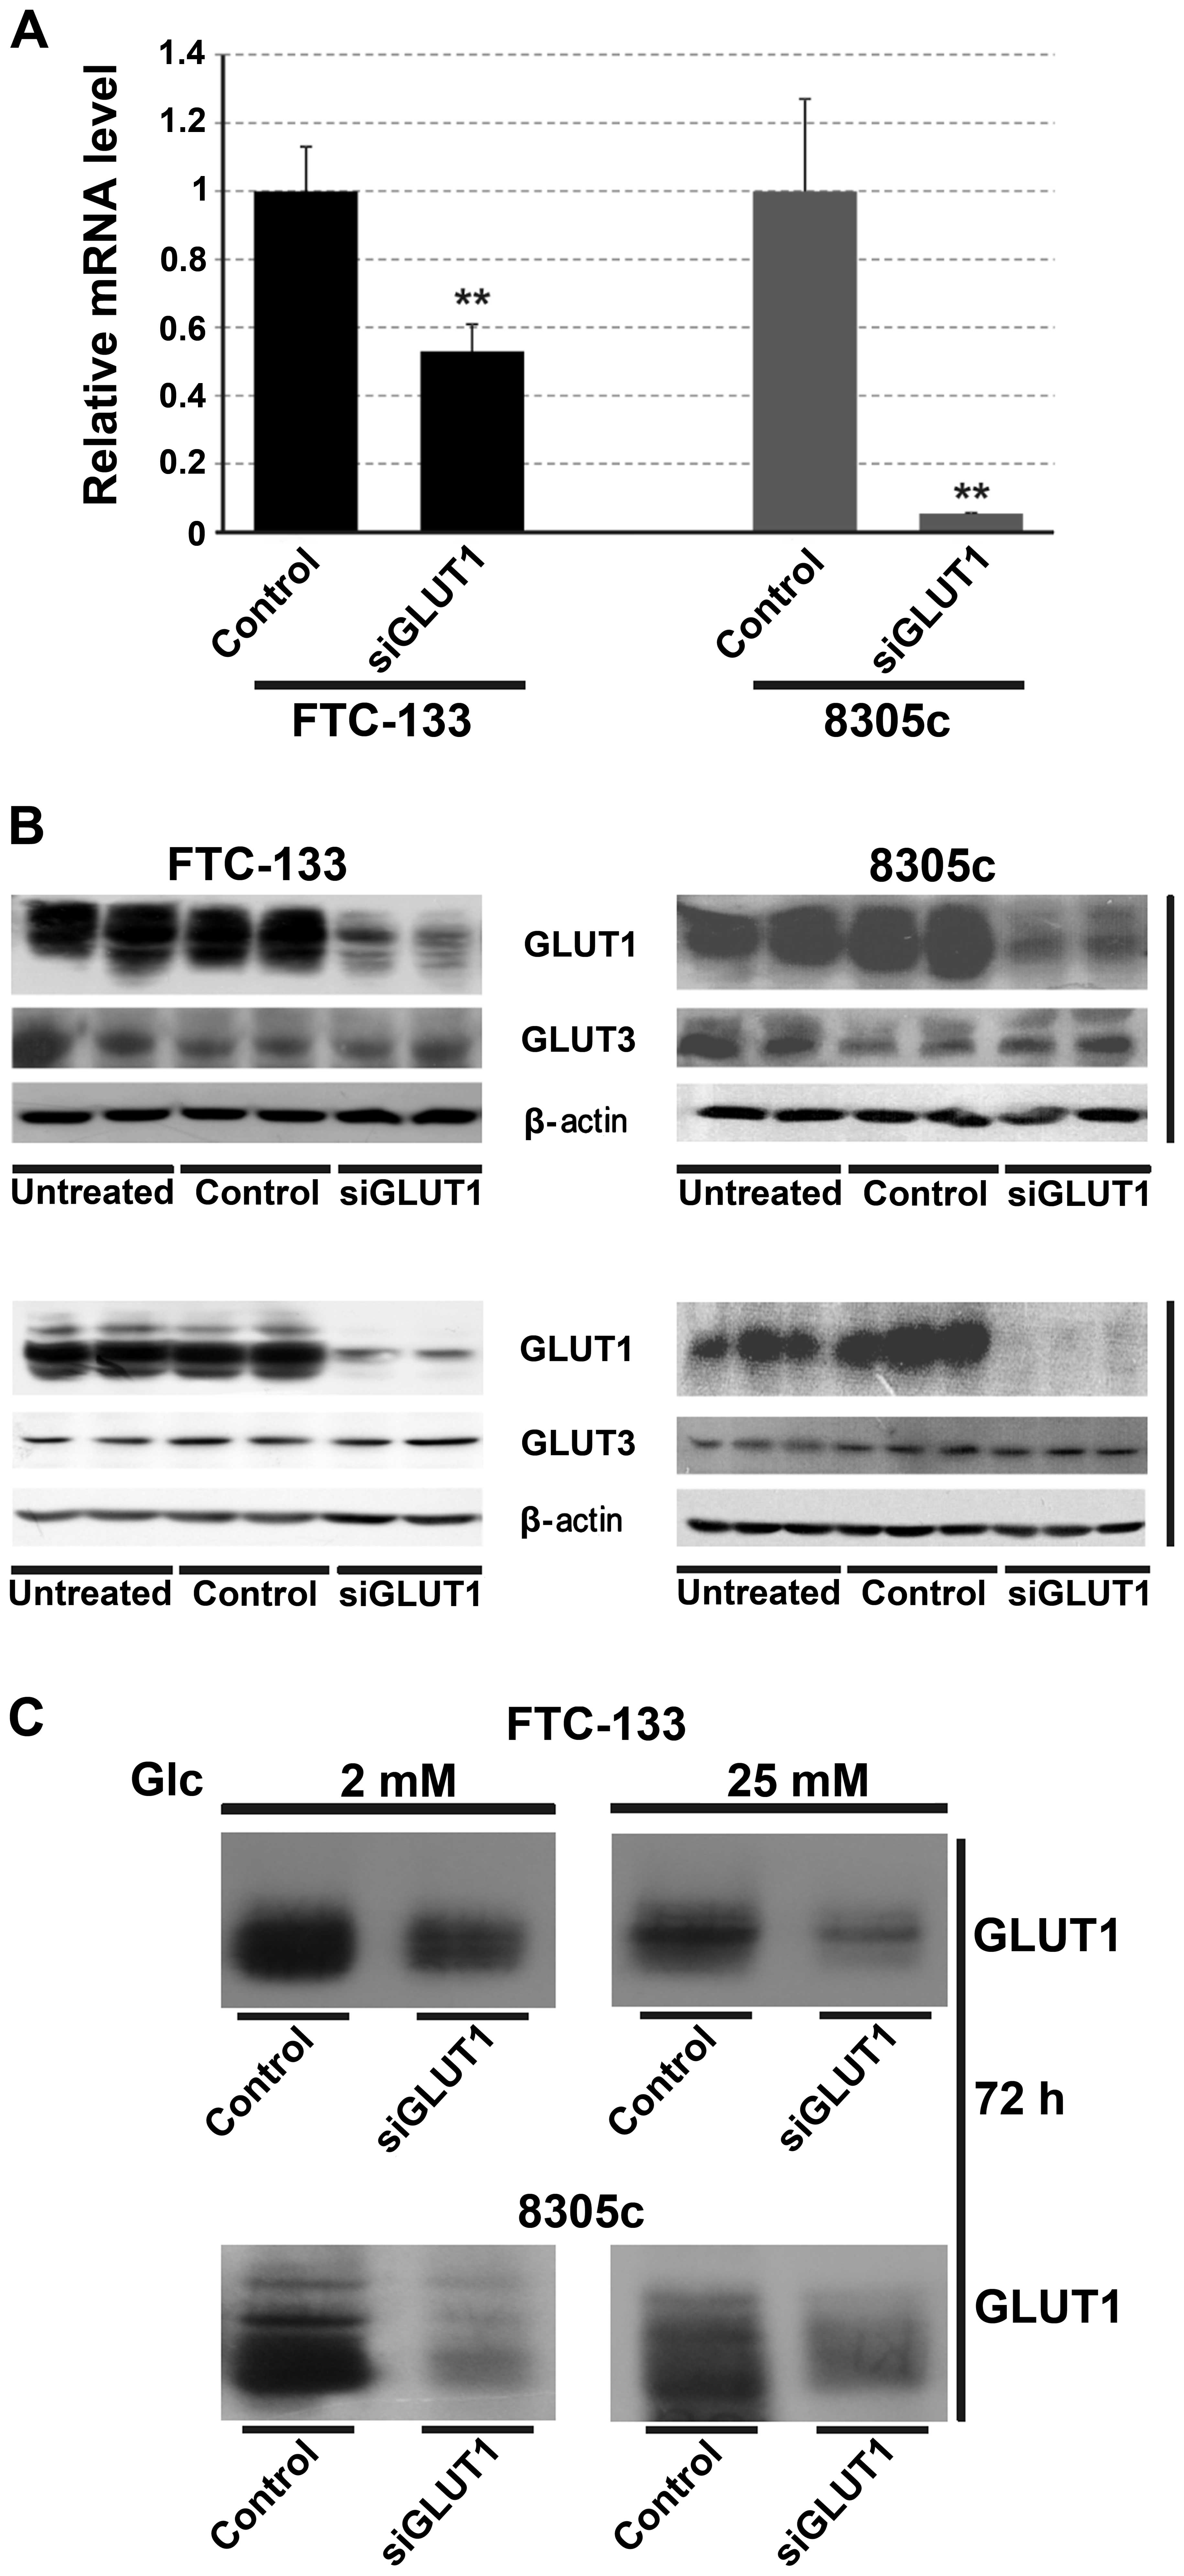
To determine whether the observed changes in cell
viability and glucose uptake are associated with GLUT1, the
expression of GLUT1 was downregulated using siRNA. The control
cells were transfected with a non-silent scrambled RNA duplex. The
effect of RNAi was assessed by RT-PCR and western blotting after 48
or 72 h. siRNA treatment caused a significant decrease in the mRNA
and protein levels (Fig. 6). After
72 h the total protein level was reduced by 90% in the two types of
thyroid cancer cells (Fig. 6B). A
significant decrease of the GLUT1 level in the cell membrane was
also observed (Fig. 6C). There was
no effect of GLUT1 interference on GLUT3 expression.
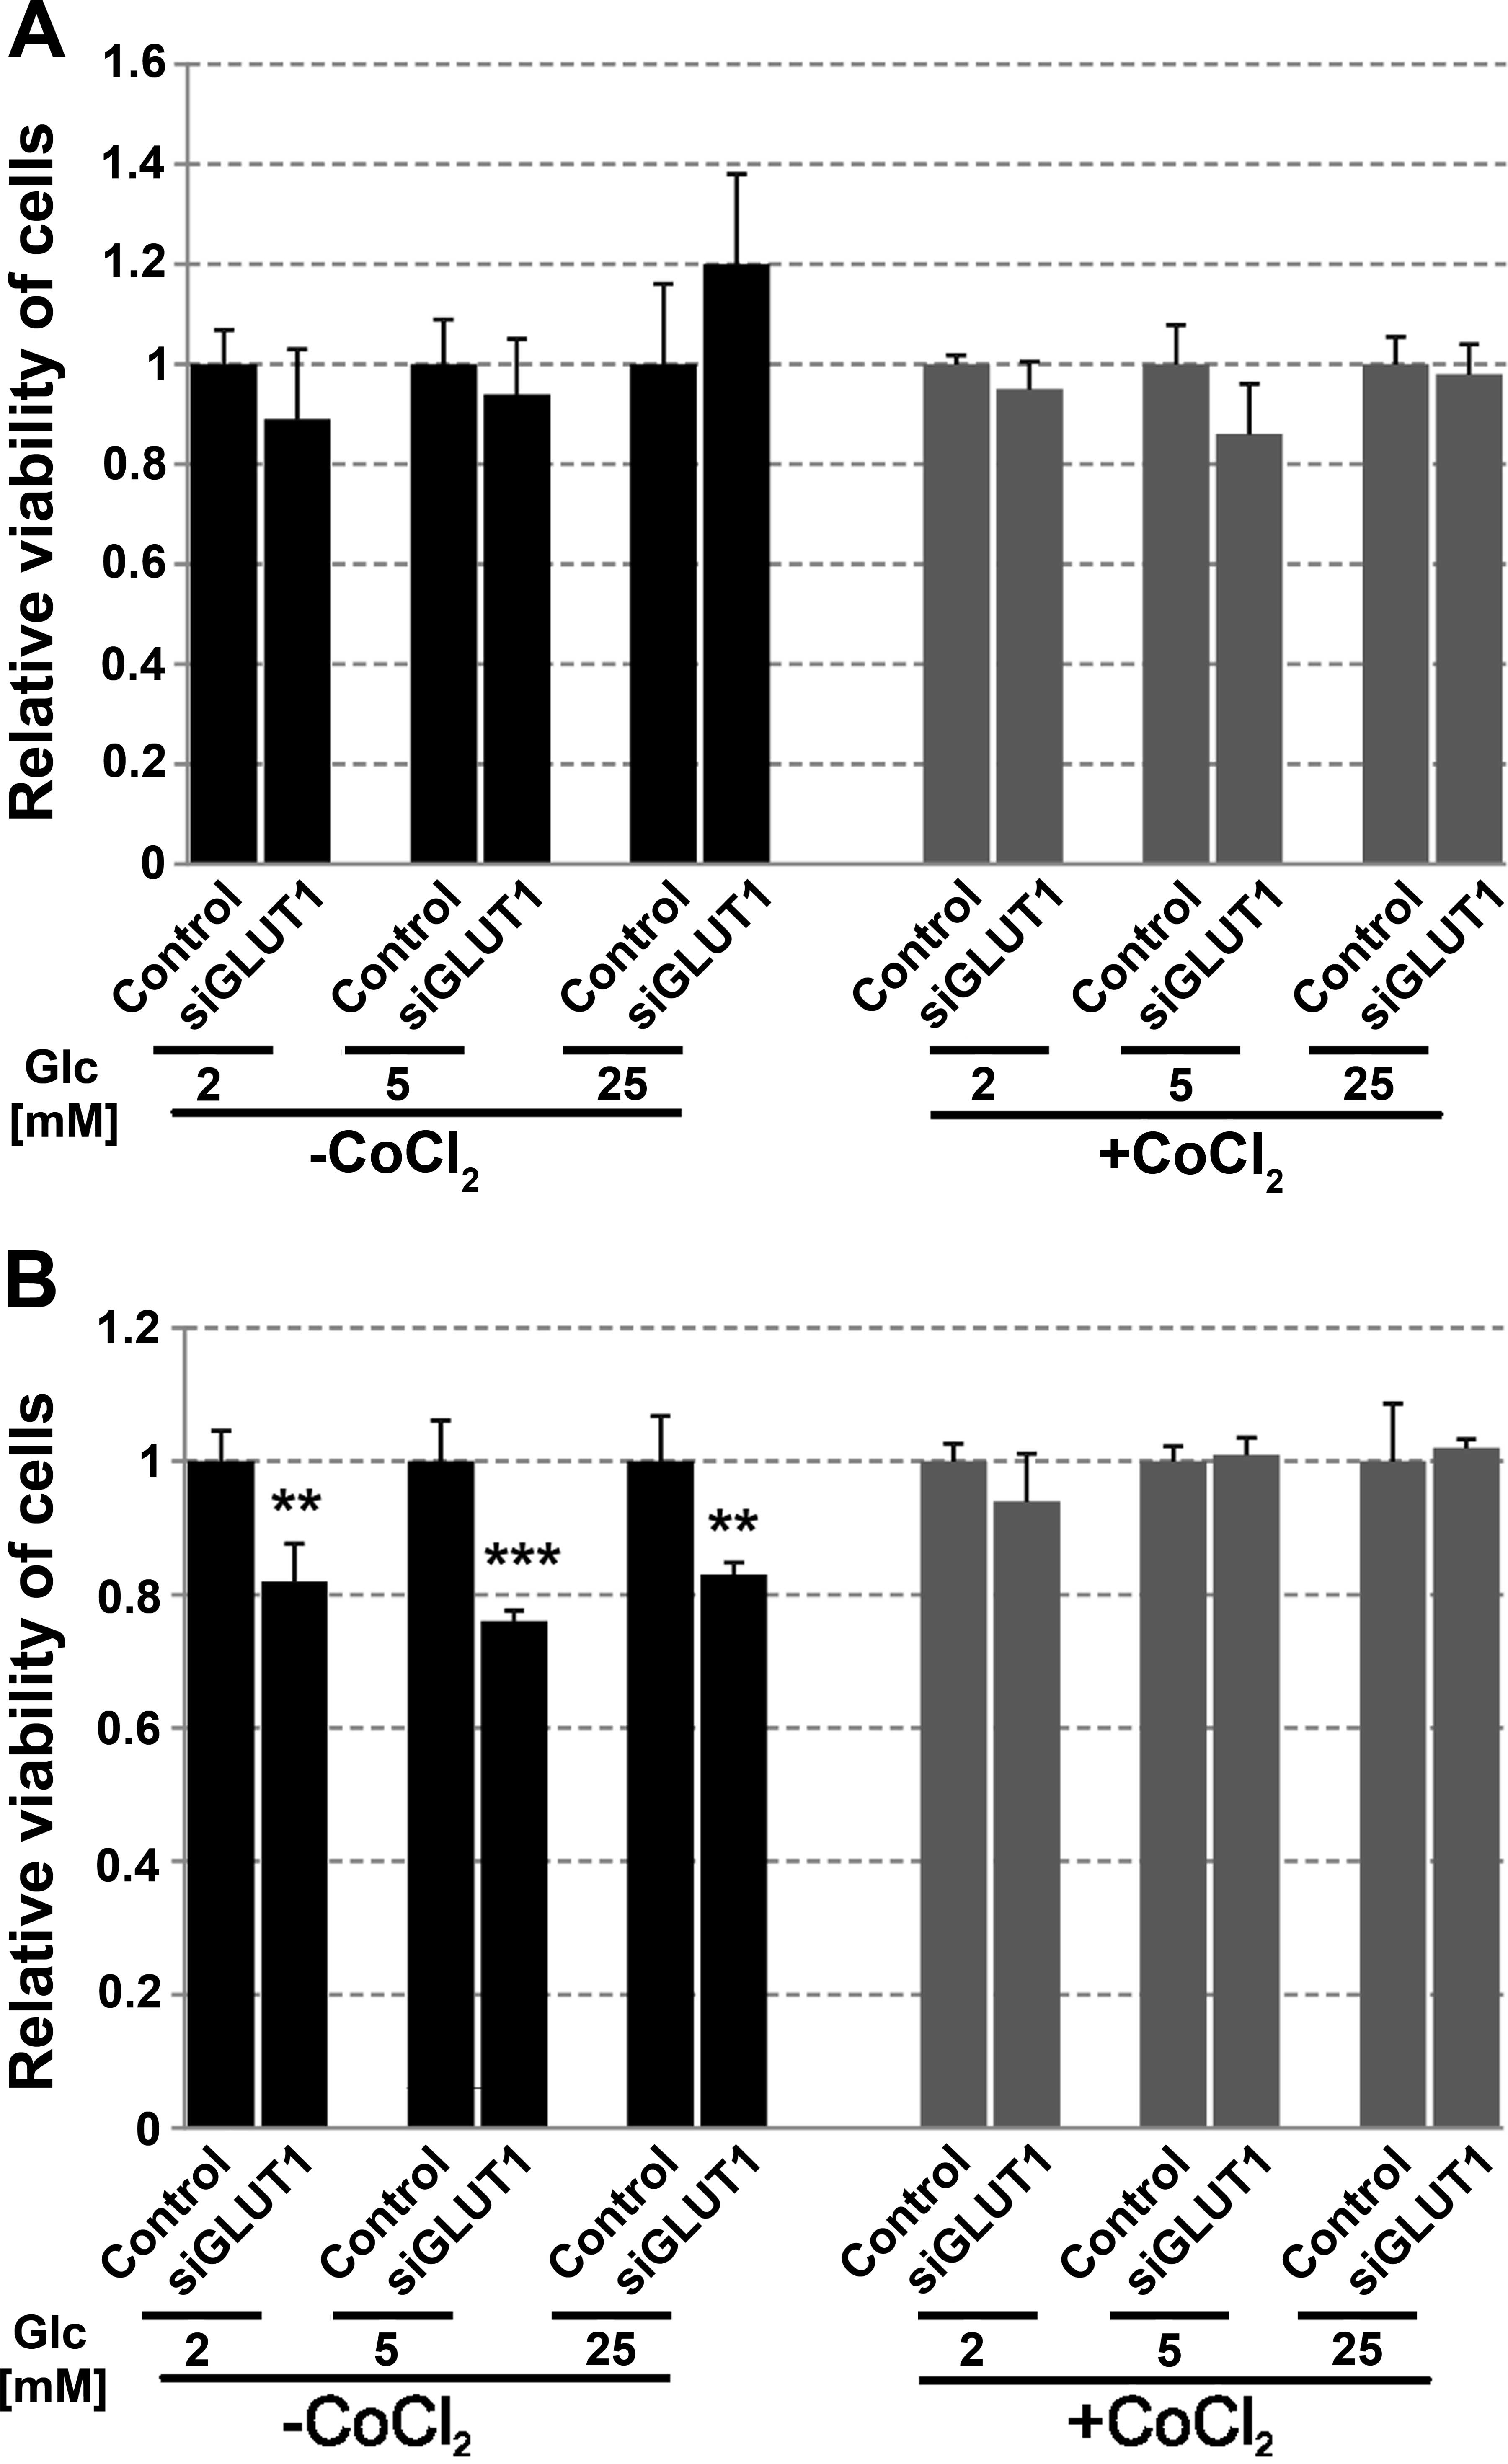
The viability of control cells and cells treated
with siRNA for 72 h was analyzed. There was no significant impact
of GLUT1 downregulation on the viability of FTC-133 cells growing
in hypoglycemia, normoglycemia or hyperglycemia (Fig. 7A). Cells (8305c) treated with siRNA
and growing in normoxic conditions irrespective of the glucose
concentration showed decreased cell viability and proliferation by
~20% (Fig. 7B). However, GLUT1
downregulation did not affect the viability of cells growing in
hypoxia conditions.
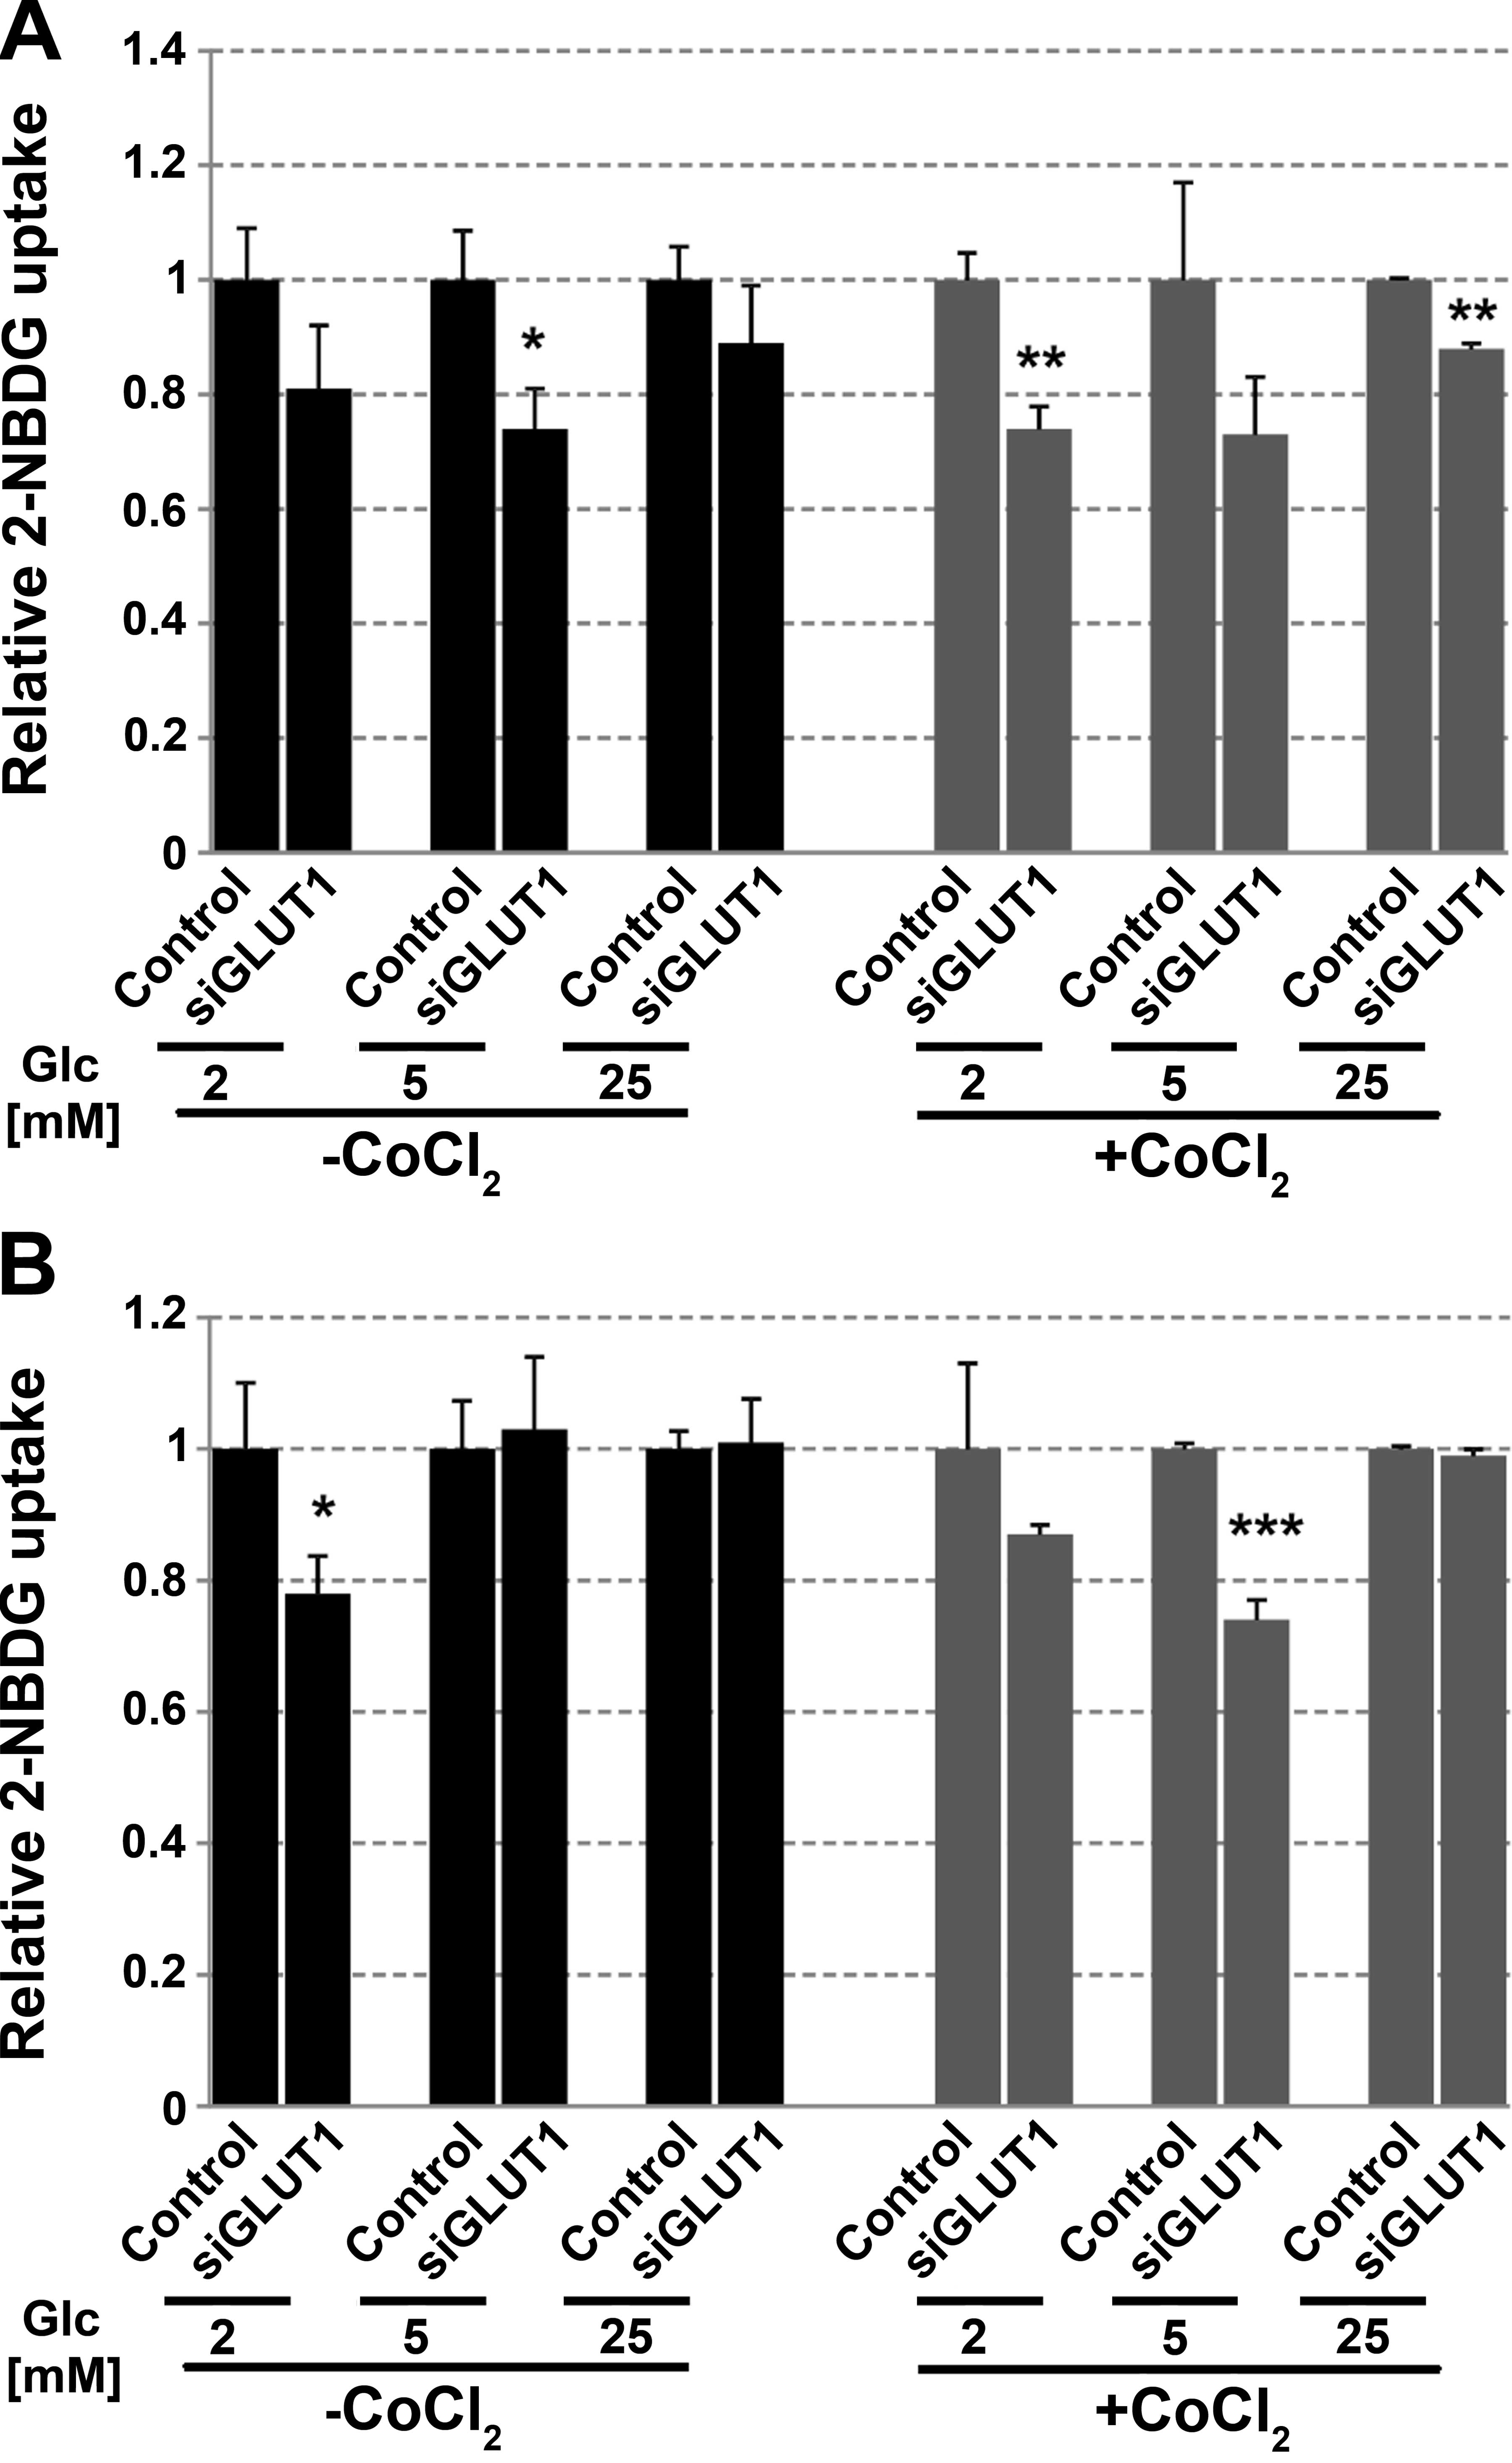
In FTC-133 cells, a reduced expression of GLUT1
caused marked changes in 2-NBDG uptake in normoxia and hypoxia
(Fig. 8A). GLUT1 may have a greater
impact on glucose uptake in low than in high glucose. For 8305c
cells reduced glucose uptake has been observed mainly in
low-glucose concentration (Fig.
8B).
Discussion
The impact of GLUT1 on glucose uptake and on the
viability of FTC-133 and 8305c thyroid cancer cells growing in
hypoglycemia, normoglycemia and hyperglycemia was analyzed. The
total expression of GLUT1 in FTC-133 and 8305c cells was highest in
cells growing in hypoglycemic conditions and lowest in
hyperglycemic conditions. This result suggests that GLUT1 is a
stress-responsive factor when glucose is limited. An association
between the level of GLUT1 or GLUT3 expression and HIF-1 has been
identified (27–33). This factor also induces the
transcription of genes involved in glycolysis and causes an
increase in the glucose metabolic rate (17). Our results show an opposite effect
of glucose concentration on HIF1α expression in the studied cell
types. In FTC-133 cells in normoxia and hypoxia an increase in
HIF1α expression with an increase in glucose concentration was
observed. The expression of HIF1α as well as GLUT1 was higher in
hypoxic condition compared to normoxia, which is consistent with
previous studies (27,29). However, no correlation was
identified between glucose-dependent total GLUT1 and HIF1α
expression. This suggests that glucose concentration affected GLUT1
expression irrespective to that of HIF1. Previous data have shown
that HIF1α is not always correlated with glucose uptake. Bos et
al (34) have shown that HIF1α
levels did not correlate well with increased (18) fluorodeoxyglucose (FdG) uptake
measured by positron emission tomography in breast cancer. Yun
et al (20) showed that the
increased GLUT1 transcription in colorectal cancer cells was
unrelated to HIF1α since genetic disruption of the HIF1A
gene did not affect the expression of GLUT1, or survival under
hypoglycemic conditions. There are several possible mechanisms of
GLUT1 expression regulation. Some oncogenes or suppressor proteins,
including Ras, Raf, Myc, Src and p53 have been known to promote
glucose uptake and metabolism as well as induce the transcription
of GLUT1 (20,35–37). A
serine/threonine kinase AKT is also one of the major factors
involved in the stimulation of glucose transport and aerobic
glycolysis in cancer cells (38).
Activation of AKT is commonly observed in cancer cells, including
thyroid cancer (39). AKT is a key
mediator of cancer cell survival (40). Gao et al (41) demonstrated that in cancer cells
transient glucose deprivation induces AKT phosphorylation at Thr308
and Ser473. However, in ovarian cancer, cells with constitutive
activation of AKT glucose deprivation resulted in the activation of
AMPK and inhibition of AKT phosphorylation (42). Our results have shown that AKT1
phosphorylation in FTC-133 and 8305c cells is dependent on the
glucose concentration, i.e., it is the highest in hypoglycemic
conditions and the lowest in hyperglycemia, which is consistent
with GLUT1 total expression. This finding suggests that GLUT1
overexpression may be part of the AKT1-dependent mechanism allowing
cells to survive in low glucose. Alternatively, high glucose may
reduce AKT signaling in cells, resulting in a lower expression of
GLUT1.
Although glucose-dependent GLUT1 total expression is
not correlated with HIF1α expression, the membrane level of this
glucose transporter seems to be regulated by HIF1α. In both cell
types the level of GLUT1 in plasma membrane was correlated with the
expression of HIF1α and with the glucose uptake level. However, the
glucose concentration had an inverse effect on the expression of
HIF1α and GLUT1 as well as glucose uptake in FTC-133 and 8305c
cells. Currently, we cannot explain the reason for the different
effects of hypoglycemia, normoglycemia and hyperglycemia on FTC-133
and 8305c cells.
Viability of cells grown for 48 h in low glucose was
lower by 40 or 20% for FTC-133 and 8305c cells, respectively,
compared to cells grown in hyperglycemic conditions, which may
support the hypothesis that high-glucose concentration is favorable
for cancer development and progression. The results of Mathews
et al (43) concerning the
effect of glucose concentration on survival of HeLa cells showed
that a reduction of glucose level from 6 to 3 mM reduced cancer
cell survival by >30% only after 4 h exposure. However, those
authors significantly reduced the concentration of glutamine
levels, which is the second most important nutrient compound for
cancer cells. Thus, a strong impact on cell survival resulted from
combining glucose and glutamine starvation.
It has been shown that a reduced expression of GLUT1
affects cell growth and proliferation in a similar manner to
glucose starvation. Young et al (44) have reported that reducing GLUT1
expression in mouse mammary tumor cell lines using shRNA reduced
glucose transport and growth of cells. Li et al (45) found that GLUT1 overexpression
promoted the cell viability of head and neck carcinoma cells
whereas GLUT1 silencing had the opposite effect. On the other hand,
in ovarian cancer cells sensitivity to glucose deprivation is
independent of GLUT1 expression, growth rate or the rate of glucose
uptake (42).
The main issue raised in our study was whether GLUT1
affected glucose uptake and viability of thyroid cancer cells. To
address this issue, we used RNA interference to reduce the
expression of GLUT1. The results showed that downregulation of
GLUT1 expression in FTC-133 cells reduced 2-NBDG uptake by ~20–25%,
yet did not significantly affect cell viability. These results are
convergent to the results of Young et al (44) who showed that in some mouse mammary
tumor cells the overexpression of GLUT1 increased glucose transport
without increasing proliferation. However, since RNAi significantly
reduced but did not eliminate GLUT1 expression in FTC-133 cells we
cannot exclude the possibility that the remaining amount of protein
is sufficient to transport enough glucose for cell survival. For
8305c cell reduction of GLUT1 expression by RNAi caused a decrease
in cell viability by ~20% but only in normoxic conditions. In 8305c
cells growing in normoxia the expression of GLUT1 was much lower
compared to FTC-133, while RNAi almost completely eliminated this
protein. However, glucose uptake was affected only in cells growing
in low glucose.
Taken together our results suggest that the extent
of GLUT1 impact on glucose uptake and cell viability may be
cell-type-dependent. GLUT1 overexpression in low glucose suggests
that GLUT1 is a universal stress responsive factor when glucose is
limited. The effect of glucose concentration on GLUT1 expression
and the fact that cancer cells are addicted to glucose render GLUT1
a promising therapeutic target. However, we suggest that strategies
targeting GLUT1 alone may not be sufficient to reduce thyroid
cancer cell viability. On the other hand GLUT1 may be considered a
useful target in combination with other molecules that regulate
tumor metabolism, such as certain oncogenes.
Acknowledgements
This study was supported by statutory funds for the
Department of Cytobiochemistry, University of Lodz.
References
|
1
|
Dang CV: Links between metabolism and
cancer. Genes Dev. 26:877–890. 2012. View Article : Google Scholar : PubMed/NCBI
|
|
2
|
Bensinger SJ and Christofk HR: New aspects
of the Warburg effect in cancer cell biology. Semin Cell Dev Biol.
23:352–361. 2012. View Article : Google Scholar : PubMed/NCBI
|
|
3
|
Graham NA, Tahmasian M, Kohli B,
Komisopoulou E, Zhu M, Vivanco I, Teitell MA, Wu H, Ribas A, Lo RS,
Mellinghoff IK, Mischel PS and Graeber TG: Glucose deprivation
activates a metabolic and signaling amplification loop leading to
cell death. Mol Syst Biol. 8:5892012. View Article : Google Scholar : PubMed/NCBI
|
|
4
|
Palorini R, Cammarata FP, Balestrieri C,
Monestiroli A, Vasso M, Gelfi C, Alberghina L and Chiaradonna F:
Glucose starvation induces cell death in K-ras-transformed cells by
interfering with the hexosamine biosynthesis pathway and activating
the unfolded protein response. Cell Death Dis. 4:e7322013.
View Article : Google Scholar : PubMed/NCBI
|
|
5
|
Mendivil-Perez M, Jimenez-Del-Rio M and
Velez-Pardo C: Glucose starvation induces apoptosis in a model of
acute T leukemia dependent on caspase-3 and apoptosis-inducing
factor: a therapeutic strategy. Nutr Cancer. 65:99–109. 2013.
View Article : Google Scholar : PubMed/NCBI
|
|
6
|
Ganapathy V, Thangaraju M and Prasad PD:
Nutrient transporters in cancer: relevance to Warburg hypothesis
and beyond. Pharmacol Ther. 121:29–40. 2009. View Article : Google Scholar
|
|
7
|
Adekola K, Rosen ST and Shanmugam M:
Glucose transporters in cancer metabolism. Curr Opin Oncol.
24:650–654. 2012. View Article : Google Scholar : PubMed/NCBI
|
|
8
|
Jóźwiak P and Lipińska A: The role of
glucose transporter 1 (GLUT1) in the diagnosis and therapy of
tumors. Postepy Hig Med Dosw. 66:165–174. 2012.(In Polish).
|
|
9
|
Szablewski L: Expression of glucose
transporters in cancers. Biochim Biophys Acta. 1835:164–169.
2013.
|
|
10
|
Calvo MB, Figueroa A, Pulido EG, Campelo
RG and Aparicio LA: Potential role of sugar transporters in cancer
and their relationship with anticancer therapy. Int J Endocrinol.
2010:pii: 205357. 2010.PubMed/NCBI
|
|
11
|
Mori Y, Tsukinoki K, Yasuda M, Miyazawa M,
Kaneko A and Watanabe Y: Glucose transporter type 1 expression are
associated with poor prognosis in patients with salivary gland
tumors. Oral Oncol. 43:563–569. 2007. View Article : Google Scholar
|
|
12
|
Chung FY, Huang MY, Yeh CS, Chang HJ,
Cheng TL, Yen LC, Wang JY and Lin SR: GLUT1 gene is a potential
hypoxic marker in colorectal cancer patients. BMC Cancer.
9:2412009. View Article : Google Scholar : PubMed/NCBI
|
|
13
|
Krzeslak A, Wojcik-Krowiranda K, Forma E,
Jozwiak P, Romanowicz H, Bienkiewicz A and Brys M: Expression of
GLUT1 and GLUT3 glucose transporters in endometrial and breast
cancers. Pathol Oncol Res. 18:721–728. 2012. View Article : Google Scholar : PubMed/NCBI
|
|
14
|
Sasaki H, Shitara M, Yokota K, Hikosaka Y,
Moriyama S, Yano M and Fujii Y: Overexpression of GLUT1 correlates
with Kras mutations in lung carcinomas. Mol Med Rep. 5:599–602.
2012.
|
|
15
|
Cho H, Lee YS, Kim J, Chung JY and Kim JH:
Overexpression of glucose transporter-1 (GLUT-1) predicts poor
prognosis in epithelial ovarian cancer. Cancer Invest. 31:607–615.
2013. View Article : Google Scholar : PubMed/NCBI
|
|
16
|
Jóźwiak P, Krześlak A, Pomorski L and
Lipińska A: Expression of hypoxia-related glucose transporters
GLUT1 and GLUT3 in benign, malignant and non-neoplastic thyroid
lesions. Mol Med Rep. 6:601–606. 2012.
|
|
17
|
Monti E and Gariboldi MB: HIF-1 as a
target for cancer chemotherapy, chemosensitization and
chemoprevention. Curr Mol Pharmacol. 14:62–77. 2011. View Article : Google Scholar
|
|
18
|
Mills KT, Bellows CF, Hoffman AE, Kelly TN
and Gagliardi G: Diabetes mellitus and colorectal cancer prognosis:
a meta-analysis. Colon Rectum Dis. 56:1304–1319. 2013. View Article : Google Scholar
|
|
19
|
Zhu Z, Wang X, Shen Z, Lu Y, Zhong S and
Xu C: Risk of bladder cancer in patients with diabetes mellitus: an
updated meta-analysis of 36 observational studies. BMC Cancer.
13:3102013. View Article : Google Scholar : PubMed/NCBI
|
|
20
|
Yun J, Rago C, Cheong I, Pagliarini R,
Angenendt P, Rajagopalan H, Schmidt K, Willson JK, Markowitz S,
Zhou S, Diaz LA, Velculescu VE, Lengauer C, Kinzler KW, Vogelstein
B and Papadopoulos N: Glucose deprivation contributes to the
development of KRAS pathway mutations in tumor cells. Science.
325:1555–1559. 2009. View Article : Google Scholar : PubMed/NCBI
|
|
21
|
Andersen DK: Diabetes and cancer: placing
the association in perspective. Curr Opin Endocrinol Diabetes Obes.
20:81–86. 2013. View Article : Google Scholar : PubMed/NCBI
|
|
22
|
Shikata K, Ninomiya T and Kiyohara Y:
Diabetes mellitus and cancer risk: review of the epidemiological
evidence. Cancer Sci. 104:9–14. 2013. View Article : Google Scholar
|
|
23
|
De Pergola G and Silvestris F: Obesity as
a major risk factor for cancer. J Obes. 2013:2915462013. View Article : Google Scholar : PubMed/NCBI
|
|
24
|
Li W, Ma Q, Liu J, Han L, Ma G, Liu H,
Shan T, Xie K and Wu E: Hyperglycemia as a mechanism of pancreatic
cancer metastasis. Front Biosci. 17:1761–1774. 2012. View Article : Google Scholar
|
|
25
|
Shih SR, Chiu WY, Chang TC and Tseng CH:
Diabetes and thyroid cancer risk: literature review. Exp Diabetes
Res. 2012:5782852012. View Article : Google Scholar : PubMed/NCBI
|
|
26
|
Yamada K, Saito M, Matsuoka H and Inagaki
N: A real-time method of imaging glucose uptake in single, living
mammalian cells. Nat Protoc. 2:753–762. 2007. View Article : Google Scholar : PubMed/NCBI
|
|
27
|
Ren BF, Deng LF, Wang J, Zhu YP, Wei L and
Zhou Q: Hypoxia regulation of facilitated glucose transporter-1 and
glucose transporter-3 in mouse chondrocytes mediated by HIF-1α.
Joint Bone Spine. 75:176–181. 2008. View Article : Google Scholar
|
|
28
|
Lidgren A, Bergh A, Grankvist K, Rasmuson
T and Ljungberg B: Glucose transporter-1 expression in renal cell
carcinoma and its correlation with hypoxia inducible factor-1α. BJU
Int. 101:480–484. 2008.
|
|
29
|
Baumann MU, Zamudio S and Illsley NP:
Hypoxic upregulation of glucose transporters in BeWo
choriocarcinoma cells is mediated by hypoxia-inducible factor-1. Am
J Physiol Cell Physiol. 293:C477–C485. 2007. View Article : Google Scholar : PubMed/NCBI
|
|
30
|
Iida T, Yasuda M, Miyazawa M, Fujita M,
Osamura RY, Hirasawa T, Muramatsu T, Murakami M, Saito K and Mikami
M: Hypoxic status in ovarian serous and mucinous tumors:
relationship between histological characteristics and HIF-1α/GLUT-1
expression. Arch Gynecol Obstet. 277:539–546. 2008. View Article : Google Scholar
|
|
31
|
Yasuda M, Miyazawa M, Fujita M, Kajiwara
H, Iida T, Hirasawa T, Muramatsu T, Murakami M, Mikami M, Saitoh K,
Shimizu M, Takekoshi S and Osamura RY: Expression of hypoxia
inducible factor-1α (HIF-1α) and glucose transporter-1 (GLUT-1) in
ovarian adenocarcinomas: Difference in hypoxic status depending on
histological character. Oncol Rep. 19:111–116. 2008.
|
|
32
|
Liu Y, Li YM, Tian RF, Liu WP, Fei Z, Long
QF, Wang XA and Zhang X: The expression and significance of HIF-1α
and GLUT-3 in glioma. Brain Res. 1304:149–154. 2009. View Article : Google Scholar : PubMed/NCBI
|
|
33
|
Wu XH, Chen SP, Mao JY, Ji XX, Yao HT and
Zhou SH: Expression and significance of hypoxia-inducible factor-1α
and glucose transporter-1 in laryngeal carcinoma. Oncol Lett.
5:261–266. 2013.
|
|
34
|
Bos R, van Der Hoeven JJ, van Der Wall E,
van Der Groep P, van Diest PJ, Comans EF, Joshi U, Semenza GL,
Hoekstra OS, Lammertsma AA and Molthoff CF: Biologic correlates of
18fluorodeoxyglucose uptake in human breast cancer
measured by positron emission tomography. J Clin Oncol. 20:379–387.
2002. View Article : Google Scholar : PubMed/NCBI
|
|
35
|
Flier JS, Mueckler MM, Usher P and Lodish
HF: Elevated levels of glucose transport and transporter messenger
RNA are induced by ras or src oncogenes. Science. 235:1492–1495.
1987. View Article : Google Scholar : PubMed/NCBI
|
|
36
|
Osthus RC, Shim H, Kim S, Li Q, Reddy R,
Mukherjee M, Xu Y, Wonsey D, Lee LA and Dang CV: Deregulation of
glucose transporter 1 and glycolytic gene expression by c-Myc. J
Biol Chem. 275:21797–21800. 2000. View Article : Google Scholar : PubMed/NCBI
|
|
37
|
Zhang C, Liu J, Liang Y, Wu R, Zhao Y,
Hong X, Lin M, Yu H, Liu L, Levine AJ, Hu W and Feng Z:
Tumour-associated mutant p53 drives the Warburg effect. Nat Commun.
4:29352013.PubMed/NCBI
|
|
38
|
Elstrom RL, Bauer DE, Buzzai M, Karnauskas
R, Harris MH, Plas DR, Zhuang H, Cinalli RM, Alavi A, Rudin CM and
Thompson CB: Akt stimulates aerobic glycolysis in cancer cells.
Cancer Res. 64:3892–3899. 2004. View Article : Google Scholar : PubMed/NCBI
|
|
39
|
Viglietto G, Amodio N, Malanga D, Scrima M
and De Marco C: Contribution of PKB/AKT signaling to thyroid
cancer. Front Biosci. 16:1461–1487. 2011. View Article : Google Scholar
|
|
40
|
Cassinelli G, Zuco V, Gatti L, Lanzi C,
Zaffaroni N, Colombo D and Perego P: Targeting the Akt kinase to
modulate survival, invasiveness and drug resistance of cancer
cells. Curr Med Chem. 20:1923–1945. 2013. View Article : Google Scholar : PubMed/NCBI
|
|
41
|
Gao M, Liang J, Lu Y, Guo H, German P, Bai
S, Jonasch E, Yang X, Mills GB and Ding Z: Site-specific activation
of AKT protects cells from death induced by glucose deprivation.
Oncogene. 33:745–755. 2014. View Article : Google Scholar
|
|
42
|
Priebe A, Tan L, Wahl H, Kueck A, He G,
Kwok R, Opipari A and Liu JR: Glucose deprivation activates AMPK
and induces cell death through modulation of Akt in ovarian cancer
cells. Gynecol Oncol. 122:389–395. 2011. View Article : Google Scholar : PubMed/NCBI
|
|
43
|
Mathews EH, Stander BA, Joubert AM and
Liebenberg L: Tumor cell culture survival following glucose and
glutamine deprivation at typical physiological concentrations.
Nutrition. 30:218–227. 2014. View Article : Google Scholar
|
|
44
|
Young CD, Lewis AS, Rudolph MC, Ruehle MD,
Jackman MR, Yun UJ, Ilkun O, Pereira R, Abel ED and Anderson SM:
Modulation of glucose transporter 1 (GLUT1) expression levels
alters mouse mammary tumor cell growth in vitro and in vivo. PLoS
One. 6:e232052011. View Article : Google Scholar : PubMed/NCBI
|
|
45
|
Li S, Yang X, Wang P and Ran X: The
effects of GLUT1 on the survival of head and neck squamous cell
carcinoma. Cell Physiol Biochem. 32:624–634. 2013. View Article : Google Scholar : PubMed/NCBI
|