Introduction
Hepatocellular carcinoma (HCC) is one of the most
aggressive malignant tumors, with limited treatment options. In
order of mortality, it is the third most prevalent cancer worldwide
and the second in China (1). To
date, curative hepatectomy and transplantation are the most
effective therapies for patients with HCC (2), yet the prognosis remains poor due to
the high incidence of metastasis and recurrence, which is usually
associated with a high propensity for vascular invasion and
metastasis (3). Therefore, it is
necessary to identify novel predictors to forecast invasive and
metastatic HCC phenotypes.
Epithelial-to-mesenchymal transition (EMT) is an
early event that occurs when cancer invades an epithelial origin.
At the molecular level, EMT is characterized by epithelial cell
marker loss, including the cell adhesion molecule E-cadherin, and
also the acquiring of various mesenchymal markers (4,5).
Although the role EMT plays in tumor invasion and metastasis has
been investigated, the underlying regulatory mechanisms involved
remain unclear. In recent years, constitutive activation of signal
transducer and activator of transcription 3 (STAT3) has been
detected in a variety of human tumors, including HCC. Activated
STAT3 (phosphorylated STAT3/p-STAT3, Tyr705) is often correlated
with tumor invasion and metastasis (6–9). Huang
et al reported that the STAT3 signaling pathway plays an
important role in the pancreatic cancer EMT process by regulating
Snail gene expression (10). Lo
et al (11) and Cheng et
al (12) found that activated
STAT3 correlates positively with Twist expression in human breast
cancer and it can transcriptionally induce Twist to mediate
STAT3-related oncogenic functions. Moreover, a recent study showed
that STAT3 mediates colorectal cancer EMT progression through the
regulation of ZEB1 expression (13).
Since STAT3 activation and EMT play important roles
in tumor invasion and metastasis, it is of great interest to
explore whether activated STAT3 can mediate EMT to induce HCC
progression. In our previous study, we demonstrated that STAT3
activation is associated with Twist and E-cadherin expression in
HCC tissues (14). However, no data
exist concerning the association of activated STAT3 with EMT in HCC
cells. Whether STAT3 binds the Twist promoter and mediates its
biological functions in HCC is also elusive. We carried out the
present study to discover whether STAT3 mediates the EMT process,
promotes HCC invasion and migration, and whether this effect is
directly caused by the regulation of Twist expression in HCC
cells.
Materials and methods
Cell culture
SMMC7721 cells (low metastatic human HCC cell line;
Shanghai Cell Bank, Chinese Academy of Sciences, Shanghai, China)
(15), MHCC97H cells (high
metastatic human HCC cell line; Liver Cancer Institute of Zhongshan
Hospital, Shanghai, China) (16)
and HEK293T cells (Shanghai Cell Bank, Chinese Academy of Sciences)
were used in the present study. Cells were cultured in Dulbecco’s
modified Eagle’s medium (DMEM) with high glucose supplemented with
10% fetal bovine serum (FBS), 100 U/ml penicillin G, and 50 μg/ml
streptomycin at 37°C in a humidified atmosphere containing 5%
CO2 and 95% air.
Antibodies and reagents
Monoclonal antibodies against STAT3, E-cadherin,
β-catenin, N-cadherin, vimentin and β-actin, and a polyclonal
antibody against Twist were obtained from Santa Cruz Biotechnology
(Santa Cruz, CA, USA). A monoclonal antibody against phosphorylated
STAT3 (p-STAT3, Tyr705) was obtained from Cell Signaling Technology
(Beverly, MA, USA).
Plasmid construction
The STAT3 eukaryotic expression vector was
chemically synthesized, constructed, sequenced and identified by
Shanghai GeneChem Chemical Technology Co., Ltd.
(GenBank® accession no. NM 003150). The upstream and
downstream primers were: STAT3-F, 5′-TCCAACTTT
GTGCCAATGGCCCAATGGAATCAGC-3′ and STAT3-R,
5′-AATGCCAACTCTGTCCATGGGGGAGGTAGCGCA CT-3′, with restriction sites
of HindIII/XhoI, respectively. The primers were then
cloned into the vector of GV142 (which was constructed by the
Shanghai GeneChem Chemical Technology Co., Ltd.). Vectors of STAT3
small hairpin RNAs (shRNA) were also chemically synthesized,
constructed, sequenced and identified by Shanghai GeneChem Chemical
Technology Co., Ltd. (GenBank® accession no. NM 003150).
Locations and nucleotide sequences of the 3 constructed coding
regions were as follows: 1926–1944 (GCAGCAGCTGAACAACATG) followed
by a 9-bp loop sequence of TTCAAGAGA, and the reverse complementary
sequences (marked as STAT3-SiRNA-I), 771–789 (CATCTGCCTAGATCGGCTA)
also followed by the loop and the inverted repeat (STAT3-SiRNA-II)
and 1929–1947 (GCAGCTGAACAACATGTCA) again followed by the loop and
the inverted repeat (STAT3-SiRNA-III). Then, these sequences were
constructed into the GV102 vector by Shanghai GeneChem Chemical
Technology Co., Ltd. Moreover, a negative control scrambled siRNA
(TTCTCCGA ACGTGTCACGT) was used as a control.
The full-length promoter sequence of the wild-type
Twist (Twist WT) (with restriction sites of
NheI/HindIII) was chemically synthesized,
constructed, sequenced, identified and cloned into the GV238 vector
by the Shanghai GeneChem Chemical Technology Co., Ltd. According to
the report of Cheng et al (12), we selected for study the second
binding site among those closest to the initiation codon and which
were likely to bind the Twist promoter. It was then treated with
site-directed mutagenesis, i.e., the sequence between −115 and −107
(which was TTCCTATAA) was replaced as AGAAATACT.
Construction of stable transfection HCC
cells and the experimental groups
Frozen well-constructed Escherichia coli
(E. coli) bacterial solutions with eukaryotic STAT3 vector
expression and those transfected with the STAT3 RNA interference
vectors were thawed and seeded onto bacteria culture plates
containing 100 μg/ml ampicillin for a 16-h culture inside a 37°C
incubator. Monoclonal colonies were selected and cultured in
Luria-Bertani (LB) liquid medium (containing 100 μg/ml ampicillin)
on a 37°C, 200 rpm shaker for 12 h. Plasmids were extracted using
the GoldHi EndoFree Plasmid Maxi Kit (Beijing Kangwei Century
Biotech Co., Ltd., China) strictly following the manufacturer’s
instructions. The extracted plasmids were measured and adjusted by
a UV spectrophotometer to a concentration of 20 nmol/ml. Plasmids
containing eukaryotic expression vectors of STAT3 and STAT3 RNA
interference vectors (both 20 pmol) were diluted into the cDNA
transfection buffer (final volume of 50 μl) by a 5-sec vortex. The
2.6 μl transfection reagents were diluted into the cDNA
transfection buffer (final volume of 50 μl) by a 10-sec vortex. The
well-diluted transfection reagents were added into the nucleic acid
solution and cultured for 15 min under room temperature after a
3-sec vortex, and then the mixed solution was diluted by a 900 μl
culture medium. The cells were washed by sterile phosphate-buffered
saline (PBS) after the original medium inside the culture plates
was discarded. It was replaced by 900 μl mixed solution, and then
the cells were cultured in a 37°C/5% CO2 incubator for
another 6 h. Subsequently, we carried out a sequential culture
replacement by antibiotic culture medium with 200 μg/ml G418.
Finally, for cell screening and construction, cells containing the
STAT3 eukaryotic expression vector plasmid were cultured in DMEM
containing 10% FBS and 400 μg/ml G418. Cells with STAT3 RNA
interference vectors were cultured in DMEM containing 10% FBS and
2.5 μg/ml puromycin. Media were replaced every other day to observe
the cell states. When all the control group cells died (~10–14
days), the monoclonal cell lines were prepared after trypsinization
and double dilution. When the monoclonal cell lines completely
covered a 24-well plate, they were identified and expanded in
culture. In the present study, there were 3 groups in the stable
transfection experiment of STAT3 overexpression: the blank control,
GV142 transfection vector and STAT3 overexpression transfection
vector groups, which were marked as control, GV142 and GV142/STAT3,
respectively. There were 3 groups in the stable transfection
experiment of STAT3 RNA interference: the blank control, GV102
transfection vector and STAT3 RNA interference recombinant plasmid
groups, which were marked as control, GV102 and GV102/STAT3 SiRNA,
respectively.
Quantitative real-time PCR
Total RNA was extracted from the cell lines using
TRIzol reagent (Invitrogen, USA) according to the manufacturer’s
instructions. mRNA quality was evaluated by the OD260/OD280 ratio,
and samples were used only when the ratio was between 1.8 and 2.0.
cDNA was synthesized with oligo(dT)18 from 1 mg of RNA
using the Revert Aid First Strand cDNA Synthesis Kit (Invitrogen).
Gene-specific primer sequences were designed as follows: STAT3
(sense, 5′-CTCTGCCGGAGAAACAGGATGG-3′ and antisense,
5′-ACTCTCAATCCAAGGGGCCA-3′); Twist (sense,
5′-TTCTGCCTCTTTCGAGCACC-3′ and anti-sense,
5′-TACAACGACCCAGTCTGACG-3′); E-cadherin (sense,
5′-TCGCTTACACCATCCTCAGC-3′ and antisense,
5′-GGAAACTCTCTCGGTCCAGC-3′); β-catenin (sense,
5′-ACCACAAGCAGAGTGCTGAA-3′ and antisense,
5′-GCTTGCATTCCACCAGCTTC-3′); N-cadherin (sense,
5′-AACAGCAACGACGGGTTAGT-3′ and antisense,
5′-CAGACACGGTTGCAGTTGAC-3′); and vimentin (sense,
5′-AGGCGAGGAGAGCAGGATTT-3′ and antisense,
5′-AGTGGGTATCAACCAGAGGGA-3′). To standardize RNA quality control,
expression of glyceraldehyde-3-phosphate dehydrogenase (GAPDH) in
each sample was quantified using the primer set
5′-GCCGCATCTTCTTTTGCGTC-3′ (sense) and 5′-TACGACCAAATCCGTTGACTCC-3′
(anti-sense). Cycling parameters were as follows: initial
denaturation (95°C, 10 min), followed by 40 cycles of denaturation
(95°C, 15 sec) and annealing (60°C, 1 min). PCR products were
quantified via melting curve analysis at 84°C. All reactions were
performed in triplicate and normalized to GAPDH to ensure a uniform
amount of RNA template.
Western blot analysis
SMMC7721 and MHCC97H cells were lysed for protein
extraction. The protein concentration was measured using a
Bicinchoninic Acid Protein Assay Reagent kit (Qiagen). The total
cell lysates were separated by sodium dodecyl
sulfate-polyacrylamide gel electrophoresis and then transferred to
polyvinylidene difluoride membranes (Millipore). After brief
incubation with 5% non-fat milk, the membranes were probed with
STAT3, p-STAT3, Twist, E-cadherin, β-catenin, N-cadherin, vimentin
and β-actin primary antibodies at 4°C overnight. After washing, the
membranes were incubated with the secondary peroxidase-conjugated
antibody for 1 h at room temperature. Protein bands were visualized
using an enhanced chemiluminescence detection kit (Amersham
Pharmacia Biotech, Piscataway, NJ, USA). The densitometry for each
band was measured with Quantity One Software (National Institutes
of Heath, USA). All reactions were performed in triplicate and the
values were normalized according to internal standard β-actin
expression.
Immunocytochemical analysis
The fixed cells in 6-well plates were washed with
PBS, followed by fixation with 4% paraformaldehyde for 20 min at
4°C. Then, the cells were permeabilized with 0.1% Triton X-100 for
10 min at room temperature. After being blocked with 10% goat serum
at room temperature for 10 min, the cells were incubated with STAT3
(1:100), p-STAT3 (1:50), Twist (1:100), E-cadherin (1:100),
β-catenin (1:100), N-cadherin (1:100), vimentin (1:100) and β-actin
(1:100) at 4°C overnight. After washing, the cells were reacted
with the corresponding secondary antibody at 37°C for 15 min.
Finally, they were incubated in PBS containing diaminobenzidine
(DAB) for 5 min. Microscopy was employed to visualize targeted
protein staining. For assessment of STAT3, p-STAT3 and Twist
expression, the cells were considered positive when their cytoplasm
and/or nuclei exhibited yellow or brown staining. For assessment of
E-cadherin and β-catenin expression, cells were considered positive
when their membranes exhibited yellow or brown staining. For
assessment of N-cadherin and vimentin expression, cells were
considered positive when their cytoplasm exhibited yellow or brown
staining.
Dual-luciferase reporter assay
A suspension of HEK293T cells in logarithmic growth
phase was prepared after trypsinization. Then, the cell suspensions
(1×10⁴ cells/well) were seeded onto 24-well plates and
cultured in a 37°C/5% CO2 incubator until they reached a
cell fusion degree of ~80%. Transfection was performed using
Lipofectamine 2000 (Invitrogen), strictly following the
manufacturer’s instructions. This experiment included 4
transfection groups: the group with 1.0 μg plasmid of the Twist WT
promoter (this recombinant plasmid has firefly luciferase genes),
group with 1.0 μg plasmid of the Twist MT promoter, co-transfection
group of GV142/STAT3 (concentrations of 0.1, 0.5, 1.0, 2.0 and 4.0
μg) and Twist WT, and co-transfection group of GV142/STAT3
(concentrations of 0.1, 0.5, 1.0, 2.0 and 4.0 μg) and Twist MT. All
4 groups were transfected with the Renilla Luciferase
reporter genes. Transfection efficiency was assessed 24 h after
transfection based on fluorescence-labeled gene expression levels
according to the manufacturer’s instructions (Dual-Glo™ Luciferase
Assay kit; cat no. E2920; Promega, Madison, WI, USA). Values of
firefly and Renilla luciferase in each group were detected
using the single transfection group values of Twist WT (1.0 μg) and
Twist MT (1.0 μg) as the baselines. The statistical values of the
firefly and Renilla luciferase values were measured minus
the corresponding baselines. The firefly and Renilla
luciferase value ratios produced the relative luminescence unit
(RLU) value. All RLU values were normalized using the single
transfection group values of Twist WT (1.0 μg) and Twist MT (1.0
μg) as 1, respectively. The corresponding ratios (marked as
STAT3/Twist WT and STAT3/Twist MT) were calculated. This experiment
was repeated thrice.
Cell proliferation assay
All SMMC7721 and MHCC97H cells were trypsinized into
cell suspensions at a concentration of 1×10⁴/ml when
they were in the logarithmic growth phase. The cell suspensions
were seeded onto 96-well plates (100 μl/well), and then the cells
were diluted to a single cell using the doubling dilution method.
Cell morphologies of each group were observed on the next day under
an inverted microscope. The monoclonal cells were marked and
photographed (this was the cell number on day 0). Culture medium
(DMEM + 10% FBS) was changed every other day. Cells under close
observation were photographed on days 3 and 6 to calculate the
proliferated cell numbers. The cell proliferation was also examined
by 3-(4,5-dimethylthiazol-2-yl)-2,5-diphenyltetrazolium bromide
(MTT) assay: cells were seeded in 100 mm2 tissue culture
plates at a density of 2–3×10⁶ cells/well. After culture
for 3 and 6 days, respectively, the cells were incubated with MTT
(5 μg/ml) for 4 h. Optical density (OD) was read with Bio-Rad
instruments (Bio-Rad, Hercules, CA, USA) at a wavelength of 490 nm.
The conditions of cell proliferation were denoted by the
proliferative rate (PR). PR = (OD value of treatment group/OD value
of control group) × 100%. All experiments were repeated thrice.
Cell invasion assay
The cell invasive assay was performed using a
24-well Transwell chamber (Costar, USA). Cells were seeded in 100
mm2 tissue culture plates at a density of
2–3×10⁶ cells/well and incubated for 24 h. Then, cells
(1×10⁴) were detached and seeded in the upper chamber of
an 8-μm pore size insert precoated with Matrigel (BD, USA) and
cultured in serum-free medium for 24 h. Cells were allowed to
migrate toward the medium containing 10% FBS in the bottom chamber.
The non-migratory cells on the upper membrane surface were removed
with a cotton tip, and the migratory cells that attached to the
lower membrane surface were fixed with 4% paraformaldehyde and
stained with hematoxylin. Invaded cells were stained, photographed
digitally and quantified. Data presented are representative of
three individual wells.
Cell migration assay
Scratch marks were made with a marker pen at the
back of a 6-well culture plate. When the cells were in the
logarithmic growth phase, they were trypsinized into cell
suspensions at a concentration of 1×10⁵/ml. The cell
suspensions were seeded onto 6-well plates (2 ml/well) for
continuous culture. Medium was changed on the next day. Cell
morphology and growing statuses were under close observation. When
the cells completely covered the culture plate, scratch marks were
made vertically toward the plate by a 10-μl tips along the previous
mark lines. Cell migration assessment was conducted after three
sterile PBS washings and serum-free medium replacement. Then, the
cells were photographed as the baseline (0 h). The cells were
photographed again 24 h later, and the cell migration was
calculated as follows: Cell migration = (width of the scratch mark
at 0 h − width of the scratch mark at 24 h)/width of the scratch
mark at 0 h. All cell migration values were normalized using the
value of the control as 1, and the corresponding ratios were
calculated. This experiment was repeated thrice.
Statistical analysis
All statistical analyses were performed using SPSS
13.0 software for Windows (SPSS, Inc., Chicago, IL, USA). In the
cell culture tests, data are expressed as means ± standard
deviation (SD), and they were pooled from at least three
independent experiments to avoid possible biases. Differences
between two groups were tested using the Student’s t-test.
Differences between multiple groups were tested using analysis of
variance (ANOVA). For the above comparisons, two-tailed P-values
<0.05 were considered to indicate statistically significant
results.
Results
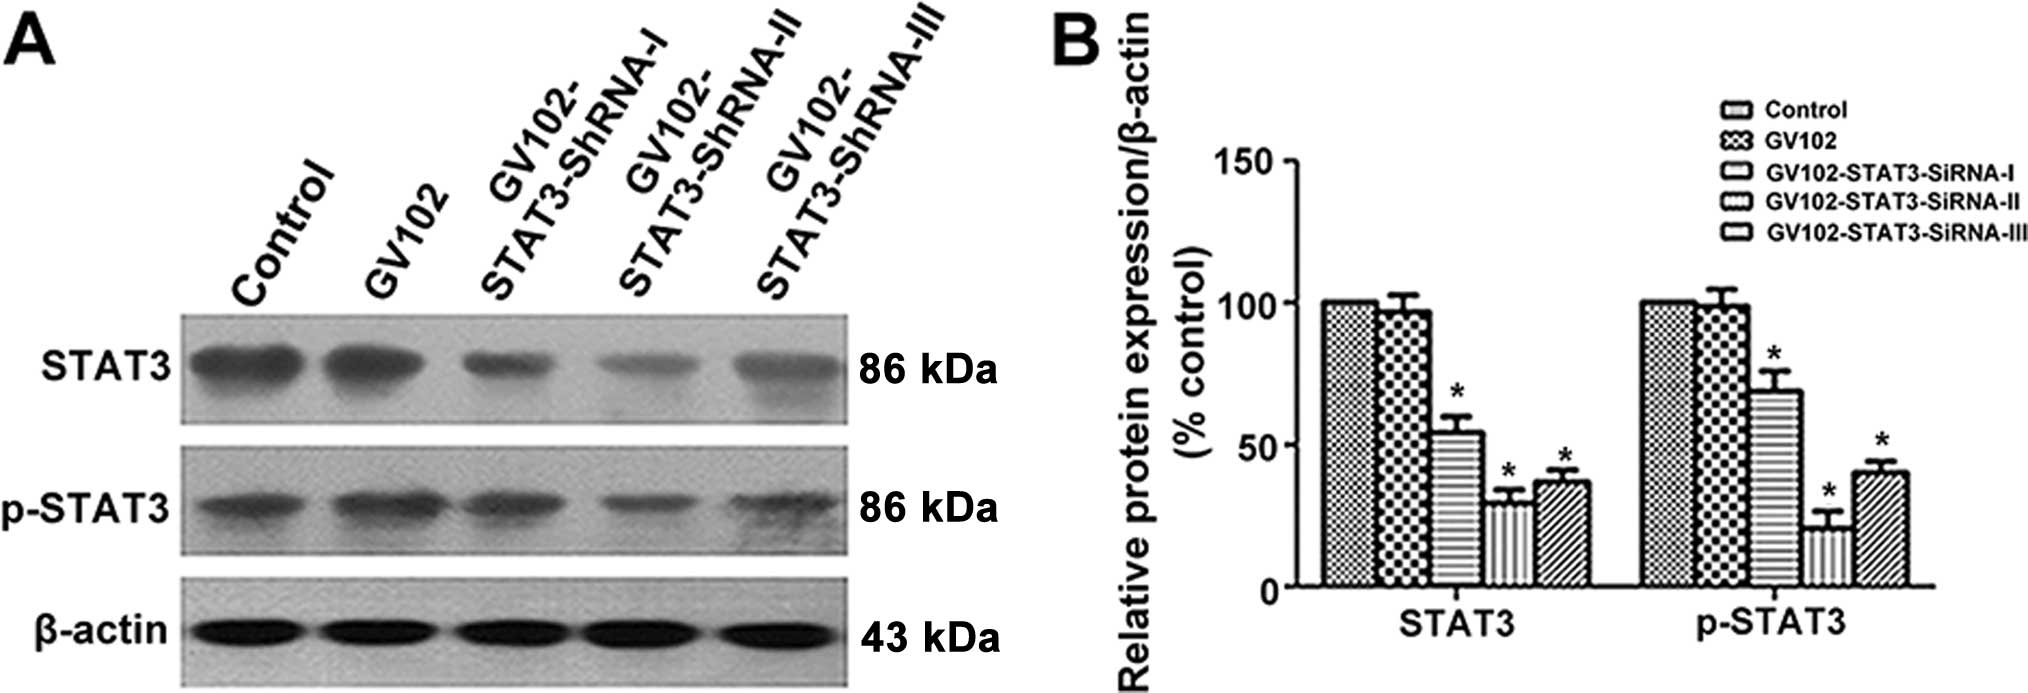
Selection of the most effective
STAT3-specific shRNA expression vector targeting STAT3
To evaluate the comparative silencing effects of the
STAT3-specific shRNA expression vectors on STAT3 expression,
MHCC97H cells were transfected transiently with the recombinant
plasmids. The STAT3 and p-STAT3 protein levels were detected by
western blotting 24 h after shRNA expression vector transfection.
Our results showed that transfection of STAT3-SiRNA-I,
STAT3-SiRNA-II and STAT3-siRNA-III significantly reduced STAT3 and
p-STAT3 expression in the MHCC97H cells, yet negative control
transfection did not reduce STAT3 and p-STAT3 expression. The gene
silencing effect was nearly 45.7, 70.5 and 63.2%, respectively, in
the STAT3-SiRNA-I, STAT3-SiRNA-II and STAT3-SiRNA-III groups when
compared to the control. Noticeably, the most obvious gene
silencing effect was observed in the STAT3-siRNA-2 group (Fig. 1A and B). Thus, we chose
STAT3-siRNA-2 (hereafter referred to as STAT3 SiRNA) for subsequent
stable transfection in the present study.
Role of STAT3 in EMT molecular marker
changes in HCC cells
We determine whether STAT3 and its activated form
could induce specific molecular changes consistent with EMT in the
SMMC7721 and MHCC97H cells. We first succeeded in constructing
SMMC7721 cell lines that stably overexpressed STAT3 (GV142/STAT3
cells) and MHCC97H cell lines that stably silenced STAT3
(GV102/STAT3 SiRNA cells) expression. We then examined the
expression of epithelial markers E-cadherin and β-catenin, and
mesenchymal markers N-cadherin and vimentin, using real-time PCR,
western blotting and immunocytochemical methods. We determined that
STAT3 and p-STAT3 expression levels in the SMMC7721 cells of the
GV142/STAT3 group were significantly higher than those in the
control and GV142 group (P<0.01; Figs. 2A–C and 3A), indicating successful STAT3
overexpression. E-cadherin and β-catenin expression levels were
significantly reduced, while those of N-cadherin and vimentin were
significantly increased, as well as the elevated STAT3 and p-STAT3
expression levels (compared to the control and GV142 group,
P<0.01; Figs. 2A–C and 3A). Additionally, we found that STAT3 and
p-STAT3 expression levels in the MHCC97H cells of the STAT3-siRNA
group were significantly lower than those in the control and GV102
group (P<0.01; Figs. 2D–F and
3B). This indicated effective STAT3
knockdown. E-cadherin and β-catenin expression levels were
significantly increased, while those of N-cadherin and vimentin
were significantly lowered, as well as the reduced STAT3 and
p-STAT3 expression levels (compared to the control and GV102 group,
P<0.01; Figs. 2D–F and 3B). These results suggest that STAT3 may
contribute to EMT initiation and progression in HCC cells.
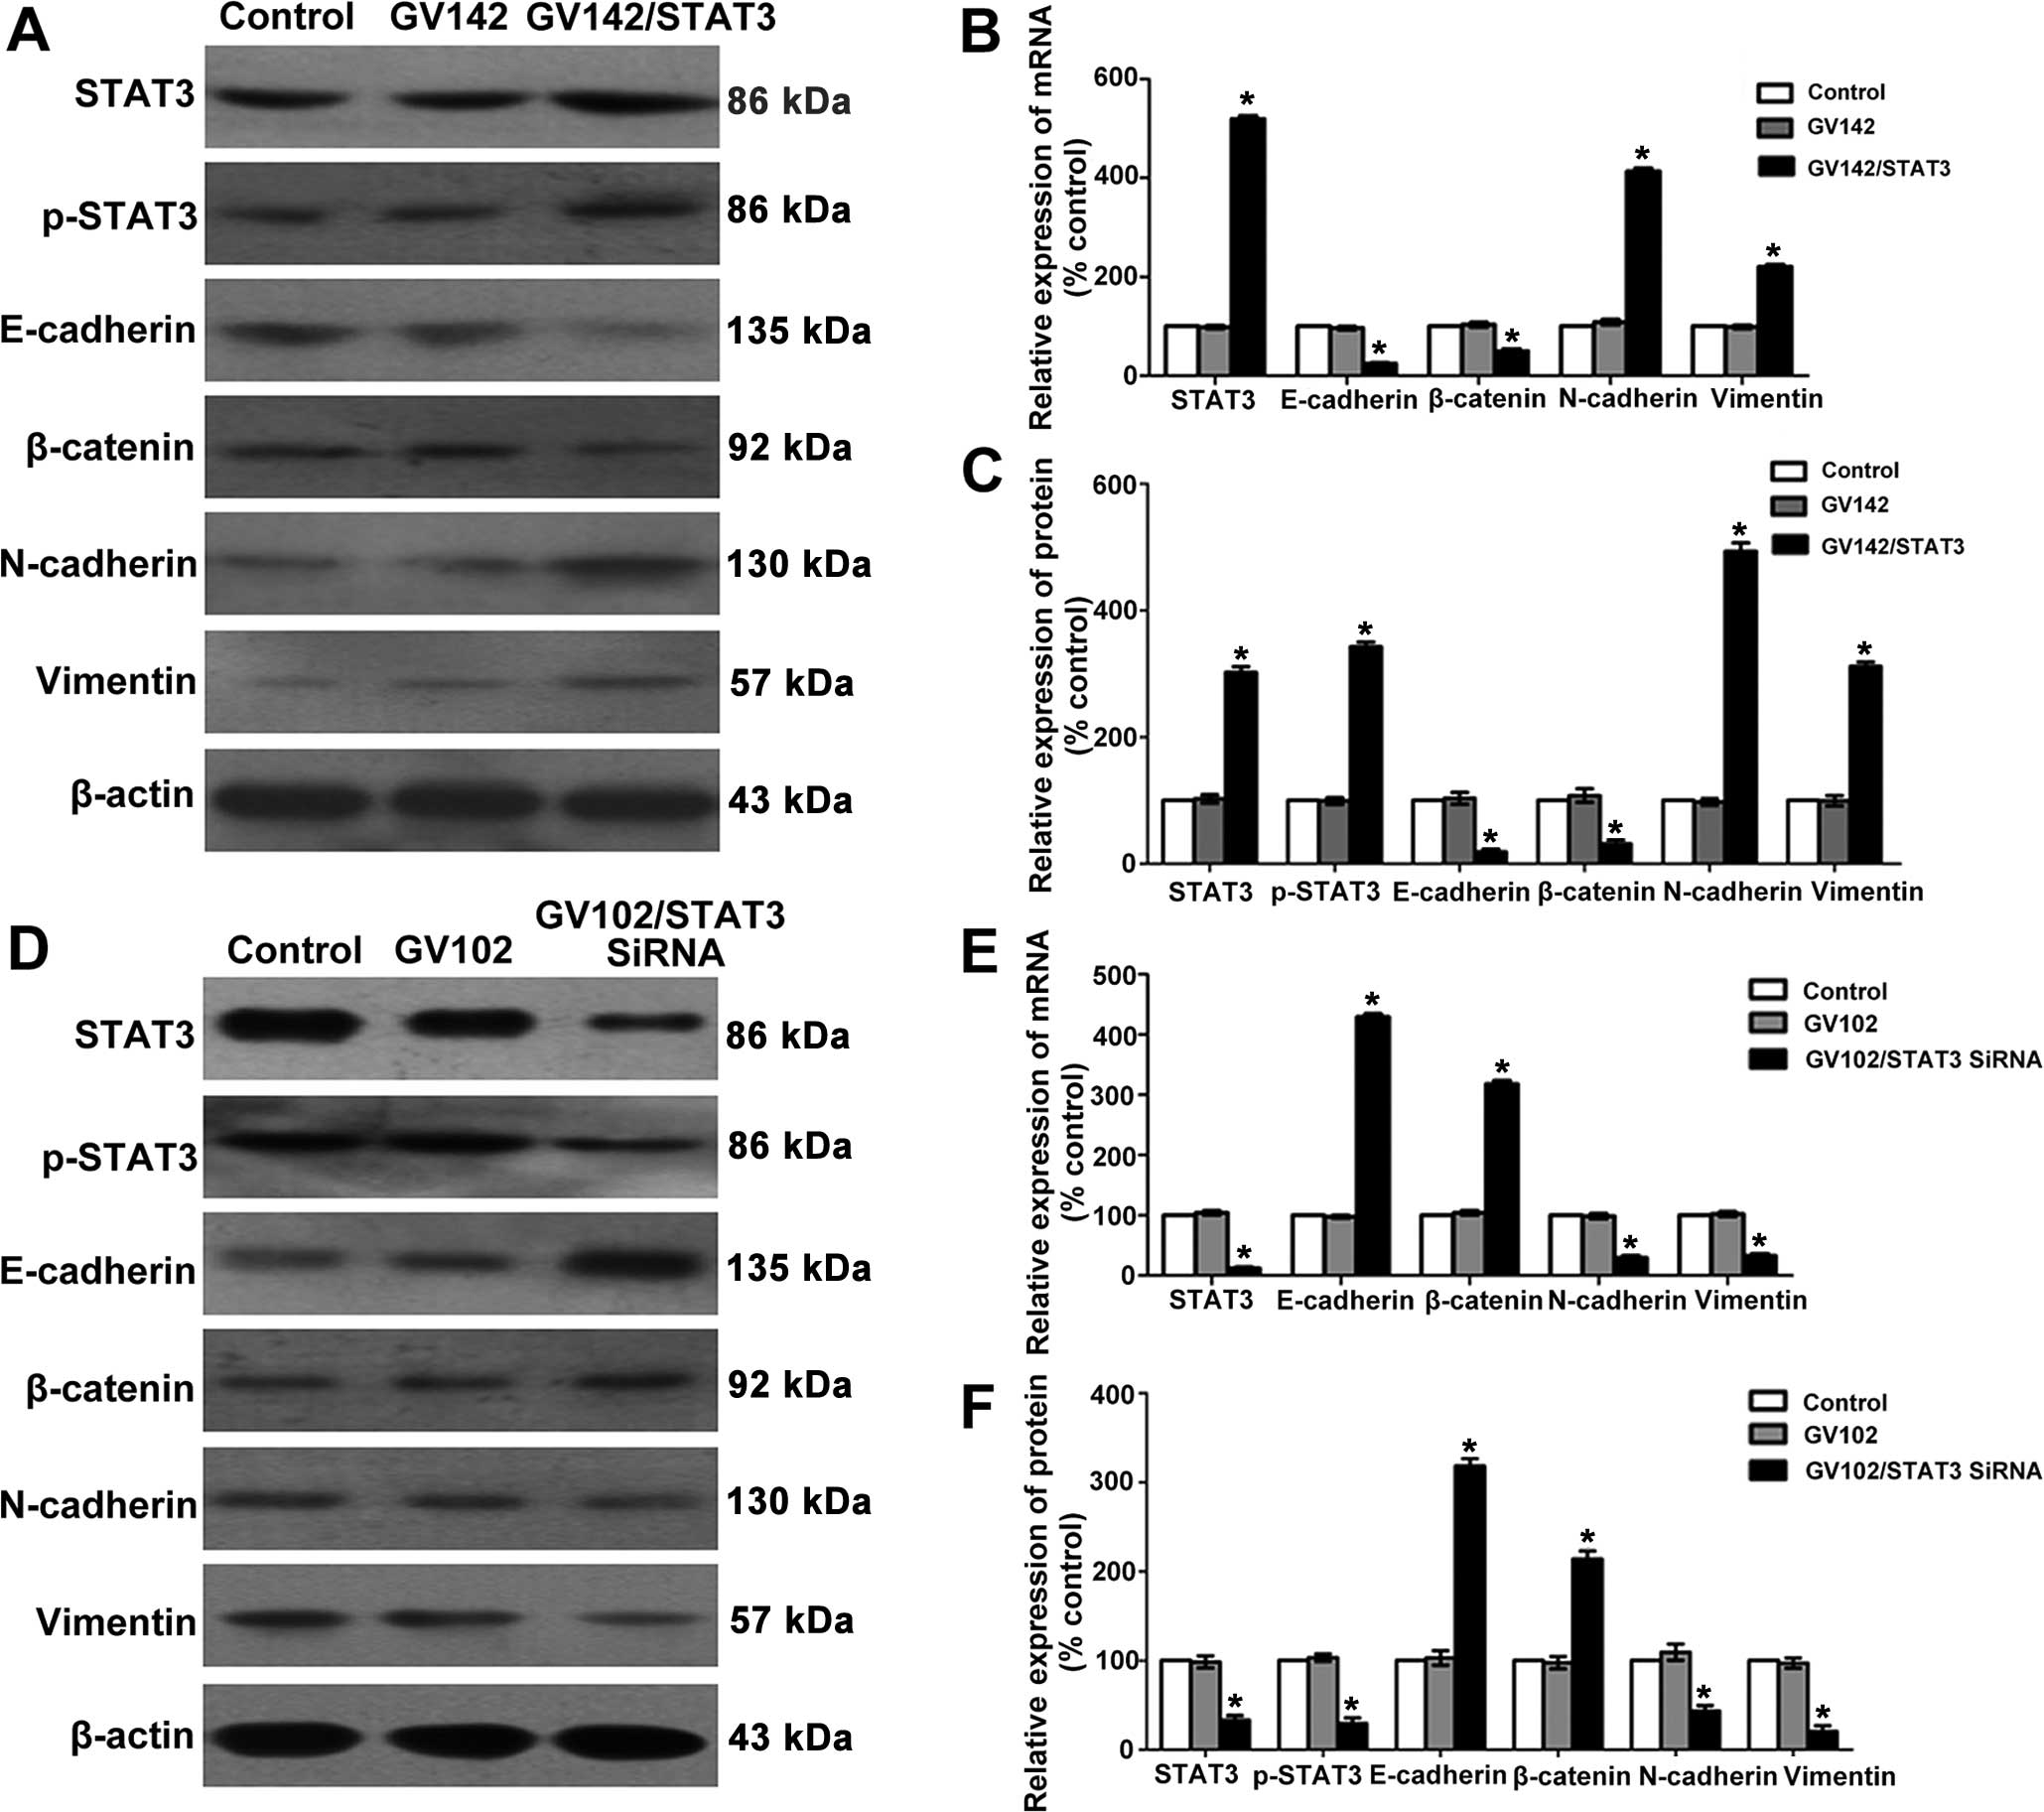 | Figure 2Effect of STAT3 on molecular changes
consistent with EMT in HCC cells. (A) STAT3, p-STAT3, E-cadherin,
β-catenin, N-cadherin and vimentin protein levels were determined
by western blotting in SMMC7721 cells. (B) Quantitative real-time
PCR analyses of the relative levels of STAT3, E-cadherin,
β-catenin, N-cadherin and vimentin mRNA expressions observed with
the GAPDH internal controls in SMMC7721 cells (group data represent
mean ± SD). *P<0.01, compared to the control group.
(C) Semi-quantitative analyses of the relative levels of STAT3,
p-STAT3, E-cadherin, β-catenin, N-cadherin and vimentin protein
expression observed with the β-actin internal controls in SMMC7721
cells (group data represent mean ± SD). *P<0.01,
compared to the control group. (D) STAT3, p-STAT3, E-cadherin,
β-catenin, N-cadherin and vimentin protein levels were determined
by western blotting in MHCC97H cells. (E) Quantitative real-time
PCR analyses of the relative levels of STAT3, E-cadherin,
β-catenin, N-cadherin and vimentin mRNA expression observed with
the GAPDH internal controls in MHCC97H cells (group data represent
mean ± SD). *P<0.01, compared to the control group.
(F) Semi-quantitative analyses of the relative levels of STAT3,
p-STAT3, E-cadherin, β-catenin, N-cadherin and vimentin protein
expression observed with the β-actin internal controls in MHCC97H
cells (group data represent mean ± SD). *P<0.01,
compared to the control group. STAT3, signal transducer and
activator of transcription 3; EMT, epithelial-to-mesenchymal
transition. |
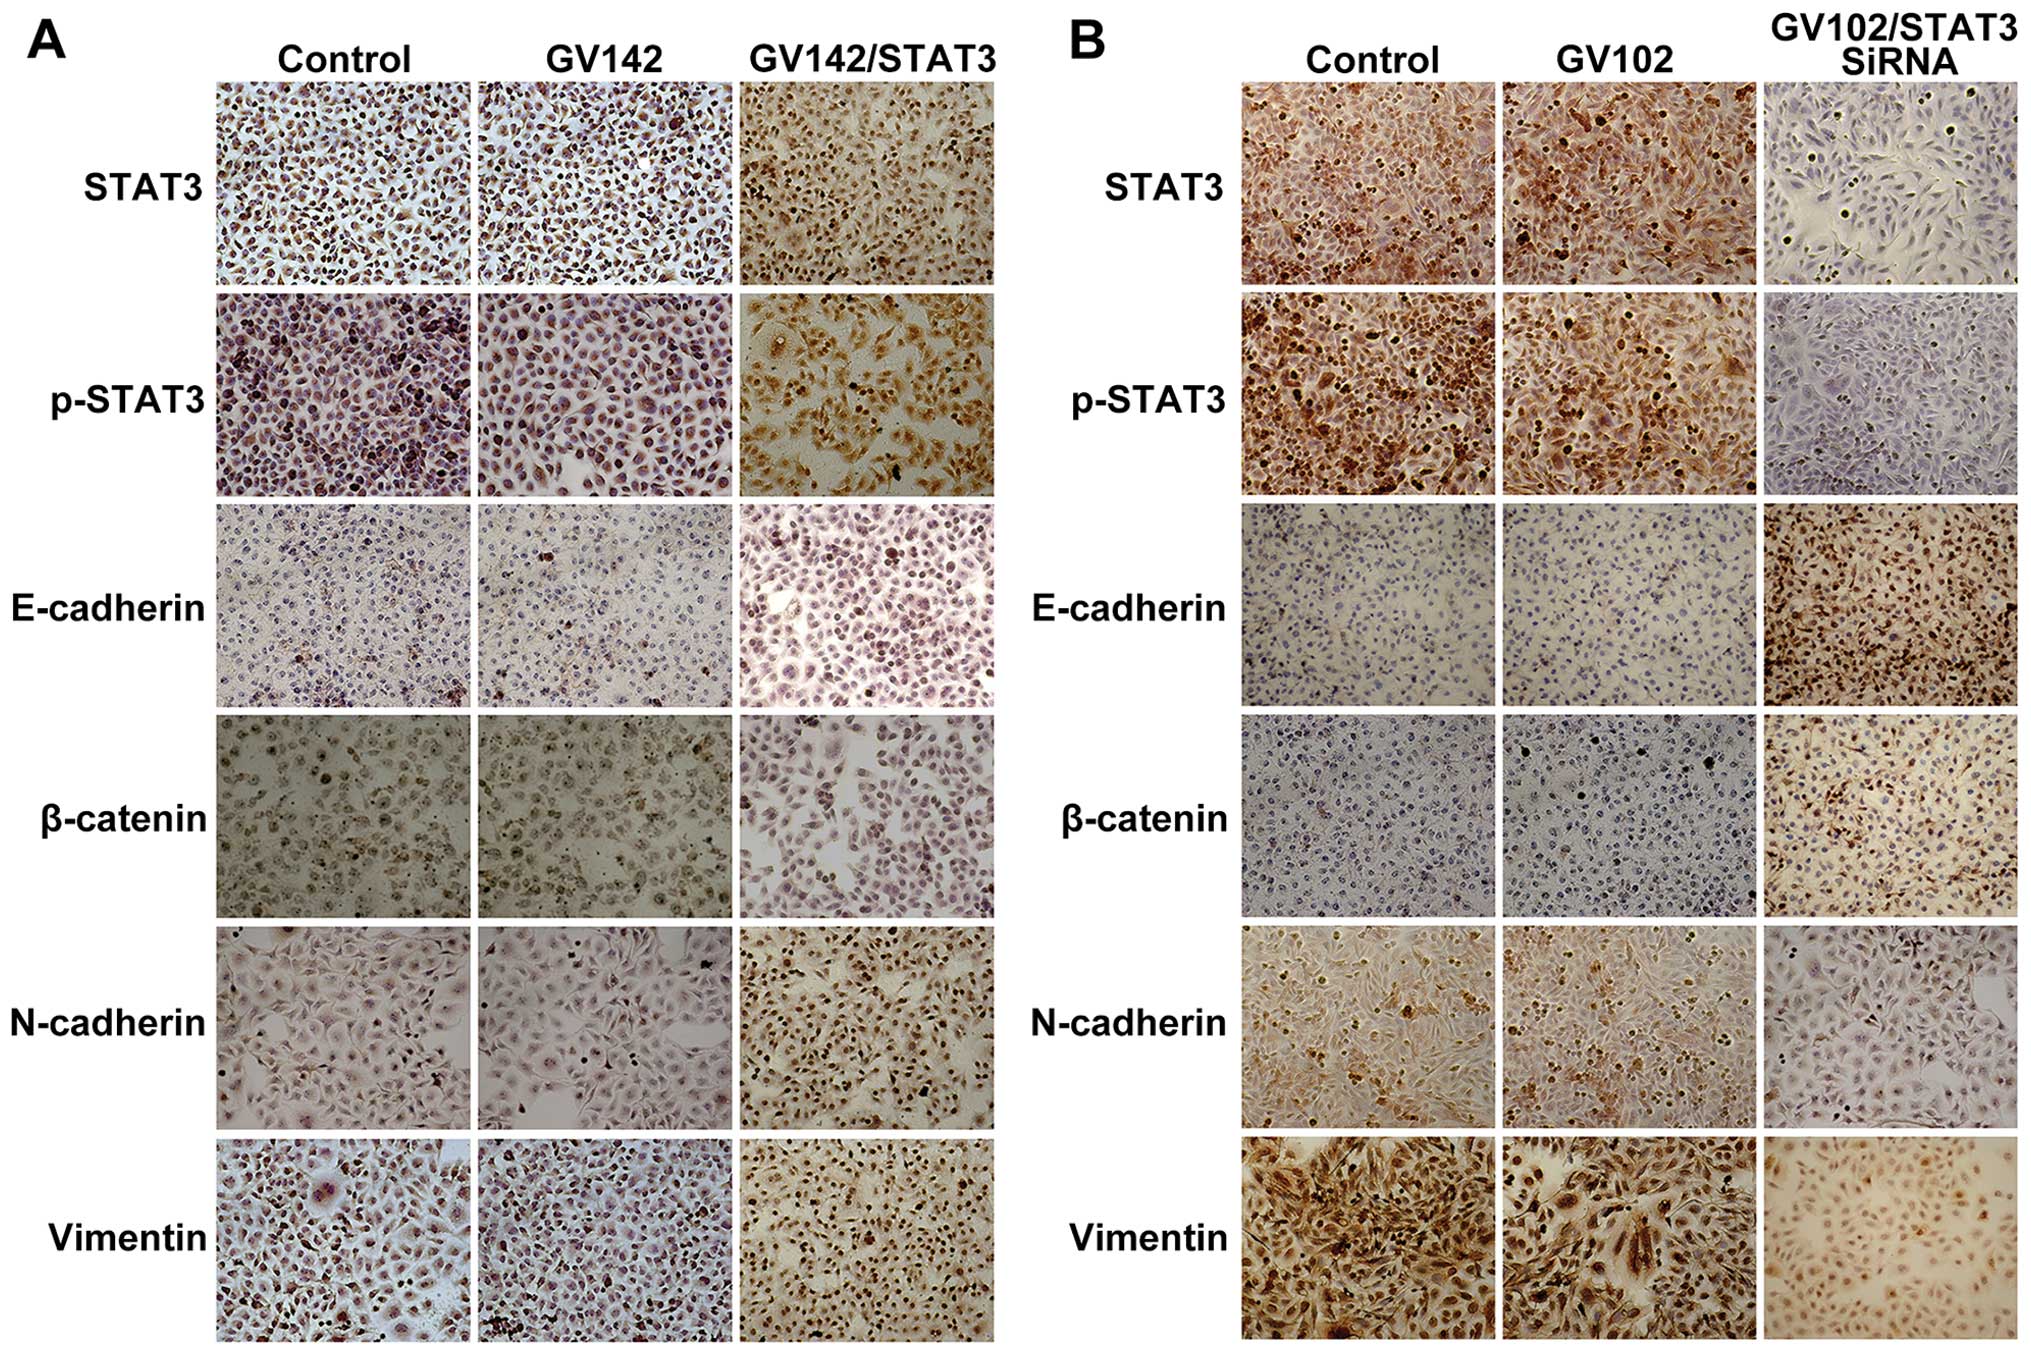 | Figure 3Effect of STAT3 on molecular changes
consistent with EMT in HCC cells. (A) STAT3, p-STAT3, E-cadherin,
β-catenin, N-cadherin and vimentin protein levels were detected by
immunocytochemistry in SMMC7721 cells (magnification, ×200). STAT3
and p-STAT3 expression was observed mainly in the cytoplasm and/or
nuclei in a focal or scattered pattern. E-cadherin and β-catenin
expression was mainly in the membranes in an evenly scattered
manner. N-cadherin and vimentin expression was mainly observed in
the cytoplasm in a focal or scattered pattern. Immunocytochemical
analyses indicated that E-cadherin and β-catenin expression levels
were significantly reduced while those of N-cadherin and vimentin
were significantly increased, as well as the elevated STAT3 and
p-STAT3 expression levels. (B) STAT3, p-STAT3, E-cadherin,
β-catenin, N-cadherin and vimentin protein levels were detected by
immunocytochemistry in MHCC97H cells (magnification, ×200).
Immunocytochemical analyses indicated that E-cadherin and β-catenin
expression levels were significantly increased while those of
N-cadherin and vimentin were significantly decreased, as well as
the reduced STAT3 and p-STAT3 expression levels. STAT3, signal
transducer and activator of transcription 3; EMT,
epithelial-to-mesenchymal transition. |
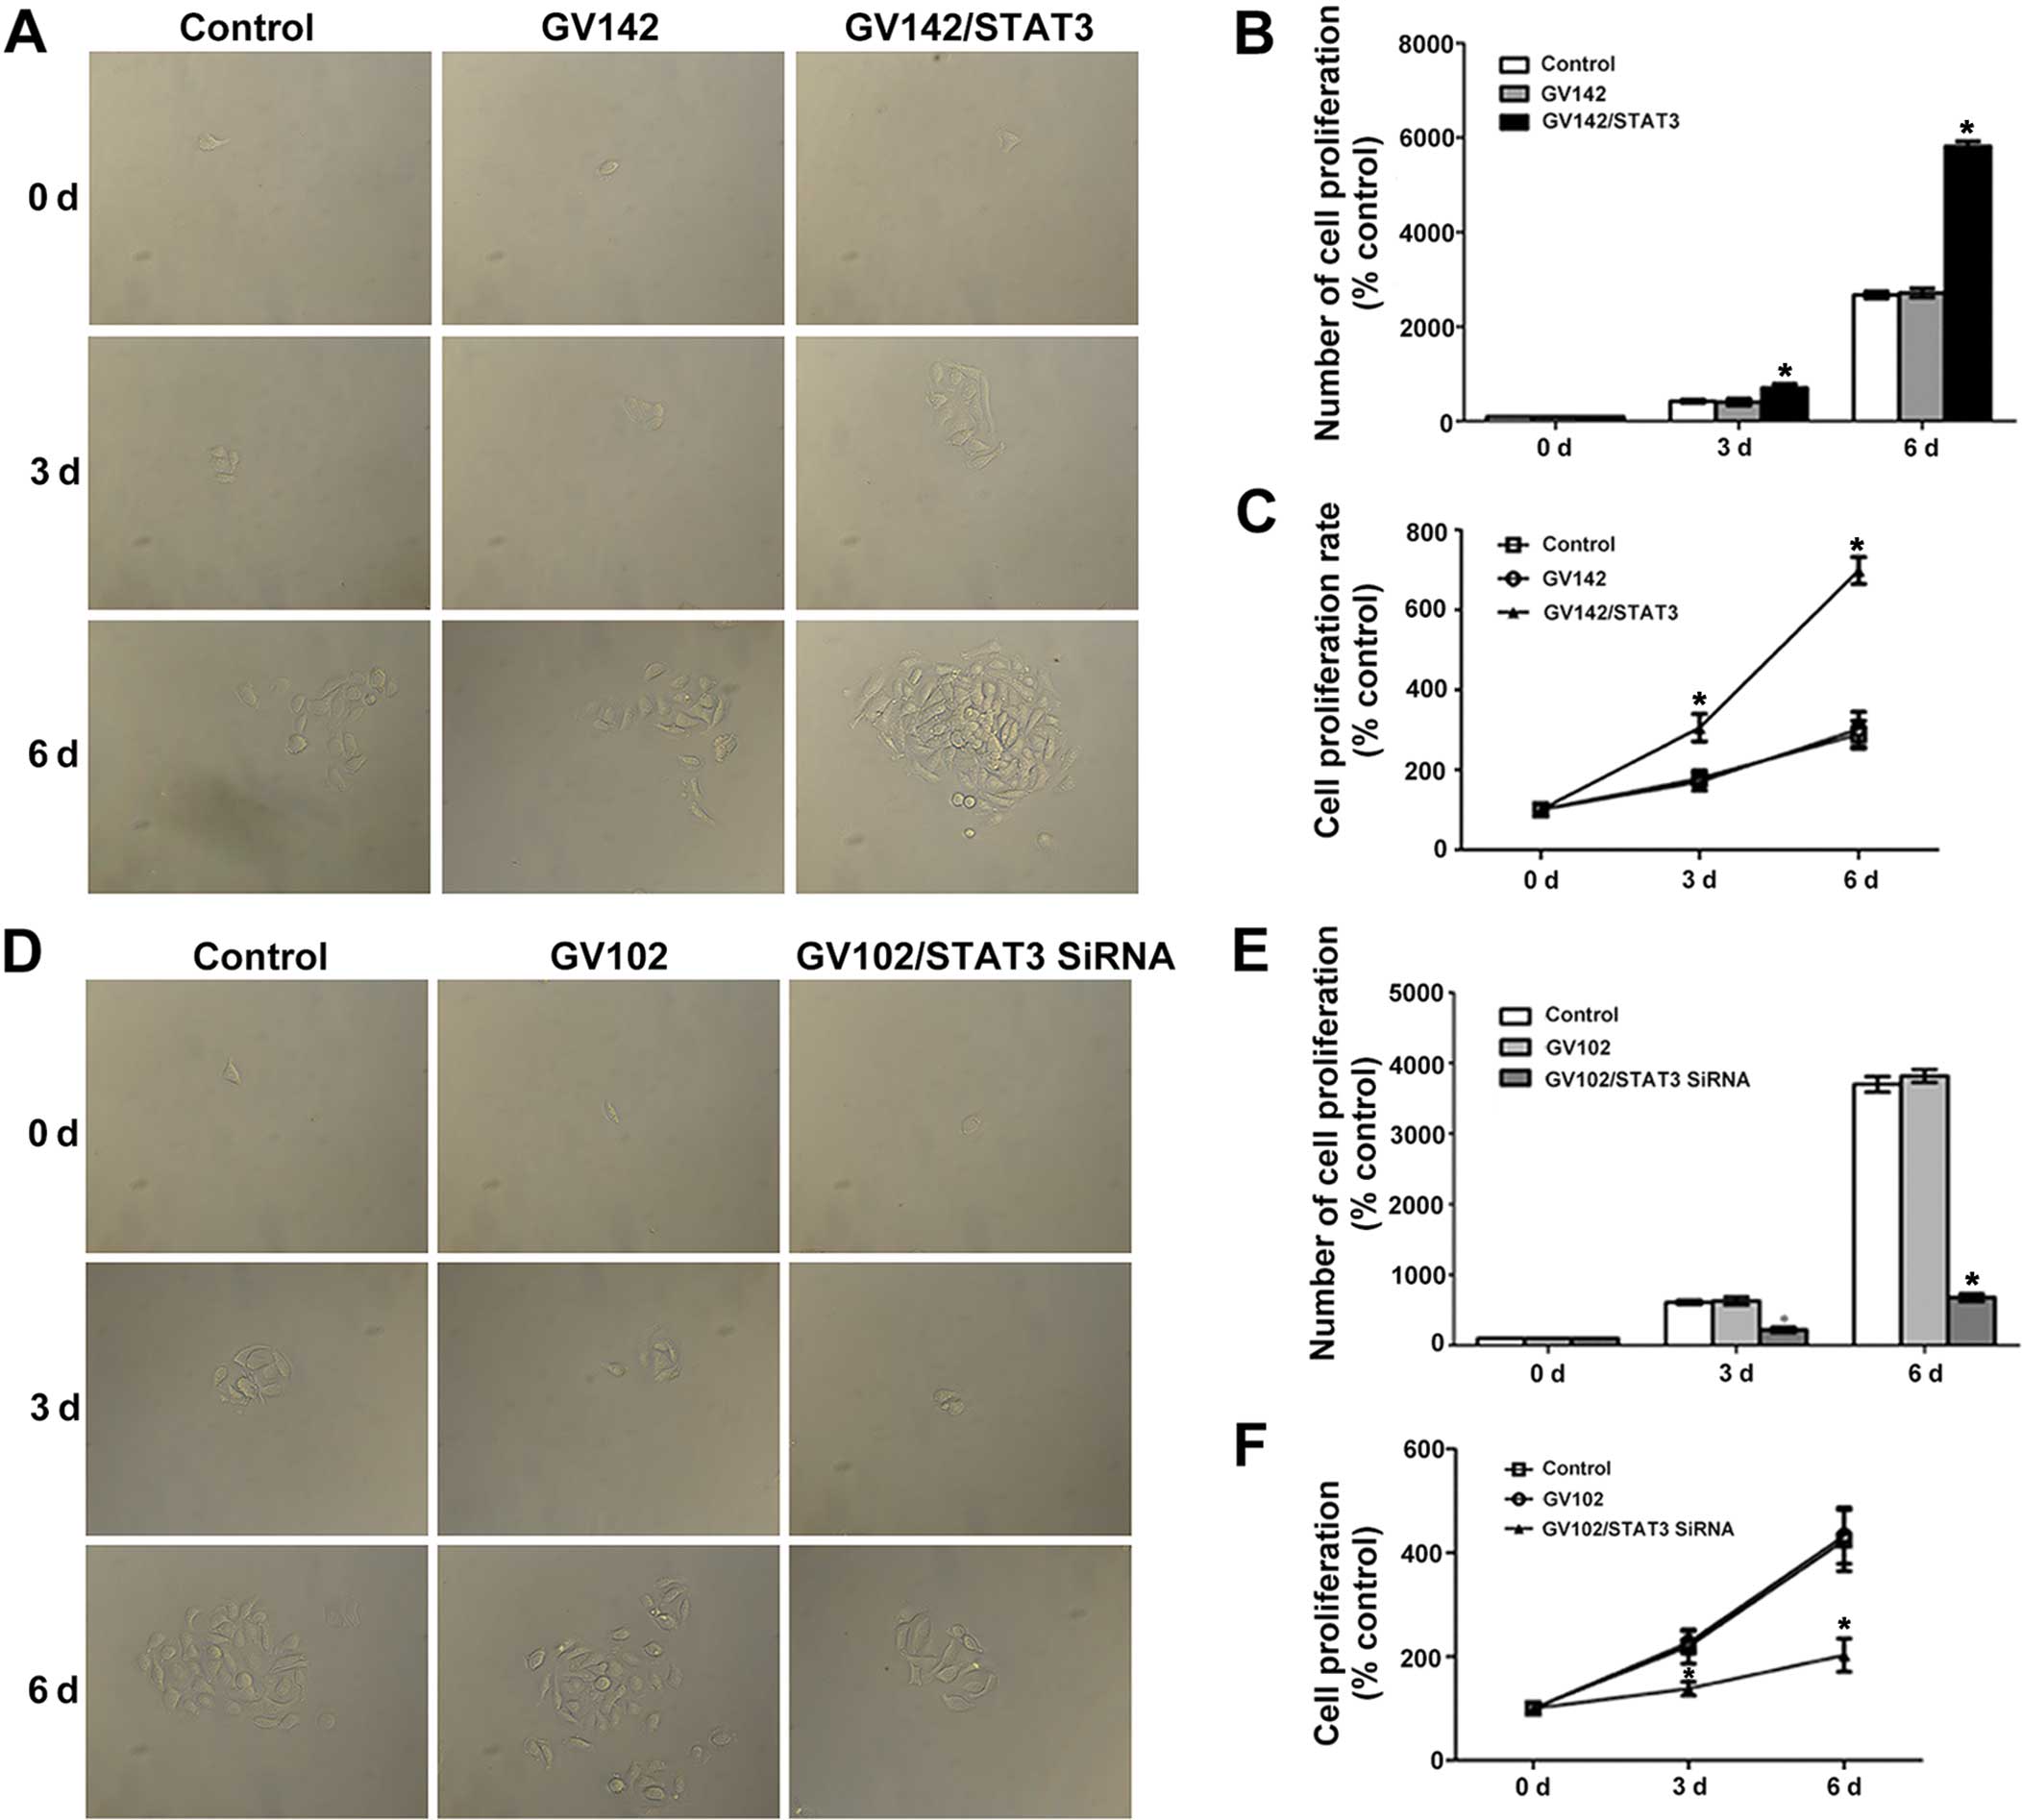
Role of STAT3 in cell proliferation,
invasion and migration in HCC cells
Results from various studies indicate that abnormal
expression or enhanced activity of STAT3 is closely associated with
tumor activities such as proliferation, differentiation and
apoptosis (17,18). Therefore, we first confirmed the
effects of the existence and activation of STAT3 on HCC
proliferation with a cell proliferation assay. Then, since EMT
induces tumor cell migration and invasion, we further assessed the
relationship between STAT3 and EMT-induced HCC cell migration and
invasion using cell invasion and cell migration assays. The cell
proliferation assay indicated that STAT3 and p-STAT3 overexpression
significantly promoted SMMC7721 cell proliferation (compared to the
control and the GV142 group, P<0.01; Fig. 4A–C), while STAT3 and p-STAT3
knockdown significantly reduced MHCC97H cell proliferation
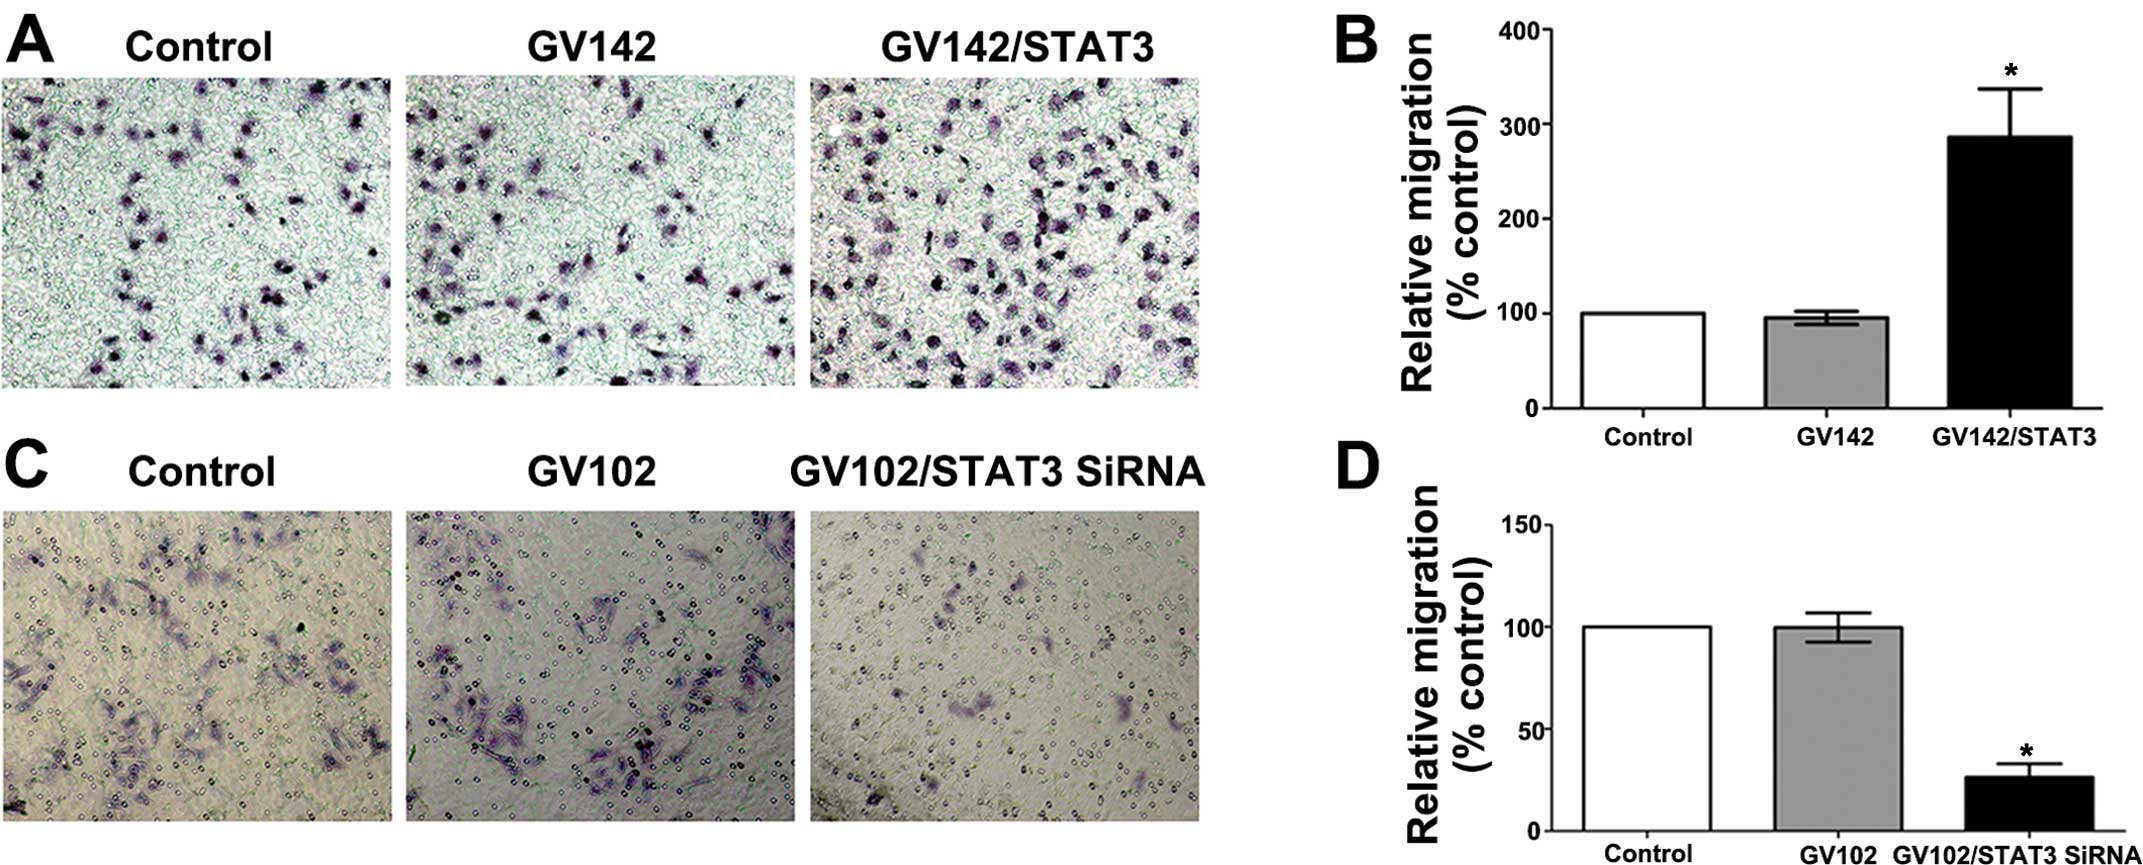
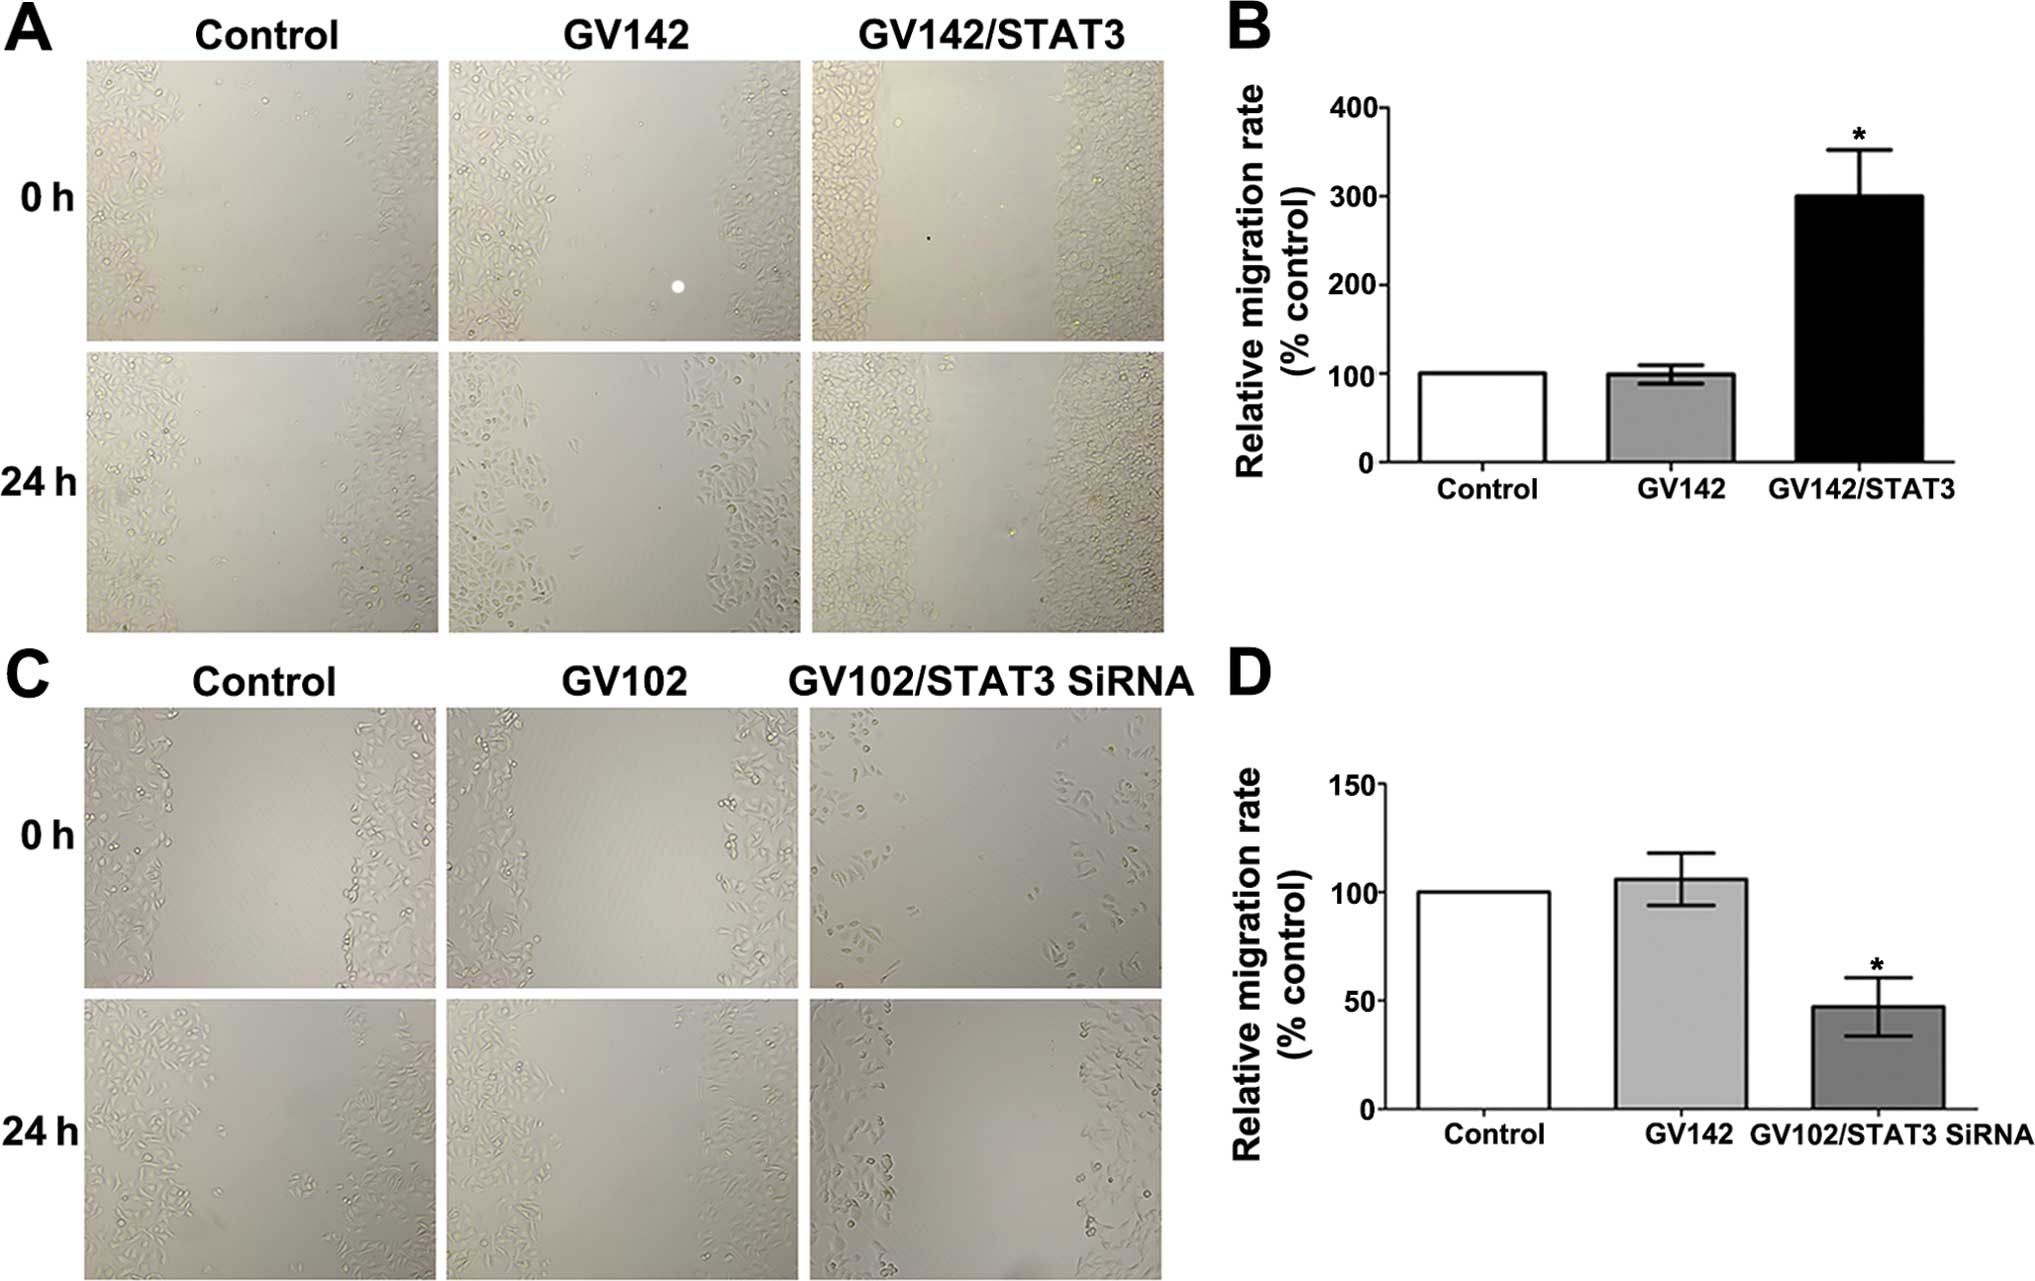
(compared to the control and the GV102 group, P<0.05; Fig. 4D–F). Cell invasion and cell
migration assays indicated that STAT3 overexpression significantly
promoted the in vitro invasion and migration of the SMMC7721
cells (compared to the control and the GV142 group, P<0.01;
Figs. 5A and B, and 6A and B), while STAT3 knockdown
significantly reduced the in vitro invasion and migration of
the MHCC97H cells (compared to the control and the GV102 group,
P<0.01; Figs. 5C and D, and
6C and D).
Effect of STAT3 on Twist expression in
HCC cells
The well-recognized key transcription factors
involved in EMT regulation include: ZEB1, Snail, SIP1 and
Twist. As a highly conserved member of the basic
helix-loop-helix (bHLH) protein family, Twist has been the most
frequently studied EMT-regulating factor in recent years and plays
an important role in embryonic development. Additionally, as a key
EMT-regulating factor, it also has significant influence on tumor
invasion (19). Lo et al
(11) and Cheng et al
(12) found that STAT3 activation
induced EMT occurrence in breast cancer via Twist upregulation. To
understand whether or not Twist is involved in the EMT induced by
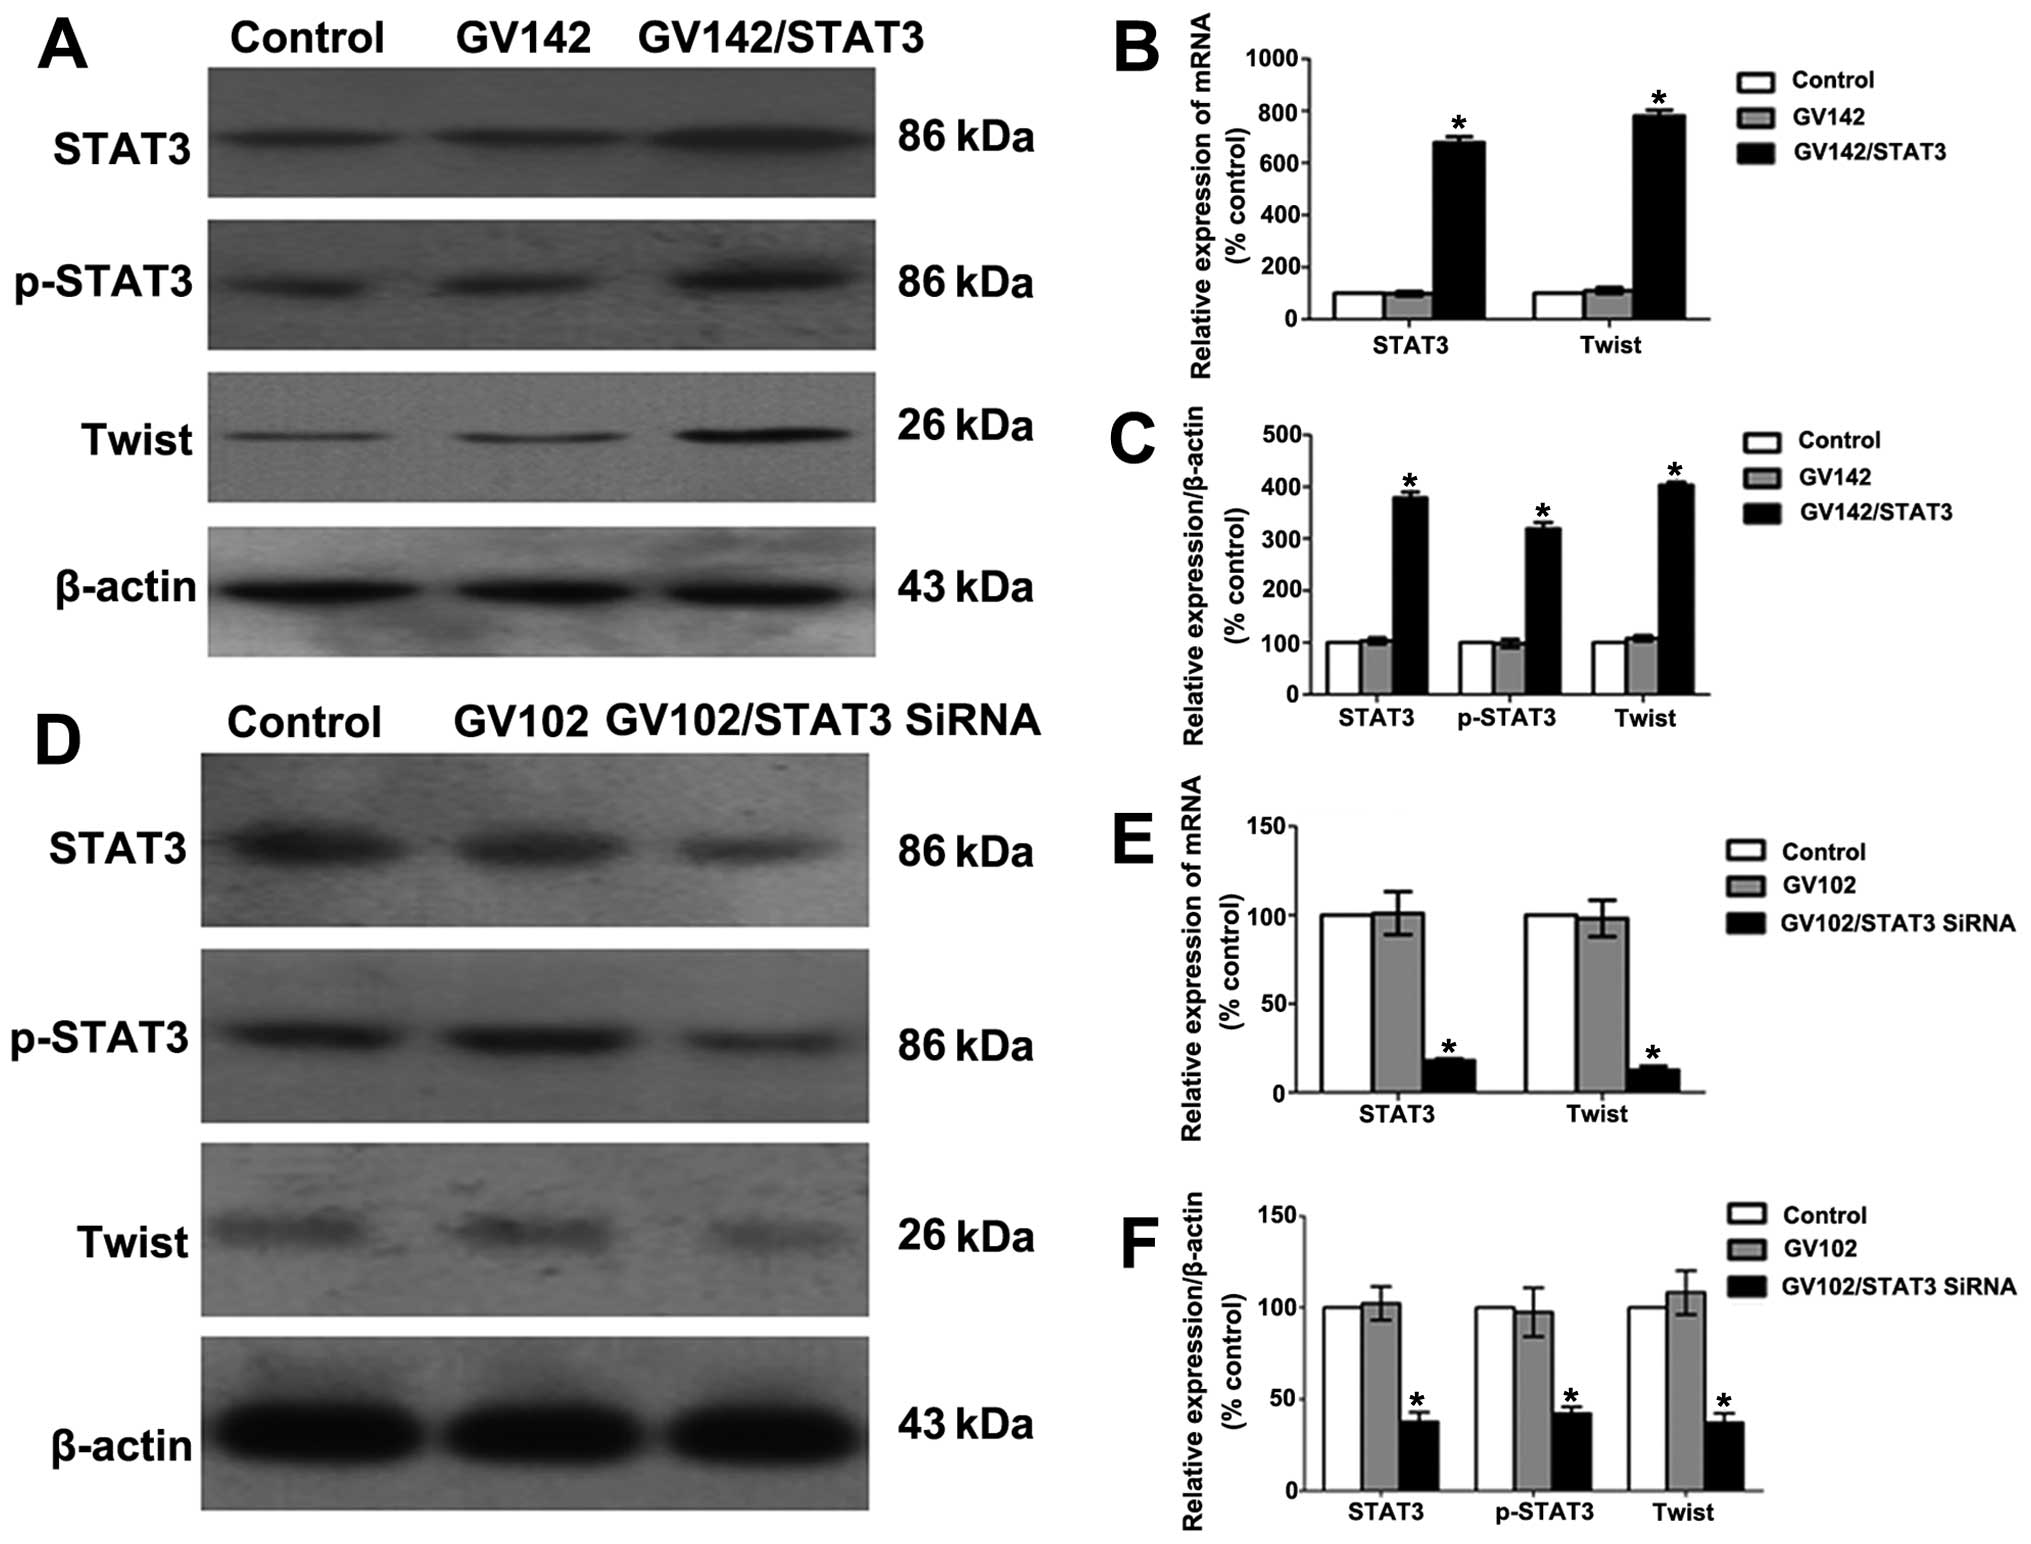
STAT3 activation in HCC cells, we first detected the effects of
altered STAT3 and p-STAT3 expression levels via real-time PCR,
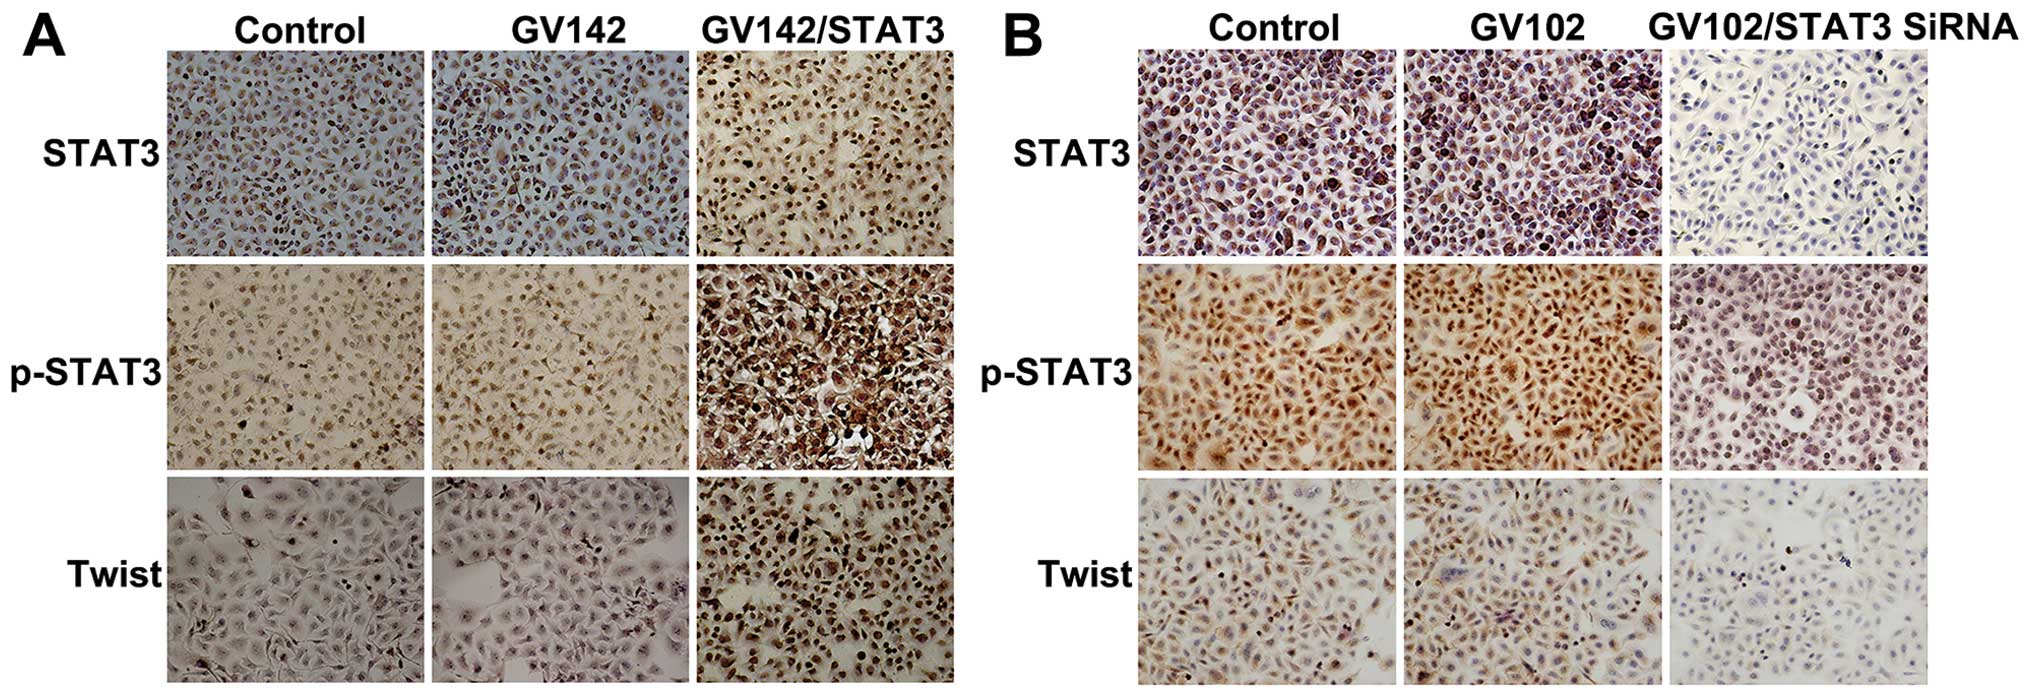
western blotting and immunocytochemistry. The results indicated
that Twist expression levels were significantly increased or
decreased following the elevation or reduction of STAT3 and p-STAT3
expression levels (compared to the control and the GV142 group,
P<0.01, Figs. 7A–C and 8A; compared to the control and the GV102
group, P<0.01, Figs. 7D–F and
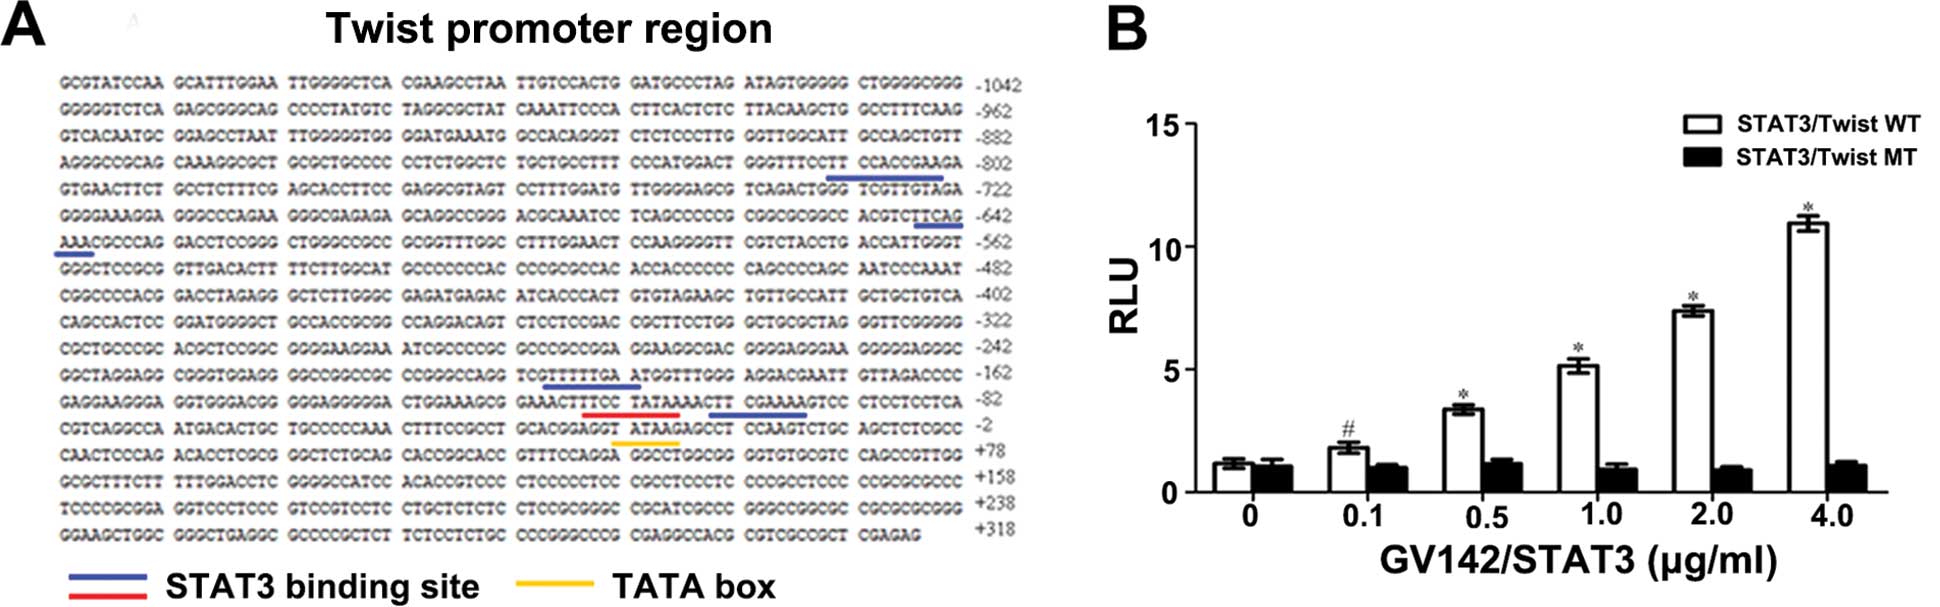
8B, respectively). To further
explore whether or not STAT3 could mediate the Twist promoter
transcriptional activity via binding with it, we identified the
correlations between the two using the dual-luciferase reporter
assay. This revealed that the RLU value of the STAT3/Twist WT group
was increased with increasing concentrations of GV142/STAT3, while
the RLU value of the STAT3/Twist MT group remained unchanged. The
difference between the two groups was significant (P<0.05 and
P<0.01, Fig. 9A and B). The
above results revealed that: i) STAT3 could bind the Twist WT
promoter and promote Twist expression; ii) when the binding site
was mutated, STAT3 barely binded Twist, indicating that this
binding site (the second closest to the initiation codon) was the
main binding site and played a dominant role in STAT3 and Twist
binding; iii) STAT3 binding and Twist promoter were
dose-dependent.
Discussion
Tumor metastasis often contributes to poor clinical
outcome for HCC patients, whereas invasion is a key step that leads
to HCC metastasis (3). Thus, it is
necessary to explore the molecular mechanisms of HCC invasion.
Increasing evidence shows that EMT, a process described first in
embryogenesis, is a crucial event that mediates tumor progression.
This includes promotion of tumor local invasion, spreading through
the blood circulation and metastasis. Although some studies have
investigated the possible role of EMT in HCC (20,21),
the upstream signaling pathways that regulate EMT remain obscure.
Presently, several studies have reported an association between
STAT3 and EMT, which is mediated through E-cadherin repressors, the
transcription factor Twist, estrogen-regulated zinc transporters
LIV-1 in breast tumors and ZEB1 in colorectal cancers (11,13,22,23).
However, to date, this link has not been investigated in HCC, and
the underlying molecular mechanisms remain elusive.
In the present study, we explored the roles of
STAT3, Twist and EMT in HCC cell invasion and migration. We found
that STAT3 activation may contribute to EMT in HCC through Twist
mediation for the following reasons. i) STAT3 overexpression
significantly reduced E-cadherin and β-cadherin and enhanced
N-cadherin and vimentin expression in SMMC7721 cells. STAT3
knockdown significantly increased E-cadherin and β-cadherin and
decreased N-cadherin and vimentin expression in MHCC97H cells. ii)
STAT3 overexpression markedly increased the invasion and migration
abilities in SMMC7721 cells, and STAT3 downregulation significantly
reduced MHCC97H cell invasion and migration abilities. iii) A dual
luciferase reporter assay indicated that STAT3 may bind to the
second STAT3-binding motif on the Twist promoter proximal to the
initial transcriptional site and then mediate its transcriptional
activity. iv) As shown in our previous study, in HCC tissue
samples, p-STAT3 was positively correlated with Twist expression,
whereas Twist was negatively correlated with E-cadherin expression.
p-STAT3, Twist or E-cadherin expression was significantly
associated with HCC invasion and metastasis (14).
EMT refers to the transformation process of
epithelial cells into mesenchymal cells, which is characterized by
downregulation of epithelial markers such as E-cadherin/catenins
and upregulation of mesenchymal markers such as N-cadherin and
vimentin. This is followed by original extracellular matrix
degeneration, and cell and matrix adhesion neogenesis, resulting in
reduced cell-cell adhesion and greatly enhanced cell motility
(14). Cell-cell and cell-matrix
connections are realized by adhesion molecules. As an important
member of the cadherin family, E-cadherin is the major adhesion
molecule mediating cell-cell adhesion in epithelial cells, the
normal function of which is critical to maintaining epithelial
tissue and cell morphology. Reduced or silenced E-cadherin
expression is believed to be the major EMT marker (19,24,25).
Since E-cadherin can hardly function alone, it usually binds
proteins such as α-catenin and β-catenin to form a complex, which
then connects to the intracellular actin microfilaments and
regulates cell morphology and movement. Downregulation, deletion
and ectopy of E-cadherin, α-catenin and β-catenin have been
correlated with tumor behaviors during invasion and metastasis
(26,27). In the present study, we determined
the effects of altered STAT3 and p-STAT3 expression on the
expression of E-cadherin, α-catenin and β-catenin. The results
revealed that E-cadherin and β-catenin levels in SMMC7721 cells
with STAT3 overexpression were significantly downregulated, while
those of the MHCC97H cells with silenced STAT3 were significantly
upregulated. This indicated that STAT3 activation may induce HCC
cell EMT. To further confirm EMT in HCC cells induced by STAT3
activation, we detected E-cadherin and β-catenin (epithelial
marker) expression, and those of N-cadherin and vimentin
(mesenchymal markers). Downregulation of E-cadherin and
upregulation of N-cadherin are important EMT markers, which is a
phenomenon termed the cadherin switch (28). In human squamous carcinoma cells,
transfection with N-cadherin was found to induce EMT and
downregulate E-cadherin (29).
Vimentin is an intermediate filament protein which plays a role in
mesenchymal cell embryonic development and differentiation.
Vimentin overexpression is often closely associated with tumor cell
invasion and migration abilities (30,31).
Our results indicated that in SMMC7721 cells with overexpressed
STAT3, E-cadherin expression levels were significantly
downregulated and expression levels of N-cadherin and vimentin were
upregulated. In MHCC97H cells with silenced STAT3 and E-cadherin
expression levels were significantly upregulated, and those of
N-cadherin and vimentin were downregulated. These results indicate
that STAT3 activation may induce the cadherin switch and mediate
EMT in HCC cells.
Research has revealed that cell invasion and
migration abilities with EMT occurrence are greatly enhanced, and
EMT is believed to be the primary event in the tumor invasion and
migration process (32). To
understand the effect of EMT induced by STAT3 activation on HCC
cell invasion and migration abilities, we first assessed the in
vitro invasion ability in HCC cells with a Transwell cell
invasion assay. The results indicated that in SMMC77211 cells with
overexpressed STAT3, the invasion ability significantly increased,
while in MHCC97H cells with silenced STAT3, the invasion ability
was significantly reduced. Additionally, migration ability is one
of the key factors that influences the tumor cell invasiveness. It
is also an essential ability during the normal tissue invasion and
transvascular activities. Multiple studies indicate that cell
migration in tumors is closely correlated with their invasiveness,
and highly invasive and metastatic tumor cells usually have strong
migration ability (32). Our cell
migration assay evaluated the in vitro migration of HCC
cells. The results indicated that in SMMC77211 cells with
overexpressed STAT3, the invasion ability was significantly
increased, while in MHCC97H cells with silenced STAT3, the invasion
ability was significantly reduced. These results imply that EMT
induced by STAT3 activation significantly promotes in vitro
HCC cell invasion and migration abilities.
Twist is a highly conserved member of the bHLH
protein family. In recent years, growing evidence shows that Twist
plays an important role in tumor development and EMT induction
(33). The known important
transcriptional factors to date include Twist, ZEB1, Snail and SIP1
(34). All are capable of
recognizing the targeted genes, such as E-box of the E-cadherin
promoter, and thus inhibit target gene transcription (33,35,36).
In 2006, Lee et al (35)
reported that Twist plays an important role in the HCC invasion
process, and identified that Twist could inhibit the epithelial
phenotype and induce mesenchymal phenotype changes. They found that
either the cell morphology or expression levels of key molecules
such as E-cadherin were significantly altered. These results
support the conclusion that Twist induces EMT occurrence and
promotes the HCC invasion process. Lo et al (11) and Cheng et al (12) found that p-STAT3 was positively
correlated with Twist in breast cancer tissues, and activated STAT3
could specifically bind the Twist promoter and help induce the
tumor invasion process. Based on the above data, to understand
whether or not Twist is involved in STAT3-induced EMT in HCC cells,
we first detected Twist expression via real-time PCR, western
blotting and immunocytochemistry. The results revealed that in
SMMC77211 cells with overexpressed STAT3, Twist expression levels
were significantly upregulated, while in MHCC97H cells with
silenced STAT3, they were significantly downregulated. Furthermore,
we confirmed that STAT3 could mediate the transcriptional activity
of the Twist promoter via targeted binding with it using the
dual-luciferase reporter assay. Combined with our previous findings
concerning the relationship among p-STAT3, Twist and E-cadherin in
HCC tissue samples, we believe that STAT3 activation can mediate
the Twist transcription and promote the EMT process in HCC. At
least, this process is partially mediated by Twist. Our present
results are consistent with the reports of Lo et al
(11) and Cheng et al
(12). Whether or not STAT3
promotes EMT in HCC via mediating other transcription factors (such
as ZEB1) warrants further investigation.
In conclusion, we conclude that STAT3 activation is
associated with EMT and subsequent induced HCC invasion and
metastasis, which is possibly transcriptionally mediated by Twist.
Our findings not only provide the molecular basis for the roles of
STAT3, Twist and EMT in HCC invasion and metastasis, yet also offer
novel targets for preventing and treating this morbid and lethal
disease.
Acknowledgements
This study was supported by a grant from the
National Nature Science Foundation of China (no. 81101877).
References
|
1
|
Kensler TW, Qian GS, Chen JG and Groopman
JD: Translational strategies for cancer prevention in liver. Nat
Rev Cancer. 3:321–329. 2003. View
Article : Google Scholar : PubMed/NCBI
|
|
2
|
Forner A, Llovet JM and Bruix J:
Hepatocellular carcinoma. Lancet. 379:1245–1255. 2012. View Article : Google Scholar : PubMed/NCBI
|
|
3
|
Tung-Ping Poon R, Fan ST and Wong J: Risk
factors, prevention, and management of postoperative recurrence
after resection of hepatocellular carcinoma. Ann Surg. 232:10–24.
2000. View Article : Google Scholar : PubMed/NCBI
|
|
4
|
Thiery JP: Epithelial-mesenchymal
transitions in tumour progression. Nat Rev Cancer. 2:442–454. 2002.
View Article : Google Scholar : PubMed/NCBI
|
|
5
|
Grünert S, Jechlinger M and Beug H:
Diverse cellular and molecular mechanisms contribute to epithelial
plasticity and metastasis. Nat Rev Mol Cell Biol. 4:657–665. 2003.
View Article : Google Scholar : PubMed/NCBI
|
|
6
|
Lee TK, Man K, Poon RT, Lo CM, Yuen AP, Ng
IO, Ng KT, Leonard W and Fan ST: Signal transducers and activators
of transcription 5b activation enhances hepatocellular carcinoma
aggressiveness through induction of epithelial-mesenchymal
transition. Cancer Res. 66:9948–9956. 2006. View Article : Google Scholar : PubMed/NCBI
|
|
7
|
Huang C, Cao J, Huang KJ, Zhang F, Jiang
T, Zhu L and Qiu ZJ: Inhibition of STAT3 activity with AG490
decreases the invasion of human pancreatic cancer cells in vitro.
Cancer Sci. 97:1417–1423. 2006. View Article : Google Scholar : PubMed/NCBI
|
|
8
|
Kusaba T, Nakayama T, Yamazumi K, Yakata
Y, Yoshizaki A, Nagayasu T and Sekine I: Expression of p-STAT3 in
human colorectal adenocarcinoma and adenoma; correlation with
clinicopathological factors. J Clin Pathol. 58:833–838. 2005.
View Article : Google Scholar : PubMed/NCBI
|
|
9
|
Suiqing C, Min Z and Lirong C:
Overexpression of phosphorylated-STAT3 correlated with the invasion
and metastasis of cutaneous squamous cell carcinoma. J Dermatol.
32:354–360. 2005. View Article : Google Scholar : PubMed/NCBI
|
|
10
|
Huang C, Yang G, Jiang T, Zhu G, Li H and
Qiu Z: The effects and mechanisms of blockage of STAT3 signaling
pathway on IL-6 inducing EMT in human pancreatic cancer cells in
vitro. Neoplasma. 58:396–405. 2011. View Article : Google Scholar : PubMed/NCBI
|
|
11
|
Lo HW, Hsu SC, Xia W, Cao X, Shih JY, Wei
Y, Abbruzzese JL, Hortobagyi GN and Hung MC: Epidermal growth
factor receptor cooperates with signal transducer and activator of
transcription 3 to induce epithelial-mesenchymal transition in
cancer cells via up-regulation of TWIST gene expression. Cancer
Res. 67:9066–9076. 2007. View Article : Google Scholar : PubMed/NCBI
|
|
12
|
Cheng GZ, Zhang WZ, Sun M, Wang Q, Coppola
D, Mansour M, Xu LM, Costanzo C, Cheng JQ and Wang LH: Twist is
transcriptionally induced by activation of STAT3 and mediates STAT3
oncogenic function. J Biol Chem. 283:14665–14673. 2008. View Article : Google Scholar : PubMed/NCBI
|
|
13
|
Xiong H, Hong J, Du W, et al: Roles of
STAT3 and ZEB1 proteins in E-cadherin down-regulation and human
colorectal cancer epithelial-mesenchymal transition. J Biol Chem.
287:5819–5832. 2012. View Article : Google Scholar :
|
|
14
|
Zhang CH, Xu GL, Jia WD, Li JS, Ma JL, Ren
WH, Ge YS, Yu JH, Liu WB and Wang W: Activation of STAT3 signal
pathway correlates with twist and E-cadherin expression in
hepatocellular carcinoma and their clinical significance. J Surg
Res. 174:120–129. 2012. View Article : Google Scholar
|
|
15
|
Zhang W, Zhu XD, Sun HC, Xiong YQ, Zhuang
PY, Xu HX, Kong LQ, Wang L, Wu WZ and Tang ZY: Depletion of
tumor-associated macrophages enhances the effect of sorafenib in
metastatic liver cancer models by antimetastatic and antiangiogenic
effects. Clin Cancer Res. 16:3420–3430. 2010. View Article : Google Scholar : PubMed/NCBI
|
|
16
|
Li Y, Tian B, Yang J, Zhao L, Wu X, Ye SL,
Liu YK and Tang ZY: Stepwise metastatic human hepatocellular
carcinoma cell model system with multiple metastatic potentials
established through consecutive in vivo selection and studies on
metastatic characteristics. J Cancer Res Clin Oncol. 130:460–468.
2004. View Article : Google Scholar : PubMed/NCBI
|
|
17
|
Levy DE and Darnell JE Jr: Stats:
Transcriptional control and biological impact. Nat Rev Mol Cell
Biol. 3:651–662. 2002. View
Article : Google Scholar : PubMed/NCBI
|
|
18
|
Xu Q, Briggs J, Park S, et al: Targeting
Stat3 blocks both HIF-1 and VEGF expression induced by multiple
oncogenic growth signaling pathways. Oncogene. 24:5552–5560. 2005.
View Article : Google Scholar : PubMed/NCBI
|
|
19
|
Yang J, Mani SA, Donaher JL, Ramaswamy S,
Itzykson RA, Come C, Savagner P, Gitelman I, Richardson A and
Weinberg RA: Twist, a master regulator of morphogenesis, plays an
essential role in tumor metastasis. Cell. 117:927–939. 2004.
View Article : Google Scholar : PubMed/NCBI
|
|
20
|
Chen L, Chan TH, Yuan YF, et al: CHD1L
promotes hepatocellular carcinoma progression and metastasis in
mice and is associated with these processes in human patients. J
Clin Invest. 120:1178–1191. 2010. View
Article : Google Scholar : PubMed/NCBI
|
|
21
|
Tang DJ, Dong SS, Ma NF, Xie D, Chen L, Fu
L, Lau SH, Li Y, Li Y and Guan XY: Overexpression of eukaryotic
initiation factor 5A2 enhances cell motility and promotes tumor
metastasis in hepatocellular carcinoma. Hepatology. 51:1255–1263.
2010. View Article : Google Scholar : PubMed/NCBI
|
|
22
|
Cho KH, Jeong KJ, Shin SC, Kang J, Park CG
and Lee HY: STAT3 mediates TGF-β1-induced TWIST1 expression and
prostate cancer invasion. Cancer Lett. 336:167–173. 2013.
View Article : Google Scholar : PubMed/NCBI
|
|
23
|
Taylor KM, Hiscox S and Nicholson RI: Zinc
transporter LIV-1: a link between cellular development and cancer
progression. Trends Endocrinol Metab. 15:461–463. 2004. View Article : Google Scholar : PubMed/NCBI
|
|
24
|
Frixen UH, Behrens J, Sachs M, Eberle G,
Voss B, Warda A, Löchner D and Birchmeier W: E-cadherin-mediated
cell-cell adhesion prevents invasiveness of human carcinoma cells.
J Cell Biol. 113:173–185. 1991. View Article : Google Scholar : PubMed/NCBI
|
|
25
|
Birchmeier W and Behrens J: Cadherin
expression in carcinomas: role in the formation of cell junctions
and the prevention of invasiveness. Biochim Biophys Acta.
1198:11–26. 1994.PubMed/NCBI
|
|
26
|
Troyanovsky S: Cadherin dimers in
cell-cell adhesion. Eur J Cell Biol. 84:225–233. 2005. View Article : Google Scholar : PubMed/NCBI
|
|
27
|
Bukholm IK, Nesland JM, Kåresen R,
Jacobsen U and Børresen-Dale AL: E-cadherin and α-, β-, and
γ-catenin protein expression in relation to metastasis in human
breast carcinoma. J Pathol. 185:262–266. 1998. View Article : Google Scholar : PubMed/NCBI
|
|
28
|
Tomita K, van Bokhoven A, van Leenders GJ,
Ruijter ET, Jansen CF, Bussemakers MJ and Schalken JA: Cadherin
switching in human prostate cancer progression. Cancer Res.
60:3650–3654. 2000.PubMed/NCBI
|
|
29
|
Islam S, Carey TE, Wolf GT, Wheelock MJ
and Johnson KR: Expression of N-cadherin by human squamous
carcinoma cells induces a scattered fibroblastic phenotype with
disrupted cell-cell adhesion. J Cell Biol. 135:1643–1654. 1996.
View Article : Google Scholar : PubMed/NCBI
|
|
30
|
Iwatsuki H, Sasaki K, Suda M and Itano C:
Vimentin intermediate filament protein as differentiation marker of
optic vesicle epithelium in the chick embryo. Acta Histochem.
101:369–382. 1999. View Article : Google Scholar : PubMed/NCBI
|
|
31
|
Hu L, Lau SH, Tzang CH, et al: Association
of Vimentin overexpression and hepatocellular carcinoma metastasis.
Oncogene. 23:298–302. 2004.
|
|
32
|
Grimstad IA: Direct evidence that cancer
cell locomotion contributes importantly to invasion. Exp Cell Res.
173:515–523. 1987. View Article : Google Scholar : PubMed/NCBI
|
|
33
|
Peinado H, Portillo F and Cano A:
Transcriptional regulation of cadherins during development and
carcinogenesis. Int J Dev Biol. 48:365–375. 2004. View Article : Google Scholar : PubMed/NCBI
|
|
34
|
Tania M, Khan MA and Fu J: Epithelial to
mesenchymal transition inducing transcription factors and
metastatic cancer. Tumour Biol. 35:7335–7342. 2014. View Article : Google Scholar : PubMed/NCBI
|
|
35
|
Lee TK, Poon RT, Yuen AP, et al: Twist
overexpression correlates with hepatocellular carcinoma metastasis
through induction of epithelial-mesenchymal transition. Clin Cancer
Res. 12:5369–5376. 2006. View Article : Google Scholar : PubMed/NCBI
|
|
36
|
Kang Y and Massagué J:
Epithelial-mesenchymal transitions: Twist in development and
metastasis. Cell. 118:277–279. 2004. View Article : Google Scholar : PubMed/NCBI
|