Introduction
Colorectal cancer is one of the most commonly
reported malignancies, and approximately one-third of patients with
advanced colorectal cancer have liver metastasis (1). Although surgical resection is the
standard treatment of colorectal cancer liver metastasis (CRLM)
(2), <20% of cases are
resectable at the initial diagnosis (3). Therefore, chemotherapy is frequently
employed to downsize CRLM prior to surgery. New regimens, including
the combination of fluorouracil and calcium folinate with
irinotecan (CPT-11) (4) or
oxaliplatin (5) have significantly
increased tumor response rates to nearly 50% (6). These regimens followed by liver
resection have been shown to improve 5-year survival rates to ~40%,
which is similar to that of patients that undergo primary liver
resection (7).
However, irinotecan has been associated with the
development of chemotherapy-associated steatohepatitis (8) and increases mortality in subsequent
hepatic surgery (9). The antitumor
activity of irinotecan is dependent on the inhibition of DNA
topoisomerase Ⅰ activity and is activated to SN-38, its active
metabolite by carboxylesterase (10). Adverse effects associated with
irinotecan such as severe neutropenia have been attributed to the
inadequate inactivation of SN-38 (11). The mechanism responsible for the
induction of steatohepatitis following the administration of
irinotecan has not yet been elucidated. Previous clinical studies
suggested that the dose or duration of the drug was not responsible
(8), whereas the interval between
chemotherapy and subsequent hepatic resection was correlated to the
rate at which steatohepatitis was induced (12). These findings suggested that the
induction of steatohepatitis may not be due to the direct toxic
effects of irinotecan on hepatocytes.
Nonalcoholic steatohepatitis (NASH) is also
characterized by similar pathological findings to those observed in
irinotecan-associated steatohepatitis (13). This lesion shows lipid accumulation
in parenchymal cells and alterations in lipid metabolism are
suggested as factors involved in its pathogenesis (14,15).
Kupffer cells have been shown to promote the inflammatory response
associated with NASH by releasing proinflammatory mediators
(16).
To explore the mechanism underlying
irinotecan-associated hepatic lesions, we investigated factors
contributing to their pathogenesis using an animal model. The
results obtained in the present study revealed that hepatic
steatosis occurred on day 18 after the last injection of irinotecan
and was preceded by fatty acid synthetase strongly-positive
hepatocytes and the activation of liver progenitor cells.
Materials and methods
Animals and animal treatment
Male Sprague-Dawley rats weighing 170–230 g, aged 6
weeks, were purchased from Clea Japan, Inc. (Shizuoka, Japan).
These rats were kept under routine laboratory conditions at the
animal laboratory of Hirosaki University. The rats received
standard laboratory chow, had free access to food and water and
were kept in a thermostatically controlled room (25°C) with a 12-h
light-dark cycle. Rats were administered 200 mg/kg irinotecan by
intraperitoneal injection on days 1–4, but not treated on days 5, 6
or 7. This schedule was repeated 3 times. Rats were sacrificed 4,
18 and 25 days after the last injection and livers were removed for
analysis. Control rat received 2 ml/body saline intraperitoneal
injections under the same schedule, and were sacrificed on day 18.
Three rats were used for each time point. The present study was
carried out in accordance with the Guidelines for Animal
Experimentation of Hirosaki University, and all animals received
humane care according to the criteria outlined in the ‘Guide for
the Care and Use of Laboratory Animals’ prepared by the National
Academy of Sciences and published by the National Institutes of
Health (NIH publication 86–23, revised 1985).
Microarray analysis
Total RNA was extracted from frozen liver samples
with TRIzol reagent (Invitrogen, Carlsbad, CA, USA). Equal amounts
of RNA from 3 individual livers were combined and 10 μg of
RNA was used for biotin-labeled complementary RNA (cRNA). Labeled
and fragmented cRNA was subsequently hybridized to the GeneChip Rat
Gene 1.0 ST Array (Affymetrix, Santa Clara, CA, USA). Labeling,
hybridization, image scanning and data analysis were performed at
Kurabo Industries Ltd. (Osaka, Japan).
Quantitative real-time polymerase chain
reaction (RT-PCR)
Complementary DNA (cDNA) was reverse-transcribed
from 1 μg of total RNA using the Omniscript RT kit (Qiagen,
Tokyo, Japan). A MiniOpticon Detection System and SYBR-Green
Supermix (both from Bio-Rad Laboratories, Hercules, CA, USA) were
used for the quantification of specific messenger RNA (mRNA). The
amplification of β-actin cDNA was performed to standardize target
cDNA levels. Gene-specific primers were designed according to known
rat sequences (Table I). No
non-specific PCR products, as detected by melting temperature
curves, were found in any case. After normalizing the expression of
the target gene to the expression of β-actin, the level of the
expressed mRNA in each sample was expressed relative to the control
values.
 | Table IRT-PCR primer sequences. |
Table I
RT-PCR primer sequences.
| Gene | 5′-Primer
(5′–3′) | 3′-Primer
(5′–3′) |
|---|
| Hmgcr |
GCCCAAAATTTGAAGAGGACGTG |
CCGAGAAAGCTCTAGGACCAGGG |
| Idi1 |
TGAAAACATTGACAAAGGACTAATACATCGAG |
TCATTTCATTTAGATCAACCTCTTCCAAGG |
| Sqle |
TCCAAGAGGCGCAGAAAAGAAGTC |
TGTATCTCCAAGGCCCAGCTCTC |
| Cyp7a1 |
GAATTGCCGTGTTGGTGAGCTG |
GCTTCTGTGTCCAAATGCCTTCG |
| Abcg5 |
TTCAGCGTCAGCAACCGTGTC |
TGTCAGGACTGCCTCTACCTTCTTGTC |
| Abcb11 |
TTTTCCAGAGGCAGCTATCG |
ATGGCTGCACTCAAAGATCC |
| Slc10a1 |
AGGCATGATCATCACCTTCC |
AAGTGGCCCAATGACTTCAG |
| Ugt2b |
ACATTTTACAGTGAGATTTTGGGAAGGC |
AGGATGTCATTCTGCGGGAGC |
| Fasn |
TCCCAGGTCTTGCCGTGC |
GCGGATGCCTAGGATGTGTGC |
| Acss2 |
GCTTTTTACTGGGAGGGCAATGAG |
CCTTCTCTCGGCACTTCTCCAAG |
| Acsm5 |
GCTTGTATGCGAACAGGTGTGGTC |
CCTTCCACTGGCCACAAAACC |
| Acsl5 |
ATTGAGGGAGGAGCACGGAGAG |
TCAGCTCTGTTGATGACATAGATGATGG |
| Elovl6 |
CTCTTGCGGTCTTCAGTATATTCGGTG |
TCCTCAGAATGATGAATATCGTATCACCTAGTTC |
| Egr1 |
AGCACCTGACCACAGAGTCCTTTTC |
ACGGCACGGCACAGCTC |
| Cxcl9 |
TCGAGGAACCCTAGTGATAAGGAATCAG |
TTTGCTTTTTCTTTTGGCTGATCTTTTTC |
| Ly6c |
GTGTGCAGAAAGAGCTCAGGGC |
TGTCCGTCTTACAGAGCCCTCTACAG |
| β-actin |
GTACCACTGGCATTGTGATG |
ATCTTCATGGTGCTAGGAGC |
Immunohistochemistry
Tissue samples of livers were fixed in 10% neutral
buffered formaldehyde and embedded in paraffin. These paraffin
blocks were sliced into 4-μm thick sections for hematoxylin
and eosin (H&E) staining, periodic acid-Schiff (PAS) staining
and immunostaining for carbonic anhydrase 3 (CA3), CD68, CD163,
chemokine (C-X-C motif) ligand 9 (Cxcl9), cytokeratin 19 and fatty
acid synthase (Fasn). Immunohistochemical staining was performed on
deparaffinized sections using the standard avidin-biotin-peroxidase
complex method with an automated immunostainer (Benchmark XT;
Ventana Medical System, Tucson, AZ, USA). The primary antibodies
used were: anti-CD68 antibody from AbD serotec (MCA341R) (Oxford,
UK), anti-CD163 antibody from Santa Cruz Biotechnology (sc-58965)
(Santa Cruz, CA, USA), anti-Cxcl9 antibody from Bioss (bs-2551R)
(Boston, MA, USA), anti-cytokeratin 19 antibody from Bioworld
Technology, Inc. (BS3540) (St. Louis Park, MN, USA), anti-Fasn
antibody from Abcam (ab22759) (Cambridge, UK). Anti-CA3 antibodies
were prepared as described by Takahata et al (17). Non-immune γ-globulin was used for
the negative controls instead of the primary antibodies. Images
were captured with an Olympus FSX100 microscope (Olympus, Tokyo,
Japan). Digital images were processed with Adobe Photoshop (Adobe,
San Jose, CA, USA) and ImageJ software (Wayne Rasband NIH,
Bethesda, MD, USA). The percentage of intracellular vacuoles and
number of Fasn-strongly-positive cells were compared between areas
around the central vein (CV) and bile ducts (BD).
Statistical analysis
Data are presented as means ± SD. Statistical
evaluations were performed using the two-tailed Student’s t-test.
Differences were considered to indicate a significant result with
p-values <0.05.
Results
Induction of intrahepatocyte vacuoles
after irinotecan injection
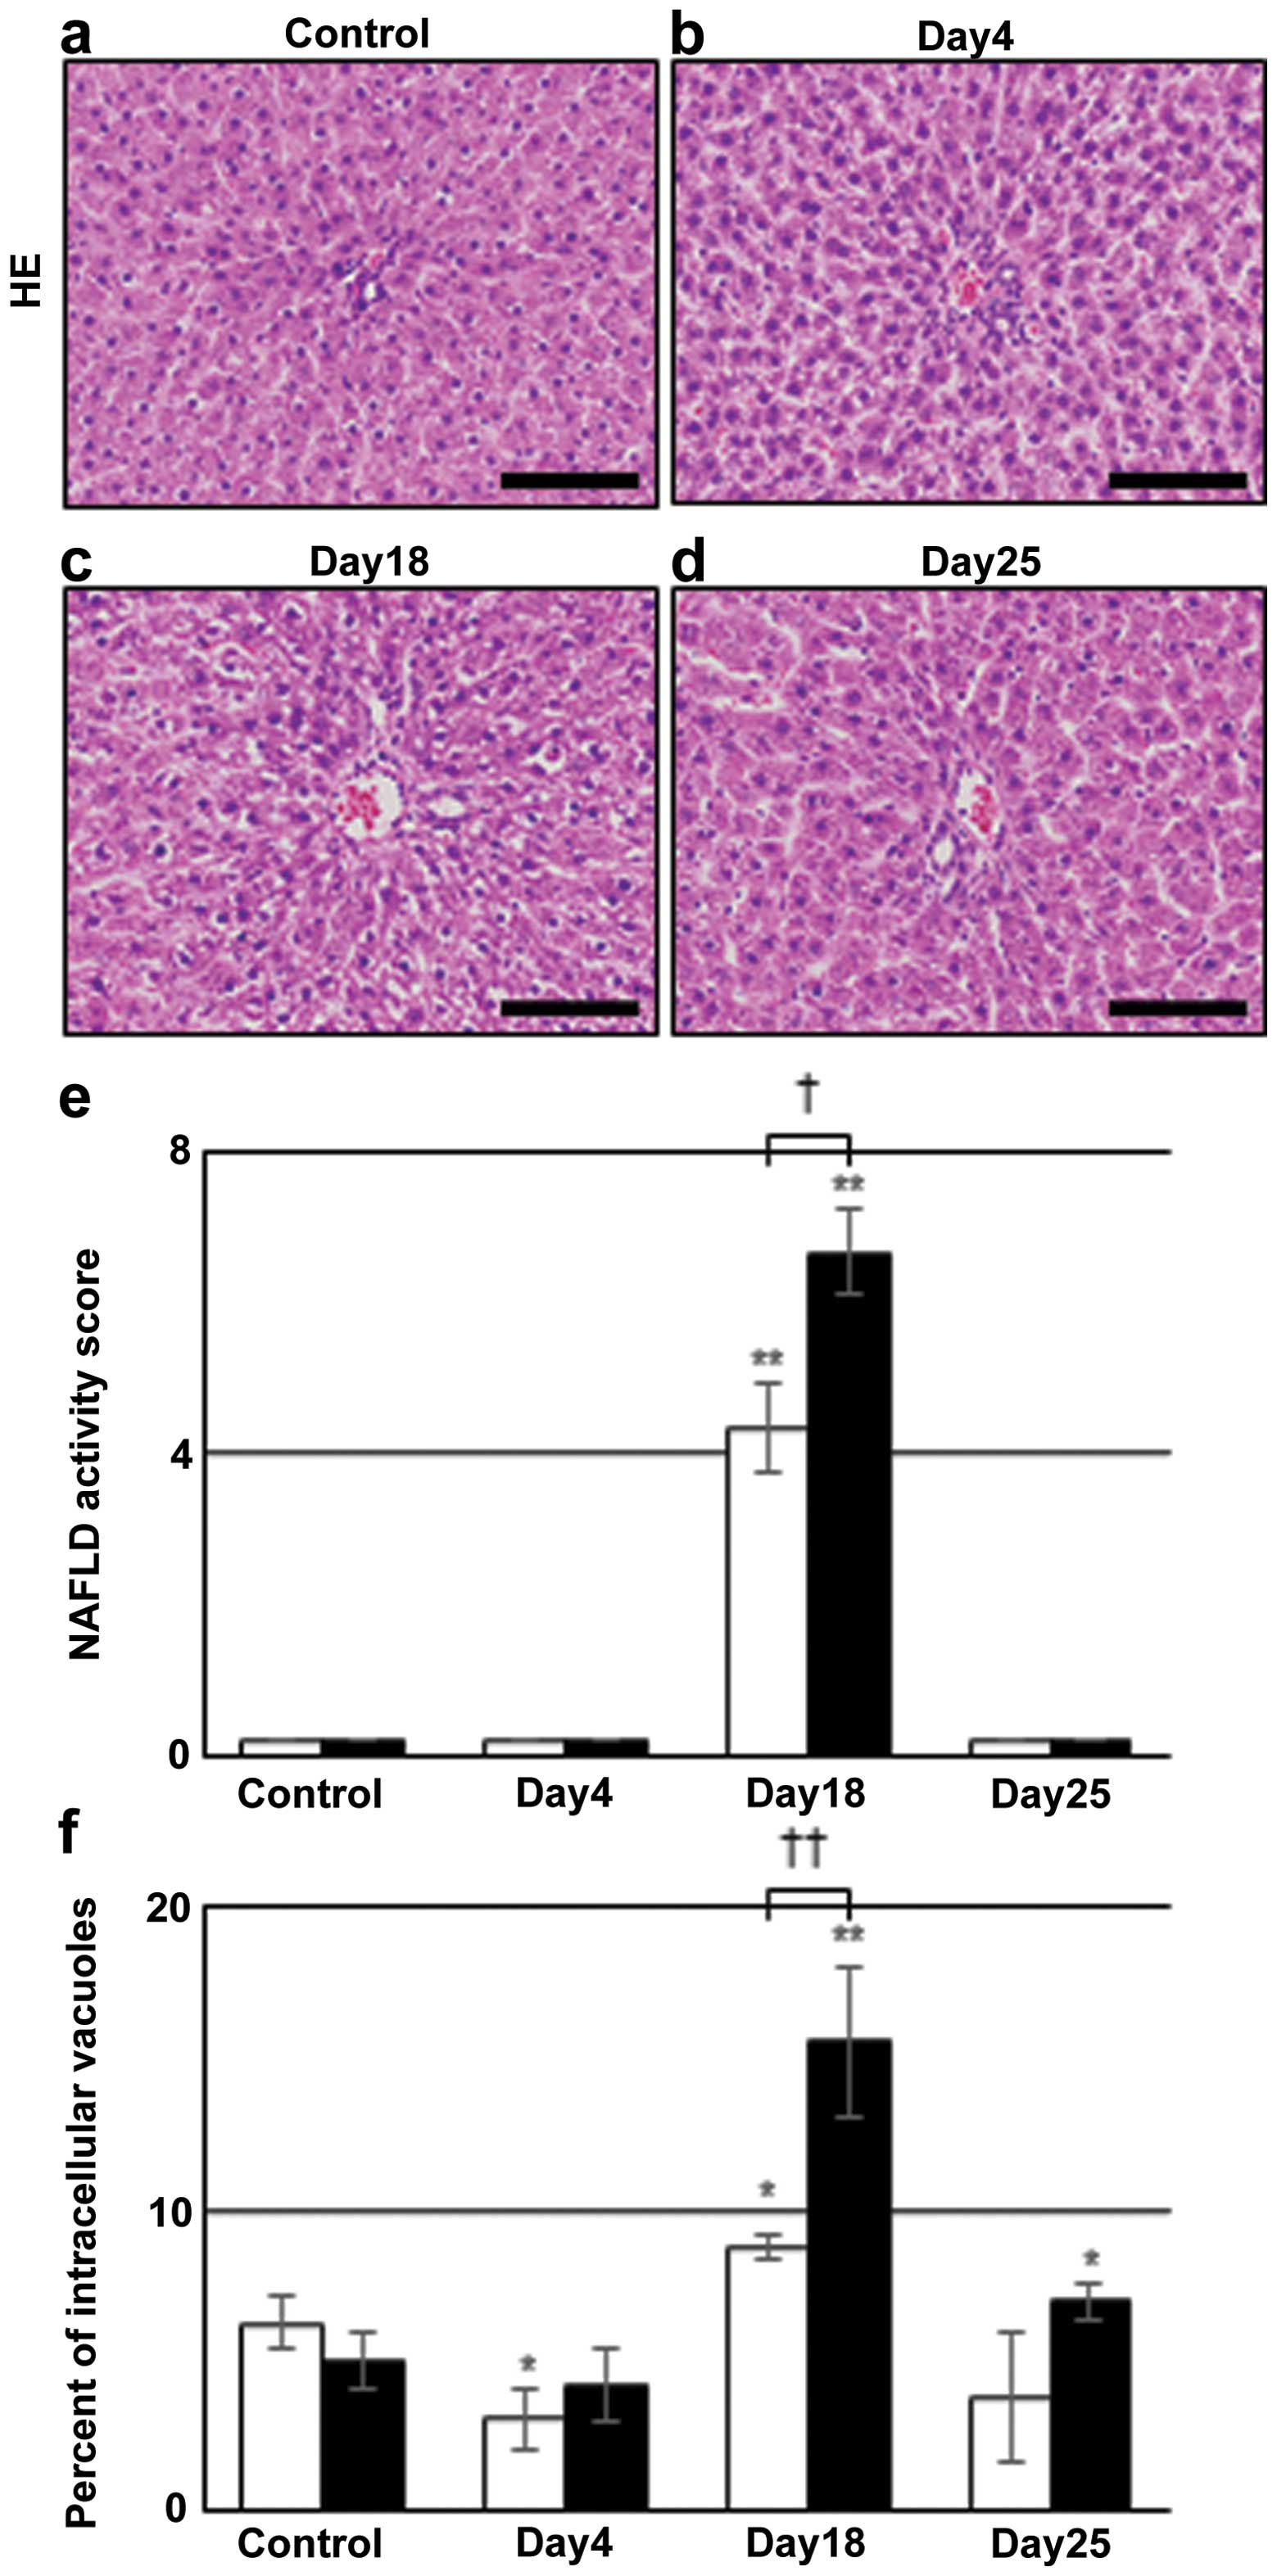
Liver sections from rats administered irinotecan
were evaluated by H&E staining and the results are shown in
Fig. 1a–d. Although no significant
difference was observed between control and day 4 (Fig. 1a and b), panacinar intrahepatocyte
vacuoles were detected on day 18 (Fig.
1c), and they had disappeared by day 25 (Fig. 1d). To evaluate the degree of
intracellular vacuoles quantitatively, two methods were used.
Firstly, we used nonalcoholic fatty liver disease (NAFLD) activity
score on H&E-stained liver sections, according to Kleiner et
al (14). The value around CV
was 4.7±0.6, while that around BD was 6.7±0.6 on day 18. These
values were 0 in control and days 4 and 25 in the irinotecan group
(Fig. 1e). Another method used was
the percentage of intracellular vacuoles per unit area calculated
by subtracting sinusoid areas from the unstained areas of
H&E-stained sections. Comparing with the control, this value
around BD was significantly increased to 15.6±2.5 on day 18 and
7.0±0.6 on day 25 (closed bars in Fig.
1f). The value around CV was lower on day 4, but was higher at
8.8±0.4 on day 18 (open bars). These results suggested that hepatic
steatosis was induced by irinotecan administration, prominent on
day 18, and was more severe around BD than CV.
Intracellular vacuole formation in
CA3-positive hepatocytes
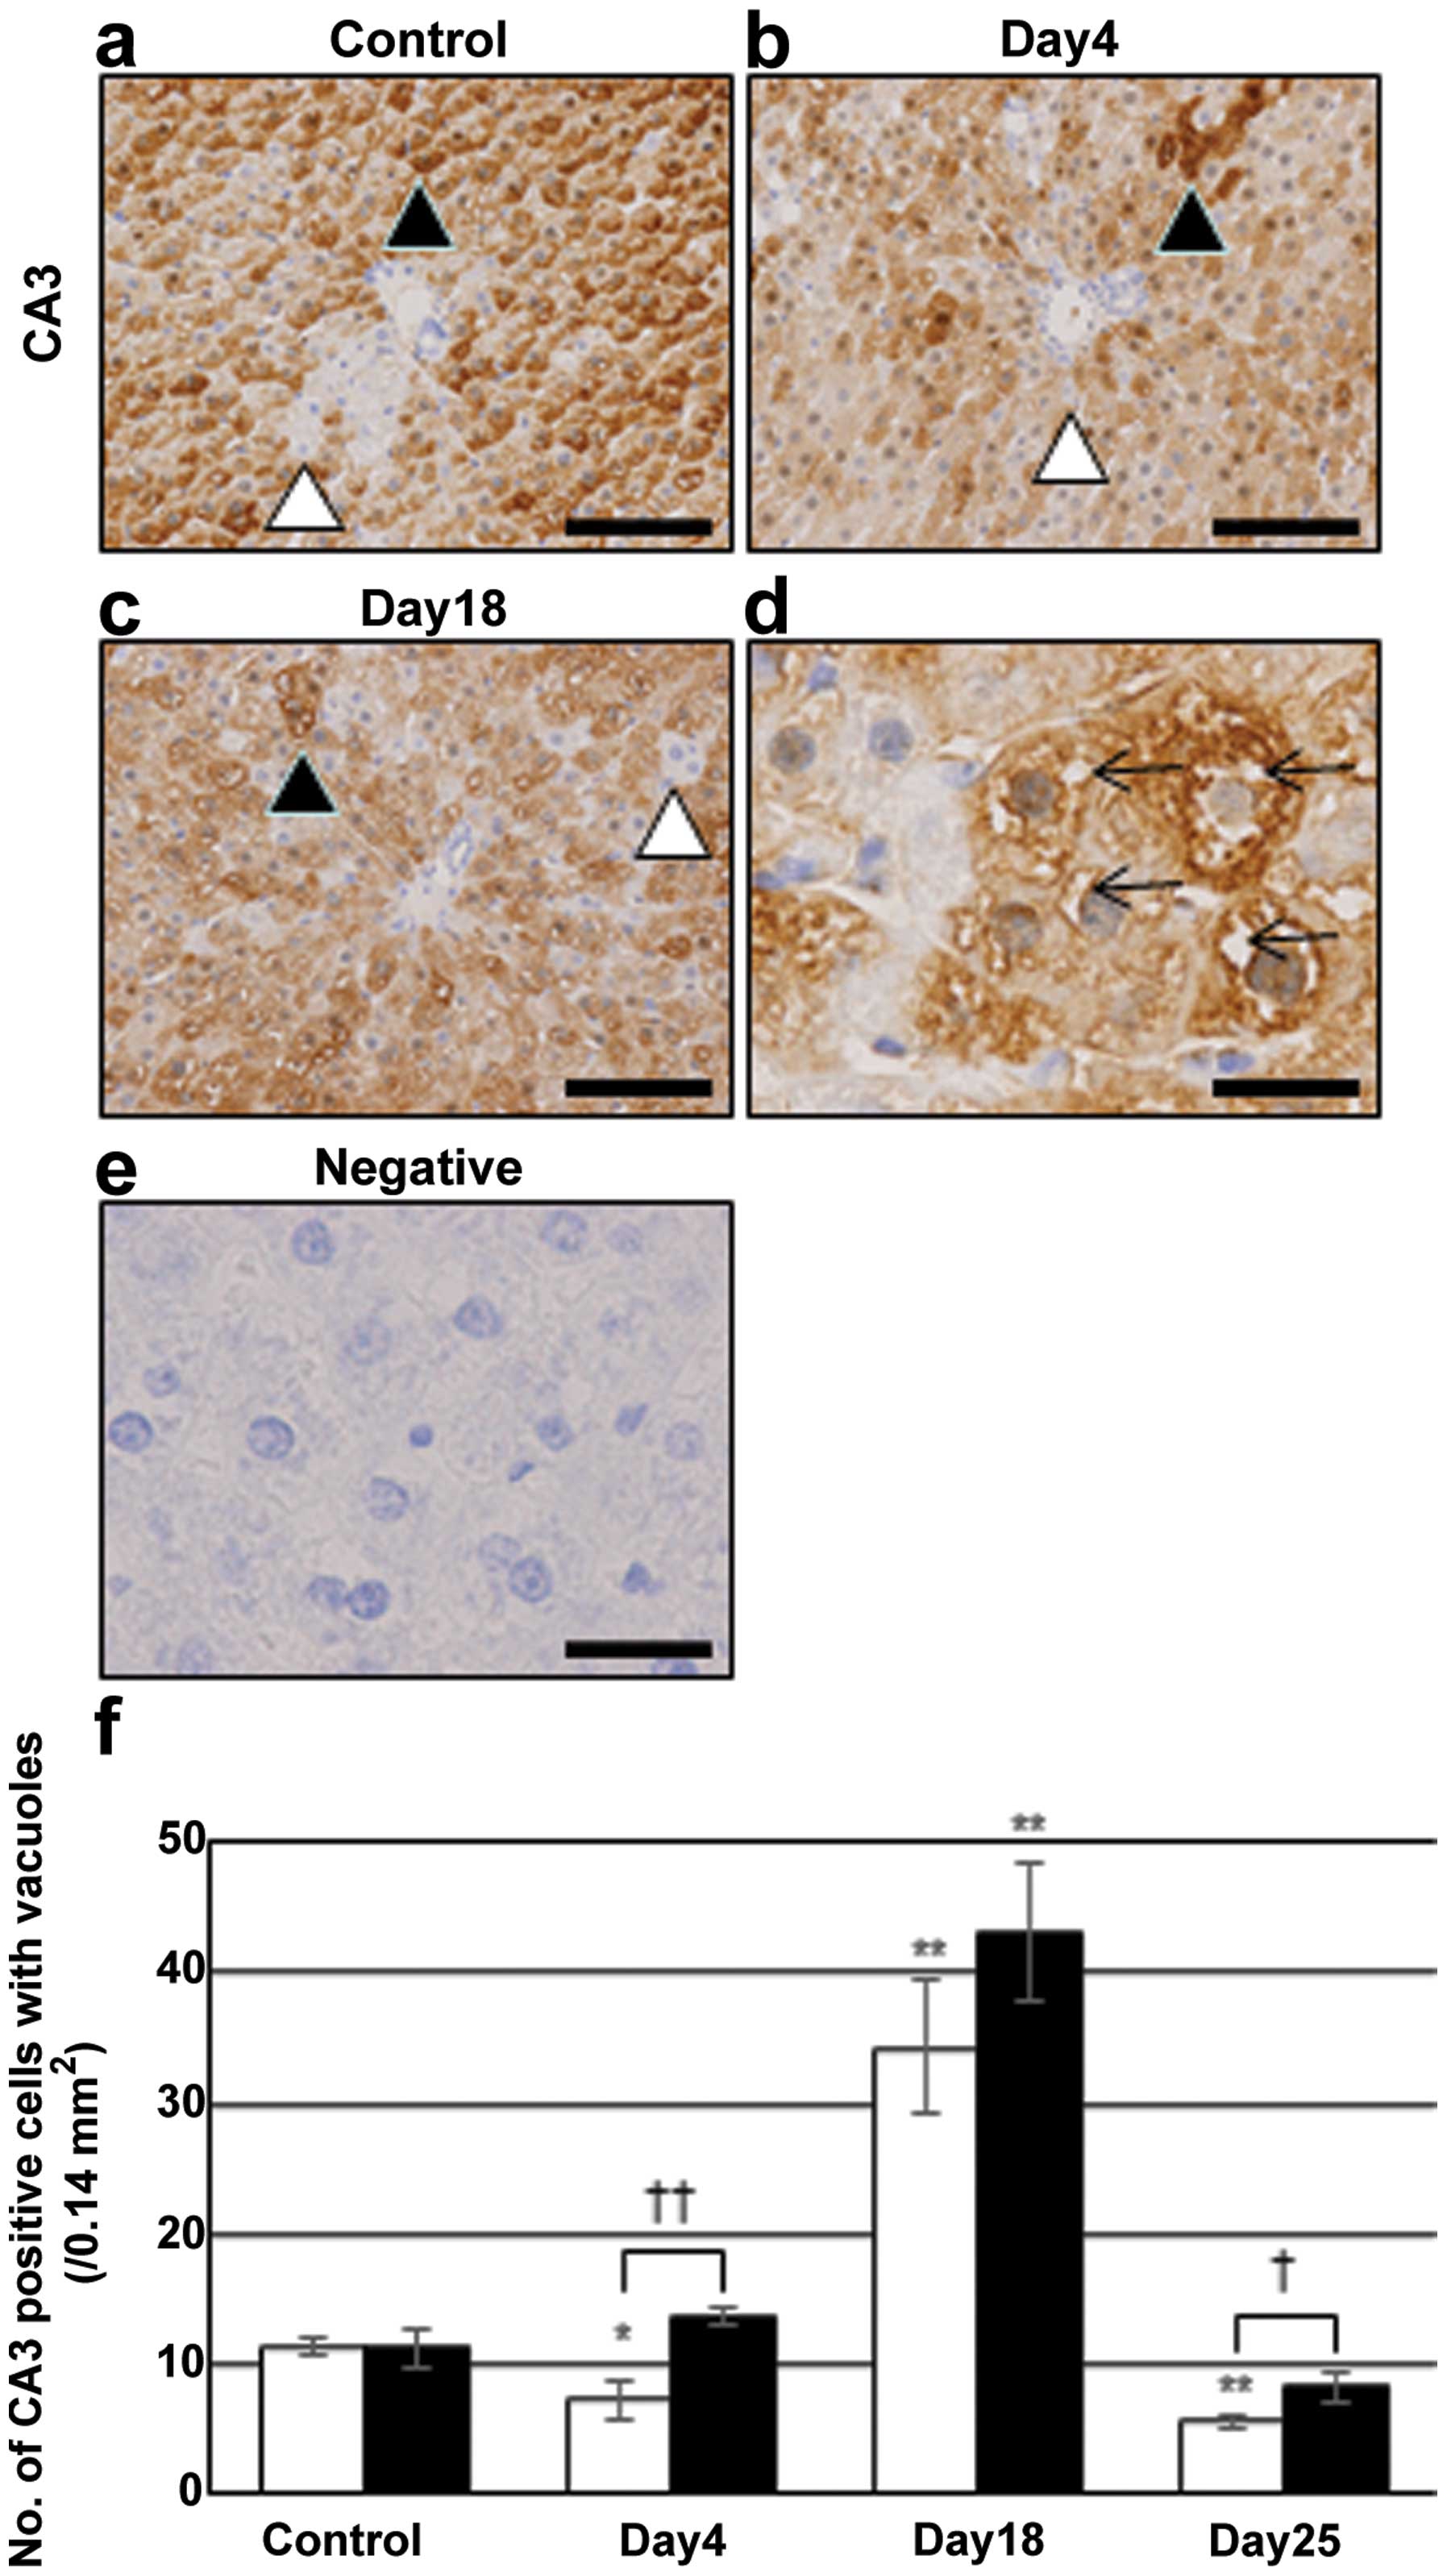
The expression of CA3, a marker for lipogenesis
(18), was immunohistochemically
evaluated to assess the presence of vacuoles in lipid-storing
hepatocytes. Many hepatocytes were positive for CA3 (closed
arrowheads in Fig. 2), but some
cells were negative (open arrowheads). The number of CA3-positive
hepatocytes was not changed after irinotecan injection. Vacuole
formation in hepatocytes was easily detectable by this staining.
Such vacuoles in CA3-positive cells were not observed in the
control (Fig. 2a), or irinotecan
group on day 4 (Fig. 2b) or 25
(data not shown), but were observed on day 18 (Fig. 2c and d). CA3-positive hepatocytes
with vacuoles were mainly distributed around BD, which was
consistent with the results from H&E-stained liver sections
(Fig. 1).
Enhanced expression of genes for
cholesterol and fatty acid synthesis
Gene expression profiles were examined using
microarray analysis in order to identify the genes responsible for
inducing steatosis (Table II)
(19). This revealed that the
expression of genes involved in the synthesis of cholesterol and
fatty acids was upregulated on day 4. The upregulated genes for the
synthesis of cholesterol include Acly, Hmgcr,
Mvd, Sqle and Dhcr7. Genes for the synthesis
(Cyp7a1), export (Abcg5 and Abcc3), and
conjugation (Ugt2a3 and Ugt2b) of bile acids were
also upregulated. The expression of genes for the metabolism of
fatty acids [Fasn (20),
Elovl6 and Acss2) was also enhanced. Sterol
regulatory element-binding proteins 1 and 2 (Srebp1 and 2) have
been shown to regulate the transcription of genes involved in the
synthesis of cholesterol and fatty acids (21), while insulin-induced gene 1 (Insig1)
and SREBP cleavage-activating protein (Scap) mediate the activation
of Srebp1 and 2 (22,23). Insig1 and Scap were
upregulated on day 4. The expression of other transcription factors
involved in lipid metabolism, Egr1 (24) and Nr1i3 (CAR)
(25), was unchanged on day 4, yet
upregulated by day 18. The expression of genes associated with the
cell cycle and DNA replication (Ccnb1, Rrm2 and
Top2a) was downregulated on day 4, yet upregulated on days
18 and 25. A gene related to endoplasmic reticulum stress,
eukaryotic translation initiation factor 2α kinase 4
(Eif2ak4) (26) was
upregulated on days 4 and 18. The expression of Kupffer cell marker
genes, except for Cxcl9, remained unchanged. No significant
differences were observed in the expression of sinusoid and
stellate cell marker genes. The expression of the liver progenitor
cell marker genes, Krt19 and Epcam, was upregulated
on day 4. To confirm the microarray results, some mRNA levels of
cholesterol, bile acid and fatty acid synthesis were quantified by
RT-PCR (Table III). Hmgcr,
Sqle and Cyp7a1 mRNA were increased on day 4, as
compared with control values. Fasn and Acss2 mRNA
levels were increased on days 4 and 18. Egr1 mRNA was
markedly increased on day 18. Cxcl9 was downregulated on
days 4 and 18.
| Table IIThe results of microarray analysis in
control and irinotecan group at days 4, 18 and 25. |
Table II
The results of microarray analysis in
control and irinotecan group at days 4, 18 and 25.
| Cellular function
and gene name | Gene symbol | Signal
|
|---|
| Control | Day 4 | Day 18 | Day 25 |
|---|
| Cholesterol
synthesis |
| Citrate |
| ATP-citrate
lyase | Acly | 2,096 | 5,121 | 2,511 | 1,700 |
| Acetyl-CoA |
| Acetoacetyl-CoA
synthetase | Aacs | 91 | 1,462 | 309 | 226 |
| HMG-CoA synthase
1 | Hmgcs1 | 2,691 | 8,433 | 4,088 | 5,586 |
| HMG-CoA
reductase | Hmgcr | 1,001 | 5,012 | 1,878 | 1,276 |
| Mevalonate |
| Mevalonate
pyrophosphate decarboxylase | Mvd | 265 | 1578 | 495 | 478 |
|
Isopentenyl-diphosphate Δ-isomerase
1 | Idi1 | 488 | 2467 | 675 | 933 |
| Squalene |
| Squalene
epoxidase | Sqle | 362 | 2,980 | 980 | 870 |
| Lanosterol |
| Cytochrome P450,
family 51 | Cyp51 | 3,430 | 8,418 | 4,975 | 4,194 |
|
7-Dehydrocholesterol reductase | Dhcr7 | 1,408 | 4,582 | 1,912 | 1,996 |
| Bile acid
synthesis | | | | | |
| Cytochrome P450,
family 7, subfamily a, polypeptide 1 | Cyp7a1 | 1,242 | 7,299 | 1,671 | 1,250 |
| Cytochrome P450,
family 27, subfamily a, polypeptide 1 | Cyp27a1 | 2,228 | 5,076 | 2,781 | 3,078 |
| Cholesterol and
bile acid export |
| Bile
canaliculus |
| ATP-binding
cassette sub-family G member 5 | Abcg5 | 515 | 1,345 | 827 | 542 |
| ATP-binding
cassette sub-family G member 8 | Abcg8 | 222 | 794 | 476 | 169 |
| Sinusoid |
| ATP-binding
cassette, sub-family C (CFTR/MRP), member 3 | Abcc3 | 230 | 1,583 | 595 | 297 |
| Bile acid
conjugation |
| UDP
glucuronosyltransferase 2 family, polypeptide A3 | Ugt2a3 | 1,852 | 3,972 | 2,538 | 2,912 |
| UDP
glucuronosyltransferase 2 family, polypeptide B | Ugt2b | 20 | 6,163 | 4,034 | 4,731 |
| Fatty acid
synthesis |
| Fatty acid
synthase | Fasn | 2,096 | 5,140 | 2,650 | 1,687 |
| Elongation of long
chain fatty acid member 6 | Elovl6 | 461 | 5,188 | 500 | 571 |
| Acyl-CoA
synthetase |
| Acyl-CoA
synthetase short-chain family member 2 | Acss2 | 1,367 | 6,140 | 2,190 | 1,892 |
| Acyl-CoA
synthetase medium-chain family member 2 | Acsm2 | 251 | 1,199 | 820 | 213 |
| Acyl-CoA
synthetase long-chain family member 5 | Acsl5 | 3,079 | 5,723 | 4,308 | 3,181 |
| Transcription
factor |
| Sterol regulatory
element-binding factor 2 | Srebf2 | 1,068 | 1,826 | 1,365 | 1,358 |
| Insulin induced
gene 1 | Insig1 | 1,734 | 6,462 | 3,397 | 3,819 |
| SREBP
cleavage-activating protein | Scap | 888 | 1,779 | 1,014 | 900 |
| Early growth
response 1 | Egr1 | 629 | 761 | 2,932 | 1,308 |
| Nuclear receptor
subfamily 1, group I, member 3 | Nr1i3 | 563 | 792 | 1,469 | 1,210 |
| DNA |
| Cell cycle |
| Cyclin B1 | Ccnb1 | 99 | 48 | 267 | 195 |
| Cyclin-dependent
kinase inhibitor 3 | Cdkn3 | 128 | 50 | 271 | 172 |
| DNA
replication |
| Ribonucleotide
reductase M2 | Rrm2 | 156 | 60 | 378 | 534 |
| Topoisomerase
(DNA) IIα | Top2a | 154 | 71 | 391 | 376 |
| Mitosis |
| Cell division
cycle 20 homolog (S. cerevisiae) | Cdc20 | 165 | 103 | 293 | 343 |
| Cytoskeleton
associated protein 2 | Ckap2 | 77 | 33 | 175 | 154 |
| ER stress |
| Eukaryotic
translation initiation factor 2α kinase 4 | Eif2ak4 | 314 | 549 | 402 | 337 |
| Kupffer cells |
| CD68 molecule | Cd68 | 612 | 722 | 654 | 761 |
| CD163
molecule | Cd163 | 747 | 831 | 713 | 691 |
| Mannose receptor,
C type 1 | Mrc1 | 1,383 | 1,408 | 1,317 | 1,402 |
| Chemokine (C-X-C
motif) ligand 1 | Cxcl1 | 251 | 710 | 540 | 371 |
| Chemokine (C-X-C
motif) ligand 9 | Cxcl9 | 1,118 | 282 | 423 | 923 |
| Monocytes |
| Ly6-C antigen | Ly6c | 219 | 144 | 500 | 560 |
| Sinusoids |
| CD34 molecule | Cd34 | 100 | 93 | 98 | 101 |
| Stellate cells |
| Collagen, type I,
α1 | Col1a1 | 320 | 395 | 582 | 397 |
| Collagen, type I,
α2 | Col1a2 | 426 | 532 | 610 | 405 |
| Desmin | Des | 133 | 171 | 116 | 108 |
| Liver progenitor
cells |
| Cytokeratin
19 | Krt19 | 111 | 224 | 155 | 115 |
| Epithelial cell
adhesion molecule | Epcam | 236 | 545 | 242 | 185 |
| Table IIIThe mRNA by RT-PCR evaluation for
cholesterol and fatty acid metabolism in control and irinotecan
group. |
Table III
The mRNA by RT-PCR evaluation for
cholesterol and fatty acid metabolism in control and irinotecan
group.
| Cellular function
and gene name | Gene symbol | Signal
|
|---|
| Control | Day 4 | Day 18 | Day 25 |
|---|
| Cholesterol
synthesis |
| HMG-CoA
reductase | Hmgcr | 1 | 10.14 | 1.07 | 1.97 |
|
Isopentenyl-diphosphate Δ-isomerase
1 | Idi1 | 1 | 9.9 | 1.07 | 0.92 |
| Squalene
epoxidase | Sqle | 1 | 55.19 | 12.54 | 6.7 |
| Bile acid
synthesis |
| Cytochrome P450,
family 7, subfamily a, polypeptide 1 | Cyp7a1 | 1 | 7.73 | 1.91 | 0.59 |
| Cholesterol and
bile acid export |
| ATP-binding
cassette, sub-family G member 5 | Abcg5 | 1 | 1.17 | 1.88 | 0.55 |
| ATP-binding
cassette, sub-family B (MDR/TAP), member 11 | Abcb11 | 1 | 1.07 | 1.02 | 1.11 |
| Solute carrier
family 10 (sodium/bile acid co-transporter family), member 1 | Slc10a1 | 1 | 1.24 | 0.87 | 1.84 |
| Bile acid
conjugation |
| UDP
glucuronosyltransferase 2 family, polypeptide B | Ugt2b | 1 | 7,362 | 3,310 | 2,392 |
| Fatty acid
synthesis |
| Fatty acid
synthase | Fasn | 1 | 3.58 | 3.85 | 0.81 |
| Acyl-CoA
synthetase short-chain family member 2 | Acss2 | 1 | 12.11 | 6.9 | 2.14 |
| Acyl-CoA
synthetase medium-chain family member 5 | Acsm5 | 1 | 11.94 | 22.49 | 6.03 |
| Acyl-CoA
synthetase long-chain family member 5 | Acsl5 | 1 | 5.53 | 6.74 | 1.99 |
| Elongation of long
chain fatty acid member 6 | Elovl6 | 1 | 20.23 | 1.19 | 0.55 |
| Transcription
factor |
| Early growth
response 1 | Egr1 | 1 | 3.55 | 23.32 | 6.16 |
| Kupffer cells |
| Chemokine (C-X-C
motif) ligand 9 | Cxcl9 | 1 | 0.2 | 0.34 | 0.51 |
| Monocytes |
| Ly6-C antigen | Ly6c | 1 | 0.55 | 1.26 | 1.62 |
Appearance of Fasn-strongly-positive
hepatocytes
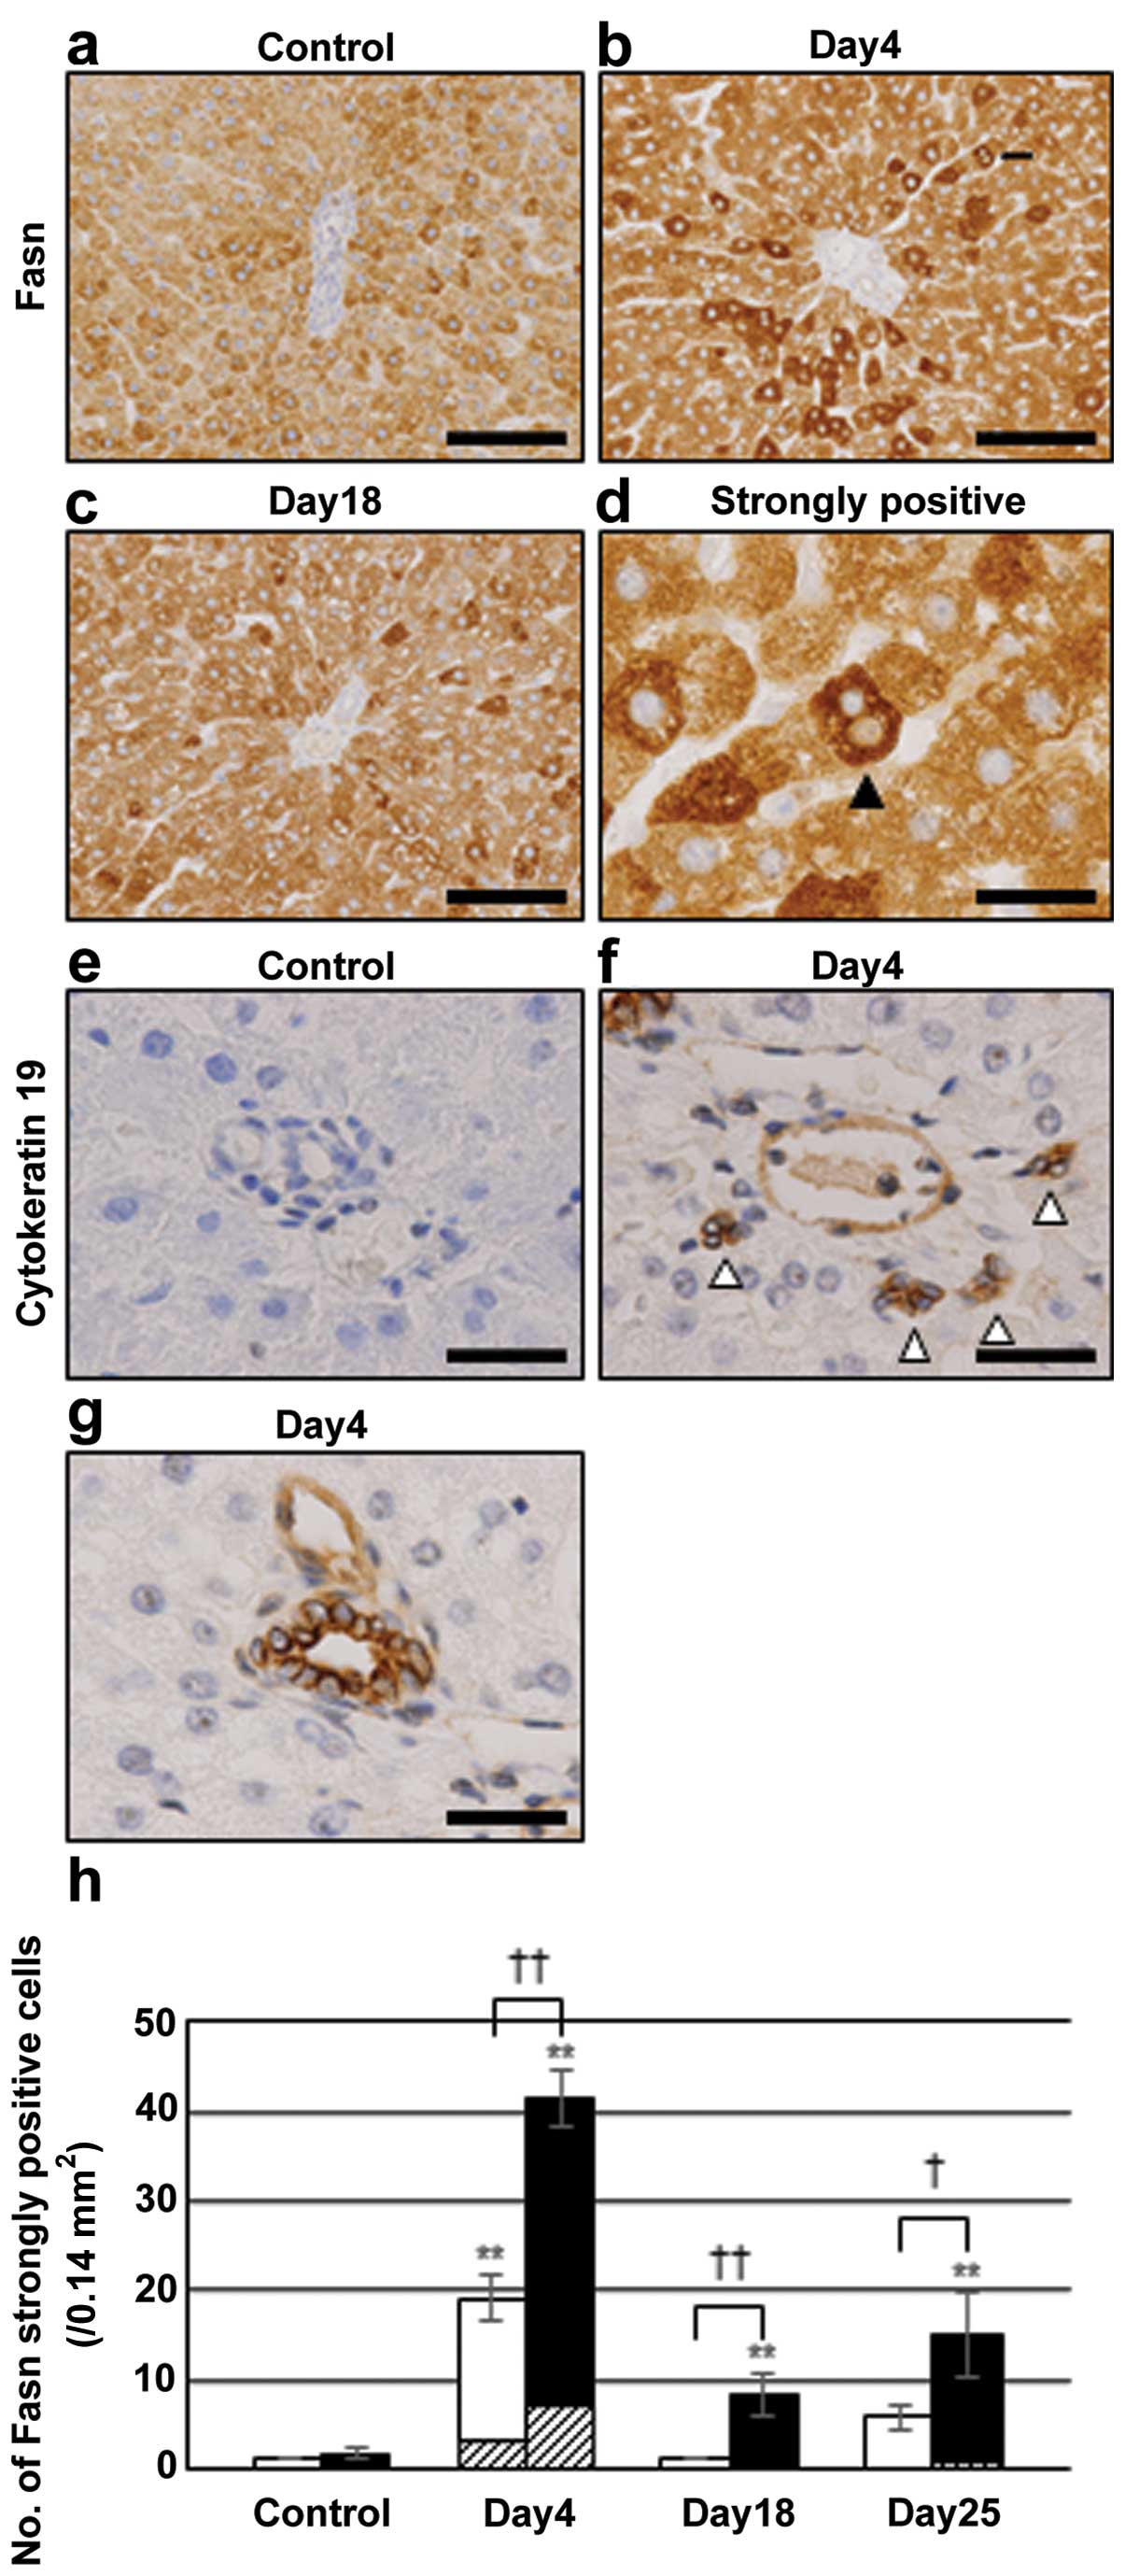
Immunostaining was performed to examine whether Fasn
protein levels also increased. Most hepatocytes in the controls
were weakly positive for Fasn (Fig.
3a), whereas strongly positive hepatocytes appeared around the
BD on day 4 in the irinotecan group (Fig. 3b) and frequently included cells with
two nuclei (Fig. 3b).
Fasn-strongly-positive cells were decreased on day 18 (Fig. 3c). Polykaryonic cells were also
observed in Fasn-weakly-positive hepatocytes on day 4, but at a
lower frequency. The size of polykaryonic cells heavily stained for
Fasn was smaller than that of weakly stained cells (Fig. 3d).
Activation of liver progenitor cells
Immunohistochemistry was performed for cytokeratin
19 in order to examine alterations in liver progenitor cells.
Although a positive reaction was not obtained in the control
(Fig. 3e), liver progenitor cells
that formed clusters around portal veins (Fig. 3f) were detected on day 4 in the
irinotecan group. In addition, bile duct epithelial cells also
showed positive reaction (Fig. 3g).
These results demonstrated the activation of liver progenitor cells
following the administration of irinotecan, whereas their
morphology and localization differed from those of
Fasn-strongly-positive hepatocytes (Fig. 3b).
Relationship between
Fasn-strongly-positive hepatocytes and CA3-positive hepatocytes
with vacuoles
To examine the relationship between
Fasn-strongly-positive cells and CA3-positive hepatocytes
accompanying intracellular vacuoles, the localization of these
cells was compared. Both cell types were frequently distributed
around the BD, but their locations differed (Figs. 3b and 2c). The numbers of Fasn-strongly-positive
hepatocytes around the BD increased to 41.3±3.1 on day 4, and then
decreased to 8.3±2.5 on day 18 (Fig.
3h). Approximately 17% of Fasn-strongly-positive hepatocytes
possessed two nuclei (Fig. 3h) on
day 4. The number of CA3-positive hepatocytes accompanying
intracellular vacuoles around BD was 13.7±0.6 on day 4, and this
increased to 43.0±5.3 on day 18 (Fig.
2f). Thus, the magnitude of the decrease in the number of
Fasn-strongly-positive hepatocytes between days 4 and 18 was
similar to that of the increase in the number of CA3-positive
hepatocytes accompanying intracellular vacuoles. Similar results
were also observed in the values around the CV between days 4 and
18 (Figs. 3h and 2f).
Loss of Kupffer cell marker proteins
To examine the effects of irinotecan on Kupffer
cells, the expression of their marker proteins, Cxcl9 and CD163,
was evaluated by immunohistochemistry. As shown in Fig. 4a, Kupffer and sinusoidal endothelial
cells were positive for the anti-Cxcl9 antibody in the control, but
were negative on day 4 (Fig. 4b),
and became positive again on days 18 and 25 (data not shown).
Immunostaining for CD163 and CD68 was also negative on day 4
(Fig. 4c and d for CD163, and data
not shown for CD68). Non-immune γ-globulin, instead of the primary
antibodies, was also negative (Fig.
4e). On the other hand, PAS staining revealed the presence of
Kupffer cells on day 4 (Fig. 4g) as
well as in the control (Fig. 4f).
Therefore, the results of immunostaining indicated the loss of
Kupffer cell markers, but the cells were still present on day 4.
The numbers of Kupffer cells detected by PAS staining were higher
around the BD than the CV at each time point (Fig. 4h). The number of Cxcl9-positive
Kupffer cells around the BD was also higher than that around the CV
in the control (Fig. 4i), whereas
that of CD163-positive cells was similar between the two areas
(Fig. 4j). Cxcl9-positive Kupffer
cells decreased to 0 on day 4, and then increased to 27.7±3.1
around BD on day 18, but was still lower than the value obtained in
the control (Fig. 4i).
CD163-positive Kupffer cells also decreased to 0 on day 4, and then
increased to 9.7±3.1 around BD on day 18 (Fig. 4j).
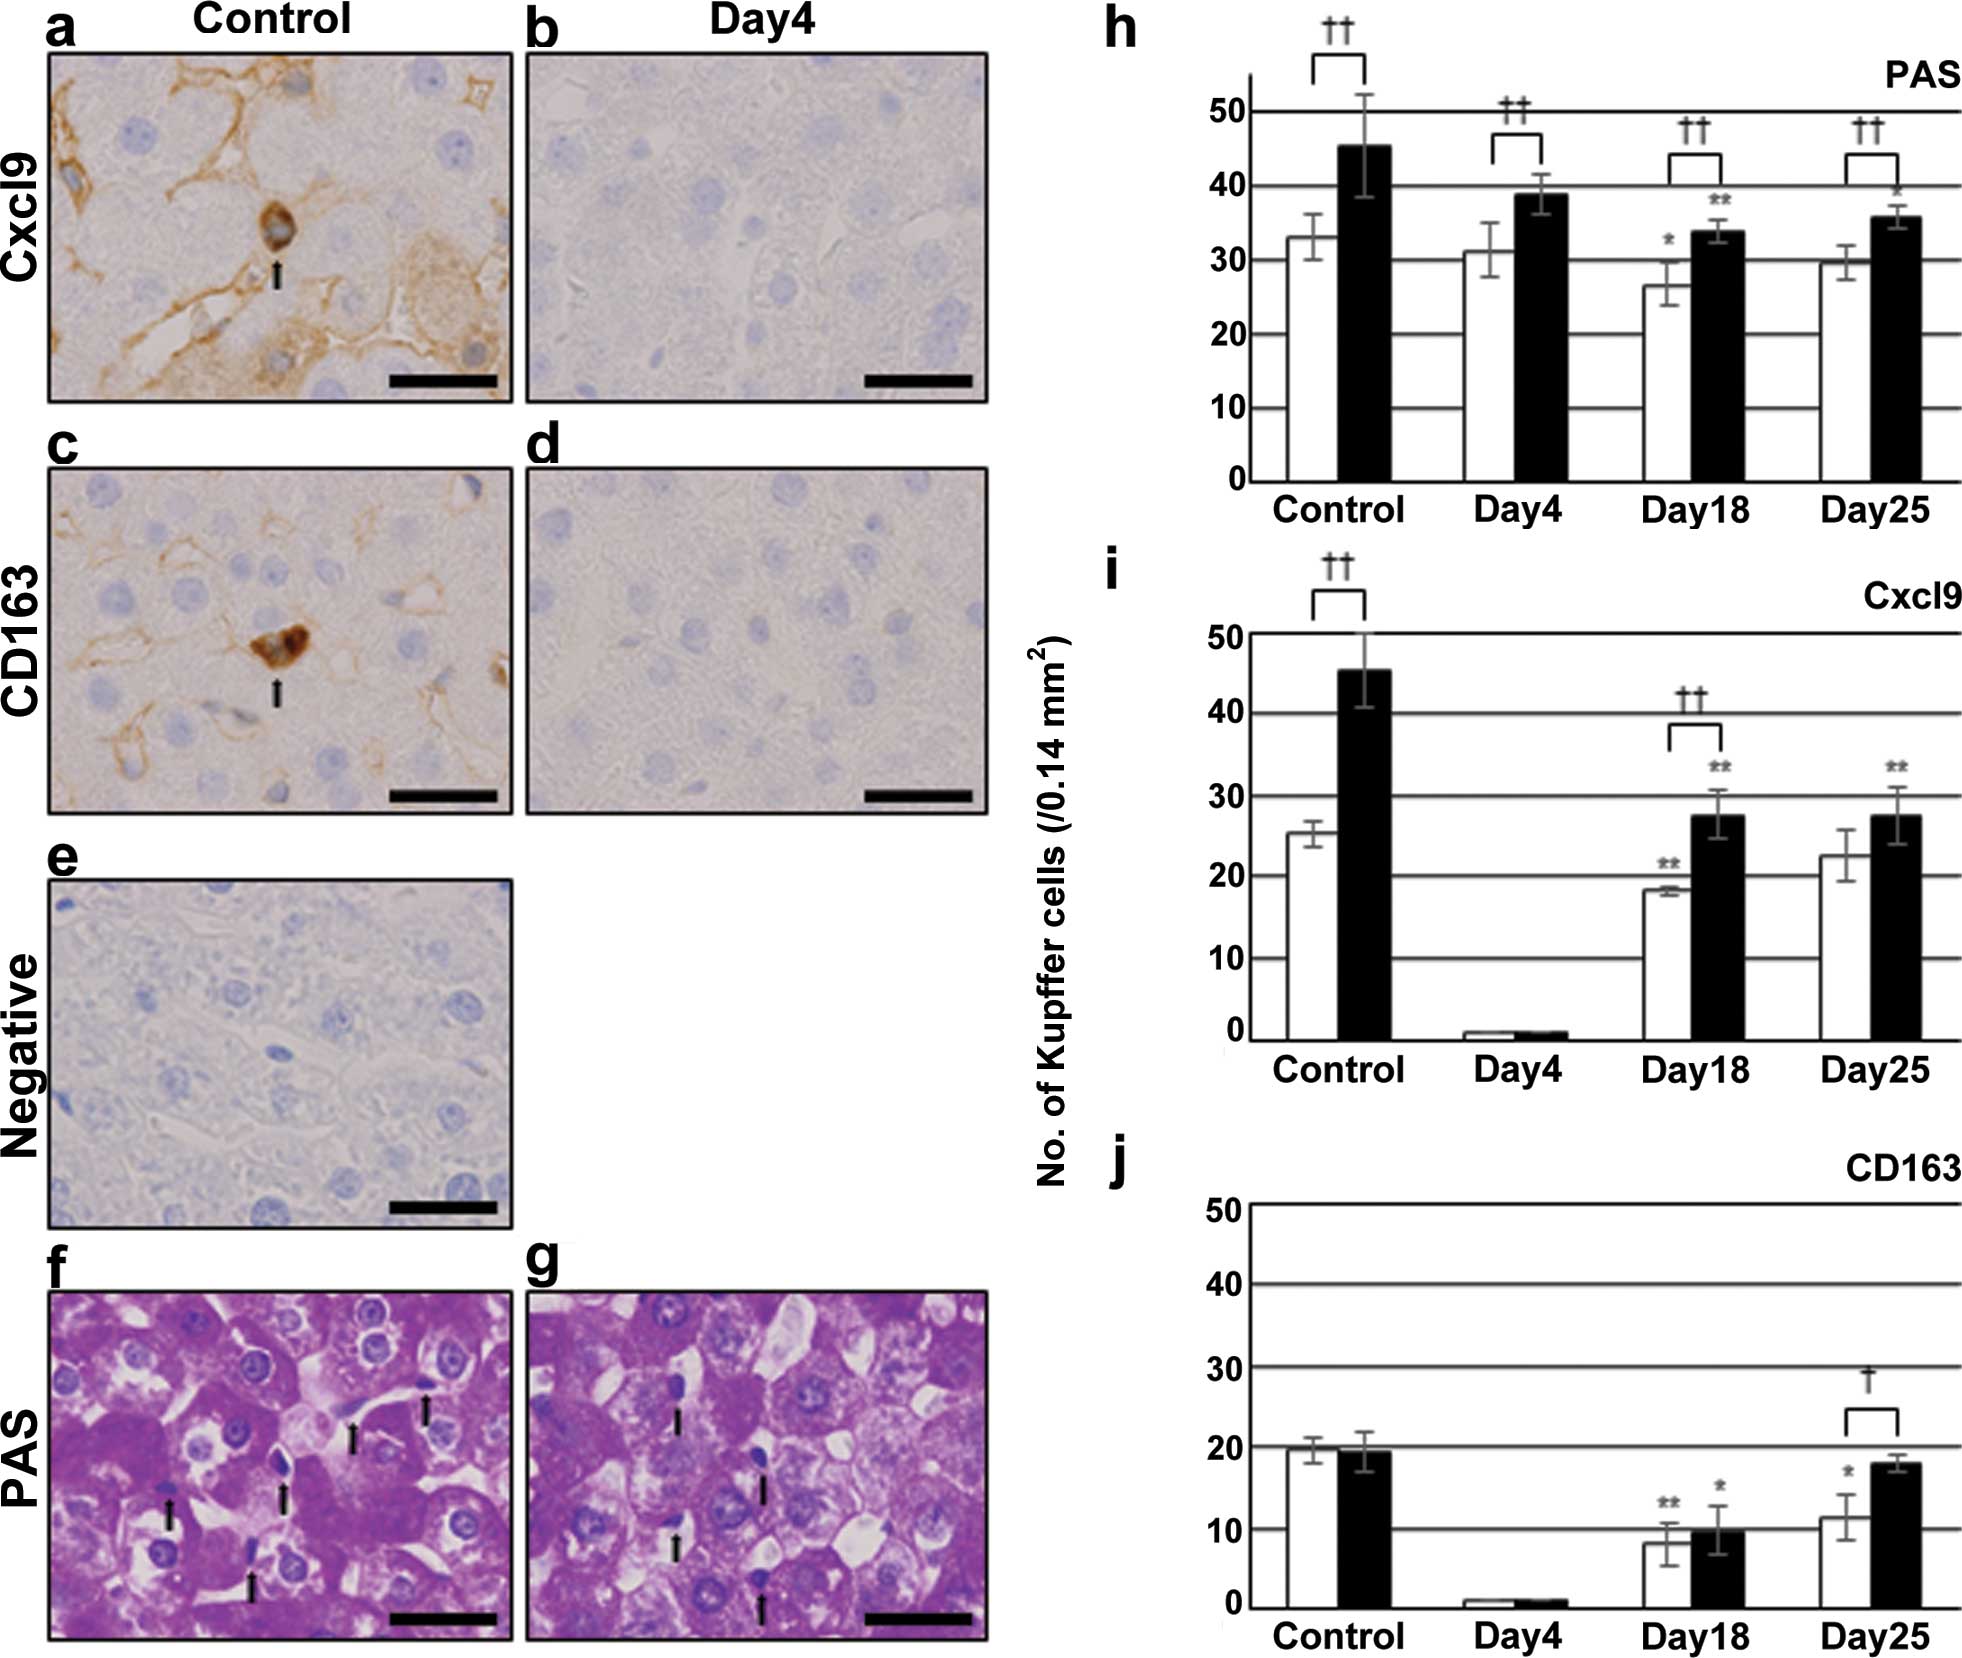 | Figure 4Immunostaining for (a and b) Cxcl9,
(c and d) CD163 and (f and g) PAS staining in (a, c, e and f)
control and irinotecan group on (b, d and g) day 4. Liver sections
of control group were also stained with (e) non-immune γ-globulin.
(a, c, f and g) Arrows indicate positive-Kupffer cells. The data
shown are from a representative preparation set and are similar to
results obtained in two other sets. Scale bars represent 25
μm. The number of Kupffer cells counted with (h) PAS
staining and immunostaining for (i) Cxcl9 and (j) CD163 in control
and irinotecan group on days 4, 18 and 25. Open bars indicate
values around the CV and closed bars around the BD. Data are the
mean ± SD from 3 rats. These cells in liver sections were from five
microscope fields (0.14 mm2/field) for each rat.
*p<0.05 vs. control; **p<0.01 vs.
control (two-tailed Student’s t-test). †p<0.05
between values around the CV and those around the BD;
††p<0.01 between values for the CV and for the BD
(two-tailed Student’s t-test). Cxcl9, chemokine (C-X-C motif)
ligand 9; PAS, periodic acid-Schiff; CV, central vein; BD, bile
ducts. |
Discussion
Although H&E staining of liver sections and
immunohistochemistry for CA3 revealed no significant changes on day
4, panacinar intrahepatocyte vacuoles were present on day 18, and
had disappeared by day 25. Microarray and RT-PCR analyses showed
that the expression of genes involved in the synthesis of
cholesterol and fatty acids was upregulated on day 4. Thus, genes
involved in the synthesis of fatty acids were upregulated on day 4,
and hepatic steatosis appeared on day 18. Immunostaining detected
the appearance of Fasn-strongly-positive hepatocytes on day 4. Some
cells possessed two nuclei and were small in size. Since the
expression of Fasn is reported in proliferating cells (27), the results of the present study
suggested that Fasn-strongly-positive hepatocytes were mitotic. The
magnitude of the decrease in the number of Fasn-strongly-positive
hepatocytes between days 4 and 18 was similar to that of the
increase in the number of CA3-positive hepatocytes accompanying
intracellular vacuoles, suggesting that the former cells changed
into the latter cells. The degree of steatosis was more prominent
around the BV than the CV and this may have been related to the
preferential localization of Fasn-strongly-positive
hepatocytes.
Irinotecan has been identified as an inhibitor of
topoisomerase 1, an enzyme involved in DNA replication (10); therefore, withdrawal of the drug may
have induced cell proliferation. However, microarray analysis
revealed that the expression of genes involved in cell
proliferation was downregulated on day 4. Moreover, liver
progenitor cells, known as oval cells in rodents, were previously
shown to proliferate around the portal vein in response to
suppression of hepatocyte proliferation by some agents, to form
ductular structures and then expanded into liver parenchyma
(28,29). Activation of progenitor cells was
demonstrated by immunohistochemistry for cytokeratin 19 in the
present study. A previous study reported that the activation of
liver progenitor cells was correlated with progression toward NASH
(30). This raises a possibility
that activated progenitor cells may differentiate into
Fasn-strongly-positive hepatocytes. However, both cells were found
to be morphologically different and cells that shared the
properties of both cell types were not detected. Thus, it is
unlikely that such progenitor cells were directly changed into
Fasn-strongly-positive cells.
Kupffer cells were previously shown to promote
steatohepatitis by enhancing hepatic lipid accumulation through
various inflammatory mediators, including specific cytokines
(31). However, Kupffer cell
dysfunction is also known to induce nonalcoholic fatty liver
disease (32). Immunostaining for
Cxcl9 and CD163 indicated that Kupffer cell marker proteins were
absent on day 4, even though Kupffer cells were present. Such
protein loss appeared to be specific to Kupffer cells, since CA3
and Fasn proteins were retained in hepatocytes. The expression of
Eif2ak4 gene, which mediates stress responses that suppress
global protein synthesis (33) was
upregulated on day 4. Kupffer cell dysfunction may be partly
involved in the appearance of Fasn-strongly-positive hepatocytes.
The number and localization of Cxcl9-positive Kupffer cells
differed from those of CD163-positive Kupffer cells. As CD163 is a
marker for M2 macrophages (34),
CD163-positive cells may belong to M2 Kupffer cells (35), while Cxcl9-positive cells seem to
belong to the M1 cells.
In summary, hepatic steatosis was induced by
irinotecan on day 18 and preceded by Fasn-strongly-positive
hepatocytes and the activation of liver progenitor cells. The
former cells are suggested to change into lipid-accumulating
hepatocytes.
Acknowledgments
The authors would like to thank Dr Takahito Toba and
Ms. Yukie Fujita, Department of Pathology and Bioscience, Hirosaki
University Graduate School of Medicine, for their technical
assistance in immunostaining, and Daiichi-Sankyo Co., Ltd., Tokyo,
Japan, for donating irinotecan. The present study was supported in
part by a Grant-in-Aid for the Training of Cancer Professionals
from the Ministry of Education, Culture, Sports, Science and
Technology of Japan.
Abbreviations:
|
H&E
|
hematoxylin and eosin
|
|
RT-PCR
|
real-time polymerase chain
reaction
|
|
Fasn
|
fatty acid synthase
|
|
CA3
|
carbonic anhydrase 3
|
|
CRLM
|
colorectal cancer liver metastasis
|
|
CPT-11
|
irinotecan
|
|
NASH
|
nonalcoholic steatohepatitis
|
|
Cxcl9
|
chemokine (C-X-C motif) ligand 9
|
|
NAFLD
|
nonalcoholic fatty liver disease
|
|
CV
|
central veins
|
|
BD
|
bile ducts
|
|
Srebp2
|
sterol regulatory element-binding
protein 2
|
|
Insig1
|
insulin induced gene 1
|
|
Scap
|
SREBP cleavage-activating protein
|
|
Eif2ak4
|
eukaryotic translation initiation
factor 2α kinase 4
|
|
PAS
|
periodic acid-Schiff
|
|
Egr1
|
early growth response 1
|
|
Nr1i3
|
nuclear receptor subfamily 1, group I,
member 3
|
|
CASH
|
chemotherapy-associated
steatohepatitis
|
References
|
1
|
Ohlsson B and Pålsson B: Follow-up after
colorectal cancer surgery. Acta Oncol. 42:816–826. 2003. View Article : Google Scholar
|
|
2
|
Khatri VP, Petrelli NJ and Belghiti J:
Extending the frontiers of surgical therapy for hepatic colorectal
metastases: Is there a limit? J Clin Oncol. 23:8490–8499. 2005.
View Article : Google Scholar : PubMed/NCBI
|
|
3
|
Fong Y, Kemeny N, Paty P, Blumgart LH and
Cohen AM: Treatment of colorectal cancer: Hepatic metastasis. Semin
Surg Oncol. 12:219–252. 1996. View Article : Google Scholar : PubMed/NCBI
|
|
4
|
Mathijssen RH, van Alphen RJ, Verweij J,
Loos WJ, Nooter K, Stoter G and Sparreboom A: Clinical
pharmacokinetics and metabolism of irinotecan (CPT-11). Clin Cancer
Res. 7:2182–2194. 2001.PubMed/NCBI
|
|
5
|
Carrato A, Gallego J and Díaz-Rubio E:
Oxaliplatin: Results in colorectal carcinoma. Crit Rev Oncol
Hematol. 44:29–44. 2002. View Article : Google Scholar : PubMed/NCBI
|
|
6
|
Douillard JY, Cunningham D, Roth AD, et
al: Irinotecan combined with fluorouracil compared with
fluorouracil alone as first-line treatment for metastatic
colorectal cancer: A multi-centre randomised trial. Lancet.
355:1041–1047. 2000. View Article : Google Scholar : PubMed/NCBI
|
|
7
|
Bismuth H, Adam R, Lévi F, Farabos C,
Waechter F, Castaing D, Majno P and Engerran L: Resection of
nonresectable liver metastases from colorectal cancer after
neoadjuvant chemotherapy. Ann Surg. 224:509–522. 1996. View Article : Google Scholar : PubMed/NCBI
|
|
8
|
Fernandez FG, Ritter J, Goodwin JW,
Linehan DC, Hawkins WG and Strasberg SM: Effect of steatohepatitis
associated with irinotecan or oxaliplatin pretreatment on
resectability of hepatic colorectal metastases. J Am Coll Surg.
200:845–853. 2005. View Article : Google Scholar : PubMed/NCBI
|
|
9
|
Vauthey JN, Pawlik TM, Ribero D, et al:
Chemotherapy regimen predicts steatohepatitis and an increase in
90-day mortality after surgery for hepatic colorectal metastases. J
Clin Oncol. 24:2065–2072. 2006. View Article : Google Scholar : PubMed/NCBI
|
|
10
|
Houghton PJ, Cheshire PJ, Hallman JC,
Bissery MC, Mathieu-Boué A and Houghton JA: Therapeutic efficacy of
the topoisomerase I inhibitor
7-ethyl-10-(4-[1-piperidino]-1-piperidino)-carbonyloxy-camptothecin
against human tumor xenografts: Lack of cross-resistance in vivo in
tumors with acquired resistance to the topoisomerase I inhibitor
9-dimethylaminomethyl-10-hydroxycamptothecin. Cancer Res.
53:2823–2829. 1993.PubMed/NCBI
|
|
11
|
Innocenti F, Undevia SD, Iyer L, et al:
Genetic variants in the UDP-glucuronosyltransferase 1A1 gene
predict the risk of severe neutropenia of irinotecan. J Clin Oncol.
22:1382–1388. 2004. View Article : Google Scholar : PubMed/NCBI
|
|
12
|
Welsh FK, Tilney HS, Tekkis PP, John TG
and Rees M: Safe liver resection following chemotherapy for
colorectal metastases is a matter of timing. Br J Cancer.
96:1037–1042. 2007. View Article : Google Scholar : PubMed/NCBI
|
|
13
|
Yeh MM and Brunt EM: Pathology of
nonalcoholic fatty liver disease. Am J Clin Pathol. 128:837–847.
2007. View Article : Google Scholar : PubMed/NCBI
|
|
14
|
Kleiner DE, Brunt EM, Van Natta M, et al:
Nonalcoholic Steatohepatitis Clinical Research Network: Design and
validation of a histological scoring system for nonalcoholic fatty
liver disease. Hepatology. 41:1313–1321. 2005. View Article : Google Scholar : PubMed/NCBI
|
|
15
|
Dorn C, Riener MO, Kirovski G, Saugspier
M, Steib K, Weiss TS, Gäbele E, Kristiansen G, Hartmann A and
Hellerbrand C: Expression of fatty acid synthase in nonalcoholic
fatty liver disease. Int J Clin Exp Pathol. 3:505–514.
2010.PubMed/NCBI
|
|
16
|
Baffy G: Kupffer cells in non-alcoholic
fatty liver disease: The emerging view. J Hepatol. 51:212–223.
2009. View Article : Google Scholar : PubMed/NCBI
|
|
17
|
Takahata T, Kumano T, Ookawa K, Hayakari
M, Kakizaki I and Tsuchida S: Inhibition of 3T3-L1 adipocyte
differentiation by 6-ethoxyzolamide: Repressed peroxisome
proliferator-activated receptor gamma mRNA and enhanced
CCAAT/enhancer binding protein beta mRNA levels. Biochem Pharmacol.
67:1667–1675. 2004. View Article : Google Scholar : PubMed/NCBI
|
|
18
|
Lynch CJ, Fox H, Hazen SA, Stanley BA,
Dodgson S and Lanoue KF: Role of hepatic carbonic anhydrase in de
novo lipogenesis. Biochem J. 310:197–202. 1995.PubMed/NCBI
|
|
19
|
Yue H, Eastman PS, Wang BB, et al: An
evaluation of the performance of cDNA microarrays for detecting
changes in global mRNA expression. Nucleic Acids Res. 29:E41–E1.
2001. View Article : Google Scholar : PubMed/NCBI
|
|
20
|
Wakil SJ: Fatty acid synthase, a
proficient multifunctional enzyme. Biochemistry. 28:4523–4530.
1989. View Article : Google Scholar : PubMed/NCBI
|
|
21
|
Horton JD, Goldstein JL and Brown MS:
SREBPs: Activators of the complete program of cholesterol and fatty
acid synthesis in the liver. J Clin Invest. 109:1125–1131. 2002.
View Article : Google Scholar : PubMed/NCBI
|
|
22
|
Raghow R, Yellaturu C, Deng X, Park EA and
Elam MB: SREBPs: The crossroads of physiological and pathological
lipid homeostasis. Trends Endocrinol Metab. 19:65–73. 2008.
View Article : Google Scholar : PubMed/NCBI
|
|
23
|
Sakai J, Rawson RB, Espenshade PJ, Cheng
D, Seegmiller AC, Goldstein JL and Brown MS: Molecular
identification of the sterol-regulated luminal protease that
cleaves SREBPs and controls lipid composition of animal cells. Mol
Cell. 2:505–514. 1998. View Article : Google Scholar : PubMed/NCBI
|
|
24
|
Gokey NG, Lopez-Anido C, Gillian-Daniel AL
and Svaren J: Early growth response 1 (Egr1) regulates cholesterol
biosynthetic gene expression. J Biol Chem. 286:29501–29510. 2011.
View Article : Google Scholar : PubMed/NCBI
|
|
25
|
Wada T, Gao J and Xie W: PXR and CAR in
energy metabolism. Trends Endocrinol Metab. 20:273–279. 2009.
View Article : Google Scholar : PubMed/NCBI
|
|
26
|
Baird TD and Wek RC: Eukaryotic initiation
factor 2 phosphorylation and translational control in metabolism.
Adv Nutr. 3:307–321. 2012. View Article : Google Scholar : PubMed/NCBI
|
|
27
|
Pandey PR, Liu W, Xing F, Fukuda K and
Watabe K: Anti-cancer drugs targeting fatty acid synthase (FAS).
Recent Patents Anticancer Drug Discov. 7:185–197. 2012. View Article : Google Scholar
|
|
28
|
Paku S, Schnur J, Nagy P and Thorgeirsson
SS: Origin and structural evolution of the early proliferating oval
cells in rat liver. Am J Pathol. 158:1313–1323. 2001. View Article : Google Scholar : PubMed/NCBI
|
|
29
|
Yovchev MI, Grozdanov PN, Zhou H, Racherla
H, Guha C and Dabeva MD: Identification of adult hepatic progenitor
cells capable of repopulating injured rat liver. Hepatology.
47:636–647. 2008. View Article : Google Scholar
|
|
30
|
Nobili V, Carpino G, Alisi A, Franchitto
A, Alpini G, De Vito R, Onori P, Alvaro D and Gaudio E: Hepatic
progenitor cells activation, fibrosis, and adipokines production in
pediatric nonalcoholic fatty liver disease. Hepatology.
56:2142–2153. 2012. View Article : Google Scholar : PubMed/NCBI
|
|
31
|
Odegaard JI, Ricardo-Gonzalez RR, Red
Eagle A, Vats D, Morel CR, Goforth MH, Subramanian V, Mukundan L,
Ferrante AW and Chawla A: Alternative M2 activation of Kupffer
cells by PPARdelta ameliorates obesity-induced insulin resistance.
Cell Metab. 7:496–507. 2008. View Article : Google Scholar : PubMed/NCBI
|
|
32
|
Yang SQ, Lin HZ, Lane MD, Clemens M and
Diehl AM: Obesity increases sensitivity to endotoxin liver injury:
Implications for the pathogenesis of steatohepatitis. Proc Natl
Acad Sci USA. 94:2557–2562. 1997. View Article : Google Scholar : PubMed/NCBI
|
|
33
|
Dang Do AN, Kimball SR, Cavener DR and
Jefferson LS: eIF2alpha kinases GCN2 and PERK modulate
transcription and translation of distinct sets of mRNAs in mouse
liver. Physiol Genomics. 38:328–341. 2009. View Article : Google Scholar : PubMed/NCBI
|
|
34
|
Edin S, Wikberg ML, Dahlin AM, Rutegård J,
Öberg Å, Oldenborg PA and Palmqvist R: The distribution of
macrophages with a M1 or M2 phenotype in relation to prognosis and
the molecular characteristics of colorectal cancer. PLoS One.
7:e470452012. View Article : Google Scholar : PubMed/NCBI
|
|
35
|
Dixon LJ, Barnes M, Tang H, Pritchard MT
and Nagy LE: Kupffer cells in the liver. Compr Physiol. 3:785–797.
2013.PubMed/NCBI
|