Introduction
Breast cancer is the most common malignant disease
in women, and is one of the leading causes of cancer-related
mortality worldwide. Although it is not the primary tumor, its
distant metastasis is the main cause of breast cancer-related
mortality (1). It is estimated that
~20–30% of breast cancer patients develop metastasis (2). Chemotherapy with taxanes or
combination therapy with trastuzumab has been reported to improve
the survival rate in patients with metastatic breast cancer
(2). Therefore, identification of
prognostic markers of metastasis risk can identify breast cancer
patients with a high risk for developing metastasis, and thus can
help to improve, the clinical management of these patients.
Tumor metastasis involves multiple processes such as
cell invasion into the basal membrane, spread into the lymph node
or blood vessel and growth in distant tissues. At each process,
tumor cells undergo morphological changes that require dynamic
modeling of the actin cytoskeleton (3). Ezrin, belonging to the ezrin, radixin
and moesin protein family, acts as a connector between the actin
cytoskeleton and plasma membrane, and regulates cell-cell and
cell-matrix adhesion (4). Evidence
has shown that ezrin plays an important role in tumor cell invasion
and metastasis (5–7). It has been reported that ezrin
overexpression is associated with metastasis in numerous malignant
tumors such as osteosarcoma, pancreatic cancer, hepatocellular and
tongue squamous cell carcinoma, and non-small-cell lung cancer
(8–11). Ezrin overexpression has been found
to be associated with lymph node metastasis in breast cancer
patients (12,13). The role of ezrin in breast cancer
cell metastasis is also supported by several studies showing that
ezrin overexpression promotes lung metastasis and ezrin silencing
reverses breast cancer cell metastasis (14,15).
However, the mechanisms by which ezrin triggers breast cancer cell
metastasis remain poorly understood.
Epithelial-mesenchymal transition (EMT), a process
in which an immobile epithelial cell changes into a mobile
mesenchymal cell, has been known to play an important role in
cancer cell metastasis (16). Loss
of E-cadherin (E-cad), a hallmark of EMT, has been found in tumors
such as oral squamous cell carcinoma, ovarian cancer, colorectal
and hepatocellular carcinoma, and breast cancer, and is associated
with tumor cell invasion and metastasis (17–23).
It has been reported that knockdown of ezrin increases the
expression of E-cad in breast cancer and tongue squamous cell
carcinoma cell lines (11,15). In addition, ezrin has been reported
to be required for TGF-β1-induced EMT in lung cancer cells
(24). However, the association
between the expression of ezrin and E-cad in breast cancer patients
remains unclear.
In the present study, we investigated the expression
of ezrin and E-cad in 275 breast cancer and 80 control patients
with benign hyperplasia. The purpose of the present study was to
analyze the association between the expression of ezrin and E-cad
in breast cancer patients, and to examine the correlation of their
expression with clinicopathological characteristics and prognosis
of breast cancer patients.
Materials and methods
Patients and tissue samples
The Medical Ethics Committee of the China Medical
University approved the present study. Due to the retrospective
nature of the study, the Ethics Committee waived the need for
written informed consent by the patients.
Human breast tissues were obtained from 275 female
patients with breast cancer and 80 control patients with benign
hyperplasia of mammary glands, who underwent surgery at the First
Affiliated Hospital of China Medical University between 2004 and
2008. The average age of patients with breast cancer was 50.9±9.6
years (range, 29–79 years). The diagnosis of breast cancer and
benign hyperplasia was confirmed by pathological staining. Of the
275 breast cancer patients, 219 patients had invasive ductal
carcinoma, 30 patients had invasive lobular carcinoma and 26
patients had other types of tumors including mucinous, medullary
and cribriform carcinoma. The stage of the cancer was evaluated in
198 patients according to the TNM staging system as follows: stage
I (n=46), stage II (n=122) and stage III (n=30). The histological
grading of the cancer was performed in 265 patients according to
the World Health Organization grading system as follows: grade I
(n=136) and grade II-III (n=129). Clinicopathological data
including patient age, menopausal status, tumor size and lymph node
metastasis were retrospectively retrieved from medical records. The
patients did not undergo radiation therapy and chemotherapy prior
to surgery.
Eighty patients with benign hyperplasia of mammary
glands were used as controls. The average age of patients with
benign hyperplasia of mammary glands was 50.2±10.2 years (range,
23–72 years).
Tissue microarray (TMA) and
immunohistochemistry (IHC)
Paraffin blocks (donor blocks) containing
representative tumor and hyperplasia samples were selected by
reviewing the hematoxylin and eosin-stained slides. Tissue cores
with a diameter of 1.5 mm were extracted from each donor block, and
precisely arrayed into a new paraffin recipient block with a
maximum of 200 cores, using the Organization Microarrayer
(Pathology Devices, Westminster, MD, USA). Sections (4-µm)
were obtained from formalin-fixed and paraffin-embedded TMA blocks,
mounted on poly-L-lysine-coated glass slides and used for IHC.
The sections were deparaffinized with xylene,
rehydrated in a graded alcohol series and heated in a microwave
oven to retrieve antigen. Endogenous peroxidase activity was
blocked with 3% H2O2 at 37°C for 20 min. The
sections were incubated with primary antibodies against ezrin
(ab4069, mouse anti-human monoclonal antibodies; 1:100 dilution)
and E-cadherin (ab1416, mouse anti-human monoclonal antibodies;
1:100 dilution) (both from Abcam Plc, Cambridge, UK) overnight at
4°C. After the primary antibodies were washed off, the sections
were incubated with biotinylated secondary antibody for 30 min at
37°C. The sections were then incubated with streptavidin
horseradish peroxidase for an additional 30 min (LSAB kit; Dako,
Glostrup, Denmark), and stained with 3,3′-diaminobenzidine (DAB).
The sections were counterstained with hematoxylin, dehydrated and
mounted. Any sections in which primary antibodies were omitted were
used as negative controls.
Evaluation of IHC
Immunostaining was examined under a light microscope
by two pathologists who were blinded to the experimental
conditions. The intensity of immunoreactivity was scored as
follows: 0, for no staining; 1, for weak staining; 2, for moderate
staining; and 3, for strong staining. The percentage of stained
cells was scored as 0–100%. The final immunoreactive score was
determined by multiplying the intensity score with the percentage
of positively stained cells. The minimum score was 0 and the
maximum score was 300%. Scores were assigned using 5% increments
(0, 5, 10, ….300%), as previously reported (25,26).
The scores for each sample were used to determine the cut-off value
for discriminating tumors with a high expression of ezrin or
E-cadherin from tumors with a low expression, using receiver
operating characteristic (ROC) curves. To discriminate tumors with
the cytoplasmic expression of E-cad from tumors with the membrane
expression of E-cad, the percentage of E-cad membrane expression
for each sample was used to determine the cut-off value, using ROC
curves. The percentage of E-cad membrane expression was calculated
as follows: E-cad membrane expression % = the number of cells with
membrane expression/(the number of cells with membrane expression +
the number of cells with cytoplasmic expression) × 100%. The
sensitivity and specificity for the survival status (alive or dead)
of breast cancer patients was plotted to generate ROC curves.
Statistical analysis
Data are presented as mean ± SD. Statistical
analyses were performed using SPSS 11.5 (Chicago, IL, USA). For
data with normal distribution, the Student’s t-test was used to
compare the difference in the means between groups. For data with
unequal variance, the Wilcoxon rank-sum or Kruskal-Wallis tests
were used to compare the difference. The Pearson’s Chi-square or
Fisher’s exact probability tests were used to evaluate the
association between the expression of ezrin and E-cad and
clinicopathological characteristics of breast cancer patients. The
Spearman’s and Pearson’s rank correlation analyses were applied to
assess the association between the expression of ezrin and E-cad.
Survival probabilities were estimated by the Kaplan-Meier method
and assessed by a log-rank test. The univariate and multivariate
Cox proportional hazards regression models were used to assess the
association between potential confounding variables and prognosis
(OS or DFS). The OS was calculated as the time between the first
day of diagnosis and disease-related death or last known follow-up.
The DFS was calculated as the time between the first day of
diagnosis and the occurrence of local recurrence or distant
metastasis. Probability values ≤0.05 were considered to indicate a
statistically significant result.
Results
Chinicopathological characteristics of
patients with breast cancer
Table I shows the
clinicopathological characteristics of 275 patients with breast
cancer. The age, menopausal status, tumor size, tumor type,
histological grade, TNM stage and lymph node metastasis were
recorded in 275, 266, 228, 275, 265, 198 and 265 patients,
respectively. The majority of these patients had a tumor with
invasive ductal carcinoma (79.6%), ≤2 cm in size (62.3%),
histological grade II–III (51.3%) and TNM stage II (61.6%). Lymph
node metastasis occurred in 94 (25.9%) of 265 patients.
 | Table IClinicopathological characteristics
of breast cancer patients. |
Table I
Clinicopathological characteristics
of breast cancer patients.
|
Characteristics | Cases
|
|---|
| n | (%) |
|---|
| Age (years) | 275 | |
| ≤50 | 145 | 52.7 |
| >50 | 130 | 47.3 |
| Menopausal
status | 266 | |
| Pre-menopause | 148 | 55.6 |
|
Post-menopause | 118 | 44.4 |
| Tumor size
(cm) | 228 | |
| ≤2.0 | 142 | 62.3 |
| >2.0 | 86 | 37.7 |
| Tumor type | 275 | |
| Ductal | 219 | 79.6 |
| Lobular | 30 | 10.9 |
| Others | 26 | 9.5 |
| Histological
grade | 265 | |
| I | 136 | 51.3 |
| II–III | 129 | 48.7 |
| TNM stage | 198 | |
| I | 46 | 23.2 |
| II | 122 | 61.6 |
| III | 30 | 15.2 |
| Lymph node
metastasis | 265 | |
| No | 171 | 64.5 |
| Yes | 94 | 35.5 |
Follow-up information was available for 169 breast
cancer patients. During the follow-up period of 9–118 months,
relapses occurred in 62 cases and cancer-associated deaths were
found in 48 cases. The 5-year survival rate was 84.6%. The mean OS
and DFS were 98.5 and 91.3 months, respectively.
Expression of ezrin and E-cad in breast
cancer
The expression of ezrin and E-cad was examined in
275 samples from breast cancer patients and 80 control samples from
patients with benign hyperplasia, using IHC (Fig. 1). Ezrin-immunopositive staining was
mainly observed in the cytoplasm in the breast cancer and control
samples. Ezrin-immunopositive staining was observed in 239 (86.9%)
of 275 breast cancer samples and 61 (76.2%) of 80 control samples.
Ezrin immunoreactivity occurred significantly more frequently in
breast cancer samples than in control samples (p=0.020). By
contrast, E-cad immunoreactivity was observed in the membrane and
cytoplasm in breast cancer and control samples. E-cadimmunopositive
staining was observed in 205 (74.5%) of 275 breast cancer samples
and 70 (87.5%) of 80 control samples. E-cad immunoreactivity
occurred significantly less frequently in breast cancer samples
than in control samples (p=0.015).
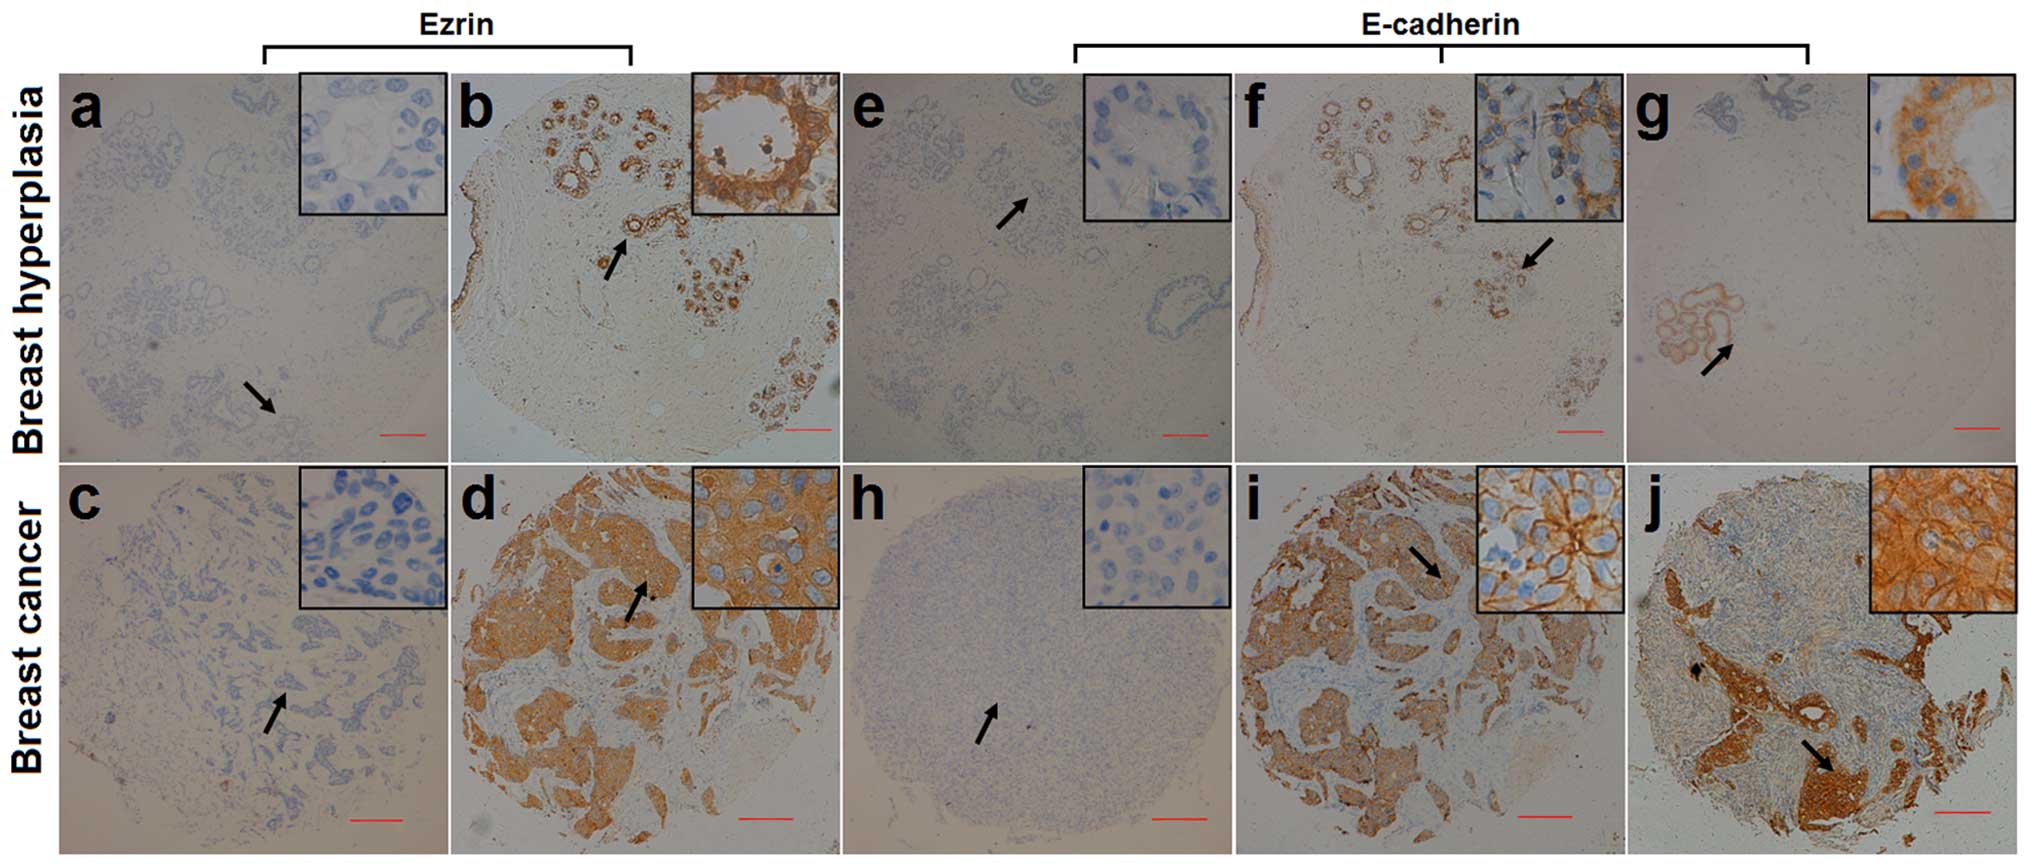 | Figure 1Representative micrographs showing
negative (a, c, e and h) and positive (b, d, f, g, i and j)
immunohistochemical staining of (a–d) ezrin and (e–j) E-cadherin in
breast hyperplasia (a, b, e, f and g) and breast cancer (c, d, h, i
and j). Magnification, ×40. Arrows shows the magnified regions in
the insert (×400). Scale bar, 200 µm. |
Selection of the cut-off value for the
expression of ezrin and E-cad
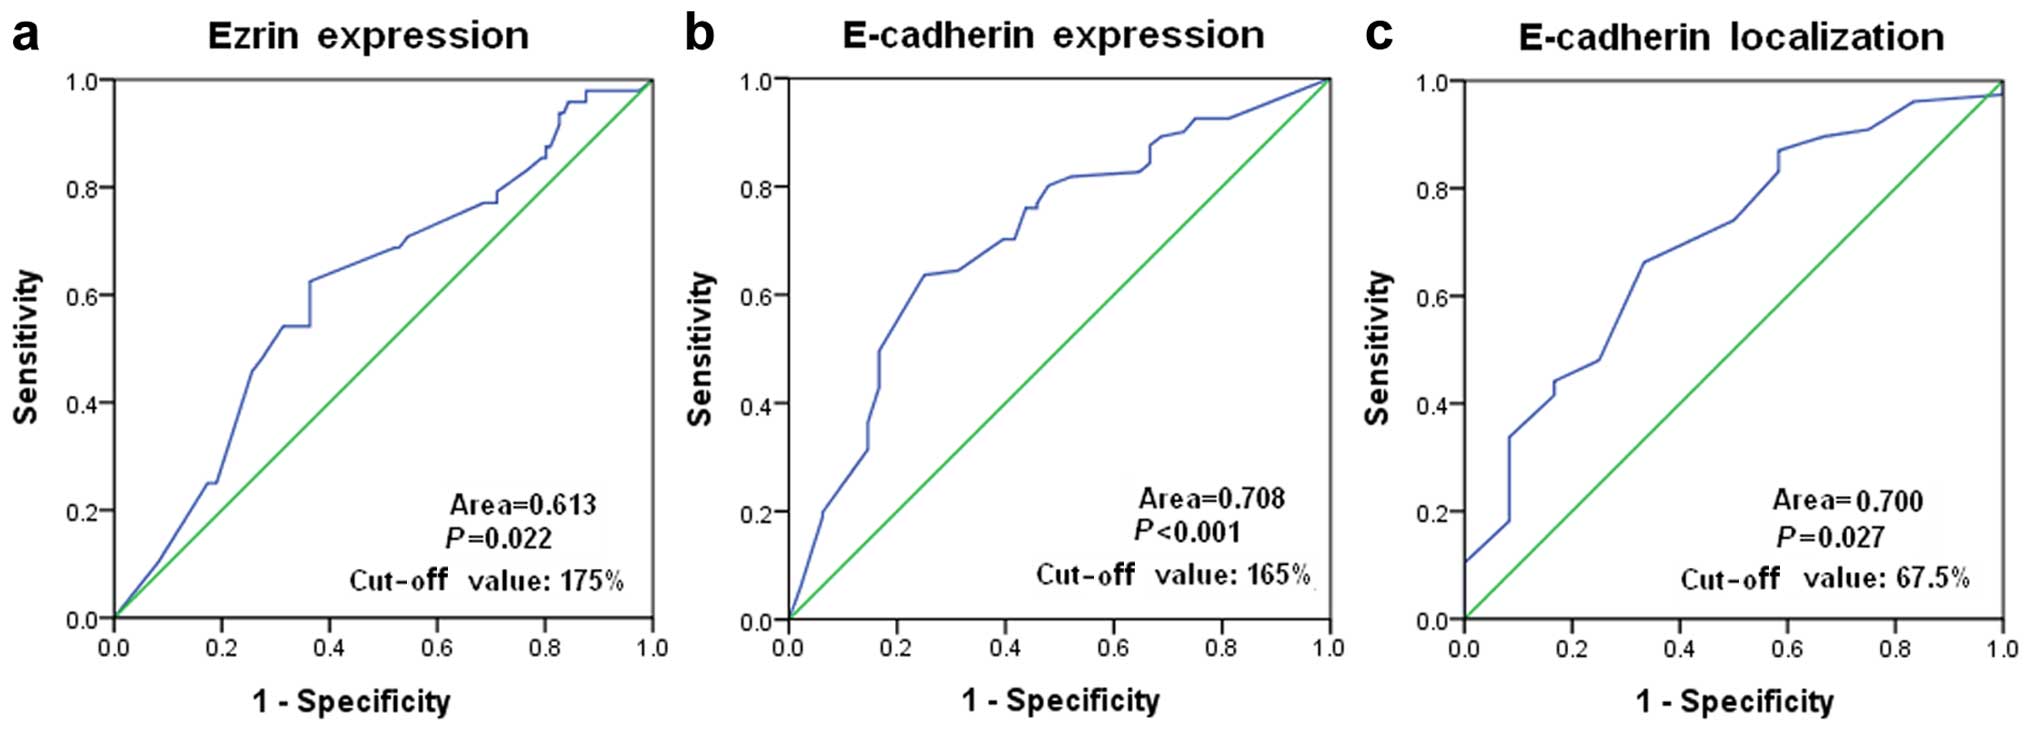
A ROC curve analysis was performed to determine an
optimal cut-off score for the expression of ezrin and E-cad in
breast cancer samples. Based on the survival status, cut-off values
of 175 and 165% were selected for the expression of ezrin and
E-cad, respectively (Fig. 2a and
b). Tumors with immunohistological scores ≥175 and <175%
were defined as tumors with ‘high’ [ezrin(high)] and ‘low’
[ezrin(low)] expression of ezrin, respectively. Tumors with
immunohistological scores ≥165 and <165% were defined as tumors
with ‘high’ [E-cad(high)] and ‘low’ (E-cad(low) expression of
E-cad, respectively. Tumors 124 (45.1%) exhibited an ezrin(high)
expression and 151 (54.9%) tumors showed an ezrin(low) expression.
Tumors 144 (52.4%) exhibited E-cad(high) expression and 131 (47.6%)
tumors showed E-cad(low) expression.
We also performed the ROC analysis to determine an
optimal cut-off score for discriminating the membrane expression
from the cytoplasmic expression of E-cad in breast cancer with an
E-cad(high) expression. Based on the survival status, a cut-off
score of 67.5% was selected (Fig.
2c). Tumors with membrane expression of ≥67.5 and <67.5%
were defined as tumors with E-cad membrane [E-cad(m)] and E-cad
cytoplasmic [E-cad(c)] expression, respectively. Of the 144
E-cad(high) breast cancer, 85 (59.0%) tumors had E-cad(m)
expression and 59 (41.0%) tumors had E-cad(c) expression.
Association between the expression of
ezrin and E-cad in breast cancer
We investigated the association between the
expression of ezrin and E-cad in breast cancer, using Spearman’s
rank correlation analysis. There was no significant correlation
between the expression of ezrin and E-cad in breast cancer patients
(n=275). We also investigated the association between the
expression of ezrin and E-cad in subgroups of breast cancer with
different expression levels of ezrin and E-cad. The Pearson’s
correlation analysis showed a negative correlation between the
expression of ezrin and E-cad in breast cancer with an ezrin(high)
and E-cad(low) expression (r=−0.286, p=0.023, Table II).
| Table IICorrelation between the expression of
ezrin and E-cadherin in breast cancer. |
Table II
Correlation between the expression of
ezrin and E-cadherin in breast cancer.
| Expression | E-cad(low)
| E-cad(high)
|
|---|
| n | ra | Pb | n | ra | Pb |
|---|
| Ezrin(low) | 68 | −0.101 | 0.411 | 83 | −0.062 | 0.579 |
| Ezrin(high) | 63 | −0.286 | 0.023 | 61 | −0.082 | 0.531 |
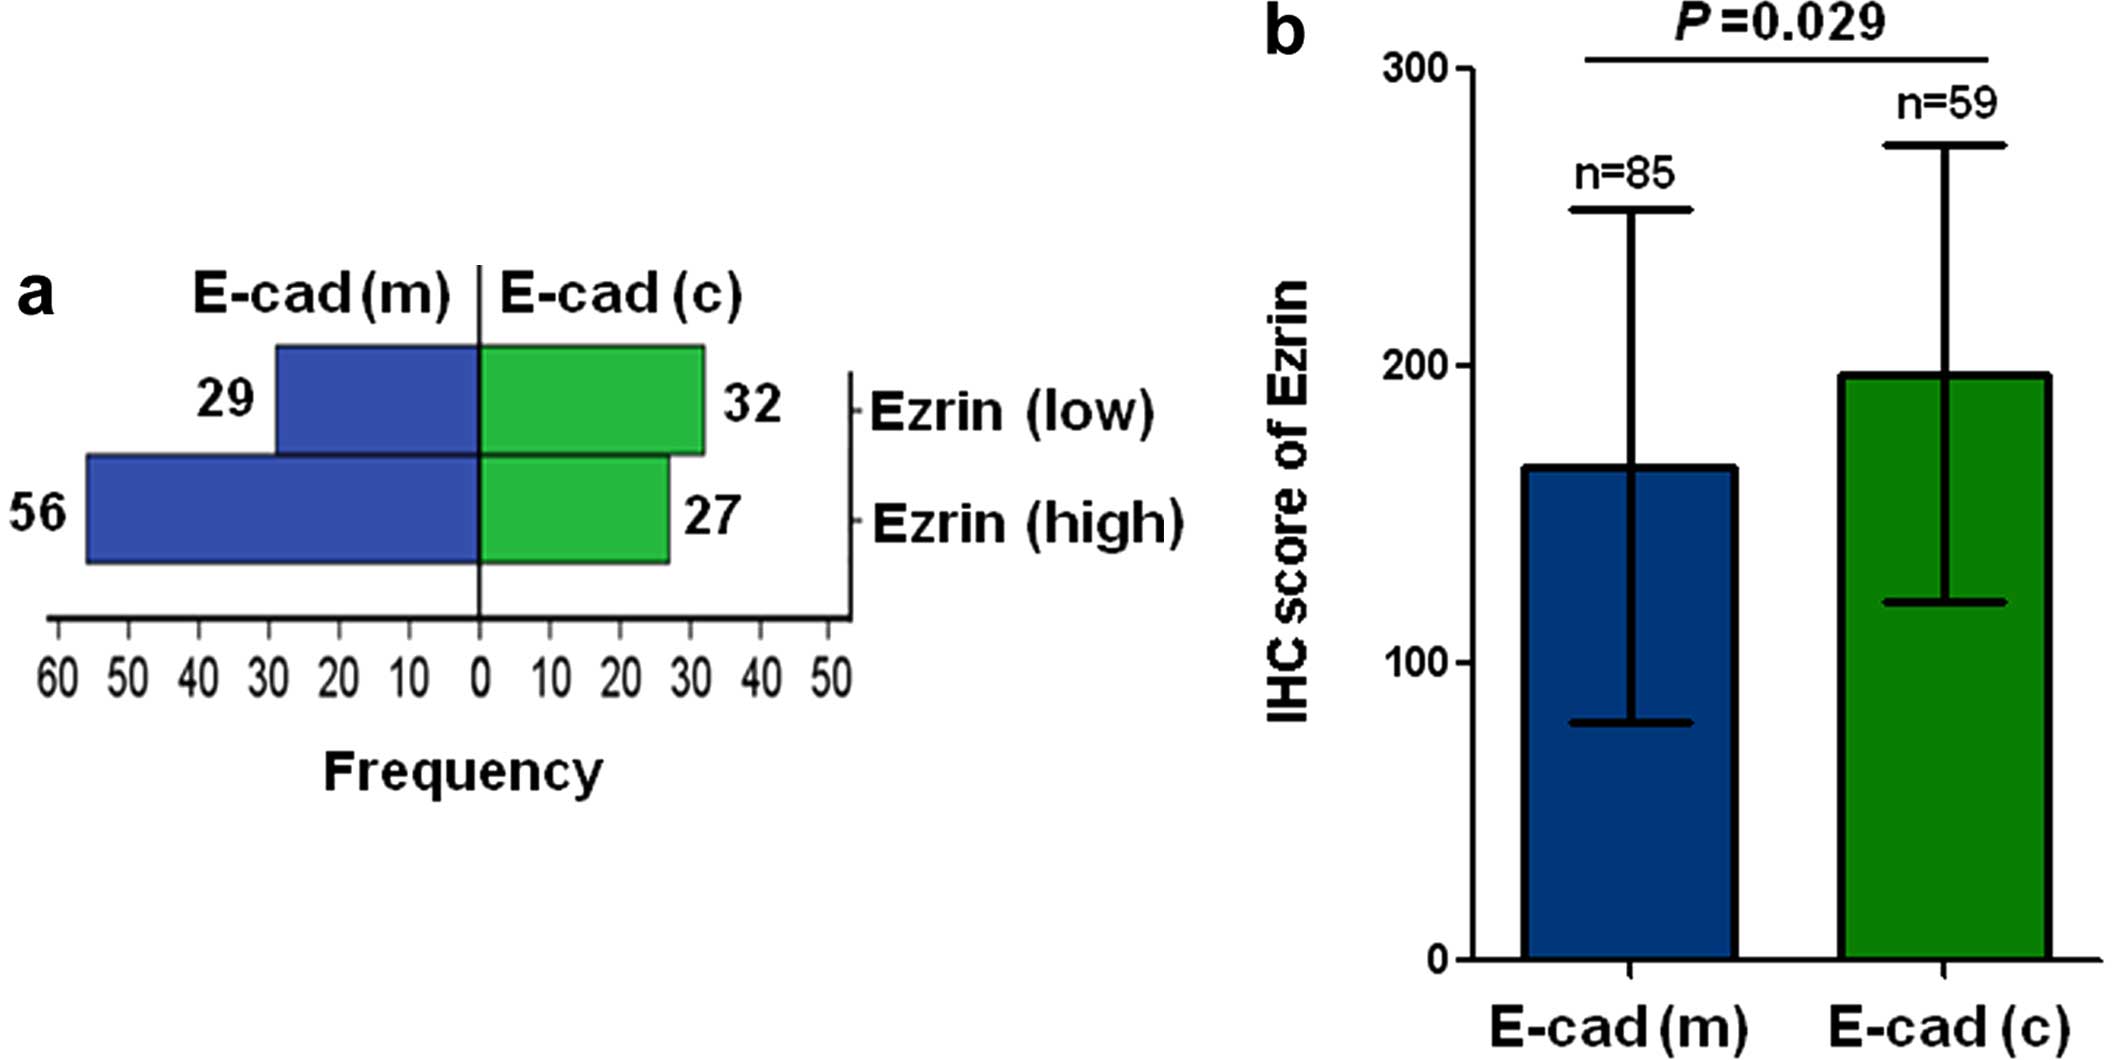
We then examined the subcellular expression levels
of E-cad in breast cancer with E-cad(high). In breast cancer with
ezrin(low) expression, E-cad(m) expression was observed in 56
(67.5%) of 83 cases and E-cad(c) expression was found in 27 (32.5%)
of 83 cases. In breast cancer with ezrin(high) expression, E-cad(m)
expression was observed in 29 (47.5%) of 61 cases, and E-cad(c)
expression was found in 32 (52.5%) of 61 cases. E-cad(c) expression
occurred significantly more frequently in ezrin(high) breast cancer
than in ezrin(low) breast cancer (Chi-square, p=0.016, Fig. 3a). Furthermore, the expression level
of ezrin was significantly higher in E-cad(c) breast cancer than in
E-cad(m) breast cancer (p=0.029, Fig.
3b).
Association of the expression of ezrin
and E-cad with clinico pathological characteristics of breast
cancer patients
We investigated the association between the
expression of ezrin and E-cad and the clinicopathological
characteristics of breast cancer patients (Table III). The age, tumor size and TNM
stage were not significantly associated with the expression of
ezrin. Ezrin(high) expression was more associated with
postmenopausal status (p=0.022), histological grade II-III
(p=0.001) and lymph node metastasis (p=0.002). The age, menopausal
status, tumor size, tumor type and histological grade were not
significantly associated with the expression of E-cad. E-cad(low)
expression was more associated with TNM stage II (p=0.007) and
lymph node metastasis (p<0.001). Furthermore, E-cad(c)
expression was more associated with lymph node metastasis
(p=0.047).
| Table IIIAssociation of ezrin and E-cadherin
expression with clinicopathological features of breast cancer. |
Table III
Association of ezrin and E-cadherin
expression with clinicopathological features of breast cancer.
|
Characteristics | Ezrin
| E-cadherin
| E-cadherin
localizationb
|
|---|
| High n (%) | Low n (%) | Pa | High n (%) | Low n (%) | Pa | E-cad(c) n (%) | E-cad(m) n (%) | Pa |
|---|
| Age (years) at
diagnosis | | | 0.191 | | | 0.325 | | | 0.198 |
| ≤50 | 60 (41.4) | 85 (58.6) | | 80 (55.2) | 65 (44.8) | | 29 (36.2) | 51 (63.8) | |
| >50 | 64 (49.2) | 66 (50.8) | | 64 (49.2) | 66 (50.8) | | 30 (46.9) | 34 (53.10 | |
| Menopaused
status | | | 0.022 | | | 0.131 | | | 0.093 |
| Pre-menopause | 57 (38.5) | 91 (61.5) | | 84 (56.8) | 64 (43.2) | | 30 (35.7) | 54 (64.3) | |
|
Post-menopause | 62 (52.5) | 56 (47.5) | | 56 (47.5) | 62 (52.5) | | 28 (50.0) | 28 (50.0) | |
| Tumor size
(cm) | | | 0.512 | | | 0.392 | | | 0.058 |
| ≤2.0 | 63 (44.4) | 79 (55.6) | | 76 (53.5) | 66 (46.5) | | 27 (35.5) | 49 (64.5) | |
| >2.0 | 42 (48.8) | 44 (51.2) | | 41 (47.7) | 45 (52.3) | | 22 (53.7) | 19 (46.3) | |
| Tumor type | | | 0.071 | | | 0.165 | | | 0.586 |
| Ductal | 106 (48.4) | 113 (51.6) | | 115 (52.5) | 104 (47.5) | | 49 (42.6) | 66 (57.4) | |
| Lobular | 11 (36.7) | 19 (63.3) | | 12 (40.0) | 18 (60.0) | | 5 (41.7) | 7 (58.3) | |
| Others | 7 (26.9) | 19 (73.1) | | 17 (65.4) | 9 (34.6) | | 5 (29.4) | 12 (70.6) | |
| Histological
grade | | | 0.001 | | | 0.251 | | | 0.408 |
| I | 47 (34.6) | 89 (65.4) | | 76 (55.9) | 60 (44.1) | | 33 (43.4) | 43 (56.6) | |
| II–III | 71 (55.0) | 58 (45.0) | | 63 (48.8) | 66 (51.2) | | 23 (36.5) | 40 (63.5) | |
| TNM stage | | | 0.197 | | | 0.007 | | | 0.233 |
| I | 16 (34.8) | 30 (65.2) | | 28 (60.9) | 18 (39.1) | | 12 (42.9) | 16 (57.1) | |
| II | 59 (48.4) | 63 (51.6) | | 68 (55.7) | 54 (44.3) | | 30 (44.1) | 38 (55.9) | |
| III | 16 (53.3) | 14 (46.7) | | 8 (26.7) | 22 (73.3) | | 6 (75.0) | 2 (25.0) | |
| Lymph node
metastasis | | | 0.002 | | |
<0.001 | | | 0.047 |
| No | 66 (38.6) | 105 (61.4) | | 104 (60.8) | 67 (39.2) | | 38 (36.5) | 66 (63.5) | |
| Yes | 55 (58.5) | 39 (41.5) | | 34 (36.2) | 60 (63.8) | | 19 (55.9) | 15 (44.1) | |
Since ezrin(high), E-cad(low) and E-cad(c)
expression was associated with lymph node metastasis, we further
investigated the association of their combined expression with
lymph node metastasis (Table IV).
Compared with tumors with ezrin(low) and E-cad(high) expression,
ezrin(low) and E-cad(low) expression or ezrin(high) and E-cad(high)
expression, tumors with ezrin(high) and E-cad(low) expression were
more associated with lymph node metastasis (p<0.05, Table IV). Compared with tumors with
ezrin(low) and E-cad(high) expression, tumors with ezrin(low) and
E-cad(low) expression or ezrin(high) and E-cad(high) expression was
more associated with lymph node metastasis (p<0.05, Table IV). In addition, compared with
tumors with ezrin(low) and E-cad(m) expression, tumors with
ezrin(low) and E-cad(c) expression, ezrin(high) and E-cad(m)
expression or ezrin(high) and E-cad(c) expression were more
associated with lymph node metastasis (Table IV).
| Table IVAssociation of combination of ezrin
and E-cadherin with lymph-node metastasis of breast cancer. |
Table IV
Association of combination of ezrin
and E-cadherin with lymph-node metastasis of breast cancer.
| Lymph-node
metastasis
| Pg | | |
|---|
| No (%) | Yes (%) |
|---|
| Combination of
ezrin and E-cadherin | | |
<0.001 | | |
| Ezrin(low) +
E-cad(high) | 64 (82.1) | 14 (17.9) | | | |
| Ezrin(low) +
E-cad(low) | 40 (66.7) | 20 (33.3) |
0.038a | | |
| Ezrin(high) +
E-cad(high) | 41 (62.1) | 25 (37.9) |
0.007a | 0.595b | |
| Ezrin(high) +
E-cad(low) | 26 (42.6) | 35 (57.4) |
<0.001a |
0.008b |
0.028c |
| Combination of
ezrin and E-cadherin localizationh | | | 0.041 | | |
| Ezrin(low) +
E-cad(m) | 47 (88.7) | 6 (11.3) | | | |
| Ezrin(low) +
E-cad(c) | 17 (68.0) | 8 (32.0) |
0.054d | | |
| Ezrin(high) +
E-cad(m) | 19 (67.9) | 9 (32.1) |
0.022d | 0.991e | |
| Ezrin(high) +
E-cad(c) | 21 (65.6) | 11 (34.4) |
0.010d | 0.850e | 0.855f |
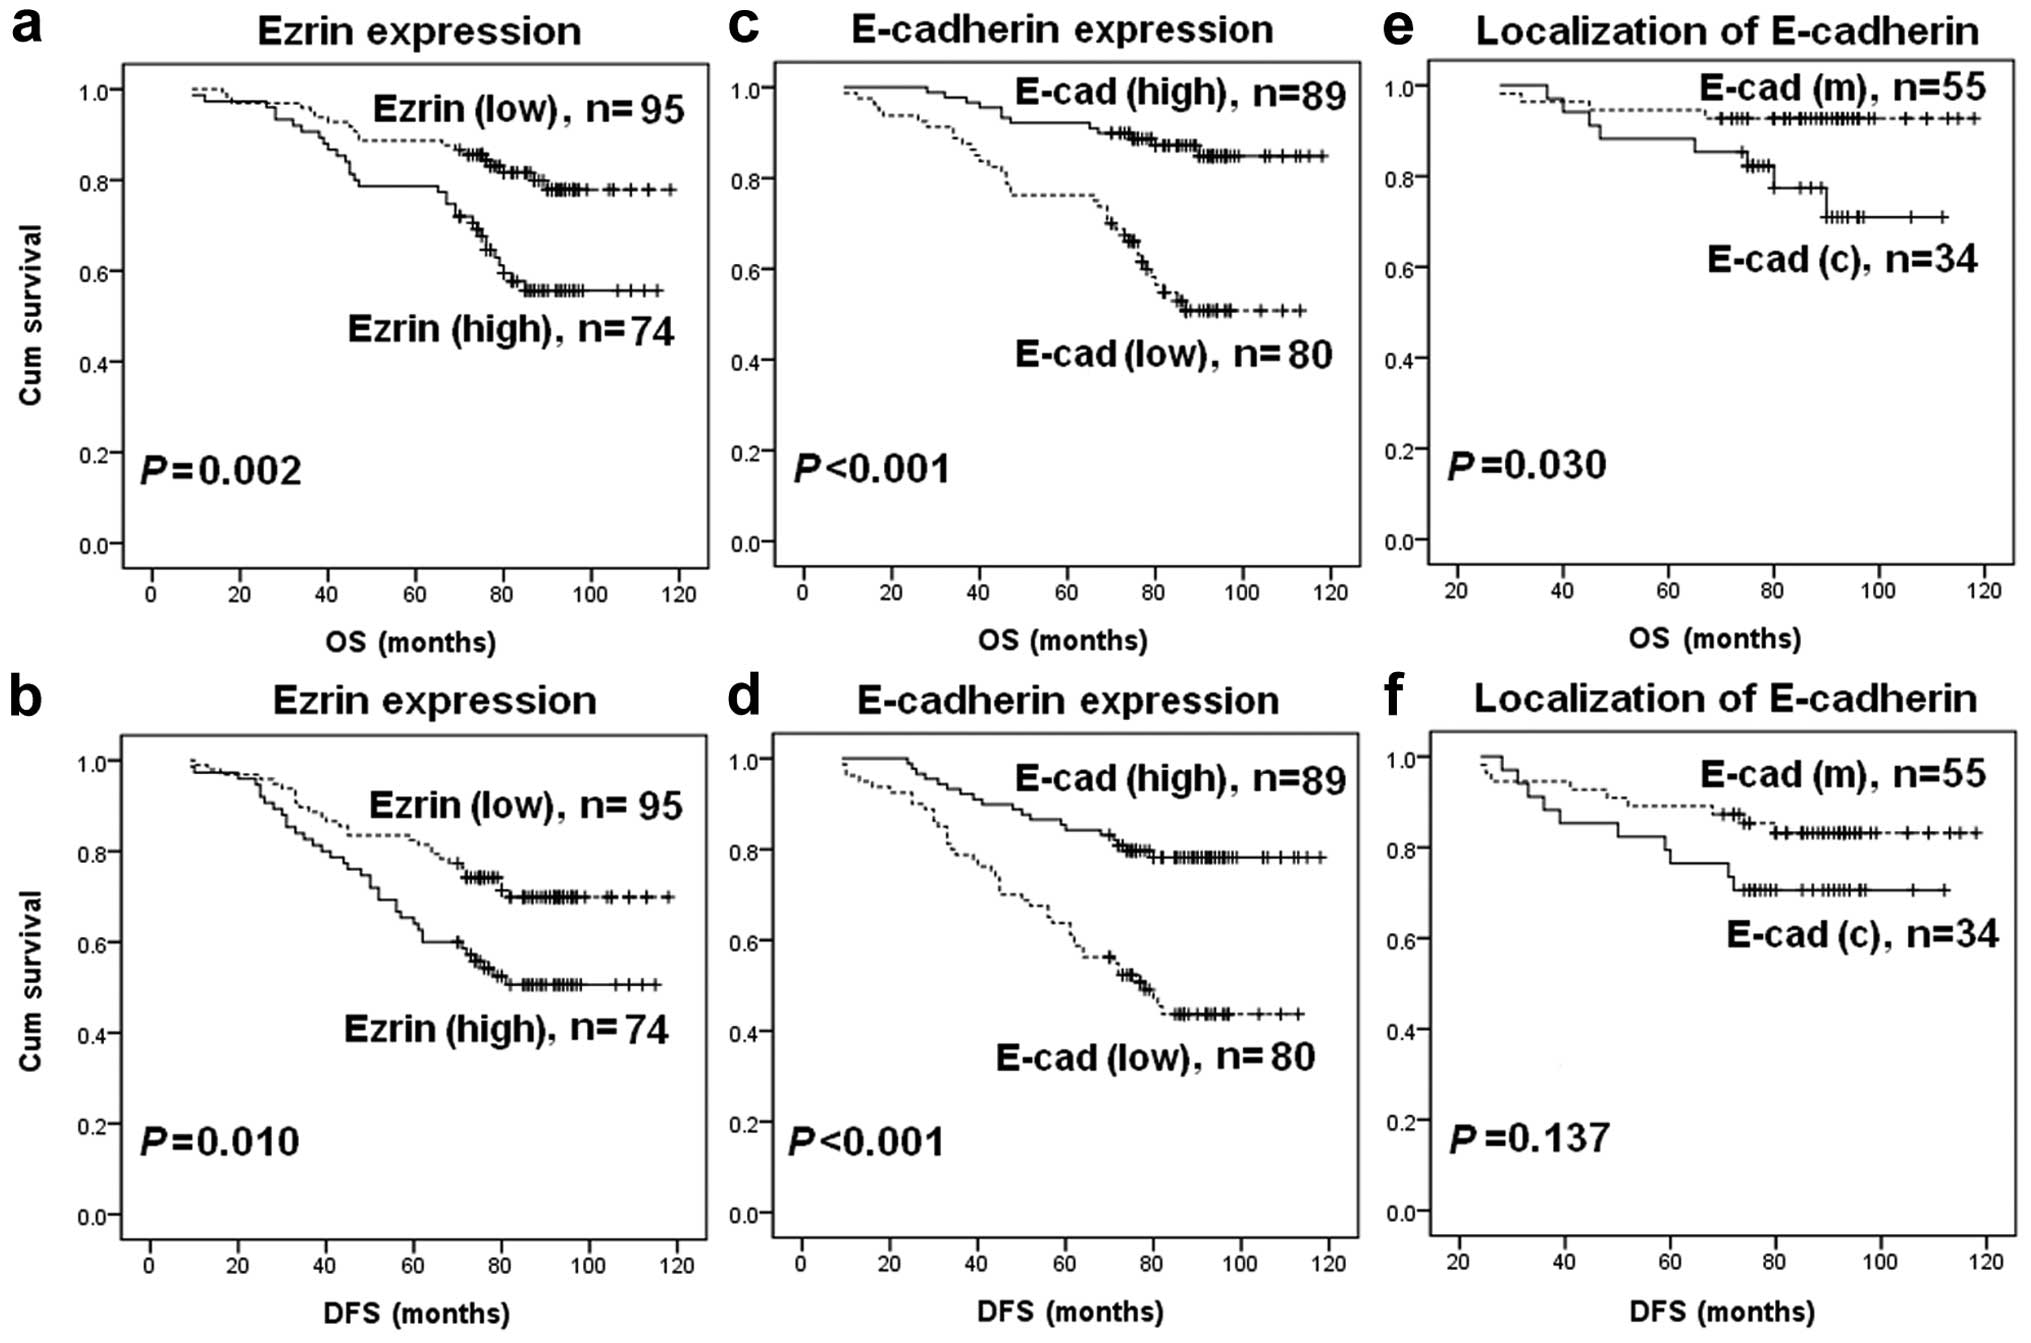
Association of the expression of ezrin
and E-cad with the survival of breast cancer patients
We evaluated the association of the expression level
of ezrin and E-cad with the OS or DFS in breast cancer patients,
using the Kaplan-Meier analysis and log-rank test. Ezrin(high)
expression was associated with shorter OS (p=0.002, Fig. 4a) and DFS (p=0.010, Fig. 4b). E-cad(low) expression was
associated with shorter OS (p<0.001, Fig. 4c) and DFS (p<0.001, Fig. 4d). In addition, E-cad(c) expression
was associated with a significantly shorter OS (p=0.030, Fig. 4e). Although E-cad(c) expression
exhibited a tendency towards a shorter DFS, no statistically
significant difference was found (p=0.137, Fig. 4f).
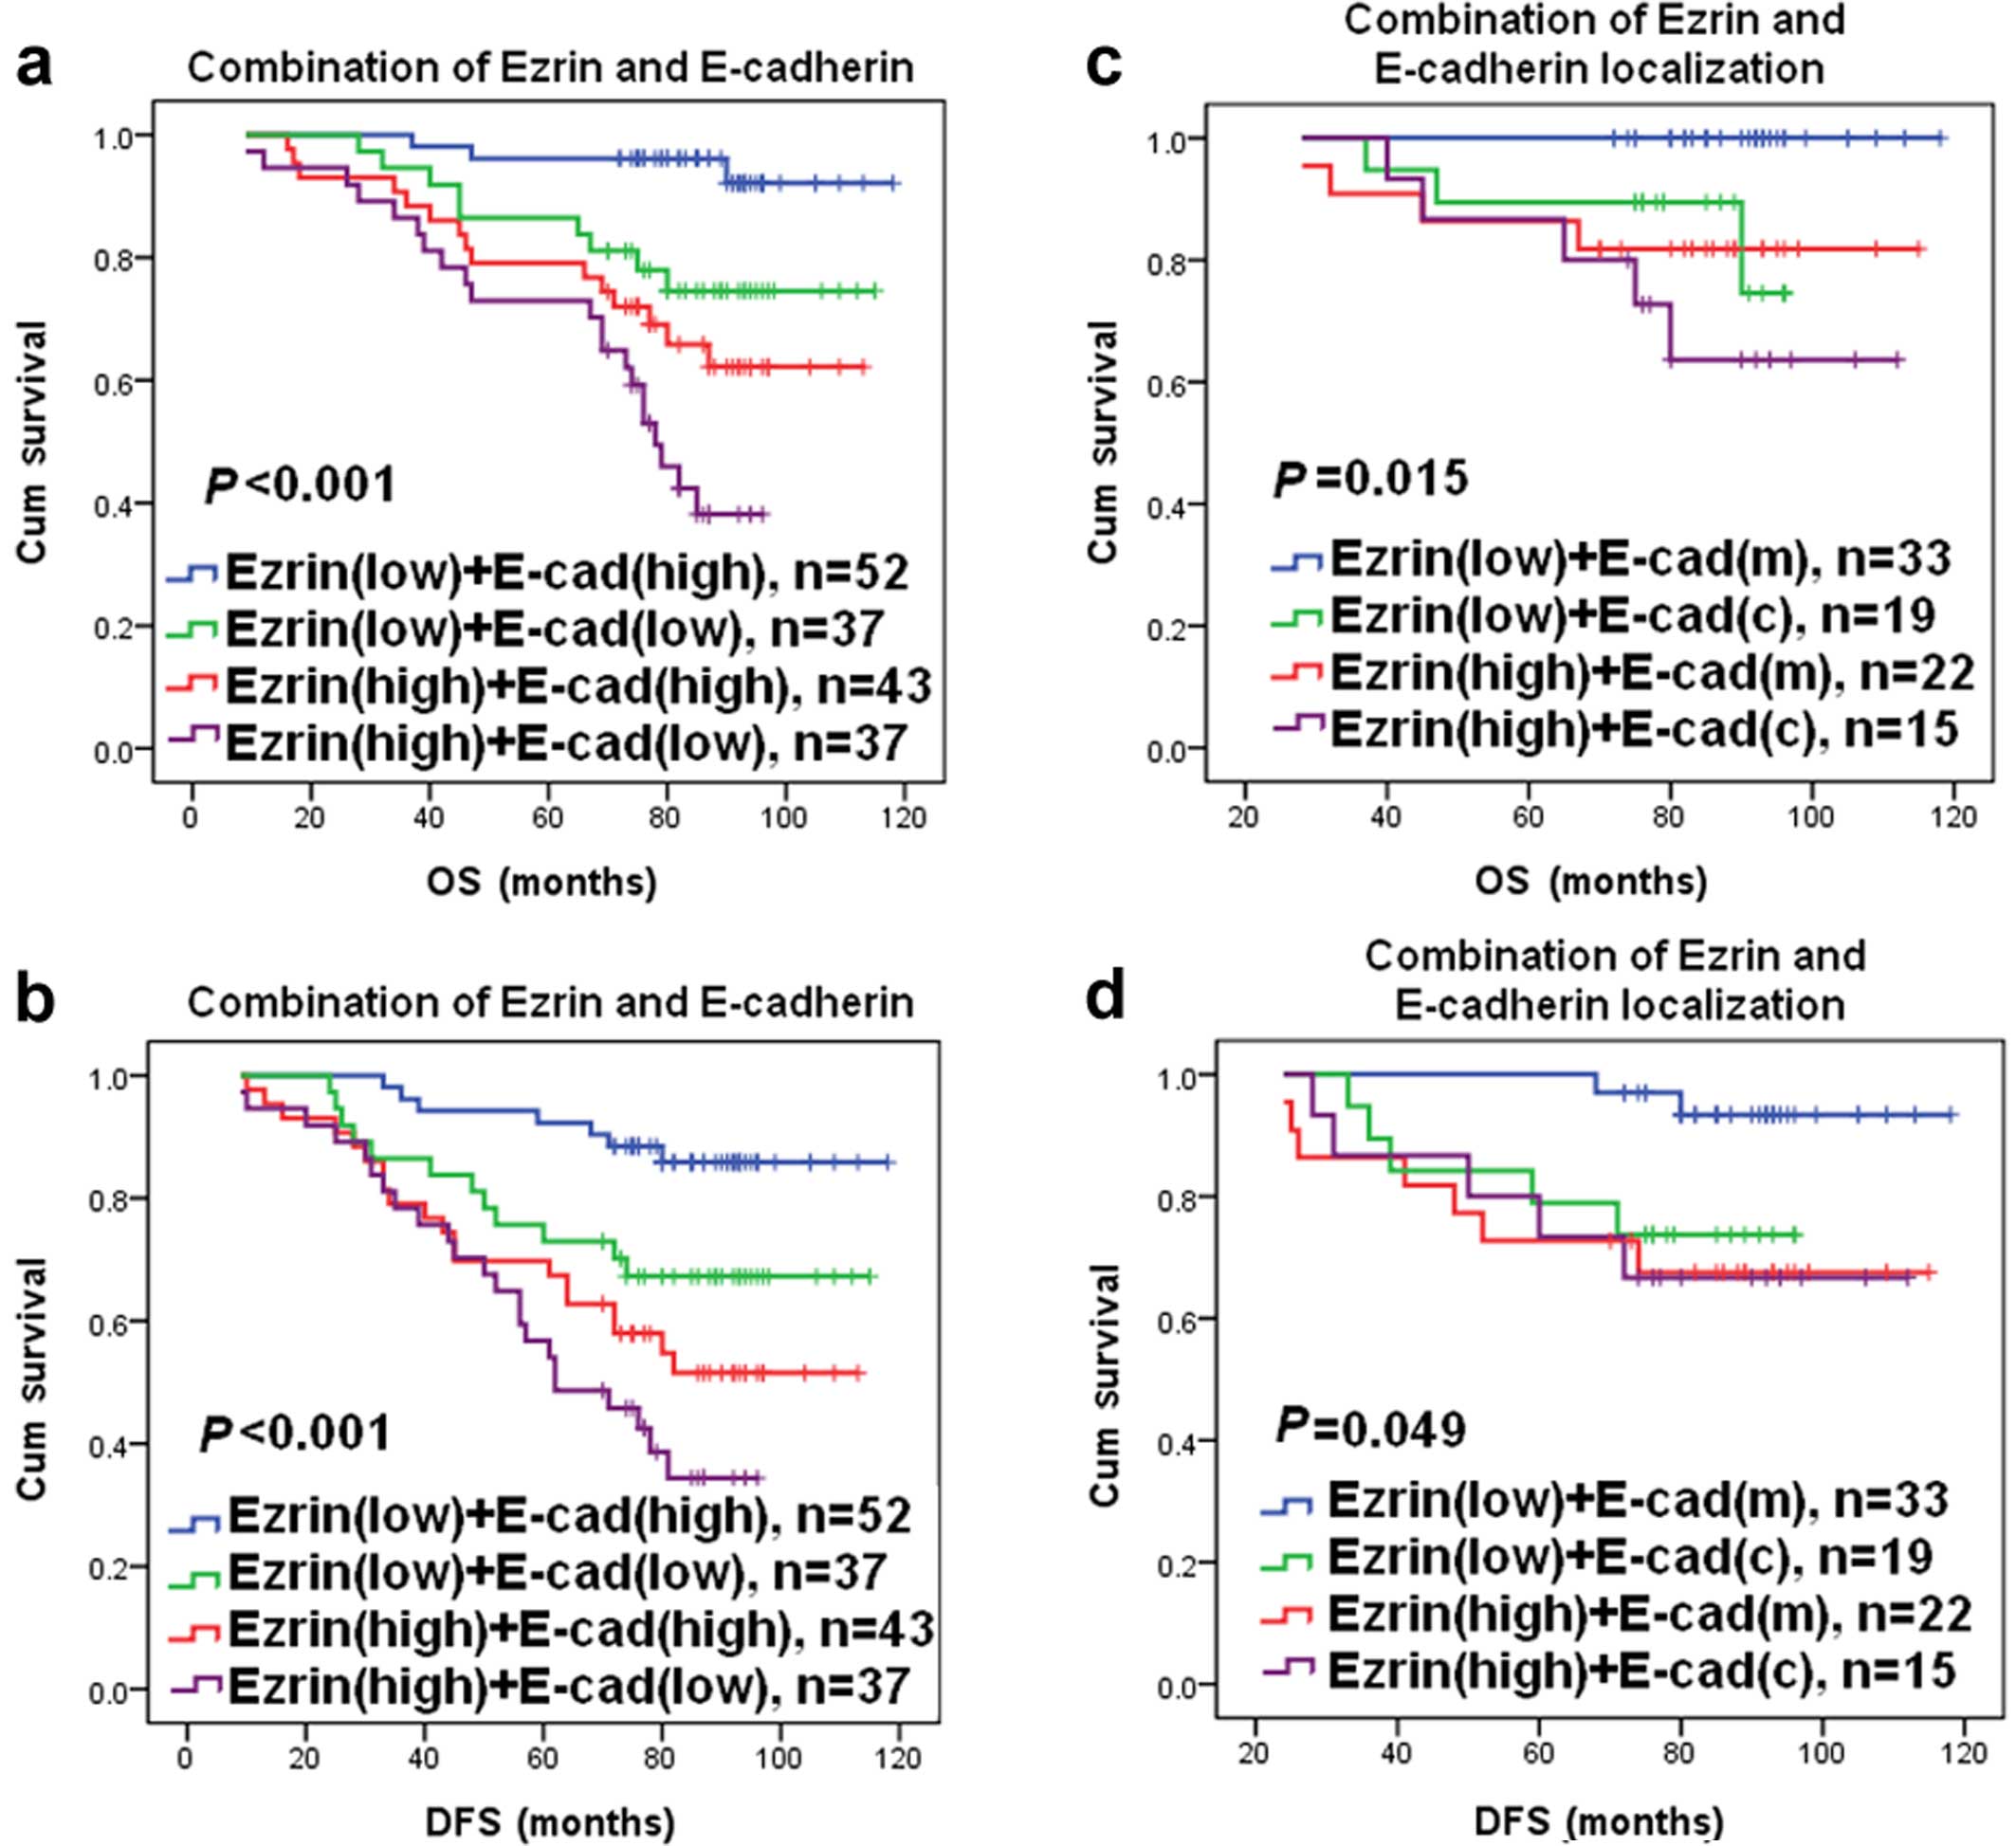
We also examined the association of the combined
expression of ezrin and E-cad with the OS or DFS in breast cancer
patients. Compared with tumors with ezrin(low) and E-cad(high)
expression, tumors with ezrin(low) and E-cad(low) expression,
ezrin(high) and E-cad(high) expression, and ezrin(high) and
E-cad(low) expression were associated with shorter OS and DFS in
breast cancer patients (Fig. 5a and
b). Compared with ezrin(low) and E-cad(low) expression and
ezrin(high) and E-cad(high) expression, ezrin(high) and E-cad(low)
expression was associated with shorter OS and DFS in breast cancer
patients (Fig. 5a and b). In
addition, compared with tumors with ezrin(low) and E-cad(m)
expression, tumors with ezrin(low) and E-cad(c) expression,
ezrin(high) and E-cad(m) expression, and ezrin(high) and E-cad(c)
expression were associated with shorter OS and DFS in breast cancer
patients (Fig. 5c and d).
A univariate Cox regression model was used to
estimate the impact of each clinicopathological variable on the OS
and DFS in breast cancer patients (Table V). The univariate analysis
identified that the menopausal status, tumor size, histological and
TNM stages and lymph node metastasis were significantly associated
with the OS and DFS of breast cancer patients (Table V). In addition, ezrin(high)
expression was significantly associated with shorter OS and DFS of
breast cancer patients. E-cad(c) expression was significantly
associated with shorter OS of breast cancer patients (Table V). Furthermore, multivariate Cox
regression analysis found that lymph node metastasis was an
independent prognostic factor for shorter OS and DFS in breast
cancer patients (p<0.05, Table
VI). Ezrin(high) expression was an independent prognostic
factor for shorter OS in breast cancer patients (p<0.05,
Table VI).
| Table VUnivariate Cox regression analysis of
the association between clinicopathological data and overall
survival (OS) and disease-free survival (DFS) in breast cancer
patients. |
Table V
Univariate Cox regression analysis of
the association between clinicopathological data and overall
survival (OS) and disease-free survival (DFS) in breast cancer
patients.
|
Characteristics | Total n | OS
| DFS
|
|---|
| Events n (%) | RR (95% CI) | P | Events n (%) | RR (95% CI) | P |
|---|
| Age (years) | | | | 0.104 | | | 0.081 |
| ≤50 | 86 | 20 (23.3) | 1 (reference) | | 26 (30.2) | 1 (reference) | |
| >50 | 83 | 28 (33.7) | 1.609
(0.906–2.857) | | 36 (43.4) | 1.568
(0.946–2.597) | |
| Menopaused
status | | | | 0.034 | | | 0.029 |
| Premenopause | 86 | 19 (22.1) | 1 (reference) | | 25 (29.1) | 1 (reference) | |
| Postmenopause | 78 | 29 (37.2) | 1.870
(1.048–3.335) | | 35 (44.9) | 1.775
(1.062–2.966) | |
| Tumor size
(cm) | | | |
<0.001 | | |
<0.001 |
| ≤2.0 | 77 | 11 (14.3) | 1 (reference) | | 20 (26.0) | 1 (reference) | |
| >2.0 | 60 | 33 (55.0) | 5.141
(2.593–10.19) | | 38 (63.3) | 3.413
(1.979–5.885) | |
| Tumor type | | | | 0.658 | | | 0.863 |
| Ductal | 130 | 37 (28.5) | 1 (reference) | | 49 (37.7) | 1 (reference) | |
| Lobular | 19 | 6 (31.6) | 1.215
(0.513–2.880) | | 7 (36.8) | 1.072
(0.486–2.368) | |
| Histological
grade | | | |
<0.001 | | |
<0.001 |
| I | 80 | 7 (8.8) | 1 (reference) | | 14 (17.5) | 1 (reference) | |
| II–III | 83 | 41 (49.4) | 7.327
(3.267–16.39) | | 48 (57.8) | 4.393
(2.417–7.984) | |
| TNM stage | | | |
<0.001 | | |
<0.001 |
| I–II | 94 | 23 (24.5) | 1 (reference) | | 31 (33.0) | 1 (reference) | |
| III | 23 | 18 (78.3) | 5.842
(3.120–10.94) | | 19 (82.6) | 4.997
(2.782–8.974) | |
| Lymph node
metastasis | | | |
<0.001 | | |
<0.001 |
| No | 96 | 12 (12.5) | 1 (reference) | | 17 (17.7) | 1 (reference) | |
| Yes | 65 | 33 (50.8) | 5.134
(2.647–9.958) | | 42 (64.6) | 5.032
(2.856–8.867) | |
| Ezrin
expression | | | | 0.003 | | | 0.011 |
| Low | 95 | 18 (18.9) | 1 (reference) | | 27 (28.4) | 1 (reference) | |
| High | 74 | 30 (40.5) | 2.441
(1.359–4.382) | | 35 (47.3) | 1.914
(1.158–3.164) | |
| E-cadherin
localization | | | | 0.042 | | | 0.145 |
| E-cad(m) | 55 | 4 (7.3) | 1 (reference) | | 9 (16.4) | 1 (reference) | |
| E-cad(c) | 34 | 8 (23.5) | 1.869
(1.024–3.410) | | 10 (29.4) | 1.399
(0.891–2.197) | |
| Table VIMultivariate Cox regression analysis
of the association between clinicopathological data and overall
survival (OS) and disease-free survival (DFS) in breast cancer
patients. |
Table VI
Multivariate Cox regression analysis
of the association between clinicopathological data and overall
survival (OS) and disease-free survival (DFS) in breast cancer
patients.
|
Characteristics | OS
| DFS
|
|---|
| RR (95% CI) | P | RR (95% CI) | P |
|---|
| Age (years)
(>50/≤50) | 0.116
(0.003–4.857) | 0.258 | 0.172
(0.007–4.268) | 0.283 |
| Menopaused status
(post/pre) | 1.074
(0.034–33.79) | 0.967 | 0.442
(0.017–11.65) | 0.625 |
| Tumor size (cm)
(>2.0/≤2.0) | 7.990
(0.522–122.4) | 0.136 | 9.054
(0.517–158.6) | 0.132 |
| Histological grade
(II–III/I) | 1.481
(0.119–18.42) | 0.760 | 0.785
(0.093–6.660) | 0.824 |
| TNM stage
(III/I–II) | 0.514
(0.060–4.422) | 0.544 | 1.357
(0.233–7.903) | 0.734 |
| Lymph node
metastasis (yes/no) | 51.43
(2.283–1158) | 0.013 | 122.2
(6.819–2188) | 0.001 |
| Ezrin
(high/low) | 12.17
(1.405–105.4) | 0.023 | 5.935
(0.945–36.94) | 0.056 |
| E-cadherin
localization (c/m) | 0.522
(0.137–1.982) | 0.340 | 0.554
(0.150–2.048) | 0.376 |
Discussion
In the present study, we examined the expression of
ezrin and E-cad in 275 breast cancer and 80 control patients with
benign hyperplasia. We found that the expression of ezrin was
increased in breast cancer samples compared with the control
samples. Our finding that ezrin was overexpressed in breast cancer
is consistent with findings of previous studies showing ezrin
overexpression in tumors including breast cancer (12,13).
In addition, we found that ezrin was mainly expressed in the
cytoplasm of breast cancer cells. Consistent with this finding,
several studies have shown that ezrin is mainly expressed in the
cytoplasm of cells from breast cancer patients (12,27).
By contrast, we found that E-cad expression was decreased in breast
cancer samples compared with the control samples, and E-cad was
expressed in the membrane and cytoplasm of cells from breast cancer
patients. Our findings agree with those of a previous study showing
that E-cad is downregulated in breast cancer and is associated with
breast cancer metastasis (23).
However, it is unclear whether E-cad downregulation is associated
with ezrin overexpression in breast cancer. In the present study,
we found that the expression of ezrin was negatively correlated
with the expression of E-cad in a subpopulation of breast cancer
with ezrin(high) and E-cad(low) expression, suggesting that ezrin
contributes to the downregulation of E-cad in this population of
breast cancer. This finding was supported by a previous report
showing that ezrin knockdown upregulates the expression of E-cad in
breast cancer cell lines (15). In
addition, the results showed that in breast cancer with E-cad(high)
expression, E-cad(c) expression occurred significantly more
frequently in ezrin(high) breast cancer than in ezrin(low) breast
cancer, and the expression level of ezrin was significantly higher
in E-cad(c) breast cancer than in E-cad(m). These findings suggest
that ezrin promotes the translocation of E-cad from the membrane to
the cytoplasm in breast cancer. This idea was supported by a
previous report showing that the active form of ezrin T567D
increased the accumulation of E-cad in the cytoplasm accompanied
with a decrease in the membrane expression of E-cad (28). Taken together, result of the present
study suggest that ezrin regulates the expression of E-cad in
breast cancer.
In the present study, we examined the association of
the expression of ezrin with the clinicopathological
characteristics of breast cancer patients. We found that
ezrin(high) expression was associated with lymph node metastasis in
breast cancer patients. Consistent with our finding, several
studies have shown that ezrin overexpression is associated with
lymph-node metastasis in breast cancer (12,13).
These findings suggest that ezrin overexpression promotes breast
cancer metastasis. The role of ezrin overexpression in breast
cancer metastasis is also supported by studies showing that the
overexpression of ezrin promotes breast cancer cell metastasis and
the knockdown of ezrin by siRNA reverses the metastatic behavior of
breast cancer cells (14,15). Furthermore, in the present study, we
found that ezrin(high) expression was associated with shorter OS
and DFS in breast cancer patients. The multivariate cox regression
analysis revealed that ezrin(high) expression was an independent
prognostic factor for shorter OS and DFS in breast cancer patients.
Consistent with our findings, Gschwantler-Kaulich et al
reported that an increased ezrin expression was an independent
predictor of invasive breast cancer (12).
In the present study, we also found that E-cad(low)
expression was associated with lymph-node metastasis in breast
cancer patients, consistent with previous studies showing that the
downregulation of E-cad is associated with the invasiveness and
metastasis of breast cancer (23,29,30).
E-cad(low) expression was associated with shorter OS and DFS in
breast cancer patients, suggesting that a reduced expression of
E-cad is associated with greater invasiveness and tumor malignancy.
Similarly, several findings have shown that reduced or loss of
E-cad expression is associated with shorter OS and DFS in breast
cancer patients (22,29,31).
In addition, E-cad(c) expression was more associated with
lymph-node metastasis compared with E-cad(m) expression in the
present study, suggesting that the cytoplasmic expression of E-cad
is important for breast cancer metastasis. Kowalski et al
reported that E-cad was only accumulated in the cytoplasm of
invasive lobular carcinoma that developed distant metastases
(32). The role of the cytoplasmic
expression of E-cad in tumor metastasis is also supported by
studies showing that cytoplasmic E-cad expression is associated
with the cell invasiveness of lung cancer (33) and breast cancer (34) cell lines. Furthermore, we found that
E-cad(c) expression was associated with shorter OS in breast cancer
patients, further confirming that the cytoplasmic expression of
E-cad is associated with breast cancer malignancy.
We investigated the association between the combined
expression of ezrin and E-cad and lymph node metastasis in breast
cancer patients. We found that ezrin(high) and E-cad(low)
expression was more associated with lymph node metastasis compared
with other combined expressions of ezrin and E-cad. Since we found
that ezrin expression was negatively correlated with the expression
of E-cad in breast cancer with ezrin(high) and E-cad(low)
expression, ezrin promotes tumor metastasis via the downregulation
of E-cad. This idea is supported by a previous finding that ezrin
silencing increased the expression of E-cad, and reversed the
metastatic behavior of human breast cancer cells (15). Furthermore, we found that
ezrin(high) and E-cad(low) expression was associated with shorter
OS and DFS in breast cancer patients, suggesting that ezrin and
E-cad may cooperatively regulate tumor metastasis, and thus lead to
a poor outcome of breast cancer patients. In addition, we found
that ezrin(high) and E-cad(c) expression were more associated with
lymph node metastasis and shorter OS and DFS in breast cancer
patients. It has been reported that ezrin promotes the
translocation of E-cad from the membrane to the cytoplasm via
activation of the GTPas Rac1 (28).
It is possible that ezrin regulates the translocation of E-cad in a
similar manner, thus promoting the invasion and metastasis of
breast cancer.
In summary, we examined the expression of ezrin and
E-cad in breast cancer, and analyzed the correlation of ezrin and
E-cad expression alone and in combination with the
clinicopathological characteristics and prognosis of breast cancer
patients. We found that ezrin(high), E-cad(low) or E-cad(c)
expression was associated with lymph node metastasis and poor
prognosis in breast cancer patients. A combined expression of
ezrin(high) and E-cad(low) or ezrin(high) and E-cad(c) was more
associated with lymph node metastasis and poor prognosis. The
present study therefore suggests that ezrin promotes breast cancer
metastasis via the regulation of E-cad expression.
Acknowledgments
This study was supported by grants from the National
Natural Science Foundation of the People’s Republic of China (no.
81373427), and the Program for Liaoning Innovative Research Team in
University, LNIRT (LT2014016).
Abbreviations:
|
AUCs
|
areas under curves
|
|
CI
|
confidence interval
|
|
DAB
|
3,3′-diaminobenzidine
|
|
DFS
|
disease-free survival
|
|
E-cad
|
E-cadherin
|
|
EMT
|
epithelial-mesenchymal transition
|
|
OS
|
overall survival
|
|
ROC
|
receiver operating characteristic
|
|
RR
|
relative risk
|
|
TGF-β1
|
transforming growth factor-β1
|
|
TNM
|
tumor-node-metastasis
|
|
TMA
|
tissue microarray
|
References
|
1
|
Lu J, Steeg PS, Price JE, Krishnamurthy S,
Mani SA, Reuben J, Cristofanilli M, Dontu G, Bidaut L, Valero V, et
al: Breast cancer metastasis: Challenges and opportunities. Cancer
Res. 69:4951–4953. 2009. View Article : Google Scholar : PubMed/NCBI
|
|
2
|
O’Shaughnessy J: Extending survival with
chemotherapy in metastatic breast cancer. Oncologist. 10(Suppl 3):
S20–S29. 2005. View Article : Google Scholar
|
|
3
|
Friedl P and Wolf K: Tumour-cell invasion
and migration: Diversity and escape mechanisms. Nat Rev Cancer.
3:362–374. 2003. View
Article : Google Scholar : PubMed/NCBI
|
|
4
|
Tsukita S and Yonemura S: ERM
(ezrin/radixin/moesin) family: From cytoskeleton to signal
transduction. Curr Opin Cell Biol. 9:70–75. 1997. View Article : Google Scholar : PubMed/NCBI
|
|
5
|
Nestl A, Von Stein OD, Zatloukal K, Thies
WG, Herrlich P, Hofmann M and Sleeman JP: Gene expression patterns
associated with the metastatic phenotype in rodent and human
tumors. Cancer Res. 61:1569–1577. 2001.PubMed/NCBI
|
|
6
|
Yu H, Zhang Y, Ye L and Jiang WG: The FERM
family proteins in cancer invasion and metastasis. Front Biosci.
16:1536–1550. 2011. View
Article : Google Scholar
|
|
7
|
Yu Y, Khan J, Khanna C, Helman L, Meltzer
PS and Merlino G: Expression profiling identifies the cytoskeletal
organizer ezrin and the developmental homeoprotein Six-1 as key
metastatic regulators. Nat Med. 10:175–181. 2004. View Article : Google Scholar : PubMed/NCBI
|
|
8
|
Khanna C, Wan X, Bose S, Cassaday R, Olomu
O, Mendoza A, Yeung C, Gorlick R, Hewitt SM and Helman LJ: The
membrane-cytoskeleton linker ezrin is necessary for osteosarcoma
metastasis. Nat Med. 10:182–186. 2004. View
Article : Google Scholar : PubMed/NCBI
|
|
9
|
Meng Y, Lu Z, Yu S, Zhang Q, Ma Y and Chen
J: Ezrin promotes invasion and metastasis of pancreatic cancer
cells. J Transl Med. 8:612010. View Article : Google Scholar : PubMed/NCBI
|
|
10
|
Kang YK, Hong SW, Lee H and Kim WH:
Prognostic implications of ezrin expression in human hepatocellular
carcinoma. Mol Carcinog. 49:798–804. 2010.PubMed/NCBI
|
|
11
|
Saito S, Yamamoto H, Mukaisho K, Sato S,
Higo T, Hattori T, Yamamoto G and Sugihara H: Mechanisms underlying
cancer progression caused by ezrin overexpression in tongue
squamous cell carcinoma. PLoS One. 8:e548812013. View Article : Google Scholar : PubMed/NCBI
|
|
12
|
Gschwantler-Kaulich D, Natter C, Steurer
S, Walter I, Thomas A, Salama M and Singer CF: Increase in ezrin
expression from benign to malignant breast tumours. Cell Oncol.
36:485–491. 2013. View Article : Google Scholar
|
|
13
|
Halon A, Donizy P, Surowiak P and
Matkowski R: ERM/Rho protein expression in ductal breast cancer: A
15 year follow-up. Cell Oncol. 36:181–190. 2013. View Article : Google Scholar
|
|
14
|
Elliott BE, Meens JA, SenGupta SK, Louvard
D and Arpin M: The membrane cytoskeletal crosslinker ezrin is
required for metastasis of breast carcinoma cells. Breast Cancer
Res. 7:R365–R373. 2005. View
Article : Google Scholar : PubMed/NCBI
|
|
15
|
Li Q, Wu M, Wang H, Xu G, Zhu T, Zhang Y,
Liu P, Song A, Gang C, Han Z, et al: Ezrin silencing by small
hairpin RNA reverses metastatic behaviors of human breast cancer
cells. Cancer Lett. 261:55–63. 2008. View Article : Google Scholar
|
|
16
|
Yang J and Weinberg RA:
Epithelial-mesenchymal transition: At the crossroads of development
and tumor metastasis. Dev Cell. 14:818–829. 2008. View Article : Google Scholar : PubMed/NCBI
|
|
17
|
Jeanes A, Gottardi CJ and Yap AS:
Cadherins and cancer: How does cadherin dysfunction promote tumor
progression? Oncogene. 27:6920–6929. 2008. View Article : Google Scholar : PubMed/NCBI
|
|
18
|
Foschini MP, Leonardi E, Eusebi LH,
Farnedi A, Poli T, Tarsitano A, Cocchi R, Marchetti C, Gentile L,
Sesenna E, et al: Podoplanin and E-cadherin expression in
preoperative incisional biopsies of oral squamous cell carcinoma is
related to lymph node metastases. Int J Surg Pathol. 21:133–141.
2013. View Article : Google Scholar : PubMed/NCBI
|
|
19
|
Wang C, Jiang K, Kang X, Gao D, Sun C, Li
Y, Sun L, Zhang S, Liu X, Wu W, et al: Tumor-derived secretory
clusterin induces epithelial-mesenchymal transition and facilitates
hepatocellular carcinoma metastasis. Int J Biochem Cell Biol.
44:2308–2320. 2012. View Article : Google Scholar : PubMed/NCBI
|
|
20
|
Wang WS, Yu SL, Yang XS, Chang SD and Hou
JQ: Expression and significance of twist and E-cadherin in ovarian
cancer tissues. Asian Pac J Cancer Prev. 14:669–672. 2013.
View Article : Google Scholar : PubMed/NCBI
|
|
21
|
Stanczak A, Stec R, Bodnar L, Olszewski W,
Cichowicz M, Kozlowski W, Szczylik C, Pietrucha T, Wieczorek M and
Lamparska-Przybysz M: Prognostic significance of Wnt-1, β-catenin
and E-cadherin expression in advanced colorectal carcinoma. Pathol
Oncol Res. 17:955–963. 2011. View Article : Google Scholar : PubMed/NCBI
|
|
22
|
Rakha EA, Patel A, Powe DG, Benhasouna A,
Green AR, Lambros MB, Reis-Filho JS and Ellis IO: Clinical and
biological significance of E-cadherin protein expression in
invasive lobular carcinoma of the breast. Am J Surg Pathol.
34:1472–1479. 2010. View Article : Google Scholar : PubMed/NCBI
|
|
23
|
Oka H, Shiozaki H, Kobayashi K, Inoue M,
Tahara H, Kobayashi T, Takatsuka Y, Matsuyoshi N, Hirano S,
Takeichi M, et al: Expression of E-cadherin cell adhesion molecules
in human breast cancer tissues and its relationship to metastasis.
Cancer Res. 53:1696–1701. 1993.PubMed/NCBI
|
|
24
|
Chen MJ, Gao XJ, Xu LN, Liu TF, Liu XH and
Liu LX: Ezrin is required for epithelial-mesenchymal transition
induced by TGF-β1 in A549 cells. Int J Oncol. 45:1515–1522.
2014.PubMed/NCBI
|
|
25
|
Fang Y, Wei J, Cao J, Zhao H, Liao B, Qiu
S, Wang D, Luo J and Chen W: Protein expression of ZEB2 in renal
cell carcinoma and its prognostic significance in patient survival.
PLoS One. 8:e625582013. View Article : Google Scholar : PubMed/NCBI
|
|
26
|
Zhu W, Cai MY, Tong ZT, Dong SS, Mai SJ,
Liao YJ, Bian XW, Lin MC, Kung HF, Zeng YX, et al: Overexpression
of EIF5A2 promotes colorectal carcinoma cell aggressiveness by
upregulating MTA1 through C-myc to induce
epithelial-mesenchymaltransition. Gut. 61:562–575. 2012. View Article : Google Scholar
|
|
27
|
Sarrió D, Rodríguez-Pinilla SM, Dotor A,
Calero F, Hardisson D and Palacios J: Abnormal ezrin localization
is associated with clinicopathological features in invasive breast
carcinomas. Breast Cancer Res Treat. 98:71–79. 2006. View Article : Google Scholar : PubMed/NCBI
|
|
28
|
Pujuguet P, Del Maestro L, Gautreau A,
Louvard D and Arpin M: Ezrin regulates E-cadherin-dependent
adherens junction assembly through Rac1 activation. Mol Biol Cell.
14:2181–2191. 2003. View Article : Google Scholar : PubMed/NCBI
|
|
29
|
Siitonen SM, Kononen JT, Helin HJ, Rantala
IS, Holli KA and Isola JJ: Reduced E-cadherin expression is
associated with invasiveness and unfavorable prognosis in breast
cancer. Am J Clin Pathol. 105:394–402. 1996.PubMed/NCBI
|
|
30
|
Yoshida R, Kimura N, Harada Y and Ohuchi
N: The loss of E-cadherin, α- and β-catenin expression is
associated with metastasis and poor prognosis in invasive breast
cancer. Int J Oncol. 18:513–520. 2001.PubMed/NCBI
|
|
31
|
Brzozowska A, Sodolski T, Duma D,
Mazurkiewicz T and Mazurkiewicz M: Evaluation of prognostic
parameters of E-cadherin status in breast cancer treatment. Ann
Agric Environ Med. 19:541–546. 2012.PubMed/NCBI
|
|
32
|
Kowalski PJ, Rubin MA and Kleer CG:
E-cadherin expression in primary carcinomas of the breast and its
distant metastases. Breast Cancer Res. 5:R217–R222. 2003.
View Article : Google Scholar : PubMed/NCBI
|
|
33
|
Zhang Y, Zhao Y, Jiang G, Zhang X, Zhao H,
Wu J, Xu K and Wang E: Impact of p120-catenin isoforms 1A and 3A on
epithelial mesenchymal transition of lung cancer cells expressing
E-cadherin in different subcellular locations. PLoS One.
9:e880642014. View Article : Google Scholar : PubMed/NCBI
|
|
34
|
Lapyckyj L, Castillo LF, Matos ML,
Gabrielli NM, Lüthy IA and Vazquez-Levin MH: Expression analysis of
epithelial cadherin and related proteins in IBH-6 and IBH-4 human
breast cancer cell lines. J Cell Physiol. 222:596–605. 2010.
|