Integrated analysis of differentially expressed mRNAs and miRNAs between hepatocellular carcinoma and their matched adjacent normal liver tissues

  • Authors:
    • Bing Gao
    • Shufang Ning
    • Jilin Li
    • Haizhou Liu
    • Wene Wei
    • Feixiang Wu
    • Yanping Tang
    • Yan Feng
    • Kezhi Li
    • Litu Zhang
  • View Affiliations

  • Published online on: May 8, 2015     https://doi.org/10.3892/or.2015.3968
  • Pages: 325-333
Metrics: Total Views: 0 (Spandidos Publications: | PMC Statistics: )
Total PDF Downloads: 0 (Spandidos Publications: | PMC Statistics: )


Abstract

Hepatocellular carcinoma has a high mortality rate, thus, there is a need for improvement of prognosis of such patients. The aim of the present study was to identify differentially expressed mRNAs and miRNAs between hepatocellular carcinoma tissues and their matched adjacent normal liver tissues, and to carry out a bioinformatics analysis. Agilent 8x60K microarray technology was used to detect the changes of mRNA and miRNA expression between hepatocellular carcinoma tissues and their matched adjacent normal liver tissues. To select differentially expressed mRNAs and miRNAs, gene ontology (GO) and pathway analysis were performed using bioinformatics methods. qPCR was used to verify the microarray data. As a result, 924 mRNAs and 21 miRNAs exhibited a higher expression in the hepatocellular carcinoma tissue than their matched adjacent normal liver tissue. In comparison with the adjacent normal tissue, the carcinoma tissue showed a downregulated expression of 1,770 mRNAs and 12 miRNAs. The GO and pathway analysis showed that these RNAs were involved in the transcription process, REDOX, signal transduction, ion transport, immune response, cell adhesion and binding functions. A total of 572 target genes of 14 miRNAs were identified, most of which were involved in tumors. The results of qPCR were in concordance with the microarray results. In summary, the differentially expressed mRNAs and miRNAs that include signal transduction, immune response and many other key links may provide novel targets for early diagnosis and therapy of hepatocellular carcinoma.

Introduction

Hepatocellular carcinoma (HCC) is the third most frequent cause of cancer mortality, together with gastric and esophageal carcinoma. HCC is also the fifth most common solid cancer with >500,000 new patients diagnosed with HCC annually worldwide (1). A large number of patients are asymptomatic with early stage of HCC, and due to the lack of early diagnostic indicators, prognosis of HCC is poor with a 5-year survival rate (2). Surgery, liver transplantation, topical treatment and chemotherapy are currently the main treatments offered to HCC patients. However, resistance to drugs and recurrence lead to the inefficacy of conventional radiotherapy and chemotherapy (3,4). Thus, it is important to identify the molecular changes involved in HCC to improve the prognosis of HCC patients.

The regulation of gene expression involving miRNAs has attracted much attention (57). miRNAs are small endogenous non-coding RNA molecules of 18–24 nucleotides in length that can regulate a variety of biological processes (810). Since the first miRNA was identified in nematodes, several studies have shown that miRNAs are closely associated with various human diseases, especially the development of cancer (1113). It has been suggested that miRNAs modulate tumors by affecting apoptosis, transcription process, REDOX, signal transduction, immune response, cell adhesion and other associated biological process (1416). We predicted that some miRNAs may be involved in the invasion and metastatic processes of tumors and it is possible that confirmation of the involvement of these miRNAs may provide new biomarkers for the early diagnosis and specific-targeted gene therapy of HCC.

As previously identified, microarrays have been used for the detection of differentially expressed mRNAs or miRNAs (1719). However, to the best of our knowledge, few reports focus on the correlation analysis of miRNA and mRNA expression. In the present study, we collected 30 HCC tissues and their matched adjacent normal liver tissues. Using Agilent 8×60K microarray technology, we detected the changes of mRNA and miRNA expression. A total of 2,694 mRNAs and 33 miRNAs were differentially expressed in the HCC tissues compared with their matched adjacent normal liver tissues. Subsequently, three mRNAs and three miRNAs were verified by qPCR in 30 HCC tissues and their matched adjacent normal liver tissues. The differentially expressed mRNAs and miRNAs were then analyzed by bioinformatics tools including the Kyoto Encyclopedia of Genes and Genomes (KEGG), GenMAPP and BioCarta. Our results may provide potential insight into the early diagnosis and specific-targeted gene therapy of HCC.

Materials and methods

Tissue samples

In the present study, 30 pairs of HCC tissues and their matched adjacent normal liver tissues were obtained between January 2012 and December 2013 from the Affiliated Tumor Hospital of Guangxi Medical University. The participants involved in the study provided written informed consent. None of the subjects had undergone chemotherapy or radiotherapy prior to surgery. All the tissues were diagnosed independently by pathologists after liver resection and were snap-frozen in liquid nitrogen and stored at −80°C immediately. The present study was approved by the Ethics Committee of the Tumor Hospital. The clinicopathological characteristics of the tissues are provided in Table I.

Table I

Clinicopathological characteristics of patients with hepatocellular carcinoma. [n (%)].

Table I

Clinicopathological characteristics of patients with hepatocellular carcinoma. [n (%)].

ParametersDescriptionMinimumMaximumReference values
Age (years)46.3±10.372667
Gender
 Male23 (76.67)
 Female7 (23.33)
Tumor number
 Single26 (86.66)
 Multiple4 (13.33)
Tumor size (cm)6.6±2.81315
AFP (ng/ml)
 ≤40011 (36.67)
 >40019 (63.33)
Hepatocirrhosis
 With hepatocirrhosis12 (40)
 Without hepatocirrhosis18 (60)
ALB (g/l)40.85±8.1529.77535–50
GLO (g/l)30.45±6.6920.947.125–35
ALT (U/l)41.66±18.6614950–40
AST (U/l)46.16±18.8217850–40
ALP (U/l)64.16±18.75339925–135
T-BIL (µmol/l)12.48±5.75.628.63.4–20.5
D-BIL (µmol/l)4.72±2.331.3100–6.8
I-BIL (µmol/l)7.7±3.782.7192–12
Total RNA extraction

Total RNA of tissues was extracted using TRIzol reagent (Invitrogen, Carlsbad, CA, USA) according to the manufacturer’s instructions. The extracted total RNA was purified with the NucleoSpin® RNA Clean-up kit (Macherey-nagel, Dueren Germany). The NanoDrop 2000 spectrophotometer (Thermo Fisher Scientific, Waltham, MA, USA) was used to ensure the quality of total RNA. Agarose gel electrophoresis confirmed the integrity of the extracted total RNA. RNA was stored at −80°C for the microarray assay and subsequent qPCR assays.

Gene microarray assay

The samples of high quality RNA were marked with Cy3 fluorescent dye, then they were hybridized using the Agilent 8×60K microarray and scanned using an Agilent G2565CA microarray scanner (both from Agilent Technologies, Santa Clara, CA, USA). To obtain hybridization images, Feature Extraction software was used to analyze the images and image signals were changed into digital signals. To filter differentially expressed genes, the original data were processed using GeneSpring GX software. A normalization process was carried out using the percentile shift method. The filtered differentially expressed genes with an absolute ≥2-fold change were identified and recorded. The bioinformatics analysis was carried out using bioinformatics tools including KEGG, GenMAPP and BioCarta.

miRNA microarray assay

High quality RNA was mixed with Cy3 fluorescent dye after dephosphorylation and then hybridized using the Agilent 8×60K microarray and scanned using the Agilent G2565CA microarray scanner to obtain the hybridization images. The Agilent Feature Extraction (v10.7) was used to analyze the data and these were normalized to obtain the differentially expressed genes using the Agilent GeneSpring software.

qPCR

To validate the reliability of the microarray data, a two-step reaction process was used to detect the levels of differentially expressed genes including three mRNAs and three miRNAs that may be associated with the development of HCC. For the mRNA qPCR, 1 µg of total RNA per sample was reverse transcribed into cDNA using the PrimeScript RT reagent kit (Takara Biotechnology, Dalian, China) according to the manufacturer’s instructions. The products of RT were analyzed using an Agilent MX 3000 with the SYBR® Premix Ex Taq™ II (Takara Biotechnology) according to the manufacturer’s instructions. Each sample was analyzed in triplicate. GAPDH was used as the housekeeping gene, and the primers of real-time qPCR were designed and produced by Takara Biotechnology. The primer sequences are shown in Table II. For the miRNA real-time qPCR, 1 µg of total RNA per sample was reverse transcribed into cDNA with miScript II RT kit (Qiagen, Hilden, Germany) according to the manufacturer’s instructions. The products of RT were analyzed using an Agilent Mx3000 with the miScript SYBR-Green PCR kit (Qiagen) according to the manufacturer’s instructions. Each sample was analyzed in triplicate. U6 was used as the housekeeping gene, and the qPCR primers were designed and produced by Qiagen. qPCR reactions results were calculated using the 2−ΔΔCT method (20).

Table II

Primers of mRNA qPCR.

Table II

Primers of mRNA qPCR.

GeneGenBank accession numberPrimers
GAPDHNM_002046Forward: 5′-GCACCGTCAAGGCTGAGAAC-3′
Reverse: 5′-TGGTGAAGACGCCAGTGGA-3′
GPC3NM_001164617Forward: 5′-CCTTTGCTGGAATGGACAAGAAC-3′
Reverse: 5′-CAGCTCATGGAGATTGAACTGG-3′
CTHRC1NM_138455Forward: 5′-GAGTCCTGGACACCCAACTACAAG-3′
Reverse: 5′-AGCCGAAGTGAGCCACTGAA-3′
GLS2NM_013267Forward: 5′-CCATGTGGATCGCATCTTTGA-3′
Reverse: 5′-CCACAGGTCTGGGTTTGACTTG-3′

Results

Total RNA quality control

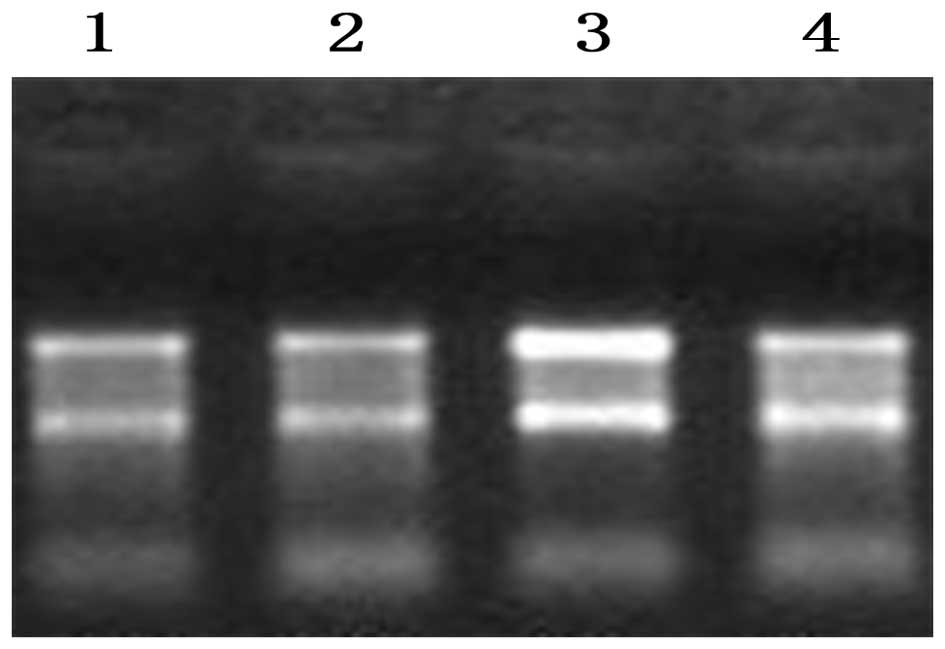
An RNA purity of 2.0≥A260/280≥1.80 and RNA mass of ≥1 µg were used for the microarray experiments. The integrity of the total RNA was examined by agarose gel electrophoresis. The results showed that the band of sample 3 was clear, with a brightness of 28S:18S rRNA>2:1, and that the sample was within the limits allowed for the microarray experiment. The band of the other samples was also clear, with a brightness of 28S:18S rRNA>1:1, and the sample was within the limits allowed for the microarray experiment (Fig. 1).

Analysis of differentially expressed mRNA

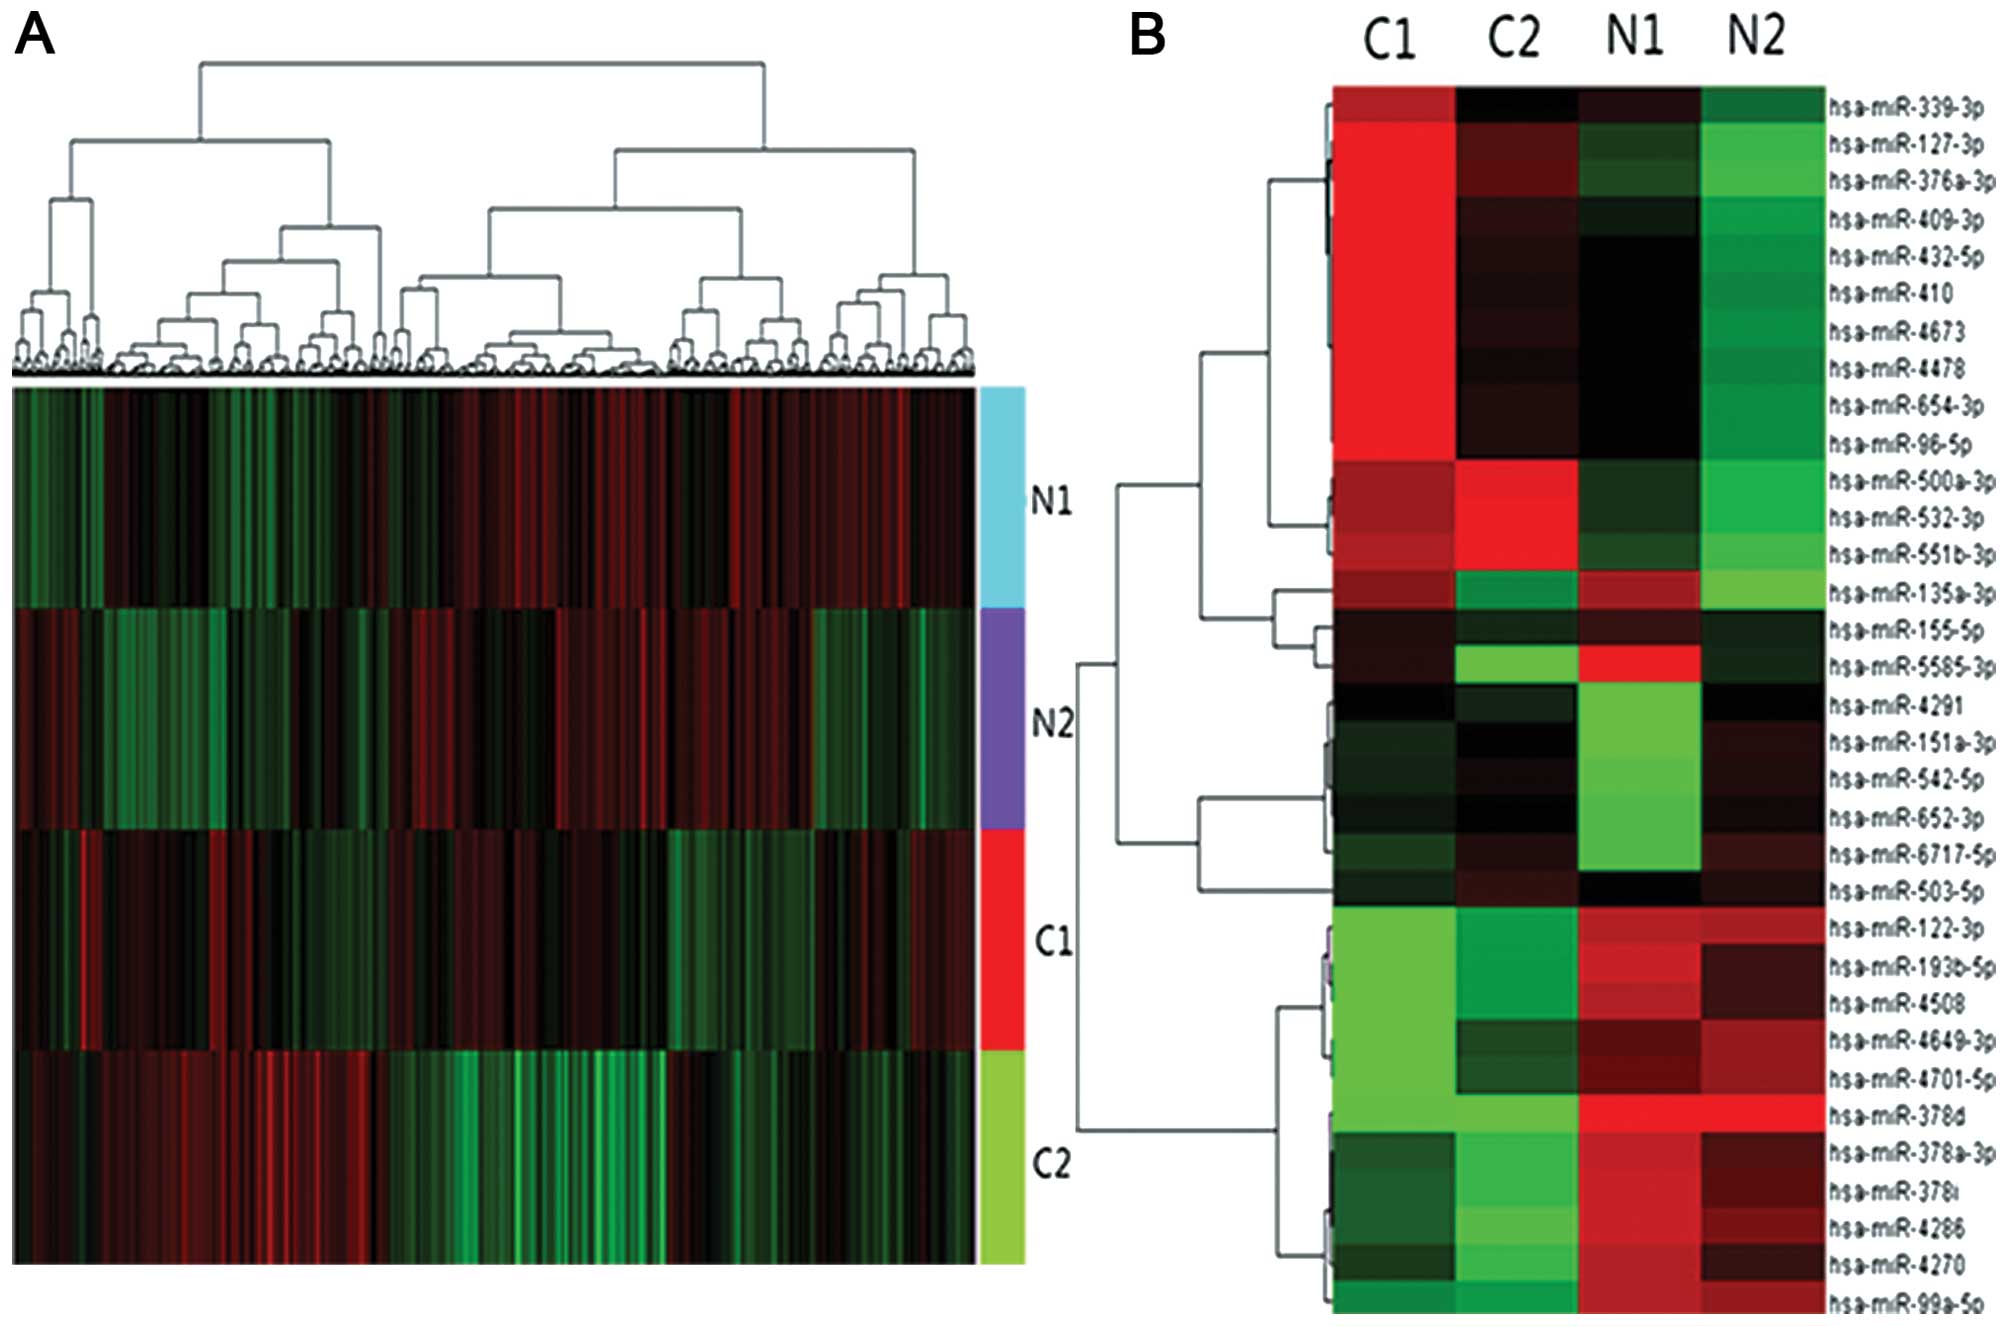
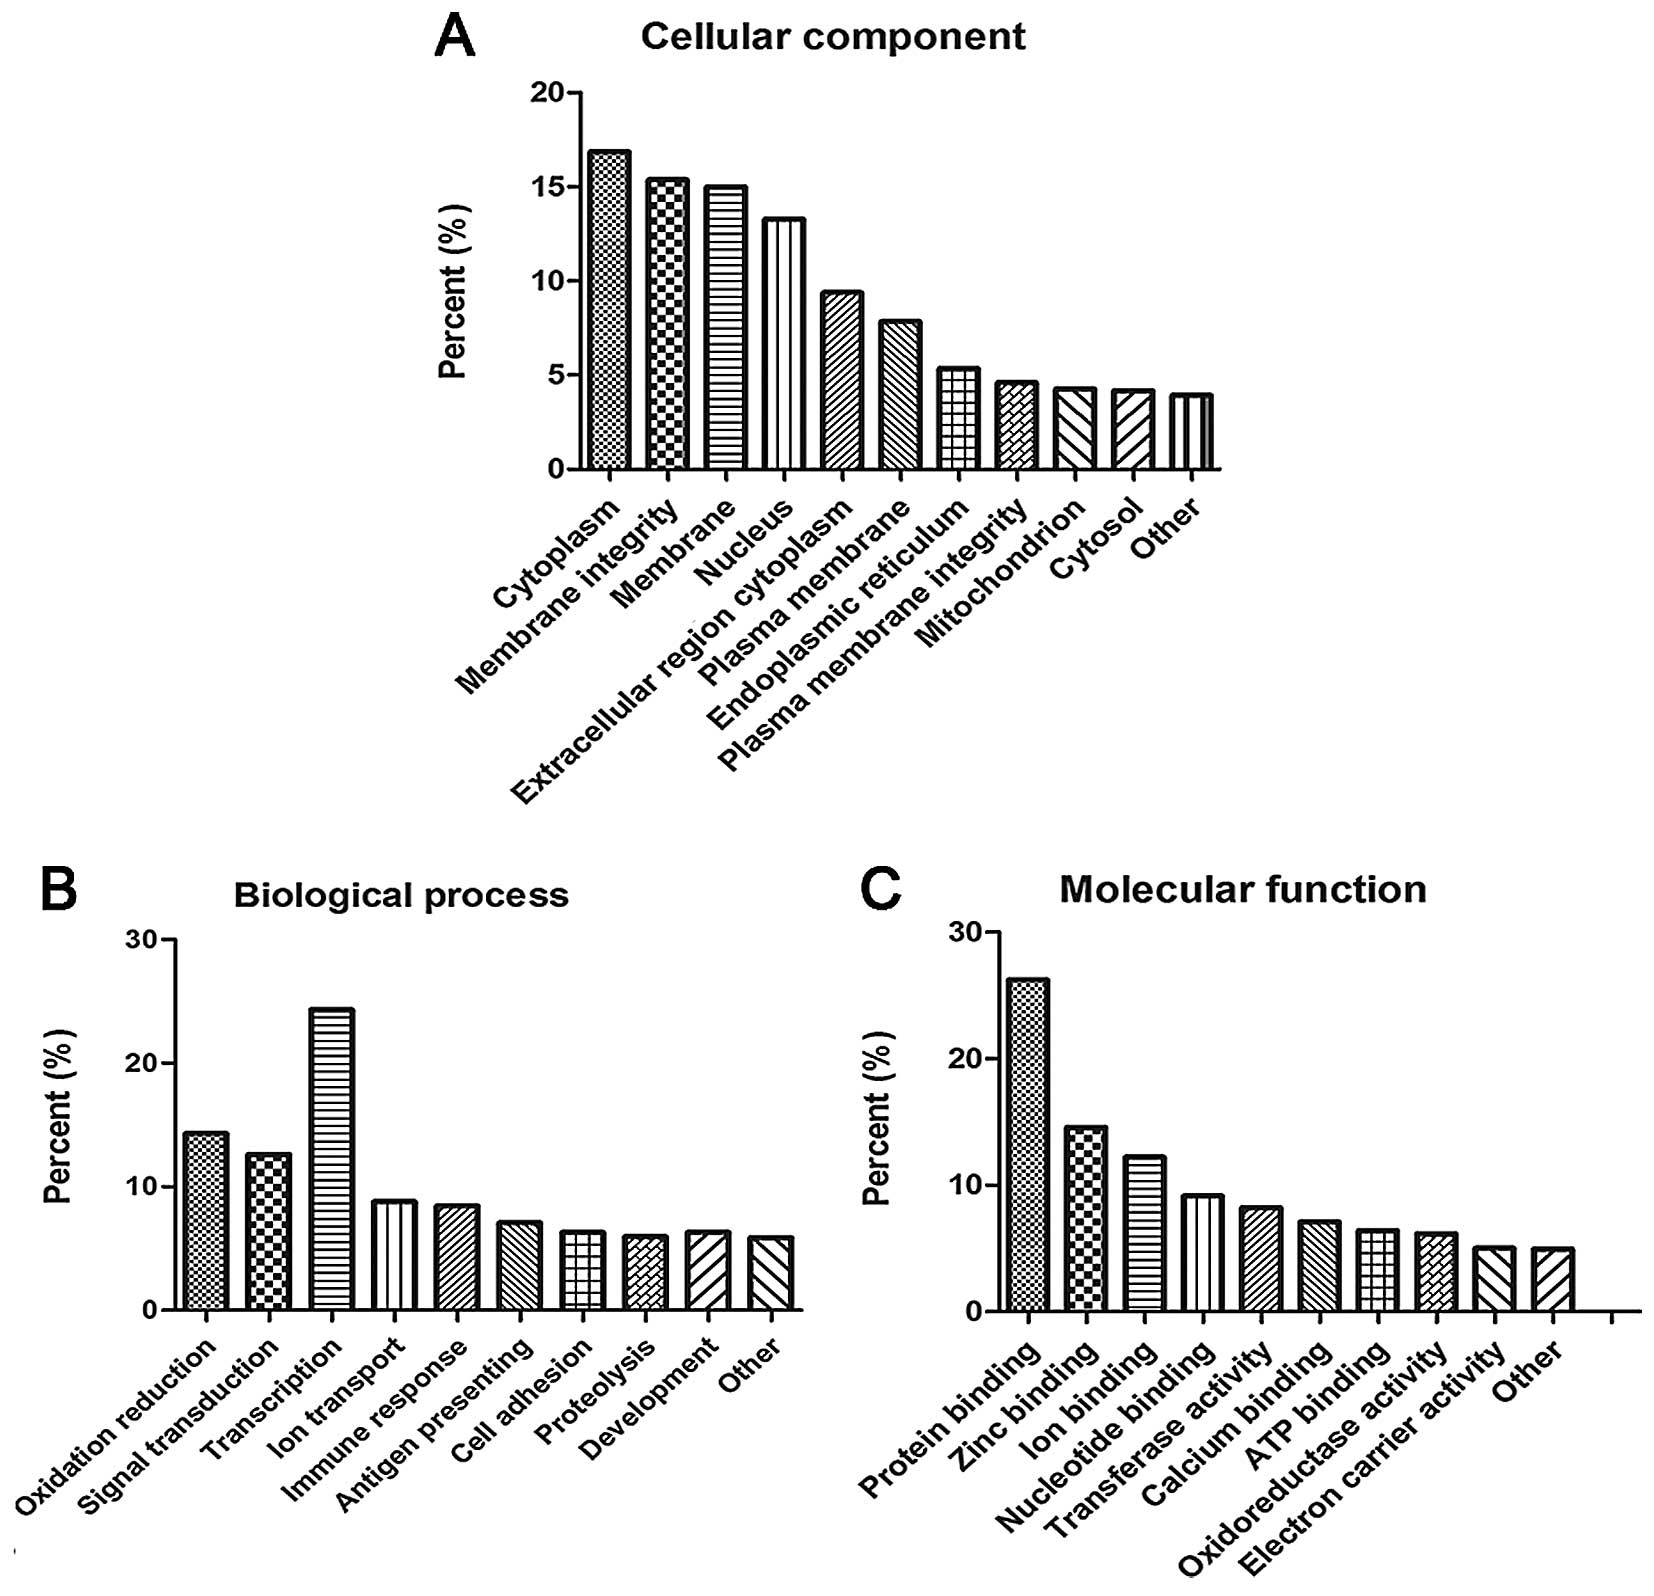
An mRNA expression profiling analysis was carried out between HCC tissues and their matched adjacent normal liver tissues. A differential level ≥2.0-fold change was regarded as significant. The expression levels of 2,694 mRNAs did not change significantly. Of these mRNAs, 924 mRNAs were upregulated and 1,770 were down-regulated in HCC tissues and their matched adjacent normal liver tissues (Fig. 2A). To conduct the analysis of gene function in detail, an analysis for the differentially expressed genes was performed. Several biological processes, molecular functions and cell components were taken into consideration. Concerning biological processes, transcription oxidation-reduction potentials, signal transduction, ion transport, immune response and cell adhesion can be involved. Regarding molecular functions, the processes of binding, protein binding, nucleotide binding, ion binding, ATP binding, transfer activity, oxidation-reduction activity and electron carrier activity were considered. Cell components, the extracellular region, cytoplasm, plasma membrane, endoplasmic reticulum and mitochondria were also considered to play a role (Fig. 3). Previous studies (28,29) showed that signaling pathways are closely associated with the development of HCC. Bioinformatics analysis was performed via analysis of the signaling pathway data using the KEGG, GenMAPP and BioCarta databases. As a result, the data suggested that the of Wnt, Jak-STAT, MAPK, ERBB2, mTOR and VEGF signaling pathways were involved in the development of HCC (Table III).

Table III

Differentially expressed genes involved in Wnt signaling pathway in microarray analysis.

Table III

Differentially expressed genes involved in Wnt signaling pathway in microarray analysis.

GenBank accession no.Gene symbolFold changeRegulation direction
NM_003508FZD92.21Downregulation
NM_006238PPARD2.38Upregulation
NM_002739PRKCG2.47Downregulation
NR_028062PRKY2.63Upregulation
NM_001198531TCF7L23.12Downregulation
NM_005052RAC33.42Downregulation
NM_001198531TCF73.62Downregulation
ENST00000394822PPP3CB3.94Upregulation
NM_003506FZD64.84Upregulation
NM_172082CAMK2B4.99Downregulation
NM_002752MAPK96.75Upregulation
NM_016269LEF18.96Upregulation
NM_003014SFRP414.41Upregulation
NM_014420DKK416.91Downregulation
NM_003015SFRP554.29Downregulation
Analysis of differentially expressed miRNA

A miRNA expression profiling analysis was carried out between HCC tissues and their matched adjacent normal liver tissues. A total of 33 miRNAs were altered significantly, of which 21 miRNAs were upregulated and 12 downregulated in the HCC tissues compared with their matched adjacent normal liver tissues (Fig. 2B). The results of the mRNA gene microarray and miRNA microarray showed that differentially expressed mRNAs and miRNAs may be involved in the development of HCC. In previous studies, mRNA was often found to be negatively regulated in relation to miRNA (39,40). We predicted the target genes of 14 differentially expressed miRNAs by DIANA microT v3.0. As a result, 1,288 target genes from 14 miRNAs were obtained. To confirm these results, we compared the obtained target genes with the results of the microarray. A total of 572 target genes were identified that were differentially expressed in the microarray (Table IV). qPCR was then performed to confirm the obtained target genes.

Table IV

Target genes of 14 differentially expressed miRNA.

Table IV

Target genes of 14 differentially expressed miRNA.

miRNA microarray
Gene microarray
miRNAExpressionTarget genesExpression
hsa-miR-127UpregulationC7orf10, GADD45G, LRRC27, SMPD3, SOX8, SYT7, TNFRSF10D, USP47, ZBTB7ADownregulation
hsa-miR-96UpregulationITPR2, FOXO1, PROSC, SDC2, TSKU, KLHDC9, ZNF577, SLC6A13, ACO1, FAM134B, OLFM1, PGM1, SNAI2, SLC1A2, GHR, KLF12, CBFA2T3, NCAM1, EPB41L4B, NRXN1, TMEM50B, TP53INP2, ACADSB, AKR1D1, AQP9, AVPI1, C1orf116, CAPN5, CASP10, CBLN3, CES3, CXorf38, CYP3A43, DBT, EFHA2, GIPR, HAPLN4, IGSF3, ITGB8, IYD, LPA, LZTS1, MASP1, MBP, MCART6, MMAB, NF1, PADI2, PIK3R1, PTCD3, RASSF6, RCAN1, RNF43, SEC14L2, SH3BGRL2, SHMT1, SLC16A2, SLC23A2, SLC45A3, SLC47A1, SLC7A2, SMOC1, SPTB, USH2A, USP15, VAPADownregulation
hsa-miR-155UpregulationKALRN, VAPA, PCDH9, ZNF236, CYP2C9, EPB41L4B, GALC, HAL, KBTBD11, MCART6, SCAMP1, USH2A, MUT, CYR61, ACVR1C, SNX29, ETNK2, KPNA1, ACADSB, ACSM5, ARG1, ATF3, ATXN10, BCL2L15, BHMT2, CA13, CARD11, CASP10, EGFR, EML5, FOS, GABRP, GLS, GPD1, GRIA4, HCN3, IL28RA, MBP, MEIG1, NBPF3, PEBP1, PIK3R1, PLN, PTCD3, PTPRD, RCAN1, SH3RF2, SLC16A2, SLC1A2, SLC20A2, SLC7A2, SYT15, WNK3, ZNF577Downregulation
hsa-miR-654UpregulationKLF12, MYO6, PPARGC1A, RNF128, USP15, ACADSB, AKR1D1, AQP9, ATXN10, BCKDHB, BCL2L15, BHMT, C1orf116, CAPN6, CASP10, CDC14B, CUX2, CXorf38, DBT, EFHA2, FOXO1, GLS, GRAMD1C, HEY2, HFE2, HLF, HNRNPA2B1, IL12RB2, ITGB8, KBTBD11, KPNA1, LPIN3, LRRC1, LRRK2, MBP, MCART6, MMAB, MSRA, MSRB2, NRXN1, OLFM1, PLN, PRRG4, PTPRD, RASSF6, RPL28, SCAMP1, SDC2, SEC14L3, SERPIND1, SH2D4A, SH3BGRL2, SLC1A2, SLC23A2, SLC2A2, SNX29, SPTB, SRD5A2, SSTR1, SULT1E1, TMCO7, TUB, ZNF236, ZNF395Downregulation
hsa-miR-339UpregulationBDH2, C10orf114, CROCC, GIPR, GREM2, KPNA1, KRBA2, PIK3R1, PSD3, RPL28, SALL3, SOX8, SSTR1, TRPV6Downregulation
hsa-miR-432UpregulationMASP1, PTCD3, SLCO4C1, ADI1, ARMC5, PDE4DIP, SAMD4A, ABTB2, FAM134B, ITPR2, MACROD2, SPTB, ACVR1C, ANKS1A, CXCL2, GLYAT, KBTBD11, PPM1K, RPH3AL, SS18L1, TCF7, AQP9, BHMT2, BZRAP1, CDC14B, CES3, CUX2, CXCL12, CXCL14, CYP2B6, DBT, EFHA2, EGFR, EPB41L4B, FAM123B, FMO4, FOS, FOXO1, GABRP, GCHFR, GHR, GIPR, IGSF3, ITGB8, KMO, LNP1, LRRC1, LZTS1, NCAM1, NF1, PTPRD, RCL1, SH2D4A, SLC30A4, SLC7A2, SMPD3, TSKU, TSPAN12, TUB, VWCE, XPNPEP2, ZBTB7CDownregulation
hsa-miR-410UpregulationACADSB, AIM1, AMDHD1, EFHA2, EPB41L4B, HSD11B1, ITGB8, TPR2, LRRK2, PLN, RGS16, SCAMP1, SLC1A2, SLC7A2, SRD5A1, TMEM50B, TNFRSF10D, ZNF577, ME1, ABCG2, ADI1, AQP9, ATM, BCL2L15, C1orf116, C7orf58, CA13, CMBL, CXCL12, CXCL14, DBT, FAM123B, FOSB, GALC, GFRA1, GIPC2, HS3ST3B1, IYD, KPNA1, MYO9A, NF1, OAT, PIK3R1, PSD3, PTPRD, PUS10, RASSF6, SH3BGRL2, SIVA1, SLC20A2, SLC30A4, SS18L1, SSTR1, TDRD6, TGDS, TSPAN12, USP15, VAPA, ZNF131, ZNF236Downregulation
hsa-miR-99aDownregulationKBTBD8, CD93, RASA3, ST6GALNAC4Upregulation
hsa-miR-409UpregulationEML5, ACVR1C, CYP3A4, KLF12, ME1, MPDZ, PTCD3, SALL3, SLC38A2, TUBE1, ASPA, EGFR, GREM2, ACADSB, ALDH5A1, BCL2L15, C7orf58, CACNA2D4, CAPN5, CXCL2, DBT, EFHA2, FAM123B, GALC, GHR, GRIA4, ITGB8, KCNB1, MBP, MCART6, MMAB, MMP19, PIK3R1, POU4F1, PPARGC1A, PTPN2, RASSF6, RNF128, SH2D4A, SH3RF2, SIRPB1, SLC30A4, SLC7A2, SNX29, TBX3, TDRD6, VAPA, WNK3, ZDHHC23, ZNF236, ZNF425Downregulation
hsa-miR-542UpregulationIL28RA, USP15, DES, IER5L, DAK, FOSB, GIPR, GPR146, GUCA2B, HAPLN4, KLF12, MASP1, MORN1, MTTP, NF1, PKLR, RGS16, SH2D4A, SH3RF2, SLC16A2, SLC1A2, SMPD3, SNX29, SOX8, SRD5A2, SYT15, TP53INP2, VWA1Downregulation
hsa-miR-652UpregulationKPNA1, LRRC1, BCL2L15, IL28RA, KCNB1, PPIL2, SNX29, TNFRSF10DDownregulation
hsa-miR-551UpregulationANKS1A, CACNA2D4, IYD, KBTBD11, UPB1Downregulation
hsa-miR-532UpregulationCACNA2D4, CMBL, ETNK2, IL6R, KIAA1161, NF1, PRRG4, SH3RF2, SLC7A2, SMOC1, ZNF425, ABCA8, ACACB, ACADSB, ACO1, AKR1D1, ANKS1A, APOA5, AQP9, AZGP1, BDH2, C1orf116, C1orf187, C22orf36, CAPN6, CBLN3, CDC14B, CXCL12, CYP2A13, CYP3A4, DBT, DES, DIRAS3, FAM123B, FNDC5, FOSB, FOXO1, GCHFR, GLYAT, GPD1, GREM2, HAPLN4, HCN3, HLF, IGSF3, IYD, KANK4, KATNAL2, KCNK5, LPIN3, LRRC27, MBP, MMAB, MMP19, MSRA, NBPF3, NCAM1, OASL, PI16, PIK3R1, POU4F1, PPARGC1A, PPP1R3F, PRKCG, PSD3, PTCD3, RCAN1, RGS16, SART1, SCAMP1, SEC14L2, SH3BGRL2, SHMT1, SLC20A2, SMPD3, SNX29, SOX8, SPTB, SS18L1, SYT7, TBCD, TCAP, TDRD6, TMEM105, TNFRSF10D, TNFRSF14, TRH, TUB, WFDC5, ZBTB7C, ZDHHC11, ZNF577Downregulation
hsa-miR-503UpregulationC7orf58, GADD45G, CAPN6, PCDH9, SLC20A2, WNK3, ACADL, ALDH1A3, ANKS1A, C14orf180, CCDC25, IL28RA, ITGB8, PTCD3, SNX29, ACADSB, AIM1, BDH2, CACNA2D4, CBFA2T3, CDADC1, CDC14B, CIDEB, CLEC4G, EML5, EPB41L4B, FAM123B, GABRP, GALC, GHR, GPD1, GREM2, HAPLN4, IYD, KCNK5, LHPP, MBP, MCART6, MMAB, MPDZ, NF1, PIK3R1, PRKCG, PTPRD, RCL1, RNF43, RHBG, SALL3, SH3BGRL2 SLC7A2, SMPD3, TCF7, TUB, USH2A, ZDHHC23Downregulation
Validation of microarray data

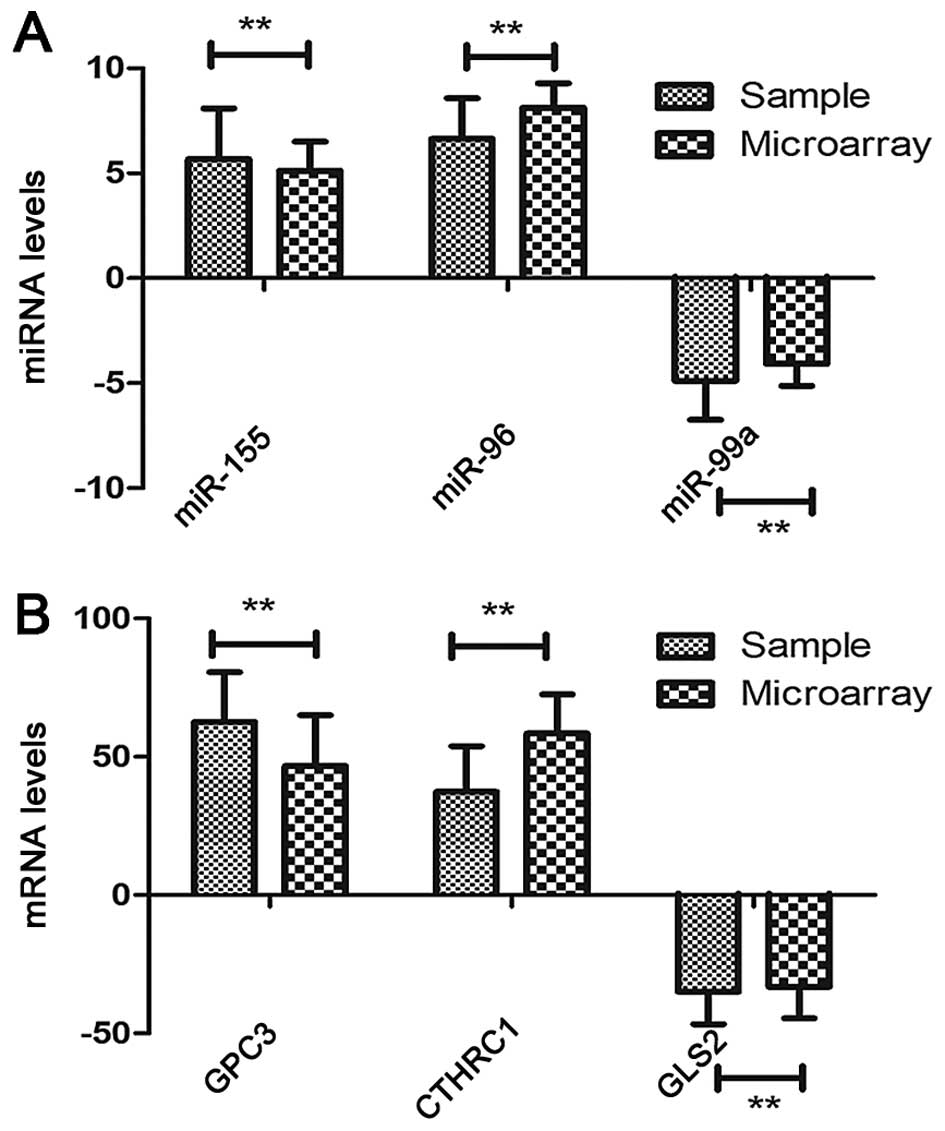
To validate the microarray results, three mRNAs and three miRNAs were selected from the differentially expressed genes and miRNAs in the HCC tissues as compared with their matched normal liver tissues by qPCR were assessed. The results indicated that GPC3, CTHRC1, miR-155 and miR-96 were significantly upregulated, whereas GLS2 and miR-99a were significantly downregulated, which was consistent with the microarray results (Fig. 4).

Discussion

To the best of our knowledge, few studies have focused on the correlation analysis of miRNA and mRNA expression and the prediction of miRNA target genes. In the present study, we identified 2,694 mRNAs and 33 miRNAs that were differentially expressed between the HCC tissues and their matched adjacent normal liver tissues by microarray. Most of our identified mRNAs and miRNAs were also found to be involved in many biological processes, especially in the development and progression of tumors. miR-96 can be increased with hypoxia in prostate cancer and stimulated autophagy by mTOR (21). Downregulation of miR-122 (22), miR-99a (23) and miR-193 (24) and upregulation of miR-127 (25) and miR-155 (26) have been reported to be involved in the development and progression of tumors. The results of the present study show that, miR-135a, miR-151a, miR-155, miR-96 and miR-410 were upregulated, and miR-122, miR-99a, miR-193b and miR-378a were downregulated in HCC tissues compared with their matched adjacent normal liver tissues. It is probable that the differentially expressed mRNAs and miRNAs may be involved in the development and progression of HCC.

Signaling pathways may be important in the development and progression of tumors (2729). Thus, we carried out the bioinformatics analysis by analyzing the data of signaling pathways using the KEGG, GenMAPP and BioCarta databases. As a result, the signaling pathways of Wnt, Jak-STAT, MAPK, ERBB2, mTOR and VEGF were found to be involved in the development of HCC. In the present study, several genes were found to be involved in signaling pathways, especially the Wnt signaling pathway. The Wnt signaling pathway is evolutionarily conserved and plays an important role in cell proliferation and embryonic development (30,31). The Wnt signaling pathway includes the signaling protein (Wnt protein), transmembrane receptors, cytoplasmic protein, transcription factors and related target genes. Activation of β-catenin can lead to activation of the Wnt signaling pathway (32,33). When there is no Wnt signal, GSK-3β combines with APC and axin to phosphorylate β-catenin in the cytoplasm. β-catenin is then degraded through the ubiquitin-proteasome pathway resulting in the Wnt signaling pathway being closed with a low level of β-catenin (34,35). The Wnt signaling pathway is activated when the above homeostasis was broken resulting in an excess of β-catenin in hepatocytes. β-catenin also binds to transcription factors such as TCF/LEF to form a heterodimer and this regulates related target genes such as MMP-9, cyclin D1, c-myc and COX-2 (3638). Thus, β-catenin regulates hepatocyte proliferation through the above process.

Identification of miRNA target genes is crucial for the determination of biological functions of miRNAs (39,40). As predicted, 572 target genes from 14 miRNAs were identified that were differentially expressed in the microarray. To validate the results of microarray, three mRNAs and three miRNAs were subjected to qPCR. The results show that GPC3, CTHRC1, miR-155 and miR-96 were significantly upregulated, whereas GLS2 and miR-99a were significantly downregulated. The results of qPCR were in concordance with the microarray data. Of note, miR-155 was significantly upregulated and GLS2 was significantly downregulated in all the HCC tissues compared with their matched adjacent normal liver tissues. miR-155 has been regarded as a potential target for therapeutic intervention and acts as a ubiquitous oncogene in human cancers (41). Gao et al (42) found that a high expression of miR-155 potentially served as a valuable marker for non-small cell lung cancer patients in stage III. Gasparini et al (43) found that the expression level of miR-155 was significantly upregulated in breast cancer patients, and miR-155 was able to regulate DNA repair activity. In addition, the results of the study by Lao et al (44) showed that miR-155 regulated the expression of LKB1 to promote the proliferation of cervical cancer cells. According to the findings of Yang et al (45), miR-155 may be closely associated with tumor stage, and a high expression of miR-155 represented a new biomarker for rectal carcinoma. In the present study, upregulation of miR-155 indicated that it may be involved in the infinite proliferation of HCC cells. GLS2, the target gene of miR-155, has been known to play a significant role in energy metabolism. Giacobbe et al (46) found that GLS2 was upregulated as the target gene of TAp63 in colon adenocarcinoma, and the regulation mechanism of TAp63 and GLS2 was very important for physiological and pathological processes. The findings of Xiang et al (47) showed that GLS2 may be involved in glutamine metabolism, and they explored the potential mechanism of GLS2 in cervical carcinoma. Findings of those authors showed that GLS2 may play a significant role in cervical cancer patients. Zhang and his colleagues (48) considered that GLS2 played a significant role in energy metabolism, and was downregulated in HCC patients. Furthermore, they found that GLS2 probably promoted hypermethylation by epigenetic silencing, and that GLS2 seemed to be a tumor suppressor in colon adenocarcinoma and HCC patients. Martín-Rufián and his colleagues (49) found that the upregulation of GLS2 inhibited the induction of glioma cells, and ROS may inhibit cell migration by the overexpression of GLS2. The abovementioned studies suggest that miR-155 and its target gene GLS may be strongly linked with the proliferation and metastasis of HCC patients. Future studies should examine the potential mechanism of miR-155 and its target gene GLS2, which may provide reliable evidence for the specific-targeted gene therapy of HCC.

Our results have shown that, 15 differentially expressed genes were associated with the Wnt signaling pathway, in which 7 genes were upregulated and 8 genes downregulated. This suggests that the activation of these differentially expressed genes may lead to the infinite proliferation of HCC cells.

In the present study, we found 2,694 mRNAs and 33 miRNAs that were differentially expressed between HCC tissues and their matched adjacent normal liver tissues by microarray. The results of the GO and pathway analysis, biological processes, such as transcription, oxidation reduction, signal transduction, ion transport, immune response, the signaling pathways of Wnt, Jak-STAT, MAPK, ERBB2, mTOR and VEGF may be involved in the development of HCC. Results of the bioinformatics analysis may provide insight into the early diagnosis and specific-targeted gene therapy of HCC.

Acknowledgments

The present was supported in part by the Guangxi Scientific Research and Technical Development Program (No. 1355005-3-10 and No. 1298003-2-8), and the Youth Science Foundation of Guangxi Medical University (No. GXMUYSF201215). We would like to thank Dr Dev Sooranna, Imperial College London, for helping to edit the manuscript.

References

1 

Bosetti C, Turati F and La Vecchia C: Hepatocellular carcinoma epidemiology. Best Pract Res Clin Gastroenterol. 28:753–770. 2014. View Article : Google Scholar : PubMed/NCBI

2 

Mikhail S, Cosgrove D and Zeidan A: Hepatocellular carcinoma: Systemic therapies and future perspectives. Expert Rev Anticancer Ther. 14:1205–1218. 2014. View Article : Google Scholar : PubMed/NCBI

3 

Morishita A and Masaki T: miRNA in hepatocellular carcinoma. Hepatol Res. 45:128–141. 2014. View Article : Google Scholar : PubMed/NCBI

4 

Mathew S, Ali A, Abdel-Hafiz H, Fatima K, Suhail M, Archunan G, Begum N, Jahangir S, Ilyas M, Chaudhary AG, et al: Biomarkers for virus-induced hepatocellular carcinoma (HCC). Infect Genet Evol. 26:327–339. 2014. View Article : Google Scholar : PubMed/NCBI

5 

Wu CS, Lee TY, Chou RH, Yen CJ, Huang WC, Wu CY and Yu YL: Development of a highly sensitive glycan microarray for quantifying AFP-L3 for early prediction of hepatitis B virus-related hepatocellular carcinoma. PLoS One. 9:e999592014. View Article : Google Scholar : PubMed/NCBI

6 

Murakami Y, Tanahashi T, Okada R, Toyoda H, Kumada T, Enomoto M, Tamori A, Kawada N, Taguchi YH and Azuma T: Comparison of hepatocellular carcinoma miRNA expression profiling as evaluated by next generation sequencing and microarray. PLoS One. 9:e1063142014. View Article : Google Scholar : PubMed/NCBI

7 

He TL, Zheng KL, Li G, Song B and Zhang YJ: Identification of typical miRNAs and target genes in hepatocellular carcinoma by DNA microarray technique. Eur Rev Med Pharmacol Sci. 18:108–116. 2014.PubMed/NCBI

8 

Wang L, Yao J, Zhang X, Guo B, Le X, Cubberly M, Li Z, Nan K, Song T and Huang C: miRNA-302b suppresses human hepatocellular carcinoma by targeting AKT2. Mol Cancer Res. 12:190–202. 2014. View Article : Google Scholar

9 

Yan H, Wang S, Yu H, Zhu J and Chen C: Molecular pathways and functional analysis of miRNA expression associated with paclitaxel-induced apoptosis in hepatocellular carcinoma cells. Pharmacology. 92:167–174. 2013. View Article : Google Scholar : PubMed/NCBI

10 

Kogure T, Kondo Y, Kakazu E, Ninomiya M, Kimura O and Shimosegawa T: Involvement of miRNA-29a in epigenetic regulation of transforming growth factor-β-induced epithelial-mesenchymal transition in hepatocellular carcinoma. Hepatol Res. 44:907–919. 2014. View Article : Google Scholar

11 

Zhang J, Wang Y, Zhen P, Luo X, Zhang C, Zhou L, Lu Y, Yang Y, Zhang W and Wan J: Genome-wide analysis of miRNA signature differentially expressed in doxorubicin-resistant and parental human hepatocellular carcinoma cell lines. PLoS One. 8:e541112013. View Article : Google Scholar : PubMed/NCBI

12 

Zhuo L, Liu J, Wang B, Gao M and Huang A: Differential miRNA expression profiles in hepatocellular carcinoma cells and drug-resistant sublines. Oncol Rep. 29:555–562. 2013.

13 

Fang L, Du WW, Yang X, Chen K, Ghanekar A, Levy G, Yang W, Yee AJ, Lu WY, Xuan JW, et al: Versican 3′-untranslated region (3′-UTR) functions as a ceRNA in inducing the development of hepatocellular carcinoma by regulating miRNA activity. FASEB J. 27:907–919. 2013. View Article : Google Scholar

14 

Rawlings-Goss RA, Campbell MC and Tishkoff SA: Global population-specific variation in miRNA associated with cancer risk and clinical biomarkers. BMC Med Genomics. 7:532014. View Article : Google Scholar : PubMed/NCBI

15 

Ahmed FE: miRNA as markers for the diagnostic screening of colon cancer. Expert Rev Anticancer Ther. 14:463–485. 2014. View Article : Google Scholar : PubMed/NCBI

16 

Espinosa-Parrilla Y, Muñoz X, Bonet C, Garcia N, Venceslá A, Yiannakouris N, Naccarati A, Sieri S, Panico S, Huerta JM, et al: Genetic association of gastric cancer with miRNA clusters including the cancer-related genes MIR29, MIR25, MIR93 and MIR106: Results from the EPIC-EURGAST study. Int J Cancer. 135:2065–2076. 2014. View Article : Google Scholar : PubMed/NCBI

17 

Panza A, Votino C, Gentile A, Valvano MR, Colangelo T, Pancione M, Micale L, Merla G, Andriulli A, Sabatino L, et al: Peroxisome proliferator-activated receptor γ-mediated induction of microRNA-145 opposes tumor phenotype in colorectal cancer. Biochim Biophys Acta. 1843:1225–1236. 2014. View Article : Google Scholar : PubMed/NCBI

18 

Pan XM, Sun RF, Li ZH, Guo XM, Zhang Z, Qin HJ, Xu GH and Gao LB: A let-7 KRAS rs712 polymorphism increases colorectal cancer risk. Tumour Biol. 35:831–835. 2014. View Article : Google Scholar

19 

Kumar S, Mapa K and Maiti S: Understanding the effect of locked nucleic acid and 2′-O-methyl modification on the hybridization thermodynamics of a miRNA-mRNA pair in the presence and absence of AfPiwi protein. Biochemistry. 53:1607–1615. 2014. View Article : Google Scholar : PubMed/NCBI

20 

O’Connor T, Wilmut I and Taylor J: Quantitative evaluation of reference genes for real-time PCR during in vitro maturation of ovine oocytes. Reprod Domest Anim. 48:477–483. 2013. View Article : Google Scholar

21 

Ma Y, Yang HZ, Dong BJ, Zou HB, Zhou Y, Kong XM and Huang YR: Biphasic regulation of autophagy by miR-96 in prostate cancer cells under hypoxia. Oncotarget. 5:9169–9182. 2014.PubMed/NCBI

22 

Wotschofsky Z, Busch J, Jung M, Kempkensteffen C, Weikert S, Schaser KD, Melcher I, Kilic E, Miller K, Kristiansen G, et al: Diagnostic and prognostic potential of differentially expressed miRNAs between metastatic and non-metastatic renal cell carcinoma at the time of nephrectomy. Clin Chim Acta. 416:5–10. 2013. View Article : Google Scholar

23 

Sun D, Layer R, Mueller AC, Cichewicz MA, Negishi M, Paschal BM and Dutta A: Regulation of several androgen- induced genes through the repression of the miR-99a/let-7c/miR-125b-2 miRNA cluster in prostate cancer cells. Oncogene. 33:1448–1457. 2014. View Article : Google Scholar :

24 

Walter BA, Valera VA, Pinto PA and Merino MJ: Comprehensive microRNA profiling of prostate cancer. J Cancer. 4:350–357. 2013. View Article : Google Scholar : PubMed/NCBI

25 

Mian C, Pennelli G, Fassan M, Balistreri M, Barollo S, Cavedon E, Galuppini F, Pizzi M, Vianello F, Pelizzo MR, et al: MicroRNA profiles in familial and sporadic medullary thyroid carcinoma: Preliminary relationships with RET status and outcome. Thyroid. 22:890–896. 2012. View Article : Google Scholar : PubMed/NCBI

26 

Kong W, He L, Richards EJ, Challa S, Xu CX, Permuth-Wey J, Lancaster JM, Coppola D, Sellers TA, Djeu JY, et al: Upregulation of miRNA-155 promotes tumour angiogenesis by targeting VHL and is associated with poor prognosis and triple-negative breast cancer. Oncogene. 33:679–689. 2014. View Article : Google Scholar :

27 

Li X, Stevens PD, Liu J, Yang H, Wang W, Wang C, Zeng Z, Schmidt MD, Yang M, Lee EY, et al: PHLPP is a negative regulator of RAF1, which reduces colorectal cancer cell motility and prevents tumor progression in mice. Gastroenterology. 146:1301–12.e1. 102014. View Article : Google Scholar : PubMed/NCBI

28 

Garg M, Kanojia D, Okamoto R, Jain S, Madan V, Chien W, Sampath A, Ding LW, Xuan M, Said JW, et al: Laminin-5γ-2 (LAMC2) is highly expressed in anaplastic thyroid carcinoma and is associated with tumor progression, migration, and invasion by modulating signaling of EGFR. J Clin Endocrinol Metab. 99:E62–E72. 2014. View Article : Google Scholar

29 

Oshima H, Ishikawa T, Yoshida GJ, Naoi K, Maeda Y, Naka K, Ju X, Yamada Y, Minamoto T, Mukaida N, et al: TNF-α/TNFR1 signaling promotes gastric tumorigenesis through induction of Noxo1 and Gna14 in tumor cells. Oncogene. 33:3820–3829. 2014. View Article : Google Scholar

30 

Liu H, Yan ZQ, Li B, Yin SY, Sun Q, Kou JJ, Ye D, Ferns K, Liu HY and Liu SL: Reduced expression of SOX7 in ovarian cancer: A novel tumor suppressor through the Wnt/β-catenin signaling pathway. J Ovarian Res. 7:872014. View Article : Google Scholar

31 

Chen CC, Chen HY, Su KY, Hong QS, Yan BS, Chen CH, Pan SH, Chang YL, Wang CJ, Hung PF, et al: Shisa3 is associated with prolonged survival through promoting β-catenin degradation in lung cancer. Am J Respir Crit Care Med. 190:433–444. 2014. View Article : Google Scholar : PubMed/NCBI

32 

Murphy AJ, Pierce J, de Caestecker C, Ayers GD, Zhao A, Krebs JR, Saito-Diaz VK, Lee E, Perantoni AO, de Caestecker MP, et al: CITED1 confers stemness to Wilms tumor and enhances tumorigenic responses when enriched in the nucleus. Oncotarget. 5:386–402. 2014.PubMed/NCBI

33 

Daino K, Imaoka T, Morioka T, Tani S, Iizuka D, Nishimura M and Shimada Y: Loss of the BRCA1-interacting helicase BRIP1 results in abnormal mammary acinar morphogenesis. PLoS One. 8:e740132013. View Article : Google Scholar : PubMed/NCBI

34 

Janssens S, Van Den Broek O, Davenport IR, Akkers RC, Liu F, Veenstra GJ, Hoppler S, Vleminckx K and Destrée O: The Wnt signaling mediator tcf1 is required for expression of foxd3 during Xenopus gastrulation. Int J Dev Biol. 57:49–54. 2013. View Article : Google Scholar : PubMed/NCBI

35 

Herbst A, Jurinovic V, Krebs S, Thieme SE, Blum H, Göke B and Kolligs FT, Blum H, Goke B and Kolligs FT: Comprehensive analysis of β-catenin target genes in colorectal carcinoma cell lines with deregulated Wnt/β-catenin signaling. BMC Genomics. 15:742014. View Article : Google Scholar

36 

Cai WY, Wei TZ, Luo QC, Wu QW, Liu QF, Yang M, Ye GD, Wu JF, Chen YY, Sun GB, et al: The Wnt-β-catenin pathway represses let-7 microRNA expression through transactivation of Lin28 to augment breast cancer stem cell expansion. J Cell Sci. 126:2877–2889. 2013. View Article : Google Scholar : PubMed/NCBI

37 

Ho CS, Yap SH, Phuah NH, In LL and Hasima N: MicroRNAs associated with tumour migration, invasion and angiogenic properties in A549 and SK-Lu1 human lung adenocarcinoma cells. Lung Cancer. 83:154–162. 2014. View Article : Google Scholar

38 

Sehgal P, Kumar N, Praveen Kumar VR, Patil S, Bhattacharya A, Vijaya Kumar M, Mukherjee G and Kondaiah P: Regulation of protumorigenic pathways by insulin like growth factor binding protein2 and its association along with β-catenin in breast cancer lymph node metastasis. Mol Cancer. 12:632013. View Article : Google Scholar

39 

Hsieh WJ, Lin FM, Huang HD and Wang H: Investigating microRNA-target interaction-supported tissues in human cancer tissues based on miRNA and target gene expression profiling. PLoS One. 9:e956972014. View Article : Google Scholar : PubMed/NCBI

40 

Kong X, Xu X, Yan Y, Guo F, Li J, Hu Y, Zhou H and Xun Q: Estrogen regulates the tumour suppressor MiRNA-30c and its target gene, MTA-1, in endometrial cancer. PLoS One. 9:e908102014. View Article : Google Scholar : PubMed/NCBI

41 

Feng M, Luo X, Gu C and Fei J: Seed targeting with tiny anti- miR-155 inhibits malignant progression of multiple myeloma cells. J Drug Target. 23:59–66. 2015. View Article : Google Scholar

42 

Gao Y, Fu S, Jiang W, Li B, Tian Y and Fu X: Association of MiR-155 expression with prognosis in resected stage III non-small cell lung cancer. Zhongguo Fei Ai Za Zhi. 17:417–423. 2014.In Chinese. PubMed/NCBI

43 

Gasparini P, Lovat F, Fassan M, Casadei L, Cascione L, Jacob NK, Carasi S, Palmieri D, Costinean S, Shapiro CL, et al: Protective role of miR-155 in breast cancer through RAD51 targeting impairs homologous recombination after irradiation. Proc Natl Acad Sci USA. 111:4536–4541. 2014. View Article : Google Scholar : PubMed/NCBI

44 

Lao G, Liu P, Wu Q, Zhang W, Liu Y, Yang L and Ma C: Mir-155 promotes cervical cancer cell proliferation through sup-pression of its target gene LKB1. Tumour Biol. 35:11933–11938. 2014. View Article : Google Scholar : PubMed/NCBI

45 

Yang Y, Tang Md Ph DT, Peng W, Xia L, Wang X, Duan B and Shu Y: The comparison of miR-155 with computed tomography and computed tomography plus serum amyloid A protein in staging rectal cancer. J Surg Res. 193:764–771. 2015. View Article : Google Scholar

46 

Giacobbe A, Bongiorno-Borbone L, Bernassola F, Terrinoni A, Markert EK, Levine AJ, Feng Z, Agostini M, Zolla L, Agrò AF, et al: p63 regulates glutaminase 2 expression. Cell Cycle. 12:1395–1405. 2013. View Article : Google Scholar : PubMed/NCBI

47 

Xiang L, Xie G, Liu C, Zhou J, Chen J, Yu S, Li J, Pang X, Shi H and Liang H: Knock-down of glutaminase 2 expression decreases glutathione, NADH, and sensitizes cervical cancer to ionizing radiation. Biochim Biophys Acta. 1833:2996–3005. 2013. View Article : Google Scholar : PubMed/NCBI

48 

Zhang J, Wang C, Chen M, Cao J, Zhong Y, Chen L, Shen HM and Xia D: Epigenetic silencing of glutaminase 2 in human liver and colon cancers. BMC Cancer. 13:6012013. View Article : Google Scholar : PubMed/NCBI

49 

Martín-Rufián M, Nascimento-Gomes R, Higuero A, Crisma AR, Campos-Sandoval JA, Gómez-García MC, Cardona C, Cheng T, Lobo C, Segura JA, et al: Both GLS silencing and GLS2 overexpression synergize with oxidative stress against proliferation of glioma cells. J Mol Med Berl. 92:277–290. 2014. View Article : Google Scholar

Related Articles

Journal Cover

July-2015
Volume 34 Issue 1

Print ISSN: 1021-335X
Online ISSN:1791-2431

Sign up for eToc alerts

Recommend to Library

Copy and paste a formatted citation
x
Spandidos Publications style
Gao B, Ning S, Li J, Liu H, Wei W, Wu F, Tang Y, Feng Y, Li K, Zhang L, Zhang L, et al: Integrated analysis of differentially expressed mRNAs and miRNAs between hepatocellular carcinoma and their matched adjacent normal liver tissues. Oncol Rep 34: 325-333, 2015
APA
Gao, B., Ning, S., Li, J., Liu, H., Wei, W., Wu, F. ... Zhang, L. (2015). Integrated analysis of differentially expressed mRNAs and miRNAs between hepatocellular carcinoma and their matched adjacent normal liver tissues. Oncology Reports, 34, 325-333. https://doi.org/10.3892/or.2015.3968
MLA
Gao, B., Ning, S., Li, J., Liu, H., Wei, W., Wu, F., Tang, Y., Feng, Y., Li, K., Zhang, L."Integrated analysis of differentially expressed mRNAs and miRNAs between hepatocellular carcinoma and their matched adjacent normal liver tissues". Oncology Reports 34.1 (2015): 325-333.
Chicago
Gao, B., Ning, S., Li, J., Liu, H., Wei, W., Wu, F., Tang, Y., Feng, Y., Li, K., Zhang, L."Integrated analysis of differentially expressed mRNAs and miRNAs between hepatocellular carcinoma and their matched adjacent normal liver tissues". Oncology Reports 34, no. 1 (2015): 325-333. https://doi.org/10.3892/or.2015.3968