Introduction
In recent decades, the incidence of colorectal
cancer (CRC) has increased by 2- to 4-fold in many Eastern Asia
countries such as China, Japan, South Korea and Singapore (1,2). The
high risk of CRC among the Asian population, including Malaysia, is
associated with a low fiber diet and high tobacco consumption
(3). One of the screening methods
to detect early stage of CRC is by measuring the level of
carcinoembryonic antigen (CEA) in the serum, however, the
sensitivity of the marker was reported to be <80% (4–6).
Therefore, the identification of new biological markers for CRC is
crucial.
Epigenetic markers such as methylation markers in
CRC were first reported 10 years ago in DNA from stool and blood
samples (7). DNA methylation is an
epigenetic mechanisms that involves the enzymatic process of adding
the methyl group to the 5-carbon position of the cytosine to form
5-meth-ylcytosine (8–10). This modification mostly occurs in
the CG enriched site known as CpG islands (CGI), which are present
in 70% of the annotated gene promoter regions (11). Two typical DNA methylation patterns,
global hypomethylation and CGI hypermethylation, have emerged as
potential signatures in the cancer genome (12). Hypermethylation is generally found
in the promoter CGI region, whereas global hypomethylation
frequently occurs in CpG dinucleotides that are located in the
repetitive sequences of DNA (satellite repeats or retrotransposon)
(13).
CGI hypermethylation in the promoter region is
thought to be linked with the transcriptional inactivation of
tumor-suppressor genes (14,15).
This is mediated through the methyl-CpG binding proteins (MBDs)
resulting in a compacted chromatin conformation (15,16).
The compacted chromatin hinders the accessibility of the
transcriptional machinery from binding to the promoter region,
thereby leading to the repression of gene expression (17). The inverse relationship between DNA
methylation and transcript level was reported in a study involving
chromosomes 6, 20 and 22 in 43 healthy human tissue and primary
cells (18). The study revealed
that one-third of the differentially methylated genes (representing
17% of the 873 analyzed genes) were found to be inversely
associated with their transcript levels (18).
Apart from the conventional polymerase chain
reaction (PCR) method, the microarray chip-based study is a widely
used approach in exploring methylation markers in CRC (14,19,20).
In a study using the Illumina GoldenGate® methylation
array on 28 normal mucosa and 91 CRC samples, 202 CpG sites with 90
hypermethylated and 42 hypomethylated loci that involved 132 genes
were identified (21). Using the
level of CpG island methylator phenotype (CIMP), CRC was divided
into three different subgroups (21). A more recent study identified 169
hypermethylated loci and validated 11 of these loci that could be
distinguished between CRC and non-neoplastic colonic mucosa
(22). Among the genes were
dedicator of cytokinesis 8 (DOCK8), visual system homeobox 2
(VSX2), microRNA 34b (miR-34b), glucagon-like peptide
1 receptor (GLP1R1), B-cell translocation gene 4
(BTG4), BEN domain containing 4 (BEND4), neuronal
pentraxin I (NPTX1), ALX homeobox 3 (ALX3), zinc
finger protein 583 (ZNF583), homer homolog 2 (HOMER2)
and gap junction protein, gamma 1 (GJC1) (22).
Hypermethylated markers identified previously in CRC
using a single array profile cannot reflect completely the
complexity of the disease. To address this issue, epigenomic and
genomic data from microarray analyses have been used to obtain a
more comprehensive insight of the molecular mechanisms involved in
CRC (17,23–25).
The Cancer Genome Atlas study revealed a comprehensive molecular
image of CRC by integrating data between promoter methylation, DNA
copy number, exome sequencing, microRNA expression and messenger
RNA expression in 224 CRC and normal samples (26). Apart from identifying gene mutations
involved in the well-established signaling pathways, the authors of
that study also documented the new critical role of MYC in
directing the transcriptional activation and repression in CRC.
Additional findings included repetitive mutations in APC membrane
recruitment protein 1 (FAM123B) and AT rich interactive
domain 1A (ARID1A) as well as a novel mutation in SRY (sex
determining region Y)-box 9 (SOX9) (26).
Studies using a similar integrative approach of
analyses on Asian patients are lacking. Therefore, the aim of the
present study was to investigate the biological complexity of CRC
by integrating DNA methylation and gene expression profiling
signatures using paired samples from local patients. The integrated
signatures may later serve as potential diagnostic markers for the
prognostication of CRC. We also hypothesized that CpG
hypermethylation in the promoter region of CRC-associated genes led
to a low expression of the respective genes.
Materials and methods
Clinical samples
A total of 55 paired colorectal carcinoma and their
corresponding adjacent normal epithelial cells (10 cm away from the
tumor) were collected at surgery from patients at the Universiti
Kebangsaan Malaysia Medical Centre, Kuala Lumpur, Malaysia.
Patients provided written informed consent to participate in the
present study. This study was approved by the UKM Research Ethics
Committee (Reference no: UKM 1.5.3.5/244/UMBI-004-2012).
Sample preparation
The clinical tissues were snap-frozen in liquid
nitrogen prior to sectioning. Tissue samples were sectioned into
5–7 μm thickness using a cryostat (Microtome Cryostat HM550;
Microm International GmbH, Walldorf, Germany). The sections were
stained with hematoxylin and eosin (H&E) and were examined by
the histopathologist. Tissue samples were considered representative
when >80% malignant cells were present. Normal cells also
contained >80% normal epithelial cells and were free from
malignant or inflammatory cells. Patients with chemotherapy or
radiotherapy prior to surgery were excluded from the study.
DNA methylation profiling assay
Genomic DNA was isolated using the Qiagen DNeasy
Tissue kit (Qiagen, Hilden, Germany) according to the
manufacturer’s instructions. The quantity and purity of DNA were
quantified using the NanoDrop ND-1000 spectrophotometer (Thermo
Fisher Scientific, Leicester, UK). Gel electrophoresis was used to
check the integrity of the DNA. Only samples with good purity were
included in the study. Methylation profiling was performed in 110
samples using the HumanMethylation27 Beadchip to analyze 27,578 CpG
sites covering 14,495 genes. Bisulphite conversion was carried out
in the methylation assay using the EZ DNA Methylation-Gold kit
(Zymo Research, Irvine, CA, USA). The microarray study was carried
out according to the Infinium II Methylation Assay manual protocol.
All the chips were scanned on a single BeadArray reader to avoid
bias.
Gene expression profiling assay
Total RNA from 15 paired representative tissues were
extracted using the Qiagen QIAampMini Plus kit (Qiagen) according
to the manufacturer’s instructions. The quantity and purity of RNA
were quantified using the NanoDrop ND-1000 spectrophotometer
(Thermo Fisher Scientific). The integrity of RNA was measured using
the Agilent Bioanalyzer 2100 (Agilent Technologies, Santa Clara,
CA, USA). Only samples with an OD 260/280 of 1.8–2.1 and RNA
integrity number (RIN) ≥6.0 were included in the gene expression
study. The GeneChip Human Gene 1.0 ST array (Affymetrix, Santa
Clara, CA, USA) that has 764,885 distinct probes covering 28,869
well-annotated genes was used. The assay was carried out using the
Affymetrix expression protocol. The microarray chips were scanned
using the GeneChip Scanner 3000 7G (Affymetrix). The
Affymetrix® Genotyping Console™ (Affymetrix) was used to
extract the expression data and Partek Genomic Suite 6.6 (version
6.12.0713) (Partek Inc., St. Louis, MO, USA) was utilized for
subsequent analysis.
Statistical analysis of DNA methylation
profiling
The control panel from Illumina BeadStudio software
2011 (version 1.9.0) (Illumina, San Diego, CA, USA) was used to
determine the quality of our methylation microarray assay. β-value
was used to determine the methylation status of each sample. This
value was derived from each locus from the microarray and range
from the lowest methylation value (β=0) to the highest methylation
value (β=1). β-value was generated as the intensity of the
methylated probe/total of the intensity of the methylated probe and
the intensity of the unmethylated probe.
The generated β-value was exported to the Partek
Genomic Suite 6.6 (version 6.12.0713) (Partek) for subsequent
analysis. PCA mapping was used to determine the quality of the
samples. Three-way analysis of variance (ANOVA) with ≥2-fold change
and P<0.05 with FDR were used to compare the differential
methylated CpG loci between the cancer and normal groups. To remove
the batch effect, the scanned date of the chips was controlled. A
Gene Ontology enrichment analysis was carried out to investigate
whether the genes found to be differentially methylated could be
classified into a Gene Ontology category more often than expected
by chance. A functional group with a high enrichment score was
considered the leading group.
Statistical analysis of genome-wide gene
expression profiling
Differential gene expression analysis was carried
out using the Partek Genomic Suite 6.6 software with three-way
ANOVA analysis. The expression data were normalized using quantile
normalization and robust multi-array analysis (RMA) background
correction. The differentially expressed genes were reported to be
significant in the cancer group when the fold-change was >2.0
and P-value with FDR was <0.05. The batch effect was removed as
a source of variation.
Sub-analysis of methylation and
expression profile
The analysis was performed using the Partek Genomic
Suite 6.6 software. We used the Pearson (linear) correlation to
determine the correlation of our data. The correlated genes were
considered significant at P<0.05.
Integration of methylation and expression
profile statistical analysis
Overlapped genes were identified based on
significant gene symbols from the methylation and expression
datasets. Datasets were imported into the MySQL relational database
for downstream data analysis. The MySQL database allows rapid and
accurate data filtering across different datasets. The datasets
were compared in the pair-wise manner. Unique gene symbols
identified between the overlapping comparisons were used in
downstream analysis. Along with the unique gene list, methylation
and expression values were extracted from the datasets for
chromosome mapping, circular map generation and KEGG Pathway
mapping. Mapping of the integrated gene list allowed visualization
of overlapping genes on chromosome map overview, circular map
overview and also KEGG pathway maps.
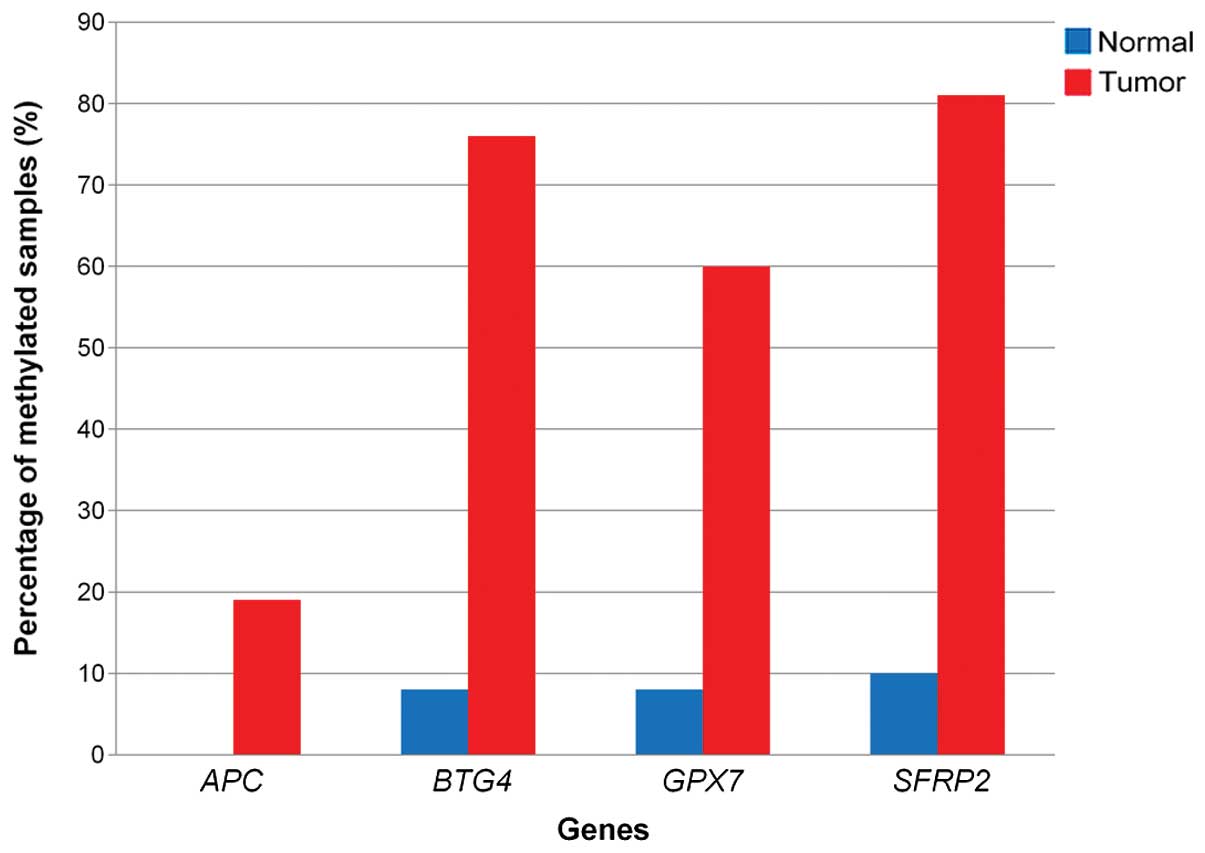
Validation of genes using MS-MLPA
A total of four significant genes (SFRP2,
BTG4, APC and GPX7) were selected from the DNA
methylation profile for validation purpose. Validation was carried
out using the MS-MLPA and followed the manufacturer’s instructions.
The primers were designed and customized following the guidelines
from MRC Holland (MRC-Holland, Amsterdam, The Netherlands). The
amplification PCR product was carried out by using the 3500 Genetic
Analyzer (Applied Biosystems, Foster City, CA, USA). The
electrophoresis result was assessed by using the Coffalyser
software version 1.0.0.43 (MRC-Holland). For the analyses, dataset
of MS-MLPA was analyzed by the method described in a previous study
(27). To quantify the methylation
status of each of the genes, the probe relative peak area ratio of
the digested sample was compared with that of the undigested
samples. The digested sample with the probes of a relative peak
area ratio of ≥0.25 was defined as methylated.
Results
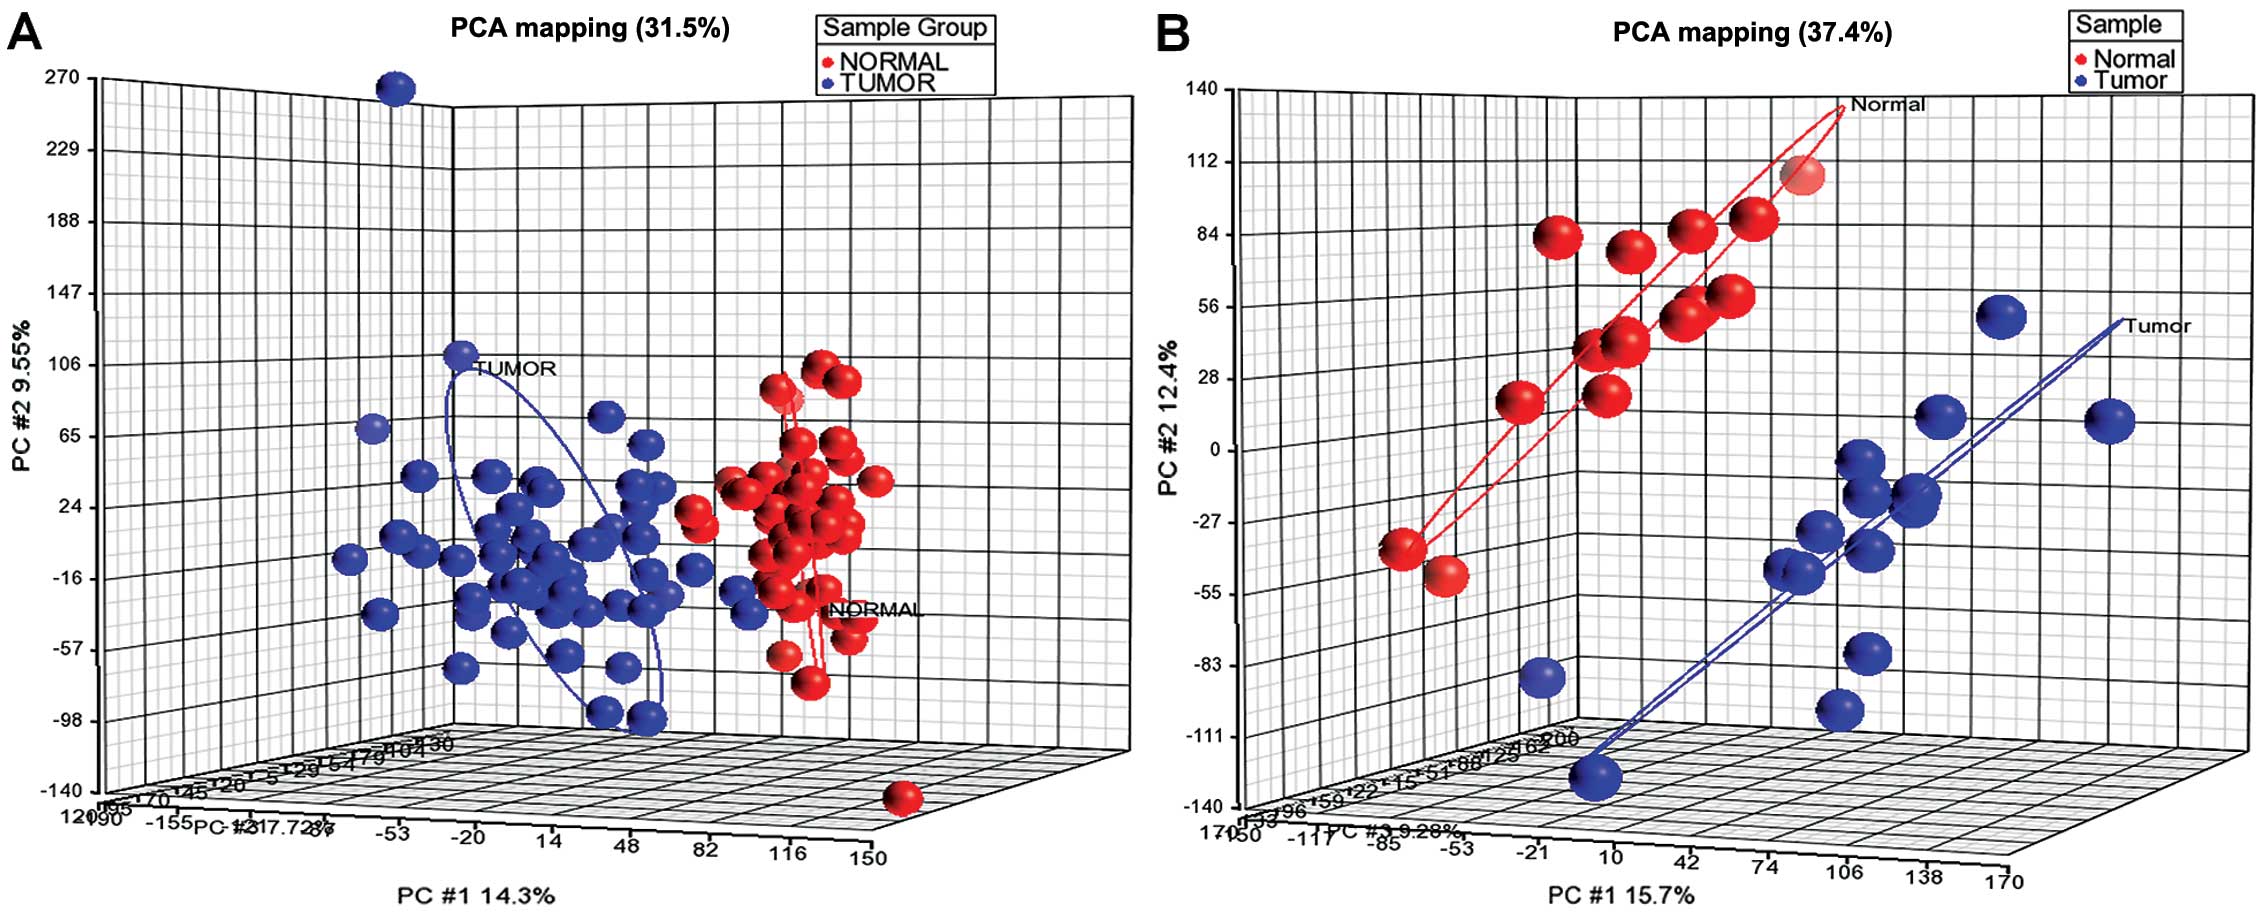
Principal component analysis and sources
of variation determine the quality of the microarray studies
Principal component analysis (PCA) showed that the
normal group (indicated by red color) was clustered distinctly from
the tumor group (indicated by blue color) from the profiling data
(Fig. 1). For the methylation
study, one normal and one tumor sample were removed since the
samples were classified in the opposite group. By applying
three-way ANOVA, sources of variation were generated. The ’Sentrix
barcode’ factor (for methylation study) and ‘Scan date’ (for
expression study) factor were removed to avoid the batch
effects.
Genome-wide DNA methylation profiling of
CRC in matched samples
The methylation profiling involved 110 CRC samples
together with their neighboring non-cancerous colonic cells. The
mean age for all patients was 60.4±12.83 years (Table I). The methylation chip analyses
revealed a total of 27,578 CpG loci, covering 14,495 consensus
coding sequences with an average of 1.9 CpG loci per sequence. We
detected for each sample, on average, 27,506.64 loci at P<0.05
and 27,444.05 loci at P<0.01. A locus was considered to be
detected at the two cut-off levels when the mean signal intensity
from multiple probes for a particular CpG locus was significantly
higher than the negative control on the same chip.
 | Table IDistribution of clinicopathological
characteristics of 55 paired matched samples. |
Table I
Distribution of clinicopathological
characteristics of 55 paired matched samples.
|
Characteristics | No. | (%) |
|---|
| Gender |
| Male | 22 | 40.00 |
| Female | 33 | 60.00 |
| Age (years) |
| <50 | 9 | 16.36 |
| >50 | 46 | 83.64 |
| Ethnicity |
| Malay | 27 | 49.09 |
| Chinese | 25 | 45.46 |
| India | 3 | 5.45 |
| Duke’s staging |
| A | 4 | 7.27 |
| B | 31 | 56.36 |
| C | 20 | 36.36 |
|
Differentiation |
| Well
differentiated | 31 | 56.36 |
| Moderately
differentiated | 21 | 38.18 |
| Poorly
differentiated | 3 | 5.46 |
| Location |
| Right | 13 | 23.64 |
| Left | 42 | 76.36 |
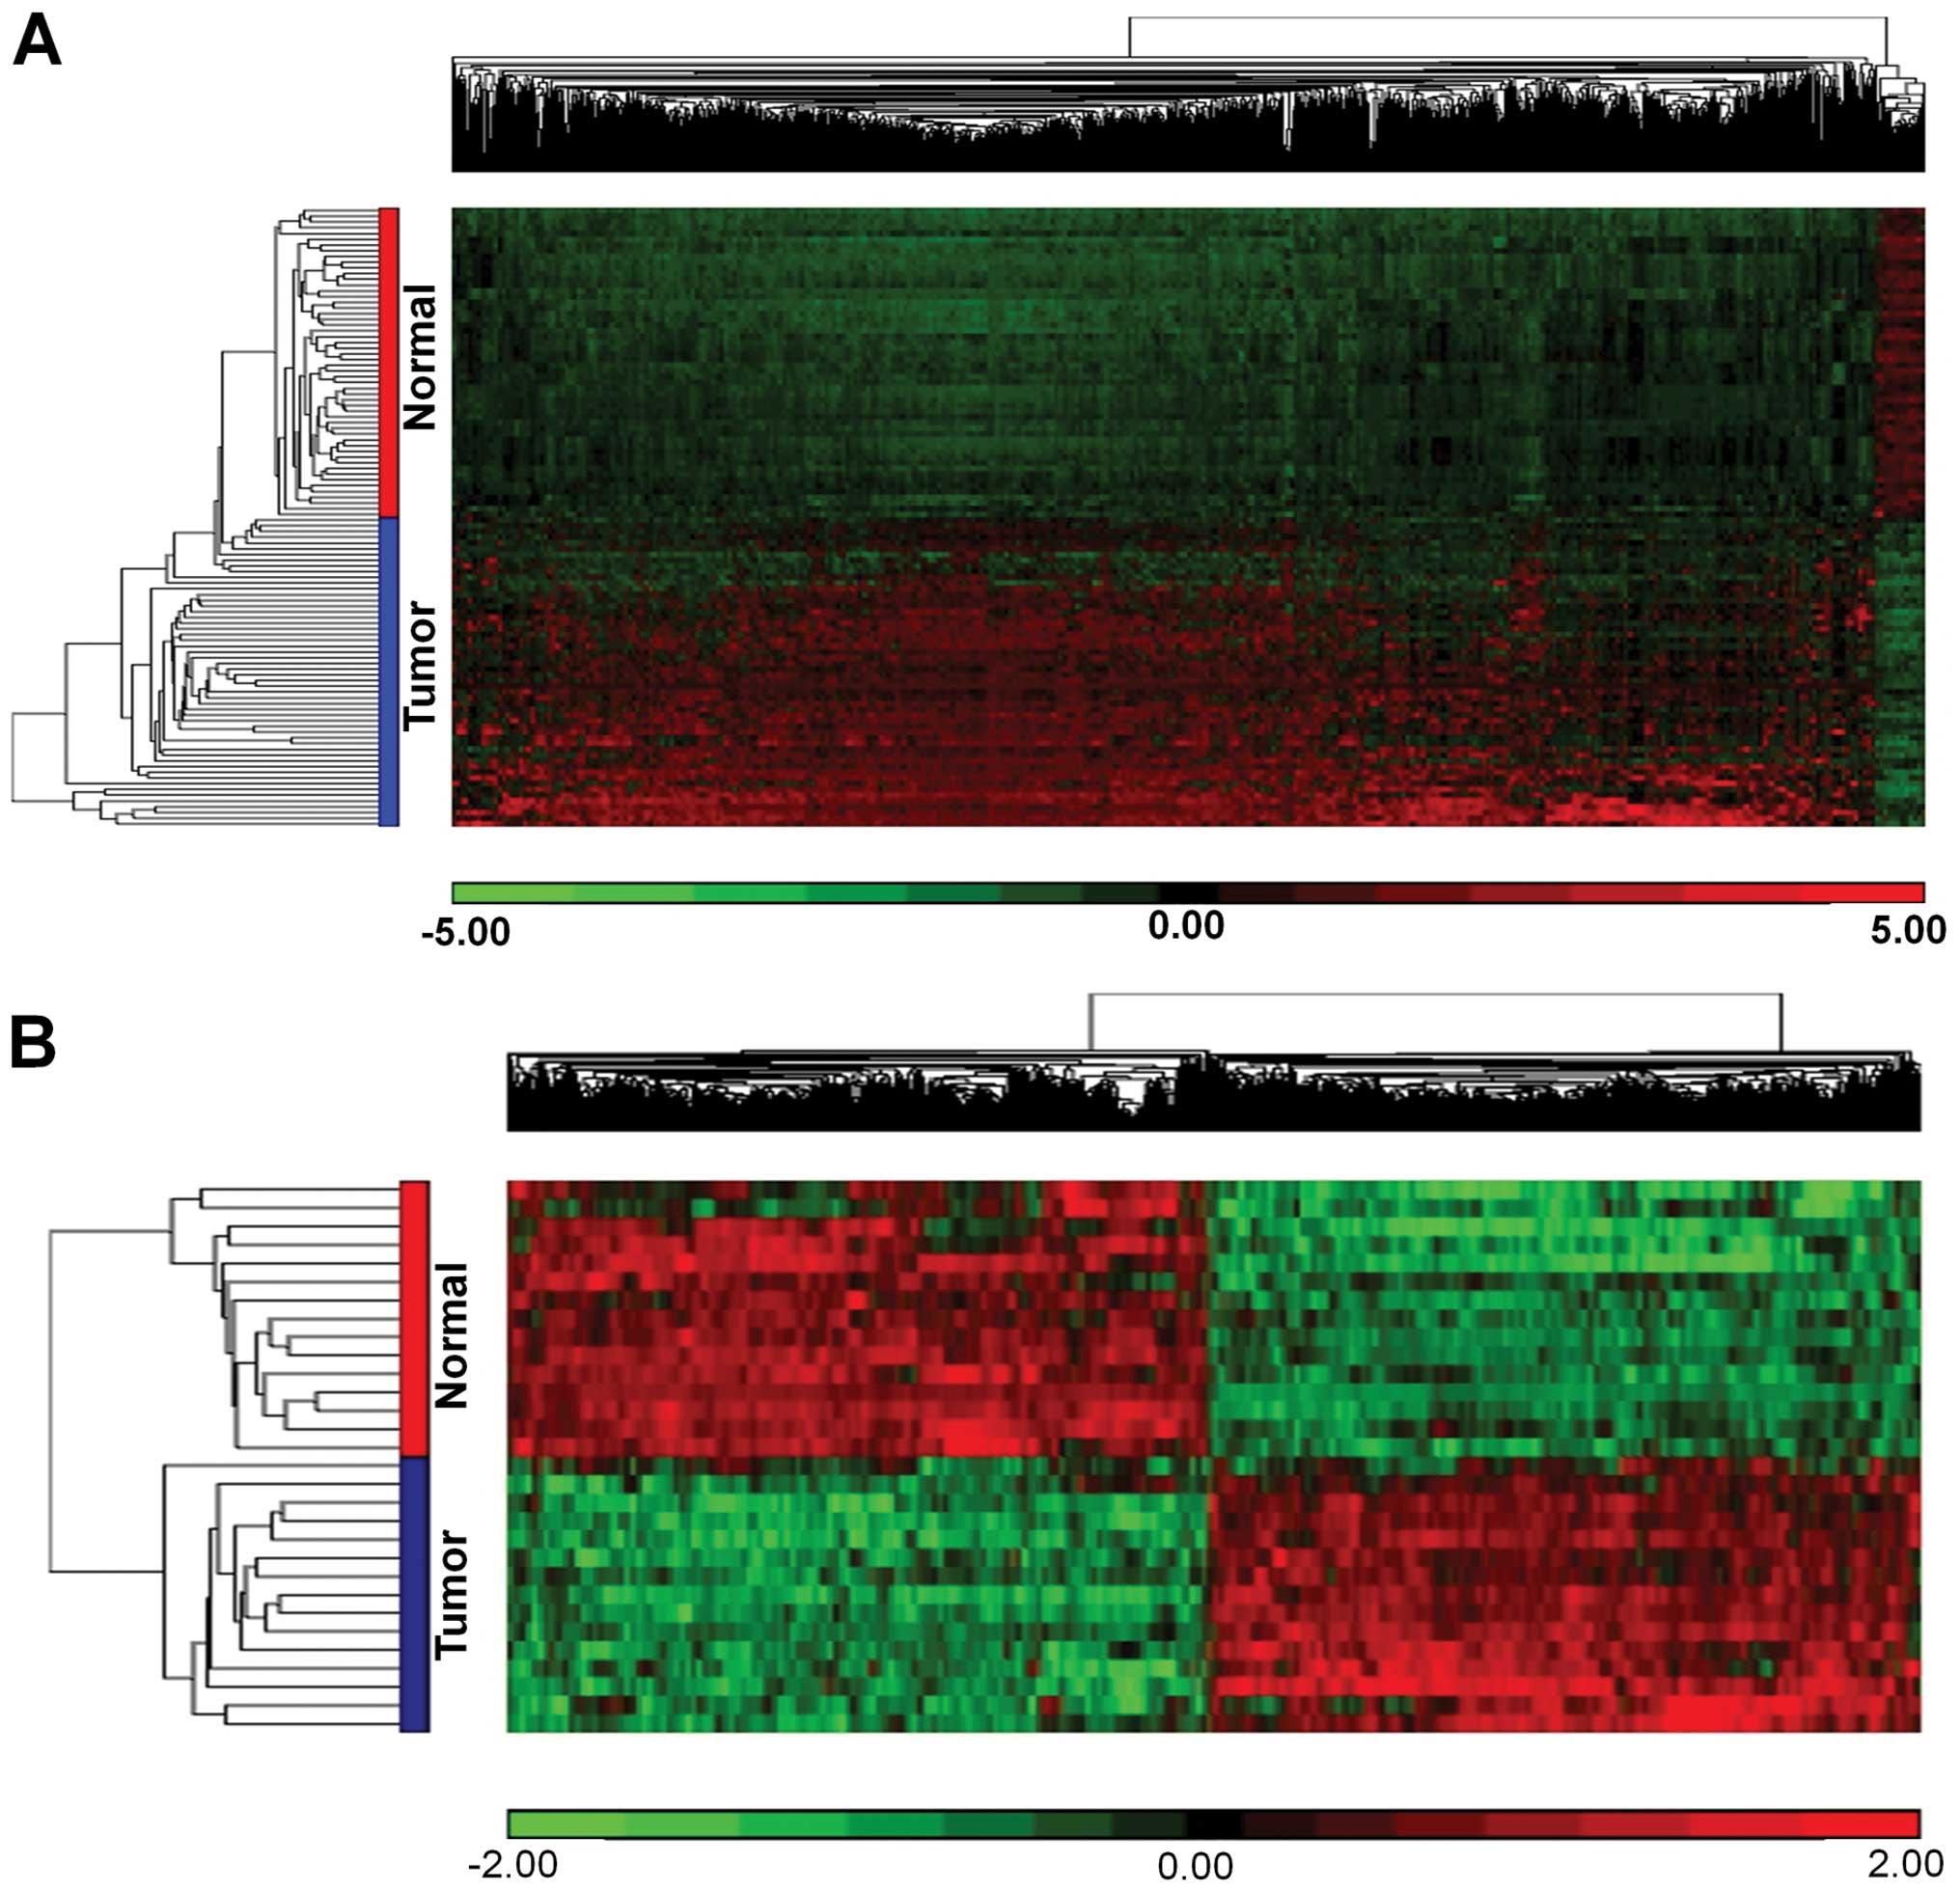
A total of 1,123 loci (845 genes) were found to be
differentially methylated in CRC compared with the normal colonic
epithelial samples. These loci were further classified into 1,081
hypermethylated loci (804 genes), 36 hypomethylated loci (36 genes)
and 6 sex-chromosome methylated loci (5 genes). Sex-chromosomes
loci were eliminated for the subsequent analysis to avoid bias to
the present study. This is due to the methylation involved in the
X-inactivation process that silences one out of the two copies of X
chromosome in female in order to compensate for the gene dosage
effect. Supervised hierarchical clustering of the significant
differentially methylated loci in our study is shown in Fig. 2A. The top 10 highly significant
hypermethylated loci were protein kinase, cAMP-dependent,
regulatory, type I, β (PRKAR1B), cannabinoid receptor
interacting protein 1 (C2orf32), zinc finger protein 542
(ZNF542), KH domain containing, RNA binding, signal
transduction-associated 3 (KHDRBS), interferon regulatory
factor 4 (IRF4), tissue factor pathway inhibitor 2
(TFPI2), potassium voltage-gated channel, KQT-like
subfamily, member 5 (KCNQ5), filamin-binding LIM protein 1
(FBLIM1), eyes absent homolog 4 (EYA4) and spastic
paraplegia 20 (SPG20). The top 10 most significantly
hypomethylated loci were Fc receptor-like 3 (FCRL3),
Granzyme K (Granzyme 3; Tryptase II) (PRSS1),
bactericidal/permeability-increasing protein (BPI), v-akt
murine thymoma viral oncogene homolog 3 (AKT3), pipecolic
acid oxidase (PIPOX), peptidase inhibitor 3 (PI3),
bactericidal/permeability-increasing protein-like 3 (BPIL3),
solute carrier family 26, member 4 (SLC26A4), long
intergenic non-protein coding RNA 152 (MGC4677) and
defensin, β 119 (DEFB119).
Genome wide expression profiling of CRC
identifies differentially expressed genes in the same group of
patients
The data of the genome wide expression profiling
have been recently reported (28).
Statistical analysis following normalization of data identified
1,408 differentially expressed genes in CRC compared to the normal
samples. Supervised hierarchical clustering clearly showed a total
of 709 genes were upregulated and 699 were downregulated genes
(Fig. 2B). The top 10 most
significant differentially upregulated genes were claudin 1
(CLDN1), phosphoribosyl pyrophosphate amidotransferase
(PPAT), tumor protein D52-like 2 (TPD52L2), serine
hydroxymethyltransferase 2 (SHMT2), cell division cycle
associated 7 (CDCA7), chaperonin containing TCP1, subunit 3
(CCT3), eukaryotic translation initiation factor 2, subunit
2 β (EIF2S2), thyroid hormone receptor interactor 13
(TRIP13), inhibin, β A (INHBA) and negative elongation
factor complex member C/D (TH1L). The top 10 most
significant differentially downregulated genes were chromosome 2
open reading frame 88 (C2orf88), alcohol dehydrogenase 1B
(ADH1B), erythrocyte membrane protein band 4.1-like 4A
(EPB41L4A), transmembrane and immunoglobulin domain
containing 1 (TMIGD1), serum/glucocorticoid regulated kinase
1 (SGK1), histone deacetylase 9 (HDAC9), UDP-glucose
pyrophosphorylase 2 (UGP2), sodium channel, voltage-gated,
type IX, α subunit (SCN9A), membrane-spanning 4-domains,
subfamily A, member 12 (MS4A12) and solute carrier family 4,
sodium bicarbonate cotransporter, member 4 (SLC4A4).
Methylation specific-multiple ligation
probe amplification (MS-MLPA) confirmed the methylation profiling
results
Four hypermethylated genes, i.e., secreted
frizzled-related protein 2 (SFRP2), BTG4, adenomatous
polyposis coli (APC) and glutathione peroxidase 7
(GPX7), to validate the methylation profiling data. Data
analysis of MS-MLPA showed high methylation for all four validated
genes in CRC compared to the normal samples (Fig. 3).
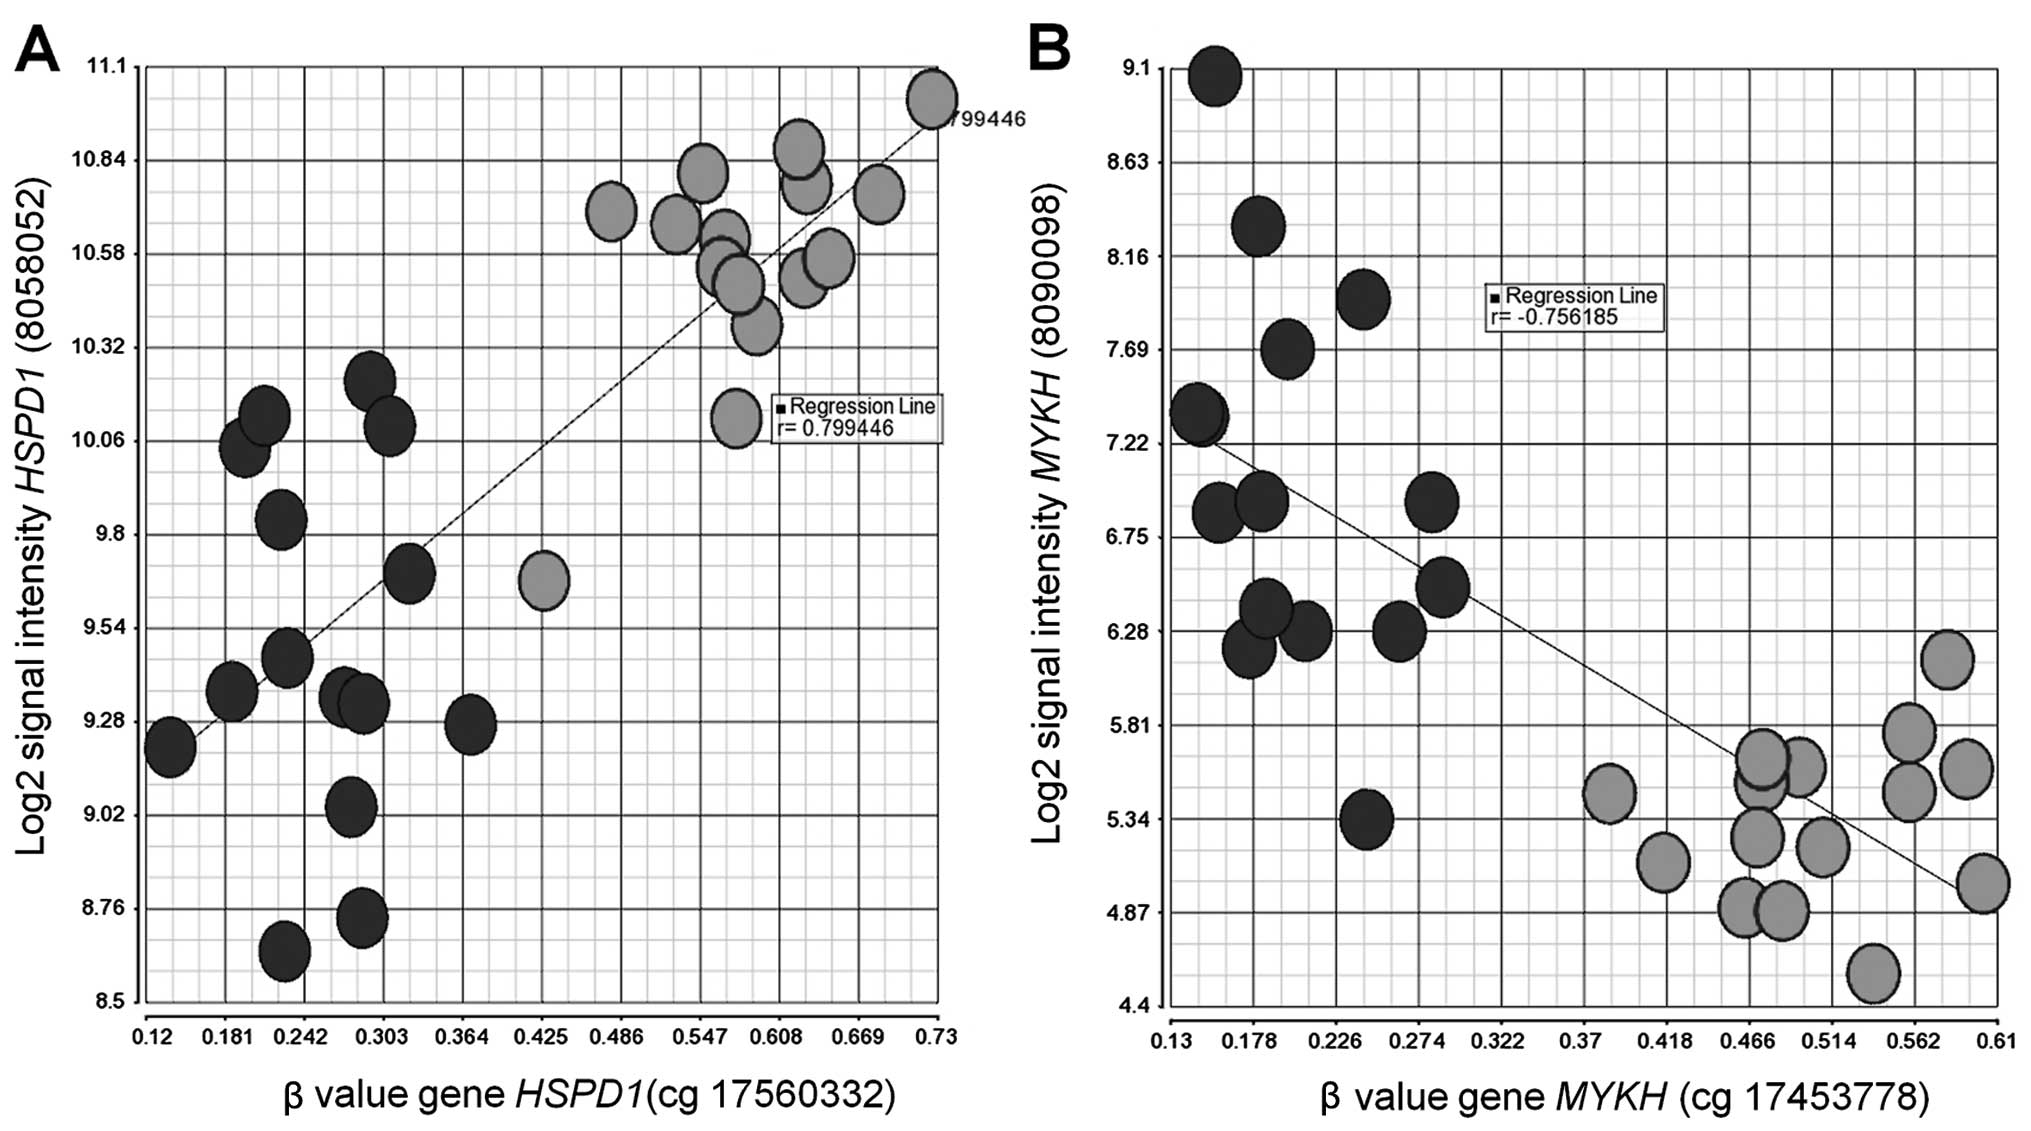
Sub-analysis of methylation and gene
expression profiling of 15 pair-matched samples
We correlated the data at P<0.05 and identified
188 significant loci (covered by 136 genes) from the two profiles
including 83 negatively (66 genes) and 105 positively correlated
loci (70 genes). The top 5 positively correlated genes were heat
shock 60 kDa protein 1 (HSPD1) (r= 0.799443) (Fig. 4A), SLC4A4 (0.77751), family
with sequence similarity 5, member C (FAM5C) (0.777301),
partner of NOB1 homolog (PNO1) (0.769136) and CD163
molecule-like 1 (CD163L1) (0.766757). The top 5 negatively
correlated genes were myosin light chain kinase (MYLK)
(−0.756185) (Fig. 4B), nuclear
receptor subfamily 5, group A, member 2 (NR5A2) (−0.738724),
transforming growth factor, β-induced (TGFBI) (−0.674433),
von Willebrand factor A domain containing 5A (VWA5A)
(−0.673862) and D-tyrosyl-tRNA deacylase 1 (DTD1)
(−0.652264).
Integrated analysis reveals 32 important
genes in CRC
We identified 32 significant overlapping genes from
the methylation and gene expression profiles (Table II). Most of the significant genes
(27 genes) have a negative association (hypermethylation and
downregulation) and only 5 genes showed a positive association
(hypermethylation and upregulation or hypomethylation and
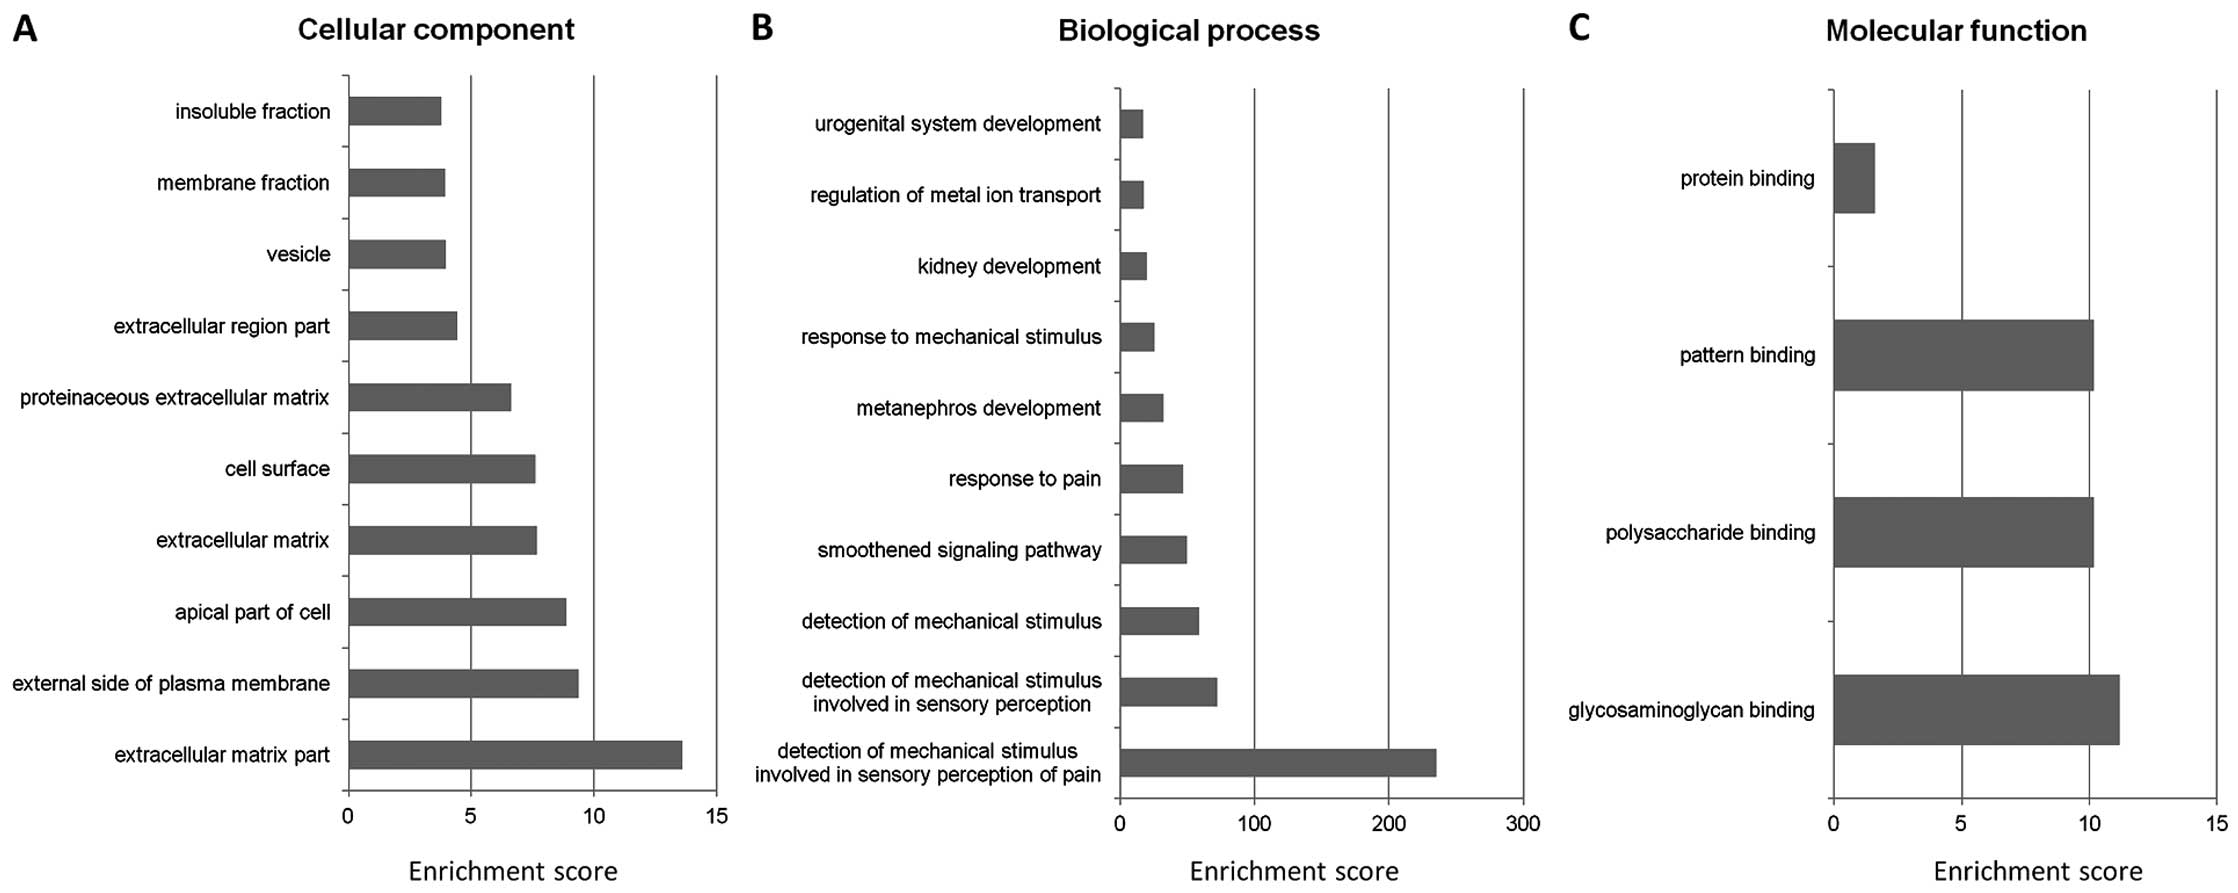
downregulation). We then used the Gene Ontology (GO) enrichment
analysis to classify the genes into the categories of cellular
component, biological process and molecular function. Under the
cellular component category, the integrated genes were highly
enriched in the extracellular matrix part [Enrichment score (ES),
13.60] (Fig. 5A). For the
biological process and molecular function categories, significant
genes were highly enriched in the wide group of detection of
mechanical stimulus (ES=235.27) (Fig.
5B) and glycosaminoglycan binding (ES=11.19) (Fig. 5C), respectively. Using the Kyoto
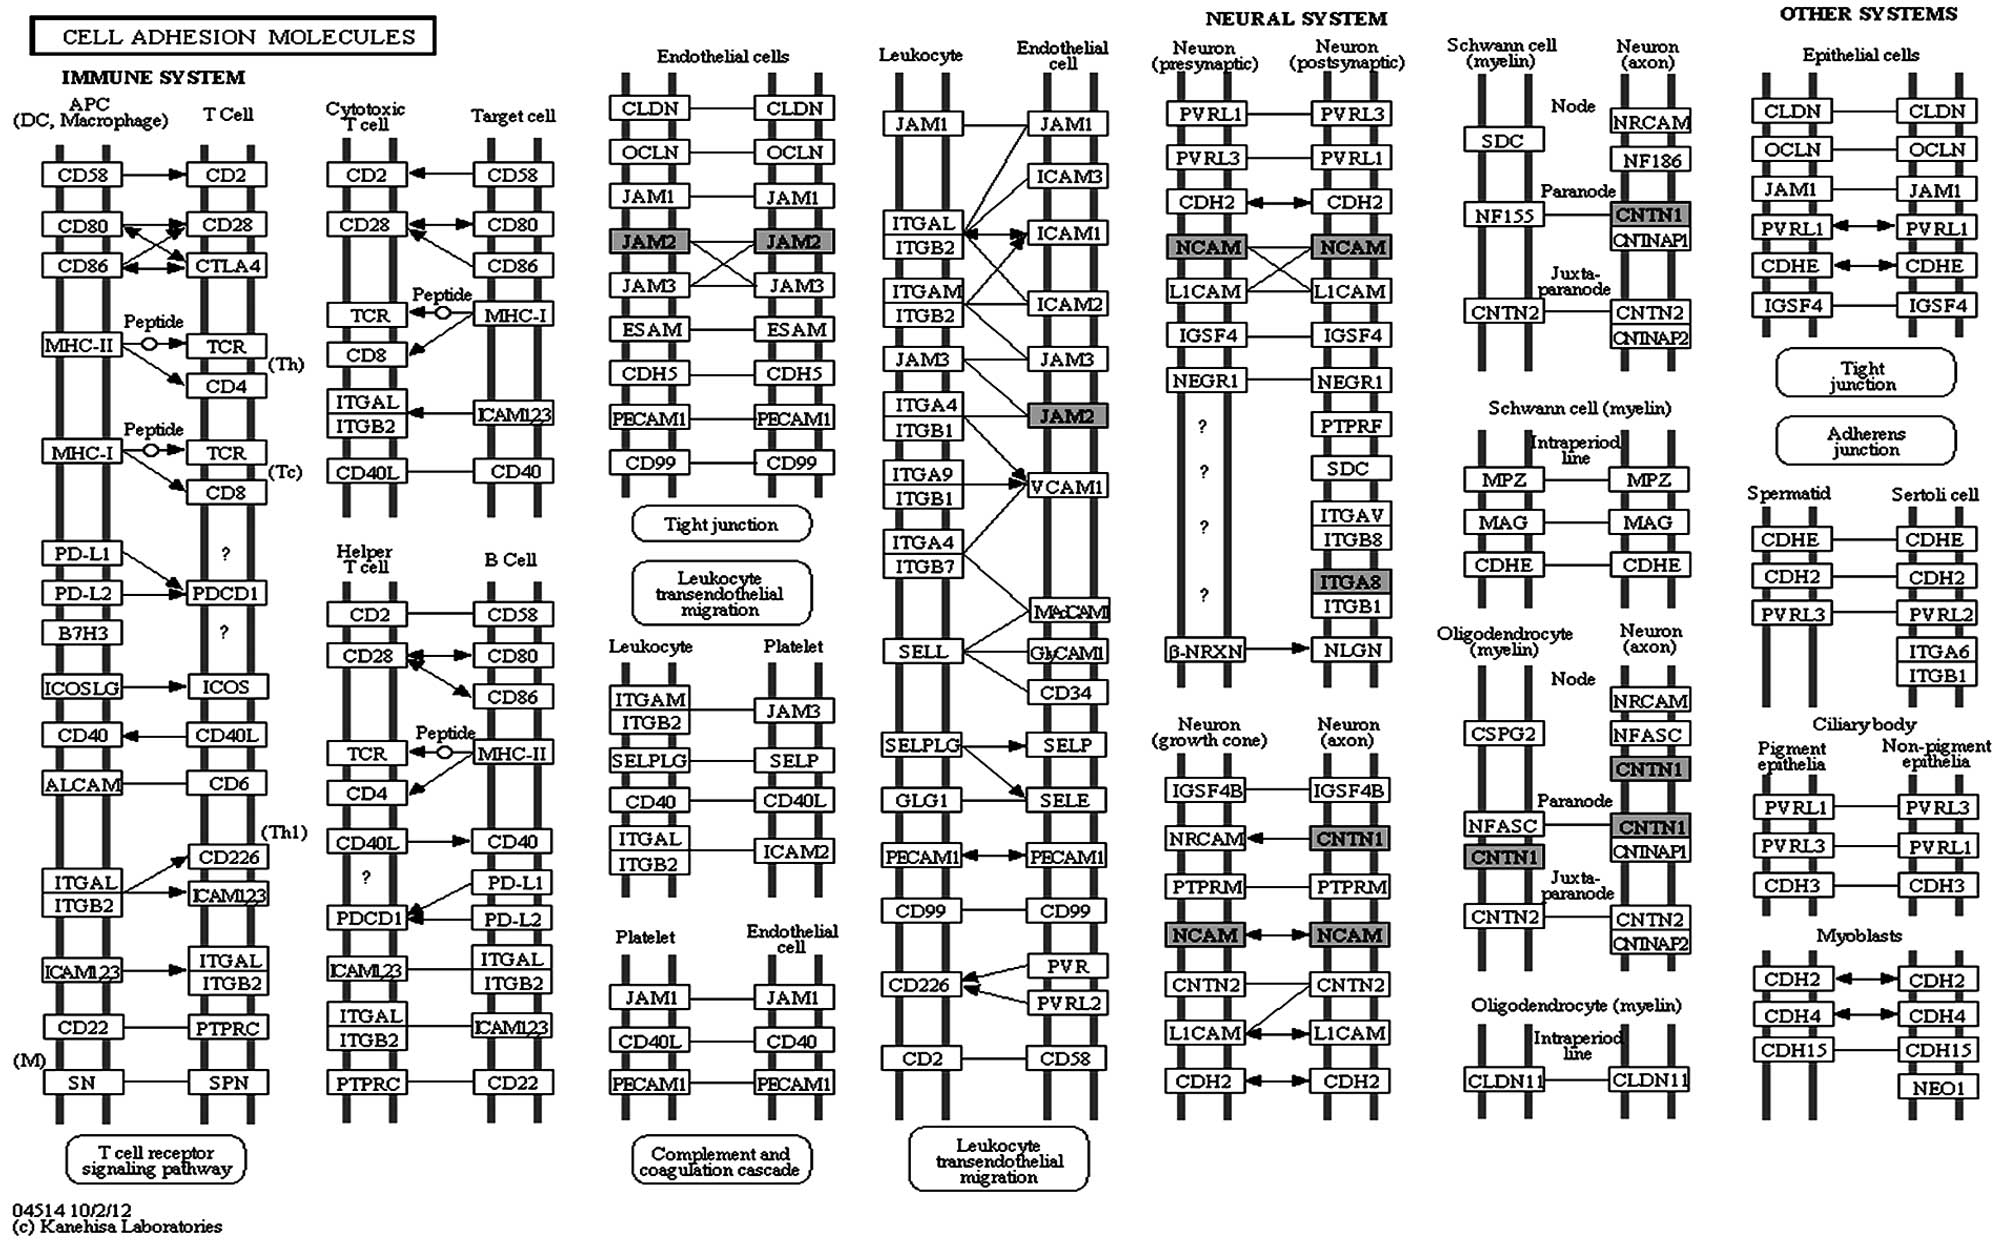
Encyclopedia of Genes and Genomes (KEGG) database, we identified a
total of 95 pathways and 11 of these pathways were associated with
the CRC. These includes well-documented pathways in CRC including
the cell adhesion molecule, Hedgehog signaling,
phosphatidylinositol 3′-kinase (PI3K)-Akt signaling, focal
adhesion, pathways in cancer, basal cell carcinoma, colorectal
cancer, Wnt signaling, Janus kinase/signal transducers and
activators of transcription (JAK-STAT) signaling, transcriptional
misregulation in cancer and mitogen-activated protein kinase (MAPK)
signaling pathway. Only one pathway was found to be enriched
(P<0.05) in our data, the cell adhesion molecules (CAMs)
(Fig. 6). Significant genes
detected in this pathway were JAM2, NCAM1,
ITGA8 and CNTN1.
| Table IIIntegrated gene list. |
Table II
Integrated gene list.
| No. | Gene symbol | Gene name | Methylation profile
| Gene expression
profile
|
|---|
| Probeset ID | Methylation
level | Fold-change | P-value | β-value | TranscriptID | Expression
level | Fold-change | P-value |
|---|
| 1 | SPG20 | Spastic paraplegia
20 | cg18755783 | Hyper | 4.759 | 3.07E-37 | 0.4063 | 7970999 | DR | −2.091 | 1.19E-04 |
| 2 | JAM2 | Junctional adhesion
molecule 2 | cg03382304 | Hyper | 5.529 | 1.60E-27 | 0.4061 | 8068024 | DR | −3.286 | 5.40E-07 |
| 3 | GSTM2 | Glutathione
S-transferase μ 2 | cg16670497 | Hyper | 4.874 | 1.16E-29 | 0.3630 | 7903753 | DR | −2.261 | 3.00E-05 |
| 4 | SFRP2 | Secreted
frizzled-related protein 2 | cg23207990 | Hyper | 2.560 | 1.37E-25 | 0.3079 | 8103254 | DR | −2.781 | 2.61E-03 |
| 5 | CNTN1 | Contactin 1 | cg27352992 | Hyper | 2.590 | 3.79E-23 | 0.2639 | 7954899 | DR | −2.159 | 5.56E-06 |
| 6 | CHL1 | Close homolog of
L1 | cg00903242 | Hyper | 2.331 | 4.06E-22 | 0.2576 | 8077270 | DR | −2.394 | 2.08E-06 |
| 7 | TMEFF2 | Transmembrane
protein with EGF-like and two follistatin-like domains 2 | cg18221862 | Hyper | 3.020 | 1.77E-21 | 0.2975 | 8057803 | DR | −2.520 | 3.47E-04 |
| 8 | ITGA8 | Integrin, α 8 | cg16902509 | Hyper | 2.083 | 8.70E-19 | 0.2631 | 7932254 | DR | −2.312 | 4.31E-04 |
| 9 | SST | Somatostatin | cgl3206017 | Hyper | 2.093 | 1.78E-17 | 0.2270 | 8092682 | DR | −2.183 | 3.14E-06 |
| 10 | SLIT2 | Slit homolog 2 | cg18972811 | Hyper | 2.462 | 4.94E-17 | 0.2667 | 8094301 | DR | −2.075 | 2.92E-05 |
| 11 | MAMDC2 | MAM domain
containing 2 | cg11656547 | Hyper | 2.457 | 2.03E-15 | 0.2636 | 8155754 | DR | −3.061 | 1.32E-05 |
| 12 | SCNN1B | Sodium channel,
non-voltage-gated 1, β subunit | cg23113963 | Hyper | 2.129 | 1.14E-14 | 0.1993 | 7994074 | DR | −4.948 | 8.53E-06 |
| 13 | ZNF655 | Zinc finger protein
655 | cgl3636404 | Hyper | 6.100 | 5.59E-14 | 0.2163 | 8134631 | DR | −2.882 | 3.72E-06 |
| 14 | ADAMTS1 | ADAM
metallopeptidase with thrombospondin type 1 motif, 1 | cg00472814 | Hyper | 3.048 | 1.53E-11 | 0.2377 | 8069676 | DR | −2.609 | 3.22E-05 |
| 15 | CKB | Creatine kinase,
brain | cg05786809 | Hyper | 2.642 | 1.73E-10 | 0.1458 | 7981427 | DR | −3.186 | 1.34E-04 |
| 16 | HHIP | Hedgehog
interacting protein | cg13749822 | Hyper | 2.012 | 2.48E-10 | 0.1798 | 8097628 | DR | −2.487 | 1.99E-05 |
| 17 | ELMOl | Engulfment and cell
motility 1 | cg08453021 | Hyper | 6.708 | 3.66E-10 | 0.2530 | 8139057 | DR | −2.117 | 6.49E-04 |
| 18 | RSPO3 | R-spondin 3 | cg09979256 | Hyper | 13.015 | 1.31E-09 | 0.2102 | 8121916 | DR | −2.148 | 4.85E-03 |
| 19 | TRPA1 | Transient receptor
potential cation channel, subfamily A, member 1 | cg0l610488 | Hyper | 2.630 | 1.46E-08 | 0.2160 | 8151341 | DR | −2.089 | 1.56E-03 |
| 20 | GNAO1 | Guanine nucleotide
binding protein (G protein), α activating activity polypeptide
O | cg21530453 | Hyper | 2.839 | 1.49E-08 | 0.1349 | 7995739 | DR | −2.314 | 3.25E-04 |
| 21 | MYH11 | Myosin, heavy chain
11, smooth muscle | cg17880199 | Hyper | 3.620 | 1.48E-07 | 0.1470 | 7999674 | DR | −7.642 | 2.08E-05 |
| 22 | CAMK4 |
Calcium/calmodulin-dependent protein
kinase IV | cg05497616 | Hyper | 7.229 | 3.85E-06 | 0.1225 | 8107307 | DR | −2.277 | 2.95E-06 |
| 23 | RNF152 | Ring finger protein
152 | cg07980518 | Hyper | 2.322 | 3.94E-06 | 0.0872 | 8023598 | DR | −5.566 | 2.46E-08 |
| 24 | NCAM1 | Neural cell
adhesion molecule 1 | cg20268522 | Hyper | 2.569 | 3.74E-05 | 0.1095 | 7943892 | DR | −2.212 | 2.10E-05 |
| 25 | CAV1 | Caveolin 1,
caveolae protein, 22 kDa | cg22126032 | Hyper | 2.252 | 0.0003646 | 0.0597 | 8135594 | DR | −2.289 | 6.45E-03 |
| 26 | BMP3 | Bone morphogenetic
protein 3 | cgO1049530 | Hyper | 2.010 | 0.0030589 | 0.0817 | 8096070 | DR | −5.583 | 2.15E-07 |
| 27 | GLI3 | GLI family zinc
finger 3 | cg09405612 | Hyper | 2.591 | 0.0046925 | 0.0414 | 8139212 | DR | −2.099 | 1.94E-04 |
| 28 | COL12A1 | Collagen, type XII,
α 1 | cg08009622 | Hyper | 3.118 | 2.27E-14 | 0.2118 | 8127563 | UR | 3.367 | 2.95E-05 |
| 29 | MME | Membrane
metallo-endopeptidase | cg16580737 | Hyper | 8.756 | 5.00E-08 | 0.1904 | 8083494 | UR | 3.512 | 2.13E-03 |
| 30 |
HIST1H3I | Histone cluster 1,
H3i | cgl2181621 | Hyper | 2.737 | 0.0002427 | 0.1142 | 8124531 | UR | 2.329 | 2.95E-03 |
| 31 | GRIN2B | Glutamate receptor,
ionotropic, N-methyl D-aspartate 2B | cgl3264741 | Hyper | 2.208 | 0.0017283 | 0.0518 | 7961422 | UR | 2.145 | 1.10E-04 |
| 32 | AKT3 | v-akt murine
thymoma viral oncogene homolog 3 (protein kinase B, γ) | cgl1314684 | Hypo | −2.298 | 6.96E-32 | −0.1808 | 7925531 | DR | −2.261 | 2.49E-03 |
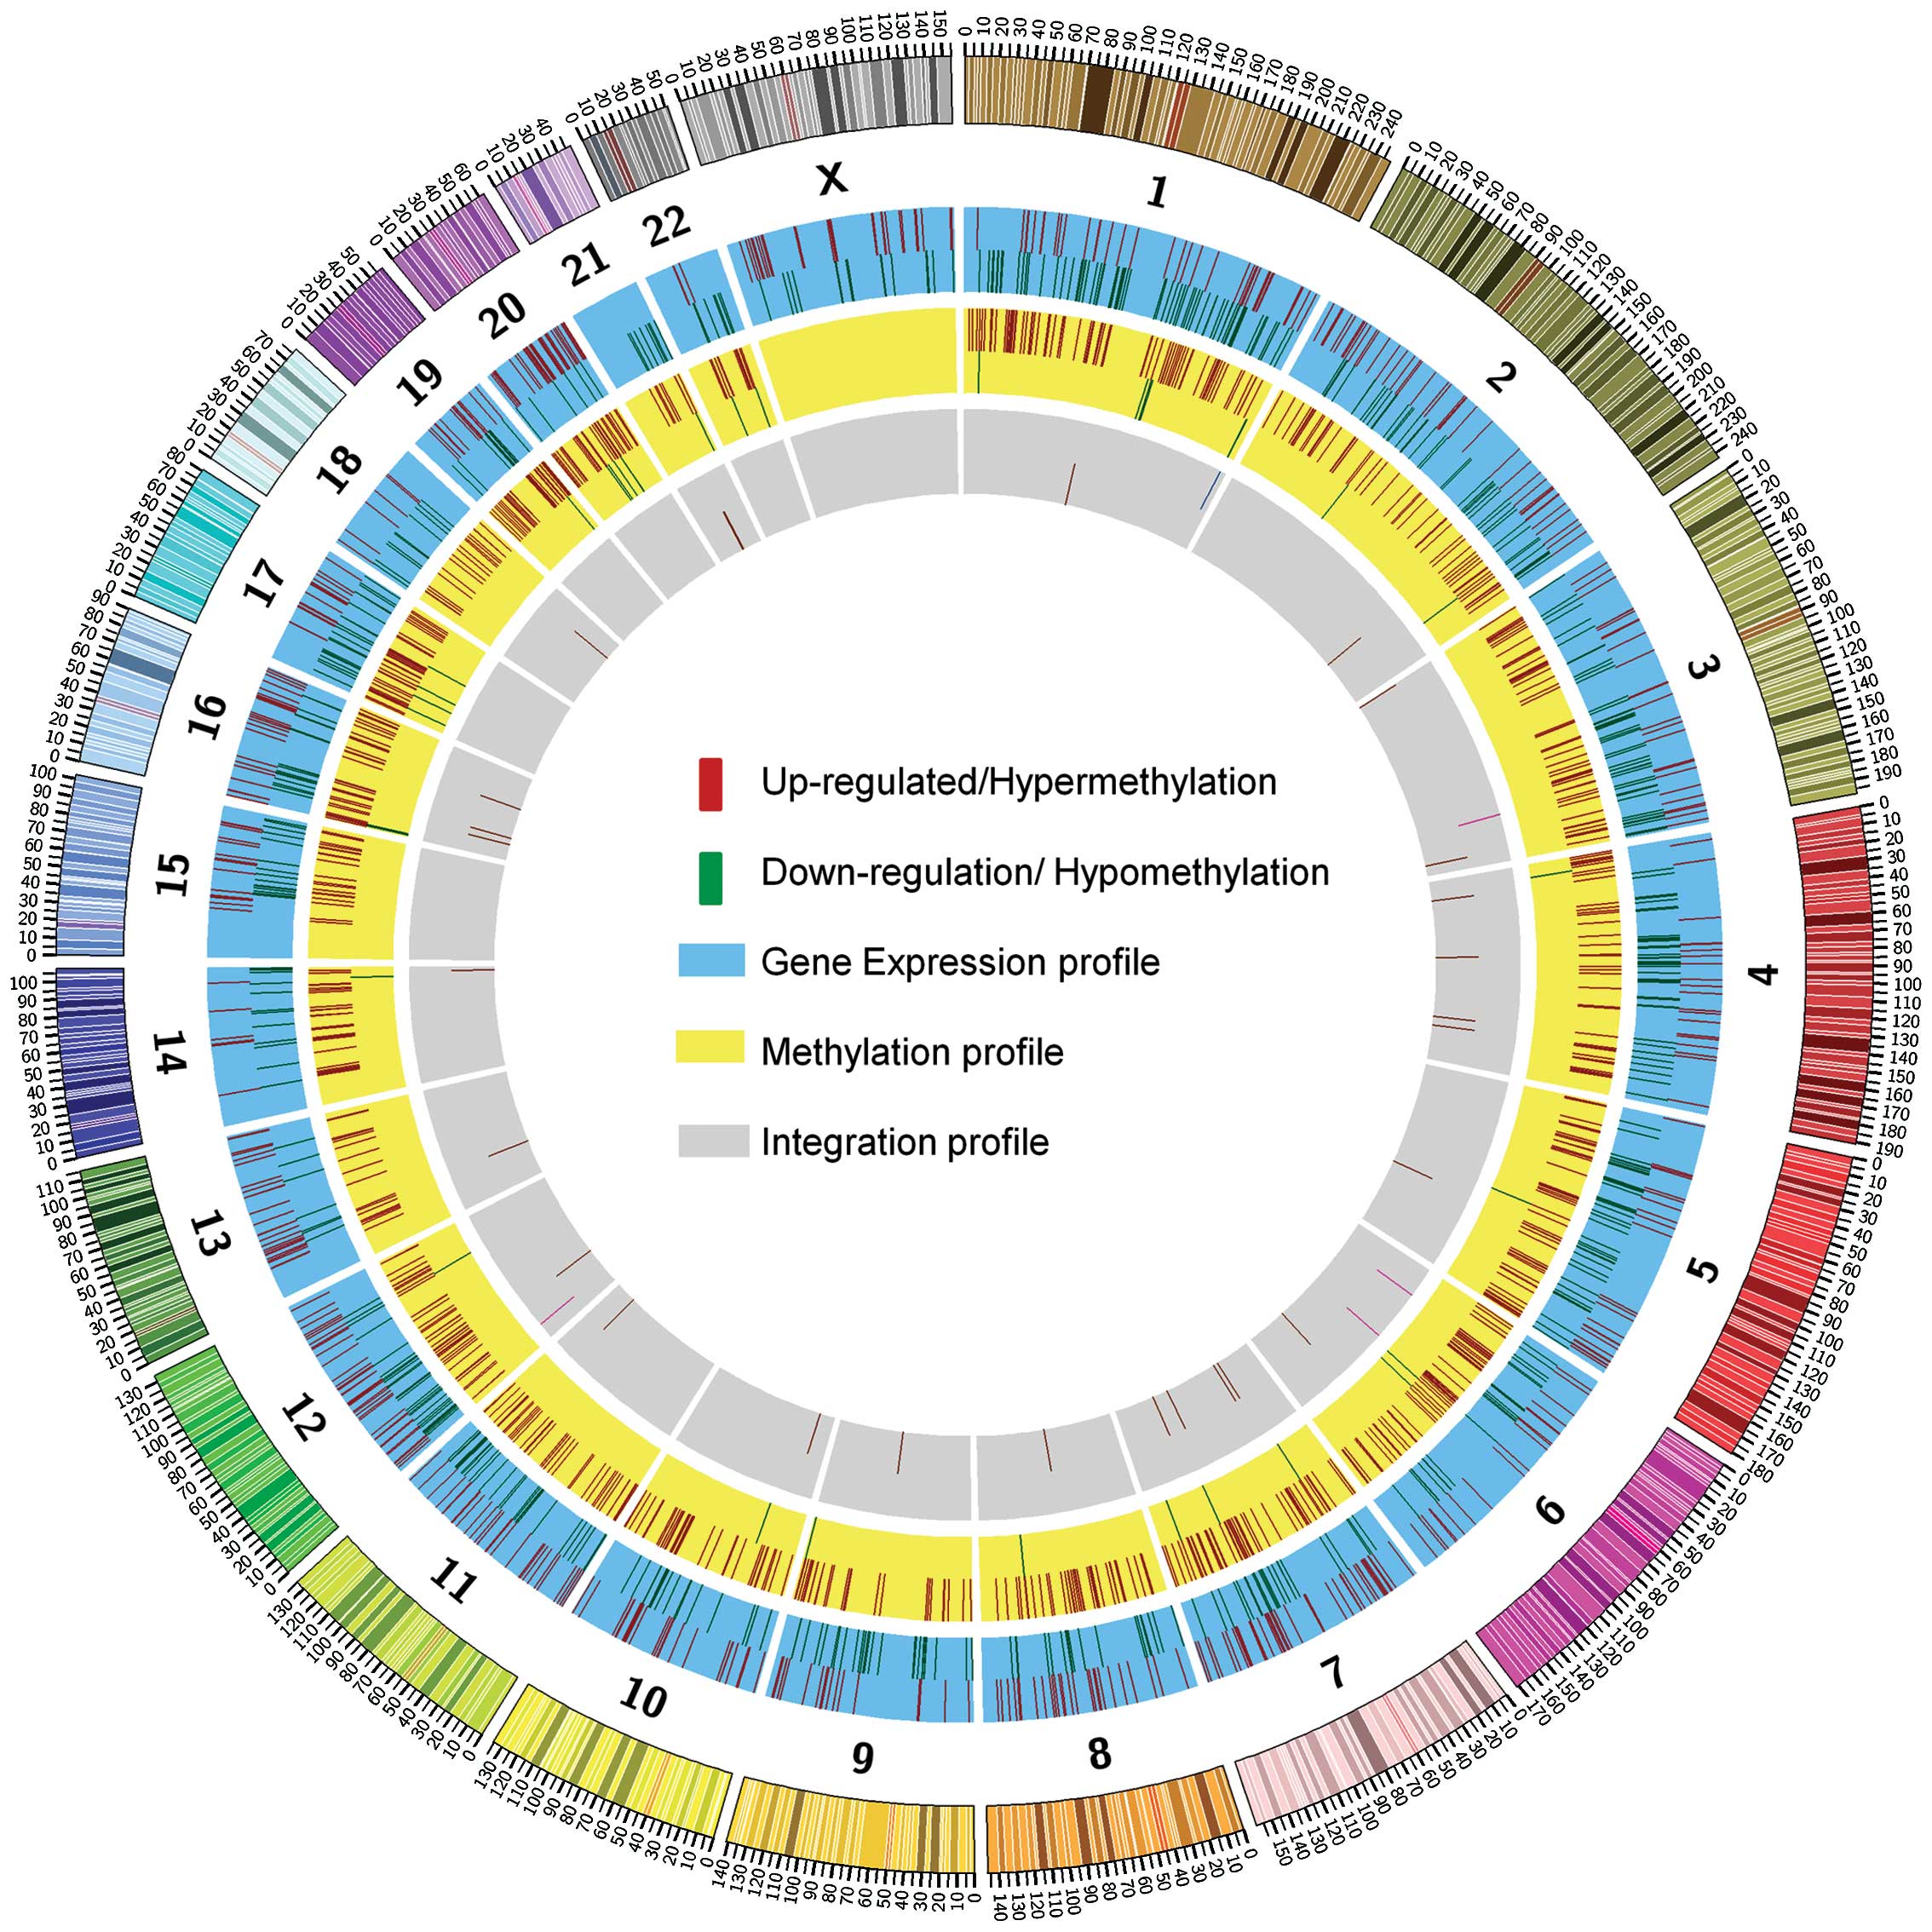
Circular map shows the chromosome
distribution of three profiles
We analyzed the frequency of the methylated loci,
the upregulated or downregulated genes and the integrated genes in
each chromosome. Fig. 7 shows the
distribution of genes for each profile. We found that the genes
with hypermethylated promoters in CpG islands and also those that
were differentially expressed were generally identified in all
chromosomes. Chromosome 1 has the highest frequency of the
hypermethylated loci (91 loci) followed by chromosome 7 (78 loci),
chromosome 19 (77 loci) and chromosome 6 (73 loci). Conversely,
chromosome 20 has the highest frequency of the hypomethylated loci
(7 loci) followed by chromosome 1 (6 loci), chromosome 17 (4 loci)
and chromosome 7 (3 loci). The integrated genes were distributed in
all the chromosomes.
We identified four clusters of genes when we
examined closely the distribution of methylated genes in each
chromosome. These clusters were located in chromosome 6, 16 and 19
and belonged to specific gene families. One cluster was within the
HIST1H family [histone cluster 1, H2bb (HIST1H2BB) with
histone cluster 1, H3c (HIST1H3C) and histone cluster 1, H3f
(HIST1H3F) with histone cluster 1, H3g (HIST1H3G),
another in the FOX family (forkhead box F1 (FOXF1),
fork-head box F1 (FOXC2) and forkhead box FL (FOXL1)]
and two large clusters in the zinc finger (ZNF) family. For the
gene expression study, 16 clusters were distributed across the
chromosomes including one single cluster which encompassed >10
genes. This cluster included the metallothionein 2A (MT2A),
nucleoporin 93 kDa (NUP93) and 8 other genes derived from
the metallothionein 1 (MT1) family.
Discussion
The low sensitivity and specificity of the current
serum-based markers in the detection and prognostication of CRC
have rendered the identification of new candidates crucial. The
emergence of methylation biomarkers for CRC has important
implications since the methylation events are reversible. However,
methylation markers derived from a single profiling are not
sufficient to reveal the overall mechanism involved in CRC. To
overcome this issue, the integrative approach combining different
genomic profiling analyses could provide new insights into the
biology of the CRC and help in identifying potential diagnostic
markers.
To show the validity of our results, we correlated
our findings with those of a recent methylation study conducted in
2010 which involved 91 cancer and 28 normal samples (21). Our results showed a higher number of
hypermethylated genes with 804 genes compared to the 132 genes
reported in that study. Overlapping our data with theirs revealed
59 genes, 7 of which were in our top 50 significant gene list based
on P-values (21). We then compared
our data with those from a Korean study that used 22 paired
colorectal cancer and adjacent normal mucosa (29). We found 16 hypermethylated genes
overlapped between our data and their top 20 hypermethylation genes
with 10 genes appearing on our top 50 significant gene list. These
included alcohol dehydrogenase, iron containing, 1 (ADHFE1),
bol, boule-like (BOLL), cut-like homeobox 2 (CUTL2),
KCNQ5, protocadherin γ subfamily C, 4 (PCDHGC4),
PRKAR1B, solute carrier family 6 (neutral amino acid
transporter), member 15 (SLC6A15), SPG20,
TFPI2 and unc-5 homolog C (UNC5C) (29). The ADHFE1, BOLL,
SLC6A15 and TFPI2 genes were validated using
pyrosequencing (29).
Our integrative analysis correlating methylation and
gene expression data revealed 27 genes with a negative association
(hyper-down) and 5 with a positive association (hyper-up and
hypo-down). Of the 27 hypermethylated genes with low gene
expression, 18 were related to CRC including GSTM2,
ZNF655, MYH11, HHIP, RSPO3,
RNF152, CAV1, SFRP2, JAM2,
SPG20, TMEFF2, SST, SLIT2,
SCNN1B, ADAMST1, GLI3, CKB and
BMP3 (19,30–38).
Of these, CAV1, SFRP2, TMEFF2, SST and
SLIT2 have been identified as tumor-suppressor genes
(39–43). The remaining genes were associated
with other cancer types. CHL1 and ITGA8 were
identified as specific potential biomarkers for renal and ovarian
cancer, respectively (44,45).
SFRP2 is a dominant-negative inhibitor in the
Wnt signaling pathway that is involved in regulating cell
proliferation, migration, and differentiation (46,47).
Hypermethylation of SFRP2 that resulted in the
downregulation of SFRP2 was detected via
methylation-specific PCR (MSP) and quantitative PCR (qPCR) in
colorectal carcinoma as compared to adenoma (48). Another study reported that
hypermethylation of SFRP2 in stool DNA may be a potential
biomarker in the detection of CRC (31). Another gene, SPG20, encodes
Spartin, which is a multifunctional protein that plays a vital role
in the turnover of lipid droplet and intracellular epidermal growth
factor receptor trafficking (49,50).
Hypermethylation of SPG20 downregulates Spartin and may lead
to cytokinesis arrest, which in turn is associated with
carcinogenesis (33). A recent
study showed that SPG20 has 80.2% sensitivity and 100% specificity
in detecting colorectal cancer in stool samples using the MSP
approach (22).
We also identified the COLI2A1, MME,
HIST1H3B and GRIN2B genes, which were hypermethylated
with a high expression. Hypermethylation in the promoters of
MME and GRIN2B were previously reported to contribute
to Alzheimer’s disease and seizures, respectively (51,52).
In the integrated list of genes, AKT3 was the only gene with
hypomethylation and a low gene expression. These data were
supported by a study on hepatocellular carcinoma in which the gene
was also found to be hypomethylated (53). In a separate study, the specific
knock-down of AKT3 reduced the level of phosphorylated Akt
and inhibited cell growth in malignant melanoma (54). The low mRNA level of AKT3 was
associated with a higher grade of malignant glioma (55). The positive association exhibited
for AKT3 has suggested that there is possibly another layer
of regulation. One of the possible explanations for this phenomenon
is the existence and influence of long non-coding RNAs (lncRNA).
Functional lncRNA may act as an activator or repressor for the
expression of genes at the post-transcriptional level via
mechanisms such as alternative splicing, influencing RNA polymerase
binding efficiency and even by modification of epigenetic state of
the gene (56–59).
From the integrative analysis, we found that 11 out
of 95 KEGG pathways were associated with colorectal carcinogenesis.
The most enriched pathway identified in our data was cell adhesion
molecules, covered by the integrated genes JAM2,
NCAM1, ITGA8 and CNTN1. CAM plays a vital
physical function in defining the multicellular organism’s
structure and signaling as well (60,61).
It is known to facilitate intercellular adherence and is able to
promote cell invasion, motility and migration (62). CAMs such as L1-CAM and neurone
glial-related (Nr)-CAM have been shown to be associated with the
Wnt signaling pathway and their overexpression has been associated
with poor prognosis (63,64). To the best of our knowledge, there
is no data available describing the methylation status of the CAMs
genes with the exception of JAM2. One study reported an
inverse association between methylation and the gene expression of
JAM2 in pre-malignant and malignant colorectal tissues
(32). This observation supported
our findings on JAM2, which is involved in cell-cell
adhesion and cell-environment interaction.
In conclusion, our integrative analysis which
combined DNA methylation and gene expression profiling datasets
revealed a potential panel of biomarkers for the diagnosis or
prognosis of colorectal cancer. Our integrative analysis also
revealed a list of novel genes not previously reported in
colorectal cancer.
Acknowledgments
The present study was funded by research grants
from the Ministry of Science, Technology and Innovation, Malaysia
(07–05-MGI-GMB016) and Higher Institution Centre of Excellence.
Abbreviations:
|
ANOVA
|
analysis of variance
|
|
CAMs
|
cell adhesion molecules
|
|
CEA
|
carcinoembryonic antigen
|
|
CG1
|
CpG islands
|
|
CIMP
|
CpG island methylator phenotype
|
|
ES
|
enrichment score
|
|
FDR
|
false discovery rate
|
|
GO
|
Gene Ontology
|
|
KEGG
|
Kyoto encyclopedia of genes and
genomes
|
|
lncRNA
|
long non-coding RNAs
|
|
MBDs
|
methyl-CpG binding proteins
|
|
MS-MLPA
|
methylation specific-multiple
ligation probe amplification
|
|
MSP
|
methylation-specific PCR
|
|
PCA
|
principal component analysis
|
|
PCR
|
polymerase chain reaction
|
|
qPCR
|
quantitative PCR
|
|
RIN
|
RNA integrity number
|
References
|
1
|
Soon MS, Soon A, Lin TY and Lin OS:
Distribution of colon neoplasia in Chinese patients: Implications
for endoscopic screening strategies. Eur J Gastroenterol Hepatol.
20:642–647. 2008. View Article : Google Scholar : PubMed/NCBI
|
|
2
|
Sung JJ, Lau JY, Goh KL and Leung WK; Asia
Pacific Working Group on Colorectal Cancer: Increasing incidence of
colorectal cancer in Asia: Implications for screening. Lancet
Oncol. 6:871–876. 2005. View Article : Google Scholar : PubMed/NCBI
|
|
3
|
Yeh CC, Hsieh LL, Tang R, Chang-Chieh CR
and Sung FC: Risk factors for colorectal cancer in Taiwan: A
hospital-based case-control study. J Formos Med Assoc. 102:305–312.
2003.PubMed/NCBI
|
|
4
|
Flamen P, Hoekstra OS, Homans F, Van
Cutsem E, Maes A, Stroobants S, Peeters M, Penninckx F, Filez L,
Bleichrodt RP, et al: Unexplained rising carcinoembryonic antigen
(CEA) in the postoperative surveillance of colorectal cancer: The
utility of positron emission tomography (PET). Eur J Cancer.
37:862–869. 2001. View Article : Google Scholar : PubMed/NCBI
|
|
5
|
Steele N, Haigh R, Knowles G and Mackean
M: Carcinoembryonic antigen (CEA) testing in colorectal cancer
follow up: What do patients think? Postgrad Med J. 83:612–614.
2007. View Article : Google Scholar : PubMed/NCBI
|
|
6
|
Duffy MJ: Carcinoembryonic antigen as a
marker for colo rectal cancer: Is it clinically useful? Clin Chem.
47:624–630. 2001.PubMed/NCBI
|
|
7
|
Leung WK, To KF, Man EP, Chan MW, Bai AH,
Hui AJ, Chan FK, Lee JF and Sung JJ: Detection of epigenetic
changes in fecal DNA as a molecular screening test for colorectal
cancer: A feasibility study. Clin Chem. 50:2179–2182. 2004.
View Article : Google Scholar : PubMed/NCBI
|
|
8
|
Esteller M: Epigenetics in cancer. N Engl
J Med. 358:1148–1159. 2008. View Article : Google Scholar : PubMed/NCBI
|
|
9
|
Jones PA and Baylin SB: The epigenomics of
cancer. Cell. 128:683–692. 2007. View Article : Google Scholar : PubMed/NCBI
|
|
10
|
Illingworth RS and Bird AP: CpG islands -
‘a rough guide’. FEBS Lett. 583:1713–1720. 2009. View Article : Google Scholar : PubMed/NCBI
|
|
11
|
Saxonov S, Berg P and Brutlag DL: A
genome-wide analysis of CpG dinucleotides in the human genome
distinguishes two distinct classes of promoters. Proc Natl Acad Sci
USA. 103:1412–1417. 2006. View Article : Google Scholar : PubMed/NCBI
|
|
12
|
Baylin SB and Jones PA: A decade of
exploring the cancer epigenome - biological and translational
implications. Nat Rev Cancer. 11:726–734. 2011. View Article : Google Scholar : PubMed/NCBI
|
|
13
|
Lao VV and Grady WM: Epigenetics and
colorectal cancer. Nat Rev Gastroenterol Hepatol. 8:686–700. 2011.
View Article : Google Scholar : PubMed/NCBI
|
|
14
|
Hinoue T, Weisenberger DJ, Lange CP, Shen
H, Byun HM, Van Den Berg D, Malik S, Pan F, Noushmehr H, van Dijk
CM, et al: Genome-scale analysis of aberrant DNA methylation in
colorectal cancer. Genome Res. 22:271–282. 2012. View Article : Google Scholar :
|
|
15
|
Bird A: DNA methylation patterns and
epigenetic memory. Genes Dev. 16:6–21. 2002. View Article : Google Scholar : PubMed/NCBI
|
|
16
|
Ballestar E and Esteller M:
Methyl-CpG-binding proteins in cancer: Blaming the DNA methylation
messenger. Biochem Cell Biol. 83:374–384. 2005. View Article : Google Scholar : PubMed/NCBI
|
|
17
|
Coppede F: Epigenetic biomarkers of
colorectal cancer: Focus on DNA methylation. Cancer Lett.
342:238–247. 2011. View Article : Google Scholar : PubMed/NCBI
|
|
18
|
Eckhardt F, Lewin J, Cortese R, Rakyan VK,
Attwood J, Burger M, Burton J, Cox TV, Davies R, Down TA, et al:
DNA methylation profiling of human chromosomes 6, 20 and 22. Nat
Genet. 38:1378–1385. 2006. View
Article : Google Scholar : PubMed/NCBI
|
|
19
|
Lofton-Day C, Model F, Devos T, Tetzner R,
Distler J, Schuster M, Song X, Lesche R, Liebenberg V, Ebert M, et
al: DNA methylation biomarkers for blood-based colorectal cancer
screening. Clin Chem. 54:414–423. 2008. View Article : Google Scholar
|
|
20
|
Ahlquist T, Lind GE, Costa VL, Meling GI,
Vatn M, Hoff GS, Rognum TO, Skotheim RI, Thiis-Evensen E and Lothe
RA: Gene methylation profiles of normal mucosa, and benign and
malignant colorectal tumors identify early onset markers. Mol
Cancer. 7:942008. View Article : Google Scholar
|
|
21
|
Ang PW, Loh M, Liem N, Lim PL, Grieu F,
Vaithilingam A, Platell C, Yong WP, Iacopetta B and Soong R:
Comprehensive profiling of DNA methylation in colorectal cancer
reveals subgroups with distinct clinicopathological and molecular
features. BMC Cancer. 10:2272010. View Article : Google Scholar : PubMed/NCBI
|
|
22
|
Zhang H, Song YC and Dang CX: Detection of
hypermethylated spastic paraplegia-20 in stool samples of patients
with colorectal cancer. Int J Med Sci. 10:230–234. 2013. View Article : Google Scholar : PubMed/NCBI
|
|
23
|
Kibriya MG, Raza M, Jasmine F, Roy S,
Paul-Brutus R, Rahaman R, Dodsworth C, Rakibuz-Zaman M, Kamal M and
Ahsan H: A genome-wide DNA methylation study in colorectal
carcinoma. BMC Med Genomics. 4:502011. View Article : Google Scholar : PubMed/NCBI
|
|
24
|
Derks S, Postma C, Carvalho B, van den
Bosch SM, Moerkerk PT, Herman JG, Weijenberg MP, de Bruïne AP,
Meijer GA and van Engeland M: Integrated analysis of chromosomal,
micro-satellite and epigenetic instability in colorectal cancer
identifies specific associations between promoter methylation of
pivotal tumour suppressor and DNA repair genes and specific
chromosomal alterations. Carcinogenesis. 29:434–439. 2008.
View Article : Google Scholar
|
|
25
|
Mo Q, Wang S, Seshan VE, Olshen AB,
Schultz N, Sander C, Powers RS, Ladanyi M and Shen R: Pattern
discovery and cancer gene identification in integrated cancer
genomic data. Proc Natl Acad Sci USA. 110:4245–4250. 2013.
View Article : Google Scholar : PubMed/NCBI
|
|
26
|
Cancer Genome Atlas Network: Comprehensive
molecular characterization of human colon and rectal cancer.
Nature. 487:330–337. 2012. View Article : Google Scholar : PubMed/NCBI
|
|
27
|
Ramalho-Carvalho J, Pires M, Lisboa S,
Graça I, Rocha P, Barros-Silva JD, Savva-Bordalo J, Maurício J,
Resende M, Teixeira MR, et al: Altered expression of MGMT in
high-grade gliomas results from the combined effect of epigenetic
and genetic aberrations. PLoS One. 8:e582062013. View Article : Google Scholar : PubMed/NCBI
|
|
28
|
Ali Hassan NZ, Mokhtar NM, Kok Sin T,
Mohamed Rose I, Sagap I, Harun R and Jamal R: Integrated analysis
of copy number variation and genome-wide expression profiling in
colorectal cancer tissues. PLoS One. 9:e925532014. View Article : Google Scholar : PubMed/NCBI
|
|
29
|
Kim YH, Lee HC, Kim SY, Yeom YI, Ryu KJ,
Min BH, Kim DH, Son HJ, Rhee PL, Kim JJ, et al: Epigenomic analysis
of aberrantly methylated genes in colorectal cancer identifies
genes commonly affected by epigenetic alterations. Ann Surg Oncol.
18:2338–2347. 2011. View Article : Google Scholar : PubMed/NCBI
|
|
30
|
Lin SY, Yeh KT, Chen WT, Chen HC, Chen ST
and Chang JG: Promoter CpG methylation of caveolin-1 in sporadic
colorectal cancer. Anticancer Res. 24(3a): 1645–1650.
2004.PubMed/NCBI
|
|
31
|
Wang DR and Tang D: Hypermethylated SFRP2
gene in fecal DNA is a high potential biomarker for colorectal
cancer noninvasive screening. World J Gastroenterol. 14:524–531.
2008. View Article : Google Scholar : PubMed/NCBI
|
|
32
|
Oster B, Thorsen K, Lamy P, Wojdacz TK,
Hansen LL, Birkenkamp-Demtröder K, Sørensen KD, Laurberg S, Orntoft
TF and Andersen CL: Identification and validation of highly
frequent CpG island hypermethylation in colorectal adenomas and
carcinomas. Int J Cancer. 129:2855–2866. 2011. View Article : Google Scholar : PubMed/NCBI
|
|
33
|
Lind GE, Raiborg C, Danielsen SA, Rognum
TO, Thiis-Evensen E, Hoff G, Nesbakken A, Stenmark H and Lothe RA:
SPG20, a novel biomarker for early detection of colorectal cancer,
encodes a regulator of cytokinesis. Oncogene. 30:3967–3978. 2011.
View Article : Google Scholar : PubMed/NCBI
|
|
34
|
Mori Y, Cai K, Cheng Y, Wang S, Paun B,
Hamilton JP, Jin Z, Sato F, Berki AT, Kan T, et al: A genome-wide
search identifies epigenetic silencing of somatostatin,
tachykinin-1, and 5 other genes in colon cancer. Gastroenterology.
131:797–808. 2006. View Article : Google Scholar : PubMed/NCBI
|
|
35
|
Chen WF, Gao WD, Li QL, Zhou PH, Xu MD and
Yao LQ: SLIT2 inhibits cell migration in colorectal cancer through
the AKT-GSK3β signaling pathway. Int J Colorectal Dis. 28:933–940.
2013. View Article : Google Scholar : PubMed/NCBI
|
|
36
|
Jacinto FV, Ballestar E, Ropero S and
Esteller M: Discovery of epigenetically silenced genes by
methylated DNA immuno-precipitation in colon cancer cells. Cancer
Res. 67:11481–11486. 2007. View Article : Google Scholar : PubMed/NCBI
|
|
37
|
Lind GE, Kleivi K, Meling GI, Teixeira MR,
Thiis-Evensen E, Rognum TO and Lothe RA: ADAMTS1, CRABP1, and NR3C1
identified as epigenetically deregulated genes in colorectal
tumorigenesis. Cell Oncol. 28:259–272. 2006.PubMed/NCBI
|
|
38
|
Zou H, Harrington JJ, Shire AM, Rego RL,
Wang L, Campbell ME, Oberg AL and Ahlquist DA: Highly methylated
genes in colorectal neoplasia: Implications for screening. Cancer
Epidemiol Biomarkers Prev. 16:2686–2696. 2007. View Article : Google Scholar : PubMed/NCBI
|
|
39
|
Syeed N, Hussain F, Husain SA and Siddiqi
MA: 5′-CpG island promoter hypermethylation of the CAV-1 gene in
breast cancer patients of Kashmir. Asian Pac J Cancer Prev.
13:371–375. 2012. View Article : Google Scholar
|
|
40
|
Sen M, Ozdemir O, Turan M, Arici S, Yildiz
F, Koksal B and Goze F: Epigenetic inactivation of tumor suppressor
SFRP2 and point mutation in KRAS proto-oncogene in
fistula-associated mucinous type anal adenocarcinoma: Report of two
cases. Intern Med. 49:1637–1640. 2010. View Article : Google Scholar : PubMed/NCBI
|
|
41
|
Lee SM, Park JY and Kim DS: Methylation of
TMEFF2 gene in tissue and serum DNA from patients with non-small
cell lung cancer. Mol Cells. 34:171–176. 2012. View Article : Google Scholar : PubMed/NCBI
|
|
42
|
Jin Z, Mori Y, Hamilton JP, Olaru A, Sato
F, Yang J, Ito T, Kan T, Agarwal R and Meltzer SJ: Hypermethylation
of the somatostatin promoter is a common, early event in human
esophageal carcinogenesis. Cancer. 112:43–49. 2008. View Article : Google Scholar
|
|
43
|
Beggs AD, Jones A, Shepherd N, Arnaout A,
Finlayson C, Abulafi AM, Morton DG, Matthews GM, Hodgson SV and
Tomlinson IP: Loss of expression and promoter methylation of SLIT2
are associated with sessile serrated adenoma formation. PLoS Genet.
9:e10034882013. View Article : Google Scholar : PubMed/NCBI
|
|
44
|
Senchenko VN, Krasnov GS, Dmitriev AA,
Kudryavtseva AV, Anedchenko EA, Braga EA, Pronina IV, Kondratieva
TT, Ivanov SV, Zabarovsky ER, et al: Differential expression of
CHL1 gene during development of major human cancers. PLoS One.
6:e156122011. View Article : Google Scholar : PubMed/NCBI
|
|
45
|
Cai LY, Abe M, Izumi S, Imura M, Yasugi T
and Ushijima T: Identification of PRTFDC1 silencing and aberrant
promoter methylation of GPR150, ITGA8 and HOXD11 in ovarian
cancers. Life Sci. 80:1458–1465. 2007. View Article : Google Scholar : PubMed/NCBI
|
|
46
|
Bovolenta P, Esteve P, Ruiz JM, Cisneros E
and Lopez-Rios J: Beyond Wnt inhibition: New functions of secreted
Frizzled-related proteins in development and disease. J Cell Sci.
121:737–746. 2008. View Article : Google Scholar : PubMed/NCBI
|
|
47
|
MacDonald BT, Tamai K and He X:
Wnt/beta-catenin signaling: Components, mechanisms, and diseases.
Dev Cell. 17:9–26. 2009. View Article : Google Scholar : PubMed/NCBI
|
|
48
|
Qi J, Zhu YQ, Luo J and Tao WH:
Hypermethylation and expression regulation of secreted
frizzled-related protein genes in colorectal tumor. World J
Gastroenterol. 12:7113–7117. 2006.PubMed/NCBI
|
|
49
|
Bakowska JC, Jupille H, Fatheddin P,
Puertollano R and Blackstone C: Troyer syndrome protein spartin is
mono-ubiquitinated and functions in EGF receptor trafficking. Mol
Biol Cell. 18:1683–1692. 2007. View Article : Google Scholar : PubMed/NCBI
|
|
50
|
Hooper C, Puttamadappa SS, Loring Z,
Shekhtman A and Bakowska JC: Spartin activates
atrophin-1-interacting protein 4 (AIP4) E3 ubiquitin ligase and
promotes ubiquitination of adipophilin on lipid droplets. BMC Biol.
8:722010. View Article : Google Scholar : PubMed/NCBI
|
|
51
|
Urdinguio RG, Sanchez-Mut JV and Esteller
M: Epigenetic mechanisms in neurological diseases: Genes,
syndromes, and therapies. Lancet Neurol. 8:1056–1072. 2009.
View Article : Google Scholar : PubMed/NCBI
|
|
52
|
White WM, Brost B, Sun Z, Rose C, Craici
I, Wagner SJ, Turner ST and Garovic VD: Genome-wide methylation
profiling demonstrates hypermethylation in maternal leukocyte DNA
in preeclamptic compared to normotensive pregnancies. Hypertens
Pregnancy. 32:257–269. 2013. View Article : Google Scholar : PubMed/NCBI
|
|
53
|
Shen J, Wang S, Zhang YJ, Kappil M, Wu HC,
Kibriya MG, Wang Q, Jasmine F, Ahsan H, Lee PH, et al: Genome-wide
DNA methylation profiles in hepatocellular carcinoma. Hepatology.
55:1799–1808. 2012. View Article : Google Scholar : PubMed/NCBI
|
|
54
|
Stahl JM, Sharma A, Cheung M, Zimmerman M,
Cheng JQ, Bosenberg MW, Kester M, Sandirasegarane L and Robertson
GP: Deregulated Akt3 activity promotes development of malignant
melanoma. Cancer Res. 64:7002–7010. 2004. View Article : Google Scholar : PubMed/NCBI
|
|
55
|
Mure H, Matsuzaki K, Kitazato KT,
Mizobuchi Y, Kuwayama K, Kageji T and Nagahiro S: Akt2 and Akt3
play a pivotal role in malignant gliomas. Neuro Oncol. 12:221–232.
2010. View Article : Google Scholar : PubMed/NCBI
|
|
56
|
Dinger ME, Amaral PP, Mercer TR, Pang KC,
Bruce SJ, Gardiner BB, Askarian-Amiri ME, Ru K, Soldà G, Simons C,
et al: Long noncoding RNAs in mouse embryonic stem cell
pluripotency and differentiation. Genome Res. 18:1433–1445. 2008.
View Article : Google Scholar : PubMed/NCBI
|
|
57
|
Khalil AM, Guttman M, Huarte M, Garber M,
Raj A, Rivea Morales D, Thomas K, Presser A, Bernstein BE, van
Oudenaarden A, et al: Many human large intergenic noncoding RNAs
associate with chromatin-modifying complexes and affect gene
expression. Proc Natl Acad Sci USA. 106:11667–11672. 2009.
View Article : Google Scholar : PubMed/NCBI
|
|
58
|
Zhao J, Ohsumi TK, Kung JT, Ogawa Y, Grau
DJ, Sarma K, Song JJ, Kingston RE, Borowsky M and Lee JT:
Genome-wide identification of polycomb-associated RNAs by RIP-seq.
Mol Cell. 40:939–953. 2010. View Article : Google Scholar : PubMed/NCBI
|
|
59
|
Amaral PP, Clark MB, Gascoigne DK, Dinger
ME and Mattick JS: lncRNAdb: A reference database for long
noncoding RNAs. Nucleic Acids Res. 39:D146–D151. 2011. View Article : Google Scholar :
|
|
60
|
Kibler K, Svetz J, Nguyen TL, Shaw C and
Shaulsky G: A cell-adhesion pathway regulates intercellular
communication during Dictyostelium development. Dev Biol.
264:506–521. 2003. View Article : Google Scholar : PubMed/NCBI
|
|
61
|
Juliano RL: Signal transduction by cell
adhesion receptors and the cytoskeleton: Functions of integrins,
cadherins, selectins, and immunoglobulin-superfamily members. Annu
Rev Pharmacol Toxicol. 42:283–323. 2002. View Article : Google Scholar : PubMed/NCBI
|
|
62
|
Beckman M: CAMs are stopping cancer in its
metastatic tracks. J Natl Cancer Inst. 98:576–577. 2006. View Article : Google Scholar : PubMed/NCBI
|
|
63
|
Conacci-Sorrell ME, Ben-Yedidia T,
Shtutman M, Feinstein E, Einat P and Ben-Ze’ev A: Nr-CAM is a
target gene of the beta-catenin/LEF-1 pathway in melanoma and colon
cancer and its expression enhances motility and confers
tumorigenesis. Genes Dev. 16:2058–2072. 2002. View Article : Google Scholar : PubMed/NCBI
|
|
64
|
Li S, Jo YS, Lee JH, Min JK, Lee ES, Park
T, Kim JM and Hong HJ: L1 cell adhesion molecule is a novel
independent poor prognostic factor of extrahepatic
cholangiocarcinoma. Clin Cancer Res. 15:7345–7351. 2009. View Article : Google Scholar : PubMed/NCBI
|