Introduction
Head and neck squamous cell carcinoma (HNSCC),
including oral cancer, is the sixth most prevalent cancer worldwide
and accounts for ~8–10% of all cancer types in Southeast Asia
(1,2). Despite improvements in the diagnosis
and management of HNSCC, long-term survival rates have improved
only marginally over the past decade (3). To improve the survival rate in HNSCC
patients, investigations into the underlying molecular and
phenotypic events associated with head and neck squamous
tumorigenesis are necessary. The identification of biomarkers for
early detection and prognostic stratifications is also needed.
Recent findings have suggested that the persistent
survival of cancer stem cells (CSCs), also known as
tumor-initiating cells, may contribute to the aggression and
recurrence of HNSCC (4–7). These CSCs are key contributors to
radio- and chemoresistance and are responsible for tumor
progression and recurrence after conventional therapy (4,8).
Additionally, epithelial-mesenchymal transition
(EMT) is a key developmental program that is often activated in
CSCs during cancer development (9,10). The
occurrence of EMT in cancer cells may lead to a number of changes
including loss of cell polarity and downregulation of epithelial
cell markers, loss of cell-cell connections, in addition to gaining
mesenchymal phenotypes along with genetic/epigenetic modifications
of different genes. Published studies suggest a direct link between
EMT and the gain of CSC-like properties (11). This process is thought to be a
critical step in the induction of tumor metastasis and malignancy
(12).
B-lymphoma Moloney murine leukemia virus insertion
region-1 (BMI1), a member of the polycomb group (PcG) genes, is
considered to be pivotal in regulating stemness-related genes
involved in maintaining the self-renewal ability of stem cells by
promoting chromatin modifications. BMI1 is also known to be
deregulated in various human types of cancer (13–16).
BMI1 is a prognostic marker in prostate, breast, ovarian, cervical,
colorectal, lung, esophageal, gastric and nasopharyngeal cancer
(13,17–24).
However, the role of BMI1 in maintaining self-renewal and
tumorigenicity in HNSCC or HNSCC-derived cancer stem cells (CSCs)
remains to be clarified.
ZEB1, a member of the zinc-finger transcription
factor family, is one of the master regulators of EMT that mediates
invasiveness as well as metastasis in many different types of
malignant tumors. ZEB1 induces EMT by suppressing the expression of
E-cadherin and contributing to the progression of malignant cancer
(25). ZEB1 is a good predictor of
prognosis in breast, lung, colorectal and esophageal cancer
(26–29). Extensive studies have revealed that
several transcription factors such as ZEB1 function together to
regulate the EMT program (30).
However, the role of ZEB1 in HNSCC remains unclear.
In the present study, we studied several biomarkers,
BMI1, ZEB1, vimentin and E-cadherin associated with EMT in tongue
squamous cell carcinoma (TSCC) cells and tumor specimens to
determine their relationship to the invasion and progression of
these tumors. TSCC accounts for ~60% of oral squamous cell
carcinoma and clarification of the significance of BMI1 and ZEB1 in
this disease is critical for future therapies.
Materials and methods
Carcinoma cell lines and isolation of
fibroblasts
Two human TSCC cell lines, Tosca-2S and Tosca-23,
and human fibroblasts (31) were
used. Human fibroblasts were collected from human oral specimens;
tissues were cultured and the migrating fibroblasts were
subcultured for 3–10 passages and used as stromal cells for this
assay.
Collagen gel invasion assay
To conduct the collagen gel invasion assay, we used
a 3-dimensional collagen gel culture. Insert chambers with
8-µm pores were treated and placed in six 35-mm culture
dishes.
First, a collagen solution was poured into the
chambers and incubated at 37°C for 30 min to solidify the gel.
Second, eight volumes of acid-soluble 0.3% type I collagen solution
(Cellmatrix type I-A, pH 3.0), one volume of ×10 concentrated
minimum essential medium, and one volume of reconstruction buffer
(2.2 g of sodium bicarbonate and 4.77 g of HEPES dissolved in 100
ml of 0.05 N sodium hydroxide) were mixed. Fibroblasts were added
to this solution at a density of 1×10⁵/ml, subsequently,
2 ml of this mixture containing fibroblasts was added to the
chamber on top of the solid collagen-only layer. After solidifying,
medium was added to the upper and lower parts of the well. TSCC
cells were then spread on the gel.
The 35-mm plates were observed using a
phase-contrast microscope on a daily basis. Four weeks later, the
whole collagen gel was fixed with 10% formalin, embedded in
paraffin, cut into vertical 4-µm sections, deparaffinized
and stained with hematoxylin and eosin. For immunostaining,
antigens were retrieved by heating at 120°C for 20 min, and cancer
cells were identified with vimentin, E-cadherin, BMI1 and ZEB1
antibodies.
The linear borderline between the cells and the gel
corresponded to the basement membrane. The TSCC cells in the
stratified layer along the gel or in contact with the basement
membrane were considered preinvasive, and any downgrowth into the
gel as invasion.
Tissue samples and patients
Tongue tissue specimens were accessed at the Oral
Pathology of Showa University from 1997 to 2011, and were used in
the present study. A total of 47 patients were eligible for
inclusion (24 men and 23 women, with a median age of 58 years,
range 30–83 years). All the patients had undergone resection of the
tongue primary tumor and did not include any patients with distant
metastasis or any who had received preoperative therapy.
The present study was approved by the Ethics
Committee, Oral Pathology of Showa University, and adhered to the
principles in the Declaration of Helsinki. Samples were obtained
after the patients had provided informed consent (permit no. 8,
November 2, 2001).
Tongue tissues were surgically resected from the
patients and hematoxylin and eosin-stained slides were assessed.
The tissues were frozen in isopentane cooled in liquid nitrogen and
stored at -80°C for immunohistochemistry and RT-PCR. Sixty-four
fresh-frozen samples were collected, of which 32 were primary
invasive tongue cancers (15 early invasive that did not show any
invasion into the muscle layer, and 17 advanced invasive cancers
that had invaded the muscle layer) and 32 dysplasias (14 mild
dysplasias and 18 moderate-severe dysplasias). Some cancer and
dysplastic specimens were harvested simultaneously from one
patient. The histological sections and immunostaining were analyzed
by a single pathologist without knowledge of clinical data.
Immunohistochemistry for tongue
tissues
The frozen tissues were cut into 4-µm
sections, fixed in 4% paraformaldehyde, and treated with 3%
hydrogen peroxide in methanol for 10 min to block the endogenous
peroxidase activity. Immunostaining was performed with a mouse
monoclonal E-cadherin antibody (SC-8426, diluted 1:100 for IHC;
Santa Cruz Biotechnology, Inc., Santa Cruz, CA, USA), or rabbit
polyclonal BMI1 antibody (T3421, 1:100 for IHC; Cosmo Bio
Epitomics, CA, USA), or rabbit polyclonal ZEB1 antibody (SC-25388,
1:100 for IHC; Santa Cruz Biotechnology, Inc.) overnight at 4°C or
mouse monoclonal vimentin antibody (no. M0725; 1:200 for IHC; Dako,
Glostrup, Denmark) for 30 min at room temperature. After rinsing in
phosphate-buffered saline, the sections were incubated with
biotinylated secondary antibody. Detection was performed with
diaminobenzidine (DAB) and counter-stained with Mayer hematoxylin
followed by dehydration and mounting.
Assessment of immunohistochemical
staining
Immunohistochemical staining was observed in the
parabasal and basal cell layer of the normal squamous epithelium,
the dysplasias, and the outermost layer of cancer cells at the
invasive front. The semi-quantitative analysis of the stained
sections was carried out by light-microscopy according to the
immunore-active scoring (IRS) system by Remmele and Stegner
(32). Sections were examined at a
magnification of ×400 and the staining intensity (SI) was assessed
by comparison with adjacent normal epithelia, which served as a
reference for moderate intensity (M). Tumor staining less intense
than the basal layer of adjacent normal epithelia was classified as
weak (W), more intense staining as strong intensity (S), and no
staining as negative (N). When a tumor had different staining
intensities we assessed 10 random areas and recorded the largest
area of intensity among these 10 measurements as the intensity for
that tumor. Based on the percentage of positive cells (PP), the
samples were classified into five grades: grade 0, (0%); grade 1,
(0–10%); grade 2, (11–50%); grade 3, (51–80%); and grade 4,
(81–100%). The product of SI and PP was the IRS. The IRS with
points from 0 to 12 was adapted to an additional 3-point IRS
classification (Table I).
 | Table IImmunoreactive score (IRS) and IRS
classification scoring systems. |
Table I
Immunoreactive score (IRS) and IRS
classification scoring systems.
A, Immunoreactive
score (IRS)
|
|---|
| Percentage of
positive cells x intensity of staining, IRS (0–12) |
|---|
| 0, No positive
cell | 0, No color
reaction |
| 1, <10% positive
cells | 1, Mild
reaction |
| 2, 10–50% positive
cells | 2, Moderate
reaction |
| 3, 51–80% positive
cells | 3, Strong
reaction |
| 4, >80% positive
cells | |
B, IRS
classification scoring systems
|
|---|
| IRS-points |
IRS-classification |
|---|
| 0–4 | 0, Less than
normal | Negative |
| 5–8 | 1, Less than
normal | Negative |
| 9–12 | 2, More than
normal | Positive |
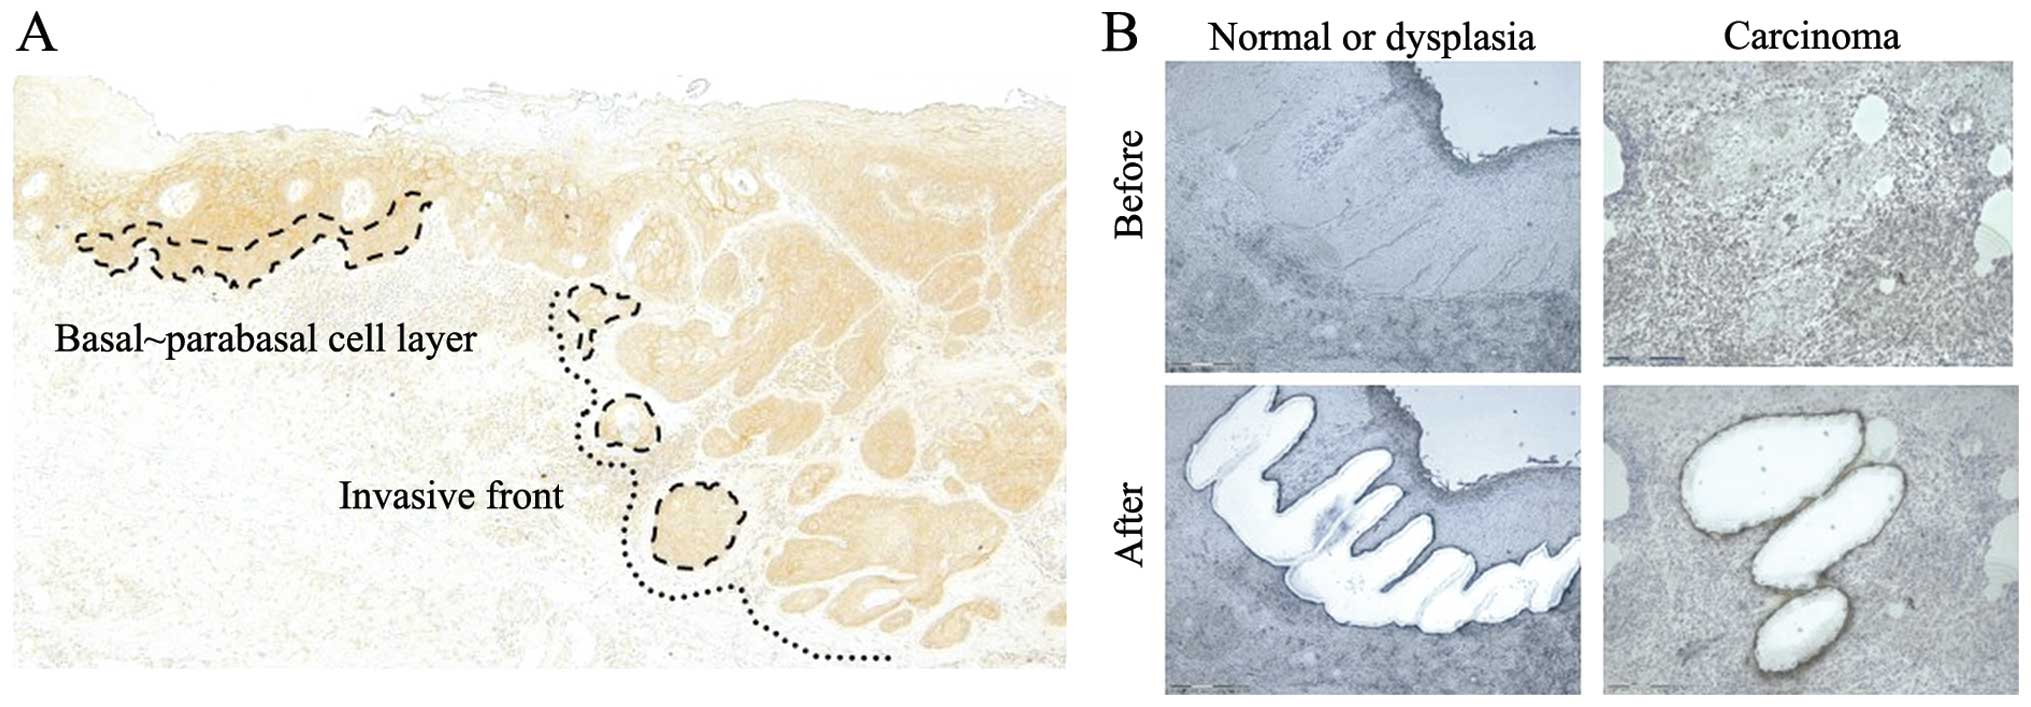
Laser microdissection
The 8 µm sliced sample was fixed in 95%
ethanol for 5 min, and then washed with 70% ethanol, and stained
with the LCM frozen section staining kit (Ambion). We procured a
few hundred cells from the cancers or dyspla-sias and the adjacent
normal epithelia from 15 samples using laser microdissection (PALM
MicroBeam; Zeiss, Boston, Massachusetts, USA) (Fig. 1A and B). The microdissected cells
within the cap were covered with buffer and vortexed. Total RNA was
extracted from each population of laser-micro-dissected cells.
Reverse transcription-quantitative
PCR
Total RNA was extracted with the RNeasy Plus Micro
kit (Qiagen, Valencia, CA, USA), mRNA was reverse transcribed with
SuperScript VILO Master Mix (Invitrogen-Life Technologies,
Carlsbad, CA, USA), and cDNA synthesis was performed. Quantitative
PCR was performed with an ABI PRISM 7500 Fast Real-Time PCR System
(Applied Biosystems).
The amplification profile used was: denaturation at
95°C for 10 min, followed by 50 cycles of denaturation at 95°C for
15 sec and annealing at 60°C for 1 min. The expression levels were
quantified using the vimentin primer (Hs00185584_m1; TaqMan),
E-cadherin primer (Hs01023894_m1; TaqMan), BMI1 primer
(Hs00180411_m1; TaqMan), and ZEB1 primer (Hs00232783_m1, TaqMan)
(all from Applied Biosystems). The geometric mean of the
glyceraldehyde-3-phosphate dehydrogenase (GAPDH) was used as an
internal control to normalize any variability. The comparative
cycle threshold (CT) method was applied to quantify the relative
expression levels of mRNAs. The relative amount of each marker was
calculated using the equation 2−ΔCT where ΔCT
= (CTX-CTGAPDH).
Statistical analysis
A comparison of the protein expression levels
according to the IRS was carried out using the Kruskal-Wallis and
the post hoc Mann-Whitney U tests. A comparison of mRNA expression
levels was carried out using the non-repeated measures ANOVA and
post-hoc Mann-Whitney U test. The correlation between the
expression of several biomarkers in the TSCC cells was assessed
with the Chi-square and Fisher’s exact tests, and Spearman’s
correlation. Statistical analyses were performed using modified EZR
(The R Foundation for Statistical Computing, Perugia, Italy)
software programs. Two-tailed P-values were calculated and
P<0.05 and <0.01 were considered to indicate a statistically
significant result.
Results
Protein expression in an in vitro TSCC
invasion model
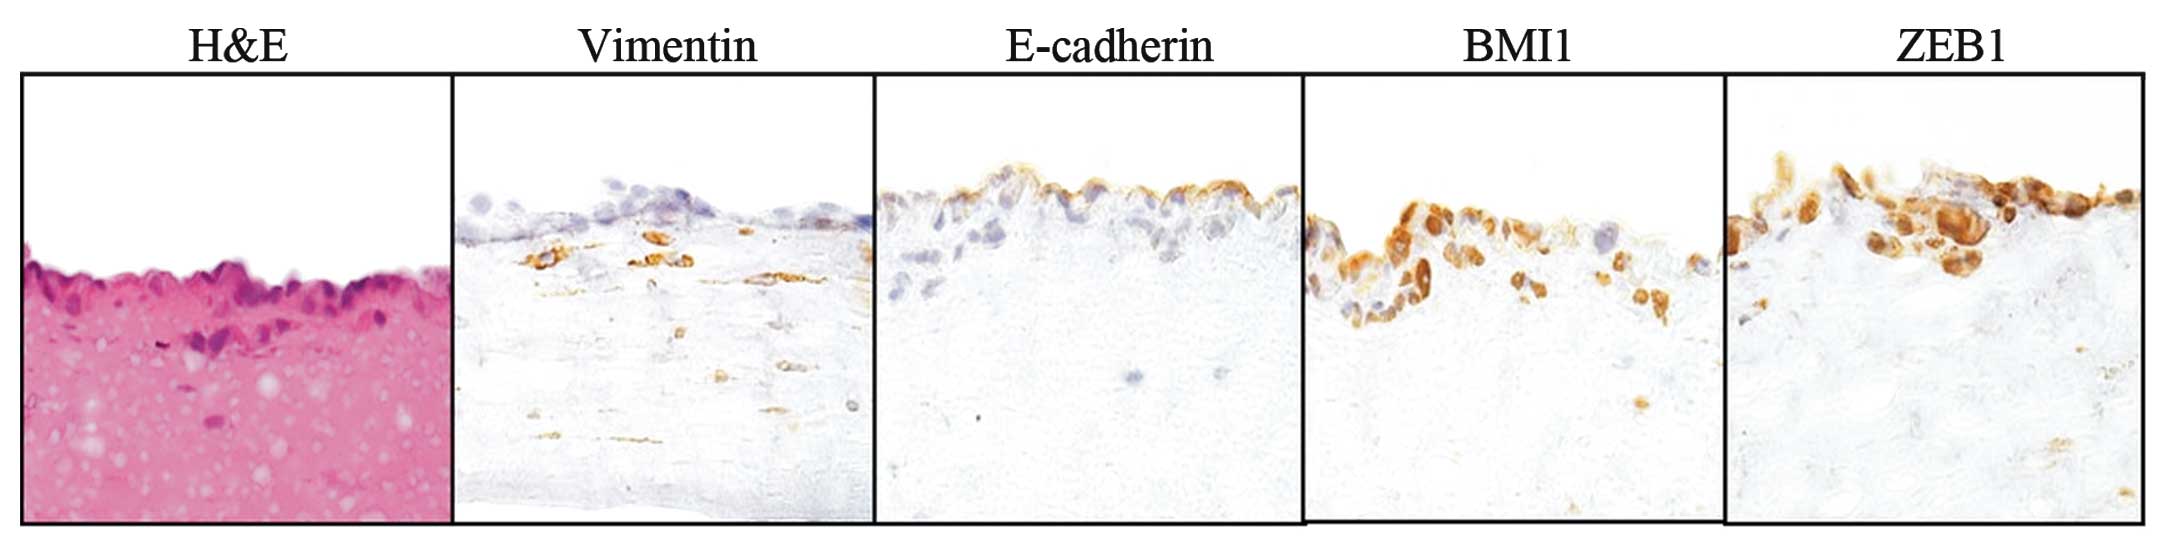
In our collagen gel invasion assay, we examined the
association between protein expression and early invasion of TSCC
cells (TOSCa-2S and TOSCa-23). Only 2.5% of preinvasive cells had a
high vimentin expression, but as many as 70.0% of invasive cells
had high vimentin levels. Seventy-two percent of preinvasive cells
and only 3.6% of invasive cells had high E-cadherin expression
levels. Sixty-two percent of the preinvasive cells and 73.0% of the
invasive cells showed a high BMI1 expression, and 60.2% of the
preinvasive cells in addition to 73.5% of the invasive cells had
high-ZEB1 levels (Fig. 2). Protein
expression markers were significantly different between the
preinvasive and invasive cells (P<0.001, P<0.01; Table II).
| Table IIProtein expression analysis in the
preinvasive and invasive cells. |
Table II
Protein expression analysis in the
preinvasive and invasive cells.
| Cells | Vimentin expression
| P-value |
|---|
| Positive (%) | Negative (%) |
|---|
| Preinvasive | 11 (2.5) | 426 (97.5) | <0.001 |
| Invasive | 79 (70.0) | 34 (30.0) | |
| E-cadherin
expression
| |
| Preinvasive | 334 (72.3) | 128 (27.7) | <0.001 |
| Invasive | 4 (3.6) | 107 (96.4) | |
| BMI1 expression
| |
| Preinvasive | 305 (62.4) | 184 (37.6) | <0.01 |
| Invasive | 135 (73.0) | 50 (27.0) | |
| ZEB1 expression
| |
| Preinvasive | 240 (60.2) | 159 (39.8) | <0.01 |
| Invasive | 83 (73.5) | 30 (26.5) | |
Protein and mRNA expression in vivo using
human tissue samples
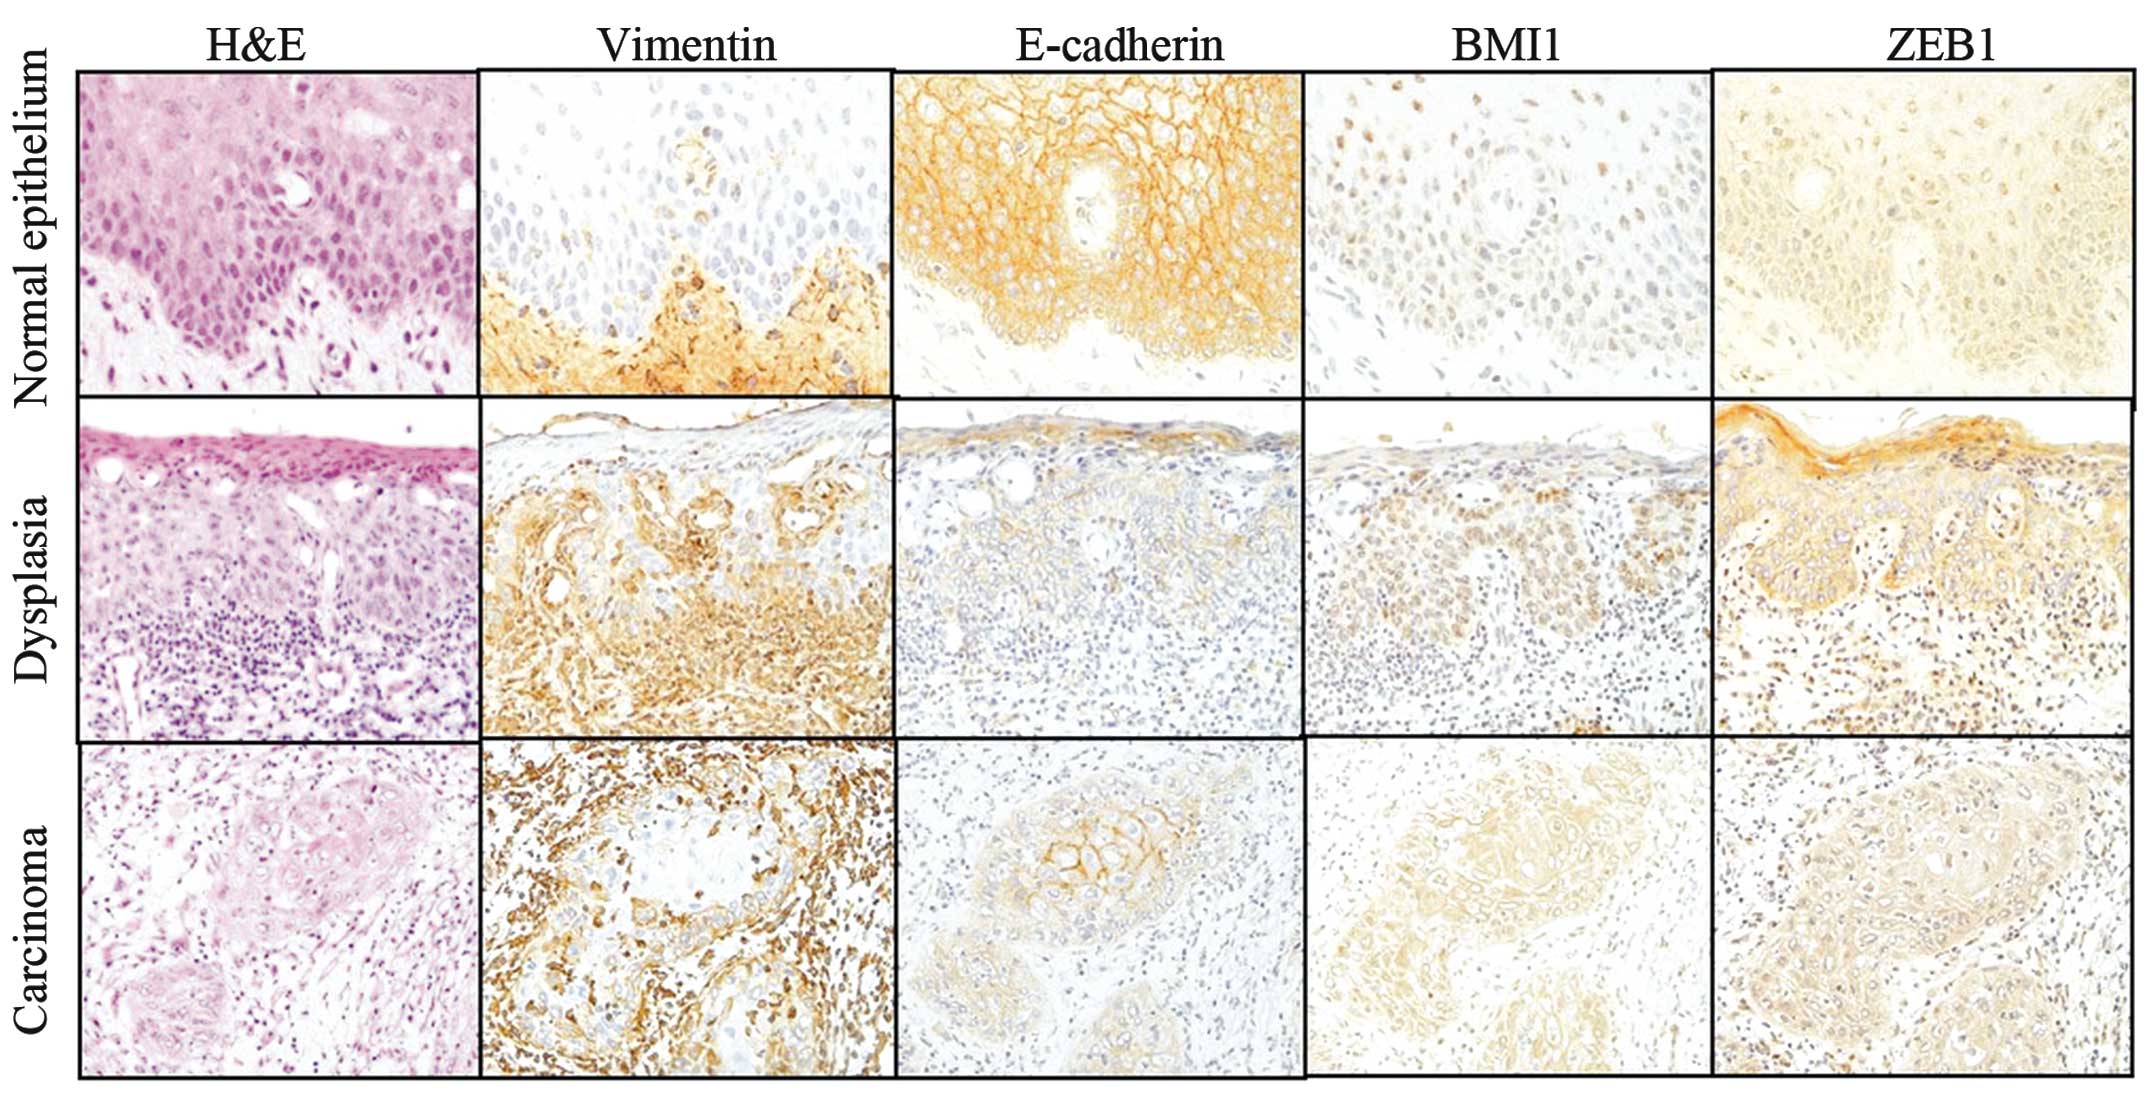
We compared the expression of these proteins
immunohistochemically among the five groups of samples: normal
squamous epithelium, mild and moderate-severe dysplasia, early
invasive and advanced invasive cancer. BMI1 immunoexpression was
mainly detected within the nuclei of the normal squamous epithelium
and mild dysplasia, but was detected in the nuclei and cytoplasm of
the majority of severe dysplasia and cancer cells. BMI1 high
immunoexpression (IRS-classification, 12) was observed in 84.4%
(27/32) of the invasive cancers. ZEB1 expression was detected in
the cytoplasm of the samples and ZEB1-high expression was only
observed in 50.0% (16/32) of the invasive cancers (Fig. 3).
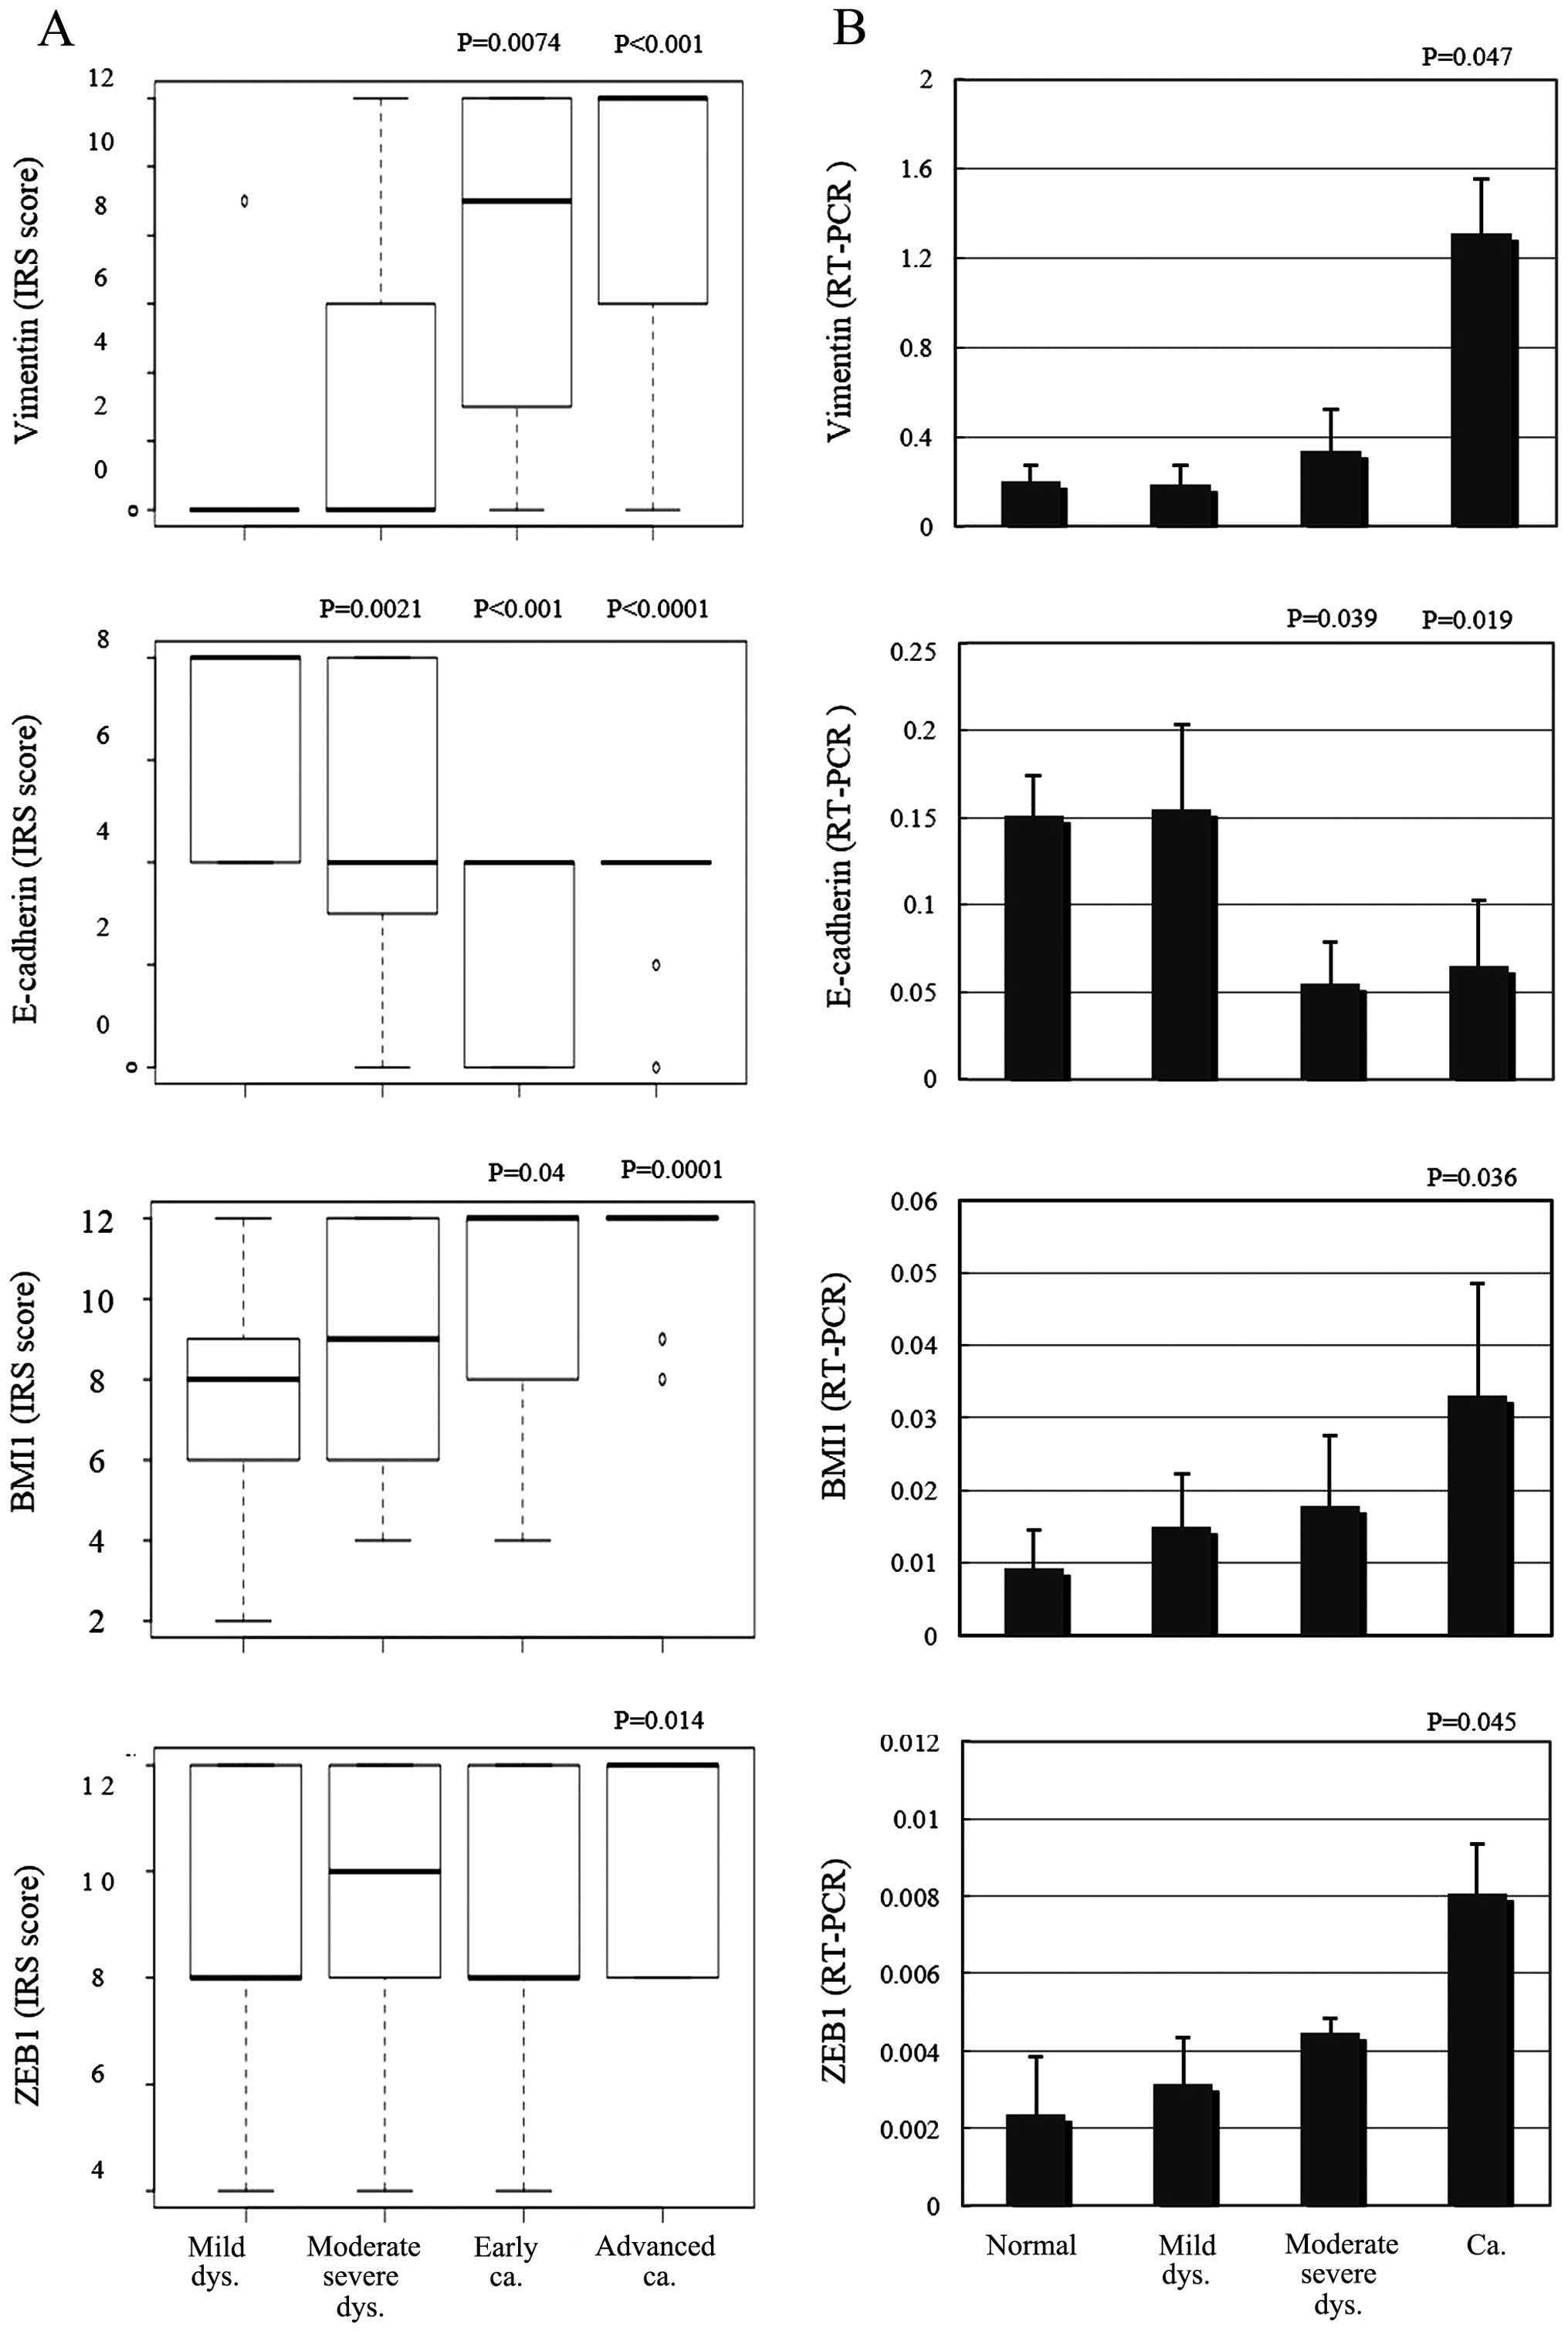
After scoring and assessing the immunohistochemical
samples, E-cadherin expression was found to be significantly
decreased in the moderate-severe dysplasia and invasive cancer
samples compared with the adjacent normal squamous epithelium
(P=0.0021, P<0.001, P<0.0001; Fig. 4A). Vimentin and BMI1 protein
expression levels were significantly increased in the invasive
cancers, including early and advanced samples (P=0.0074,
P<0.001, P=0.04, 0.0001; Fig.
4A). ZEB1 expression was significantly increased only in
advanced samples (P= 0.014; Fig.
4A), compared with the adjacent normal squamous epithelia.
Using quantitative PCR, E-cadherin mRNA levels were significantly
decreased in moderate-severe dysplasias and the invasive cancers
compared with the adjacent normal squamous epithelia (P=0.039,
P=0.019; Fig. 4B). Vimentin, BMI1
and ZEB1 mRNA expression levels were significantly increased in the
invasive samples compared with the adjacent normal squamous
epithelia (P=0.047, P=0.036, P=0.045; Fig. 4B).
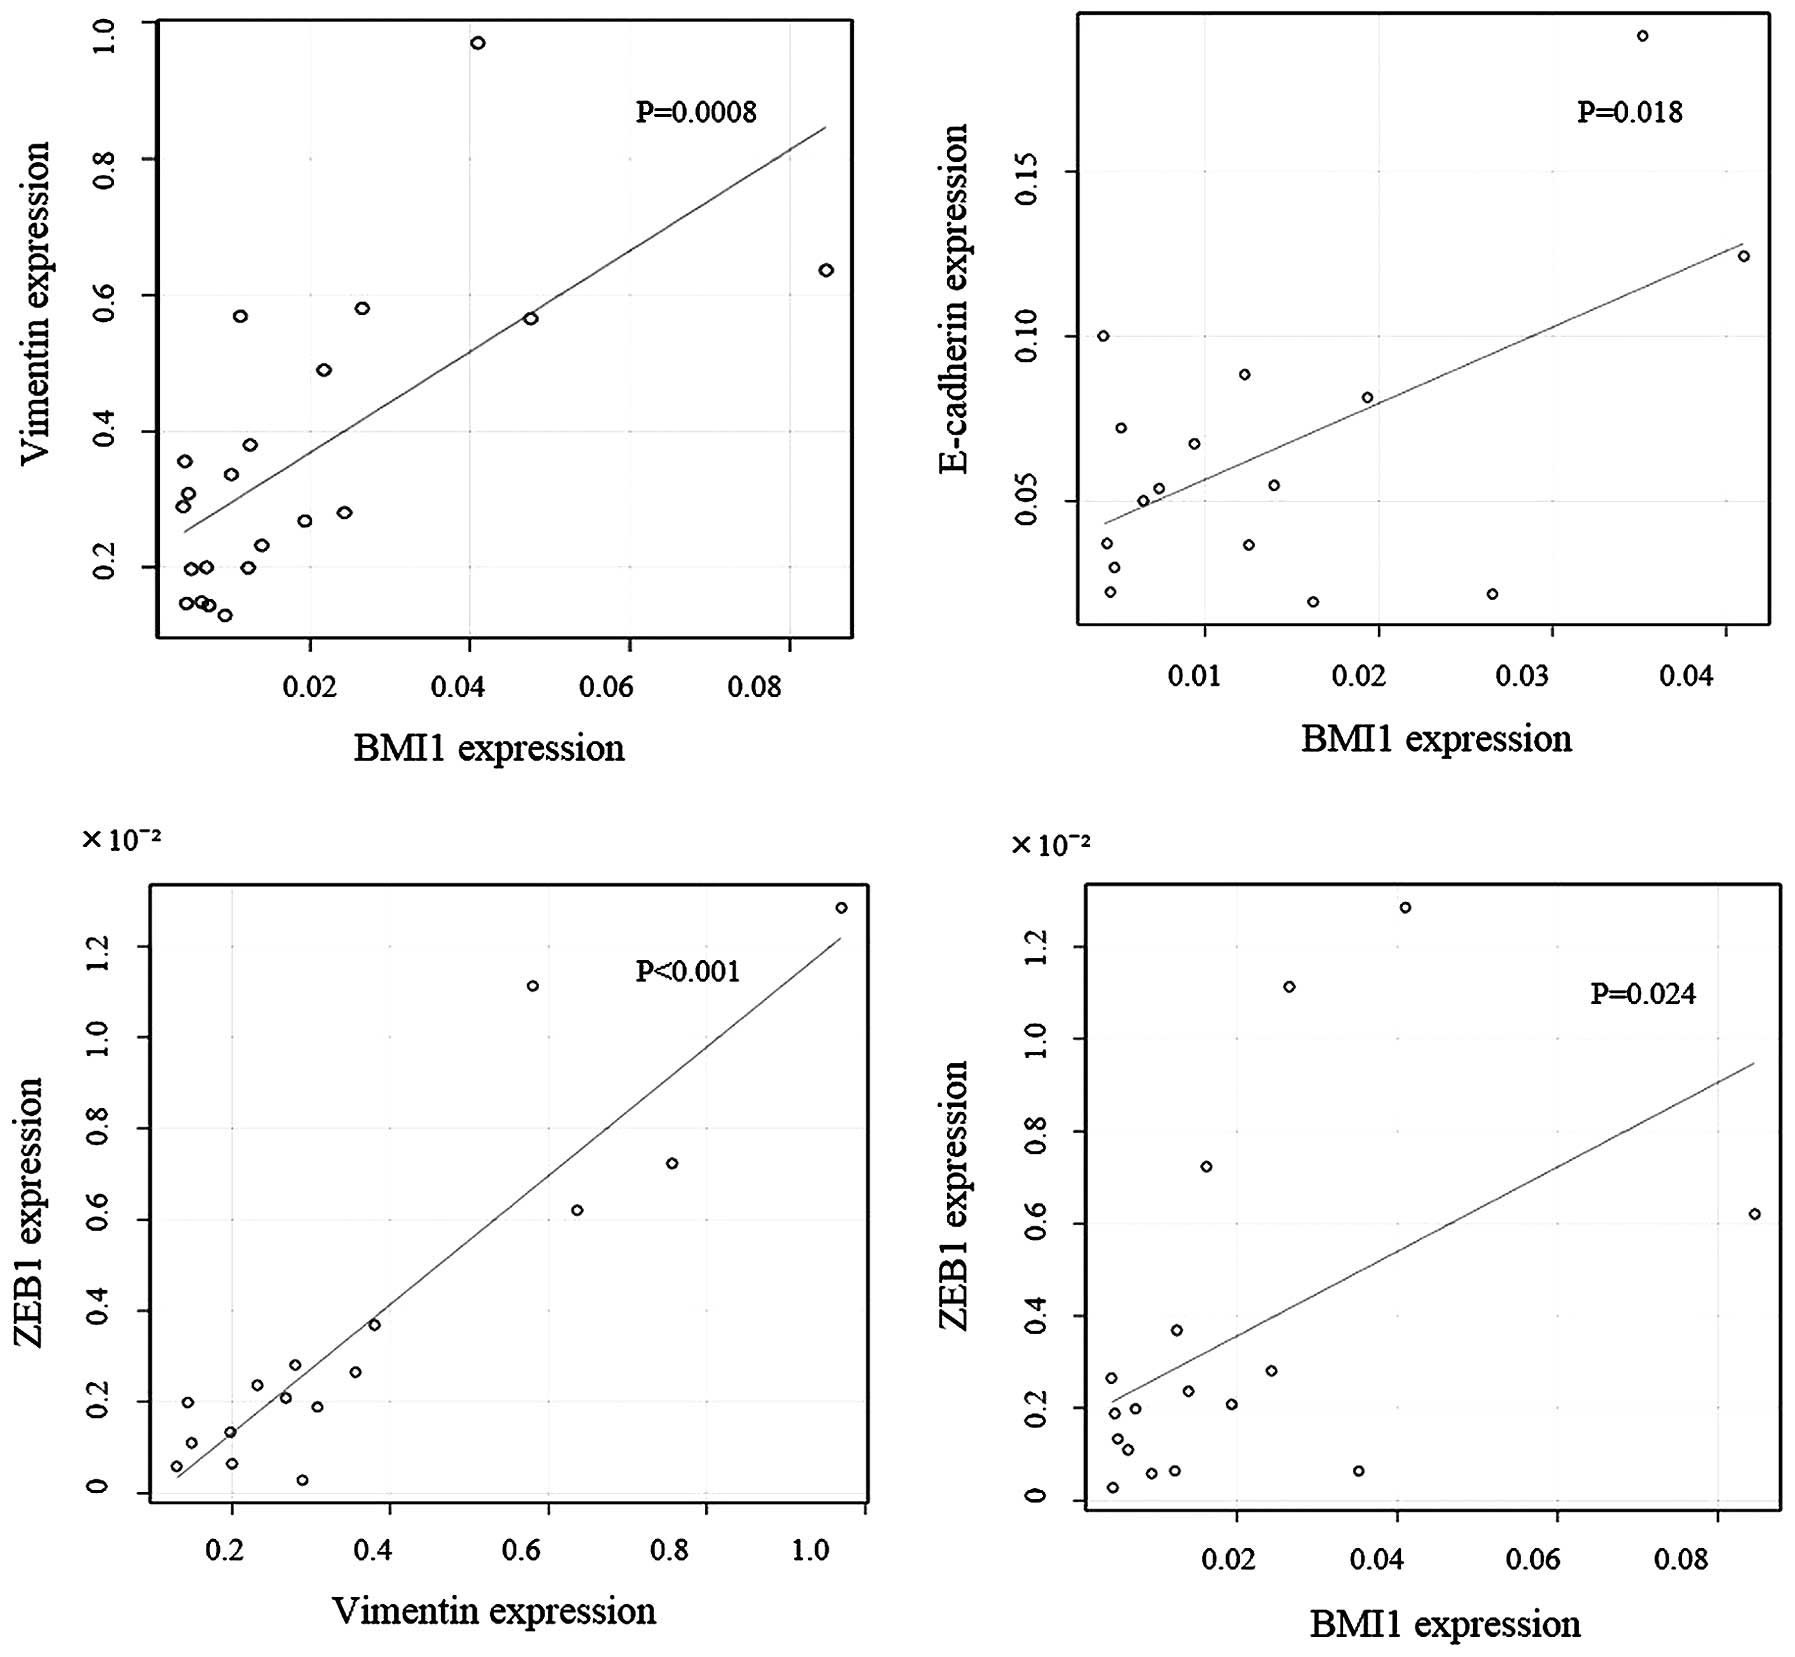
Elevated levels of BMI1 were accompanied by the
down-regulation of E-cadherin and an upregulation of vimentin at
the invasive front, demonstrating a significant negative
correlation between BMI1 and E-cadherin protein and mRNA expression
(P=0.0097; Table III, P=0.018;
Fig. 5). This result also suggested
a significant positive correlation between BMI1 and vimentin
protein and mRNA expression (P=0.035; Table III, P=0.0008; Fig. 5). There was also a significant
positive correlation between ZEB1 and vimentin mRNA levels, as well
as between BMI1 and ZEB1 mRNA (P<0.001, P=0.024; Fig. 5).
| Table IIICorrelation of vimentin, E-cadherin
and BMI1 mRNA expressions. |
Table III
Correlation of vimentin, E-cadherin
and BMI1 mRNA expressions.
| Expression | Grade | BMI1 expression
| P-valuea |
|---|
Neg
| Pos
|
|---|
| 0 | 1 | 2 |
|---|
| E-cadherin | Neg | 3 | 11 | 36 | 0.0097 |
| Pos | 3 | 8 | 6 | |
| | BMI1 expression
| P-valuea |
Neg
| Pos
|
| Vimentin | Neg | 5 | 14 | 22 | 0.035 |
| Pos | 1 | 5 | 20 | |
Discussion
EMT is encountered in three distinct biological
settings (33). The first setting
is associated with implantation and embryonic gastrulation, which
leads to the mesoderm and endoderm, as well as to the development
and organization of several structures. Type 2 EMTs are engaged in
the context of inflammation and fibrosis. These EMTs continue to
occur overtime until infections are removed and the tissue is
repaired. Type 3 EMTs occur in the context of tumor growth and
cancer progression, when epithelia transform into cancer cells and
undergo EMT, which enables invasion and metastasis. EMTs have
E-cadherin transcriptional repression in common, and it is worth
noting that E-cadherin loss is associated with the progression of
papilloma to invasive carcinoma (33).
In the present study, we examined the involvement of
BMI1 and ZEB1 in tongue carcinogenesis by comparing E-cadherin and
vimentin expression levels in vitro and in vivo.
In the TSCC cell invasion assay, we demonstrated
that downregulation of E-cadherin was observed in 96.4% of the
invasive TSCC cells, suggesting that they underwent EMT. We
revealed that the BMI1 and ZEB1 proteins were expressed in 73% of
the invasive TSCC cells compared with 60% of the preinvasive TSCC
cells. This finding indicates that higher levels of BMI1 and ZEB1
expression are associated with the EMT program and TSCC cell
invasion.
In TSCC tissues, BMI1 protein and mRNA expression
levels were significantly increased in the invasive cancer tissues
including early and advanced samples compared with adjacent normal
squamous epithelia. At the invasive front, elevated levels of BMI1
were accompanied by the downregulation of E-cadherin and the
upregulation of vimentin. This result shows the significant
negative correlation between BMI1 and E-cadherin expression, and
the significant positive correlation between BMI1 and vimentin
expression. These results suggest that BMI1 elevation at the mRNA
and protein level is involved in the invasion and progression of
TSCC. These are similar results with previous studies of other
epithelial malignancies and support an important role for BMI1
activation in the downregulation of E-cadherin and the induction of
EMT.
Other studies of these factors have found similar
results. For example, Song et al demonstrated that Bmi-1
mRNA and protein expression levels were found to correlate with the
invasion of nasopharyngeal carcinoma (13). Yang et al showed that BMI1 is
essential for EMT during tumor development in head and neck cancer
patients (14). Kang et al
showed that Bmi-1 overexpression was observed in preneoplastic oral
mucosal tissues, which included those with mild, moderate or severe
epithelial dysplasia (34). The
reason for the divergence from our results may be due to the
different pathophysiology of oral squamous cell carcinomas
(non-keratinizing vs. keratinizing). Furthermore, many of the
former studies presented small series of patients (N=8,10) with
oral dysplastic and carcinoma tissue, whereas our results included
64 cases. Notably, Häyry et al showed a significant negative
correlation between Bmi-1 protein expression and the recurrence of
tongue cancer (35). This
divergence from our results may be due to the samples used. Häyry
et al used 1-mm biopsy punches that only provide information
about focal points. Our samples provided a view of the entire tumor
cross-section. Balasubramanian et al reported BMI1
expression in the basal and suprabasal keratinocytes but not in the
surface epithelium (36). Recently,
another study showed that in the invading front, BMI is highly
enriched in CSCs, however, those authors found no Bmi-1 expression
in the cancer cells (37). In the
present study, we evaluated BMI1 protein and mRNA levels in cancer
cells at the invasive front.
The overexpression of ZEB1 was observed in
colorectal and esophageal cancer, suggesting an important role in
tumorigenesis (28,29). EMT-induced ZEB1 expression was also
previously reported to be associated with cancer progression
(38). We confirmed that ZEB1
protein expression was significantly increased in advanced invasive
cancer compared with adjacent normal squamous epithelia, consistent
with previous studies, and confirmed it to be associated with
cancer progression.
ZEB1 was found to be responsible for the
downregulation of basal membrane constituents at the invasive front
in colorectal carcinoma (29),
further, it has been shown that in esophageal SCC, ZEB1
downregulation by miR-150 suppressed E-cadherin repression,
vimentin expression, migration ability and tumorigenicity (30). In the present study, we identified a
significant positive correlation between ZEB1 and vimentin mRNA
expression, but found no significant correlation between ZEB1 and
E-cadherin expression. A hallmark of EMT is the loss of E-cadherin
expression; however, ZEB1 may not suppress E-cadherin itself. We
observed a significant correlation between ZEB1 and BMI1 mRNA
levels, which may indicate common regulation of BMI1 and ZEB1.
Recent fidings showed that EMT plays important roles
in cancer invasion and metastasis by imparting cancer stem-cell
properties (4,9). One study demonstrated that ZEB1 and
ZEB2 are key modulators of CSC properties in head and neck cancers,
including EMT, metastasis and drug resistance (39). The results of the present study
indicate that the activation of BMI1, a stem cell-like marker, is
associated with the promotion of EMT and invasion in TSCC.
Furthermore, elevated levels of BMI1 were accompanied by the
downregulation of E-cadherin and upregulation of vimentin, and the
elevated levels of ZEB1 were accompanied by the upregulation of
vimentin at the invasive front of TSCCs.
We hypothesized that each of the variety of
pathological tissues comprising oral cancers have individual roles
in carcinogenesis. Further investigation is needed to elucidate the
roles and mechanisms of BMI1 and ZEB1 in TSCC. In summary, our
findings show that BMI1 and ZEB1 are important factors associated
with the promotion of EMT and invasion of TSCC.
Acknowledgments
We thank the Showa University Pathology Department
for technical assistance.
References
|
1
|
Haddad RI and Shin DM: Recent advances in
head and neck cancer. N Engl J Med. 359:1143–1154. 2008. View Article : Google Scholar : PubMed/NCBI
|
|
2
|
Chen YJ, Chang JT, Liao CT, Wang HM, Yen
TC, Chiu CC, Lu YC, Li HF and Cheng AJ: Head and neck cancer in the
betel quid chewing area: Recent advances in molecular
carcinogenesis. Cancer Sci. 99:1507–1514. 2008. View Article : Google Scholar : PubMed/NCBI
|
|
3
|
Gibson MK and Forastiere AA: Reassessment
of the role of induction chemotherapy for head and neck cancer.
Lancet Oncol. 7:565–574. 2006. View Article : Google Scholar : PubMed/NCBI
|
|
4
|
Zhang Z, Filho MS and Nör JE: The biology
of head and neck cancer stem cells. Oral Oncol. 48:1–9. 2012.
View Article : Google Scholar :
|
|
5
|
Rosen JM and Jordan CT: The increasing
complexity of the cancer stem cell paradigm. Science.
324:1670–1673. 2009. View Article : Google Scholar : PubMed/NCBI
|
|
6
|
Lo WL, Yu CC, Chiou GY, Chen YW, Huang PI,
Chien CS, Tseng LM, Chu PY, Lu KH, Chang KW, et al: MicroRNA-200c
attenuates tumour growth and metastasis of presumptive head and
neck squamous cell carcinoma stem cells. J Pathol. 223:482–495.
2011. View Article : Google Scholar : PubMed/NCBI
|
|
7
|
Chen C, Zimmermann M, Tinhofer I, Kaufmann
AM and Albers AE: Epithelial-to-mesenchymal transition and cancer
stem(-like) cells in head and neck squamous cell carcinoma. Cancer
Lett. 338:47–56. 2013. View Article : Google Scholar
|
|
8
|
Major AG, Pitty LP and Farah CS: Cancer
stem cell markers in head and neck squamous cell carcinoma. Stem
Cells Int. 2013:3194892013. View Article : Google Scholar : PubMed/NCBI
|
|
9
|
Thiery JP, Acloque H, Huang RY and Nieto
MA: Epithelial-mesenchymal transitions in development and disease.
Cell. 139:871–890. 2009. View Article : Google Scholar : PubMed/NCBI
|
|
10
|
Raimondi C, Gianni W, Cortesi E and
Gazzaniga P: Cancer stem cells and epithelial-mesenchymal
transition: Revisiting minimal residual disease. Curr Cancer Drug
Targets. 10:496–508. 2010. View Article : Google Scholar : PubMed/NCBI
|
|
11
|
Polyak K and Weinberg RA: Transitions
between epithelial and mesenchymal states: Acquisition of malignant
and stem cell traits. Nat Rev Cancer. 9:265–273. 2009. View Article : Google Scholar : PubMed/NCBI
|
|
12
|
Thiery JP and Sleeman JP: Complex networks
orchestrate epithelial-mesenchymal transitions. Nat Rev Mol Cell
Biol. 7:131–142. 2006. View
Article : Google Scholar : PubMed/NCBI
|
|
13
|
Song LB, Li J, Liao WT, Feng Y, Yu CP, Hu
LJ, Kong QL, Xu LH, Zhang X, Liu WL, et al: The polycomb group
protein Bmi-1 represses the tumor suppressor PTEN and induces
epithelial-mesenchymal transition in human nasopharyngeal
epithelial cells. J Clin Invest. 119:3626–3636. 2009. View Article : Google Scholar : PubMed/NCBI
|
|
14
|
Yang MH, Hsu DS, Wang HW, Wang HJ, Lan HY,
Yang WH, Huang CH, Kao SY, Tzeng CH, Tai SK, et al: Bmi1 is
essential in Twist1-induced epithelial-mesenchymal transition. Nat
Cell Biol. 12:982–992. 2010. View
Article : Google Scholar : PubMed/NCBI
|
|
15
|
Gil J, Bernard D and Peters G: Role of
polycomb group proteins in stem cell self-renewal and cancer. DNA
Cell Biol. 24:117–125. 2005. View Article : Google Scholar : PubMed/NCBI
|
|
16
|
Pasini D, Bracken AP and Helin K: Polycomb
group proteins in cell cycle progression and cancer. Cell Cycle.
3:396–400. 2004. View Article : Google Scholar : PubMed/NCBI
|
|
17
|
Crea F, Duhagon Serrat MA, Hurt EM, Thomas
SB, Danesi R and Farrar WL: BMI1 silencing enhances docetaxel
activity and impairs antioxidant response in prostate cancer. Int J
Cancer. 128:1946–1954. 2011. View Article : Google Scholar
|
|
18
|
Guo BH, Feng Y, Zhang R, Xu LH, Li MZ,
Kung HF, Song LB and Zeng MS: Bmi-1 promotes invasion and
metastasis, and its elevated expression is correlated with an
advanced stage of breast cancer. Mol Cancer. 10:102011. View Article : Google Scholar : PubMed/NCBI
|
|
19
|
Wang E, Bhattacharyya S, Szabolcs A,
Rodriguez-Aguayo C, Jennings NB, Lopez-Berestein G, Mukherjee P,
Sood AK and Bhattacharya R: Enhancing chemotherapy response with
Bmi-1 silencing in ovarian cancer. PLoS One. 6:e179182011.
View Article : Google Scholar : PubMed/NCBI
|
|
20
|
Tong YQ, Liu B, Zheng HY, He YJ, Gu J, Li
F and Li Y: BMI-1 autoantibody as a new potential biomarker for
cervical carcinoma. PLoS One. 6:e278042011. View Article : Google Scholar : PubMed/NCBI
|
|
21
|
Kim JH, Yoon SY, Kim CN, Joo JH, Moon SK,
Choe IS, Choe YK and Kim JW: The Bmi-1 oncoprotein is overexpressed
in human colorectal cancer and correlates with the reduced
p16INK4a/p14ARF proteins. Cancer Lett. 203:217–224. 2004.
View Article : Google Scholar : PubMed/NCBI
|
|
22
|
Vonlanthen S, Heighway J, Altermatt HJ,
Gugger M, Kappeler A, Borner MM, van Lohuizen M and Betticher DC:
The bmi-1 oncoprotein is differentially expressed in non-small cell
lung cancer and correlates with INK4A-ARF locus expression. Br J
Cancer. 84:1372–1376. 2001. View Article : Google Scholar : PubMed/NCBI
|
|
23
|
He XT, Cao XF, Ji L, Zhu B, Lv J, Wang DD,
Lu PH and Cui HG: Association between Bmi1 and clinicopathological
status of esophageal squamous cell carcinoma. World J
Gastroenterol. 15:2389–2394. 2009. View Article : Google Scholar : PubMed/NCBI
|
|
24
|
Liu JH, Song LB, Zhang X, Guo BH, Feng Y,
Li XX, Liao WT, Zeng MS and Huang KH: Bmi-1 expression predicts
prognosis for patients with gastric carcinoma. J Surg Oncol.
97:267–272. 2008. View Article : Google Scholar
|
|
25
|
Kalluri R and Weinberg RA: The basics of
epithelial-mesenchymal transition. J Clin Invest. 119:1420–1428.
2009. View
Article : Google Scholar : PubMed/NCBI
|
|
26
|
Soini Y, Tuhkanen H, Sironen R, Virtanen
I, Kataja V, Auvinen P, Mannermaa A and Kosma VM: Transcription
factors zeb1, twist and snai1 in breast carcinoma. BMC Cancer.
11:732011. View Article : Google Scholar : PubMed/NCBI
|
|
27
|
Gemmill RM, Roche J, Potiron VA, Nasarre
P, Mitas M, Coldren CD, Helfrich BA, Garrett-Mayer E, Bunn PA and
Drabkin HA: ZEB1-responsive genes in non-small cell lung cancer.
Cancer Lett. 300:66–78. 2011. View Article : Google Scholar
|
|
28
|
Zhang GJ, Zhou T, Tian HP, Liu ZL and Xia
SS: High expression of ZEB1 correlates with liver metastasis and
poor prognosis in colorectal cancer. Oncol Lett. 5:564–568.
2013.PubMed/NCBI
|
|
29
|
Yokobori T, Suzuki S, Tanaka N, Inose T,
Sohda M, Sano A, Sakai M, Nakajima M, Miyazaki T, Kato H, et al:
MiR-150 is associated with poor prognosis in esophageal squamous
cell carcinoma via targeting the EMT inducer ZEB1. Cancer Sci.
104:48–54. 2013. View Article : Google Scholar
|
|
30
|
Gheldof A, Hulpiau P, van Roy F, De Craene
B and Berx G: Evolutionary functional analysis and molecular
regulation of the ZEB transcription factors. Cell Mol Life Sci.
69:2527–2541. 2012. View Article : Google Scholar : PubMed/NCBI
|
|
31
|
Nakamura E, Kozaki K, Tsuda H, Suzuki E,
Pimkhaokham A, Yamamoto G, Irie T, Tachikawa T, Amagasa T, Inazawa
J, et al: Frequent silencing of a putative tumor suppressor gene
melatonin receptor 1 A (MTNR1A) in oral squamous-cell carcinoma.
Cancer Sci. 99:1390–1400. 2008. View Article : Google Scholar : PubMed/NCBI
|
|
32
|
Remmele W and Stegner HE: Recommendation
for uniform definition of an immunoreactive score (IRS) for
immunohisto-chemical estrogen receptor detection (ER-ICA) in breast
cancer tissue. Pathologe. 8:138–140. 1987.In German. PubMed/NCBI
|
|
33
|
Nieto MA: The ins and outs of the
epithelial to mesenchymal transition in health and disease. Annu
Rev Cell Dev Biol. 27:347–376. 2011. View Article : Google Scholar : PubMed/NCBI
|
|
34
|
Kang MK, Kim RH, Kim SJ, Yip FK, Shin KH,
Dimri GP, Christensen R, Han T and Park NH: Elevated Bmi-1
expression is associated with dysplastic cell transformation during
oral carcinogenesis and is required for cancer cell replication and
survival. Br J Cancer. 96:126–133. 2007. View Article : Google Scholar
|
|
35
|
Häyry V, Mäkinen LK, Atula T, Sariola H,
Mäkitie A, Leivo I, Keski-Säntti H, Lundin J, Haglund C and
Hagström J: Bmi-1 expression predicts prognosis in squamous cell
carcinoma of the tongue. Br J Cancer. 102:892–897. 2010. View Article : Google Scholar : PubMed/NCBI
|
|
36
|
Balasubramanian S, Lee K, Adhikary G,
Gopalakrishnan R, Rorke EA and Eckert RL: The Bmi-1 polycomb group
gene in skin cancer: Regulation of function by
(-)-epigallocatechin-3-gallate. Nutr Rev. 66(Suppl 1): S65–S68.
2008. View Article : Google Scholar : PubMed/NCBI
|
|
37
|
Siddique HR and Saleem M: Role of BMI1, a
stem cell factor, in cancer recurrence and chemoresistance:
Preclinical and clinical evidences. Stem Cells. 30:372–378. 2012.
View Article : Google Scholar : PubMed/NCBI
|
|
38
|
Chen ML, Liang LS and Wang XK: miR-200c
inhibits invasion and migration in human colon cancer cells
SW480/620 by targeting ZEB1. Clin Exp Metastasis. 29:457–469. 2012.
View Article : Google Scholar : PubMed/NCBI
|
|
39
|
Chu PY, Hu FW, Yu CC, Tsai LL, Yu CH, Wu
BC, Chen YW, Huang PI and Lo WL: Epithelial-mesenchymal transition
transcription factor ZEB1/ZEB2 co-expression predicts poor
prognosis and maintains tumor-initiating properties in head and
neck cancer. Oral Oncol. 49:34–41. 2013. View Article : Google Scholar
|