Introduction
In the last two decades it has become clear that,
besides the direct cell-to-cell contact and transfer of secreted
molecules, there is an additional mechanism in intercellular
communication involving extracellular vesicles (EVs) (1). It is well known that a variety of
cells is able to secrete several types of EVs. When initially
identified EVs were considered a form of waste elimination, whereas
it has become clear that these membrane-enclosed structures are
signaling packages able to interact with the extracellular matrix,
by modifying it, and the surrounding cells, by stimulating or
inhibiting these structures (2,3). EVs
can transport several bioactive molecules, such as proteins, lipids
and RNAs, and can propagate their content in recipient cells
through horizontal transfer, thus having a significant impact on
the surrounding extracellular matrix and cells (4).
Previous studies defined the importance of this
novel mechanism of intercellular communication in various
physiological and pathological events, such as the immune response,
cell differentiation and vascular, neurological and cancer diseases
(2,5).
EVs are divided into three major groups represented
by apoptotic bodies, exosomes (EXOs) and shed microvesicles (MVs).
EXOs and MVs, which are released from viable cells, are considered
to be primarily involved in the exchange of messages between cells
(6). Additionally, they have a
rounded shape and differ mainly in cell origin and size range. EXOs
size ranges between 30 and 100 nm whereas that of MVs ranges
between 100 and 1,000 nm (10).
EXOs are released following fusion with the plasma membrane of
multivesicular bodies (MVB), which belong to the endosomal
compartment and form through a process of inward budding that gives
origin to intraluminal vesicles (ILVs); once the ILVs are released
from MVB into extracellular milieu they are called EXOs (7,8). The
origin of MVs is completely different since they are formed through
the outward budding of plasma membrane (2,7,8).
Exosomes have been mainly studied for their
involvement in immune system functions but also for their role in
cancer progression (4,7,9). In
the same manner, MVs have been widely studied in several normal
cell types, including platelets, fibroblasts, neuronal, epithelial,
endothelial and red blood cells (10–13),
and even more widely analyzed in cancer cells (6,14–18)
for their role in tumor progression, evasion from apoptosis, drug
resistance, immune-escape, and angiogenesis (2,3,19).
The non-accidental production of EVs, in
pathological and physiological events, is emphasized by the fact
that they are not merely miniature parental cells, showing both
similarities and differences compared to the molecular composition
of the cells of origin (6,20).
Due to their role in pathological processes, EVs
have been widely studied in the past few years (21–24).
Moreover, there is an increasing expectation in their potential use
as clinical targets and as diagnostic and prognostic biomarkers
since vesicles occur in bloodstream and other biological fluids
(e.g., urine, semen, amniotic fluid, saliva, synovial and
bronchoal-veolar fluid, breast milk, spinal fluid, ascites,
malignant and pleural effusion), particularly the ones that are
exposed to primary tumors (2,19,25–28).
Since in EXOs the upper limit of size overlaps with
the MVs lower limit (being 100 nm for both) and molecular features
are often shared, it is extremely difficult to strictly separate
the two subpopulations with the currently available techniques.
This explains the reason for most studies analyzing mixed
populations or at best, populations specifically enriched with one
component, but contaminated with another one (2).
Even if methods and techniques to identify and
isolate the specific EVs subpopulations evolve continuously, this
goal has not yet been fully achieved.
Information pertaining to the biology of EVs,
including mechanisms involved in their release, may be useful to
gain a better understanding of the phenomenon and pave the way for
the identification of isolation strategies and standardization of
protocols, allowing a more adequate analysis and correct
inter-laboratory comparison.
Materials and methods
Cell culture
CABA I cells were used in all the experiments. The
CABA I cell line was established from the ascitic fluid of an
ovarian carcinoma patient not undergoing drug treatment (29).
The cells were grown as monolayers in RPMI-1640
containing 5% (v/v) heat-inactivated fetal bovine serum (FBS), 1X
penicillin/streptomycin and 2 mM L-glutamine (all purchased from
EuroClone SpA, Milan, Italy). The cells were maintained at 37°C in
a humidified atmosphere with 5% CO2. All the experiments
were carried out when the cells were sub-confluent and
mycoplasma-negative.
Isolation of EVs from conditioned
medium
CABA I cells were starved in serum-free medium for
24 h. The cells were subsequently stimulated with 5% of 40
nm-filtered FBS HyClone (Thermo Scientific, Rockford, IL, USA) in
RPMI-1640 and conditioned medium was collected after the specified
time interval for each experiment (30 min and 4, 8 and 18 h). For
every time-point the same number of cells was seeded at the
beginning of experiments.
To isolate EVs, the conditioned medium obtained as
above was centrifuged at 600 x g for 15 min and then at 1,500 x g
for 30 min to remove cells and large debris, respectively.
Supernatants were centrifuged at 100,000 x g for 2 h
at 4°C in a Beckmann ultracentrifuge. Isolated vesicles were
resuspended in Dulbecco's phosphate-buffered saline (EuroClone,
Milan, Italy). Double determination of vesicle quantification was
carried out by measuring the vesicle-associated protein levels
using the Bradford method (Bio-Rad, Milan, Italy) with bovine serum
albumin (Sigma-Aldrich, St. Louis, MO, USA) as the standard.
Electron microscopy
Scanning electron microscopy (SEM) was carried out
on subconfluent cells grown on coverslips and fixed with 2%
glutaraldehyde (Electron Microscopy Sciences, Hatfield, PA, USA) in
phosphate-buffered saline (PBS) for 30 min. After being critical
point-dried, the samples were glued onto stubs, coated with gold in
a SCD040 Balzer Sputterer, and detected via a Philips 505 SEM at 20
kV.
Transmission electron microscopy (TEM) was performed
on isolated vesicles, resuspended in PBS, to analyze their
ultrastructural morphology. According to the proper dilutions, the
samples were adsorbed onto 300 mesh carbon-coated copper grids
(Electron Microscopy Sciences) for 5 min in a humidified chamber at
room temperature. Vesicles on grids were then fixed in 2%
glutaraldehyde (Electron Microscopy Sciences) in PBS for 10 min and
then briefly rinsed in Milli-Q water. Grids with adhered vesicles
were examined with a Philips CM 100 transmission electron
microscope operating at 80 kV, after negative staining with 2%
phosphotungstic acid, brought to pH 7.0 with NaOH. Images were
captured with a Kodak digital camera.
NanoSight
The number and dimension of EVs were assessed by the
nanoparticle tracking analysis (NTA). Using a NanoSight LM10-HS
system (NanoSight Ltd., Amesbury, UK), EVs were visualized by laser
light scattering. Briefly, EV-enriched pellets were resuspended in
300 µl of 0.1 µm triple-filtered sterile PBS and five
recordings of 30 sec were performed for each sample. EVs pellets
were derived from an equal volume of conditioned medium, that was
collected from cells originally seeded in the same number.
Collected data were analyzed with NTA software,
which provided high-resolution particle size distribution profiles
and concentration measurements of the vesicles in solution.
Western blot analysis
Vesicles (8 µg for CD63, 40 µg for HLA
and Ago-2) were resolved by 10% sodium dodecyl
sulfate-polyacrylamide gel electrophoresis (SDS-PAGE) under
non-reducing conditions without heating and transferred to
nitrocellulose membranes (Whatman-GE Healthcare Life Sciences, UK).
Non-specific binding sites were blocked for 1 h in 10% non-fat dry
milk in TBS containing 0.5% Tween-20 (TBS-T) at room temperature.
The blots were then incubated at 4°C overnight with primary
antibodies against CD63 (mouse monoclonal, 1:500 dilution;
sc-59286), against the W6/32 antigenic determinant of HLA (mouse
monoclonal, 1:500 dilution; sc-32235) (both from Santa Cruz
Biotechnology, Inc., Santa Cruz, CA, USA) and against Ago-2 (mouse
monoclonal, 1:200 dilution; 011-22033, Wako, Japan). Normalization
was carried out using the GAPDH antibody (mouse monoclonal, 1:5,000
dilution; MA5-11114, Thermo Scientific, Rockford, IL, USA).
After several washes in TBS-T, the membranes were
incubated in a peroxidase-conjugated secondary antibody (goat
anti-mouse IgG-HRP, 1:10,000 dilution; sc-2005; Santa Cruz
Biotechnology, Inc.) for 1 h. All the antibodies were diluted in
blocking buffer (TBS-T containing 1% non-fat dry milk).
After washing in TBS-T, the reactive bands were
visualized with a chemiluminescence detection kit (SuperSignal West
Pico Chemiluminescent Substrate; Thermo Scientific) and images were
recorded with the gel documentation system Alliance LD2 (UVItec,
Cambridge, UK).
The optical density of the target bands was
determined using the Alliance LD2 gel documentation system or the
ImageJ public domain software.
Zymography assays
Gelatin zymography was performed using SDS-PAGE
(7.5%) copolymerized with 2 mg/ml gelatin type B (Sigma-Aldrich).
Vesicles (10 µg) were diluted in SDS-PAGE sample buffer
under non-reducing conditions without heating. After
electrophoresis, the gels were washed three times, 15 min each,
with 50 mM Tris-HCl (pH 7.4) containing 2.5% Triton X-100
(Sigma-Aldrich) under agitation at room temperature and then
incubated overnight in collagenase buffer [50 mM Tris-HCl (pH 7.4)
containing 120 mM NaCl, 5 mM CaCl2] at 37°C. The gels
were stained with 0.25% Coomassie Brilliant Blue R-250 (Bio-Rad) in
a mixture of methanol-acetic acid-water (4:1:5) for 30 min and were
destained in the same solution without dye. The gelatinase
activities were visualized as distinct white bands on a blue
background, indicating proteolysis of the substrate.
Casein-plasminogen zymography was performed on
vesicles (8 µg) diluted in SDS-PAGE sample buffer under
non-reducing conditions without heating, using SDS-PAGE (10%) gels
copolymerized with 0.2% casein plus 10 µg/ml plasminogen
(both from Sigma-Aldrich). After electrophoresis, the gels were
washed twice for 30 min in Tris 50 mM pH 7.4 + Triton X 2.5% at
room temperature and incubated overnight in the same buffer without
Triton X at 37°C. Gel staining and destaining was performed as for
the gelatin zymography.
Statistical analysis
Data shown are from at least three independent
experiments and are presented as mean ± SD. Statistical
significance was determined using the Student's t-test.
Calculations were performed using GraphPad Prism 4 software
(GraphPad, San Diego, CA, USA). Statistical significance was set at
P<0.05.
Results
Time-dependent release of EV
subpopulations
In the preliminary experiments the EVs release from
starved cells after FBS stimulation was evaluated by means of SEM
and TEM.
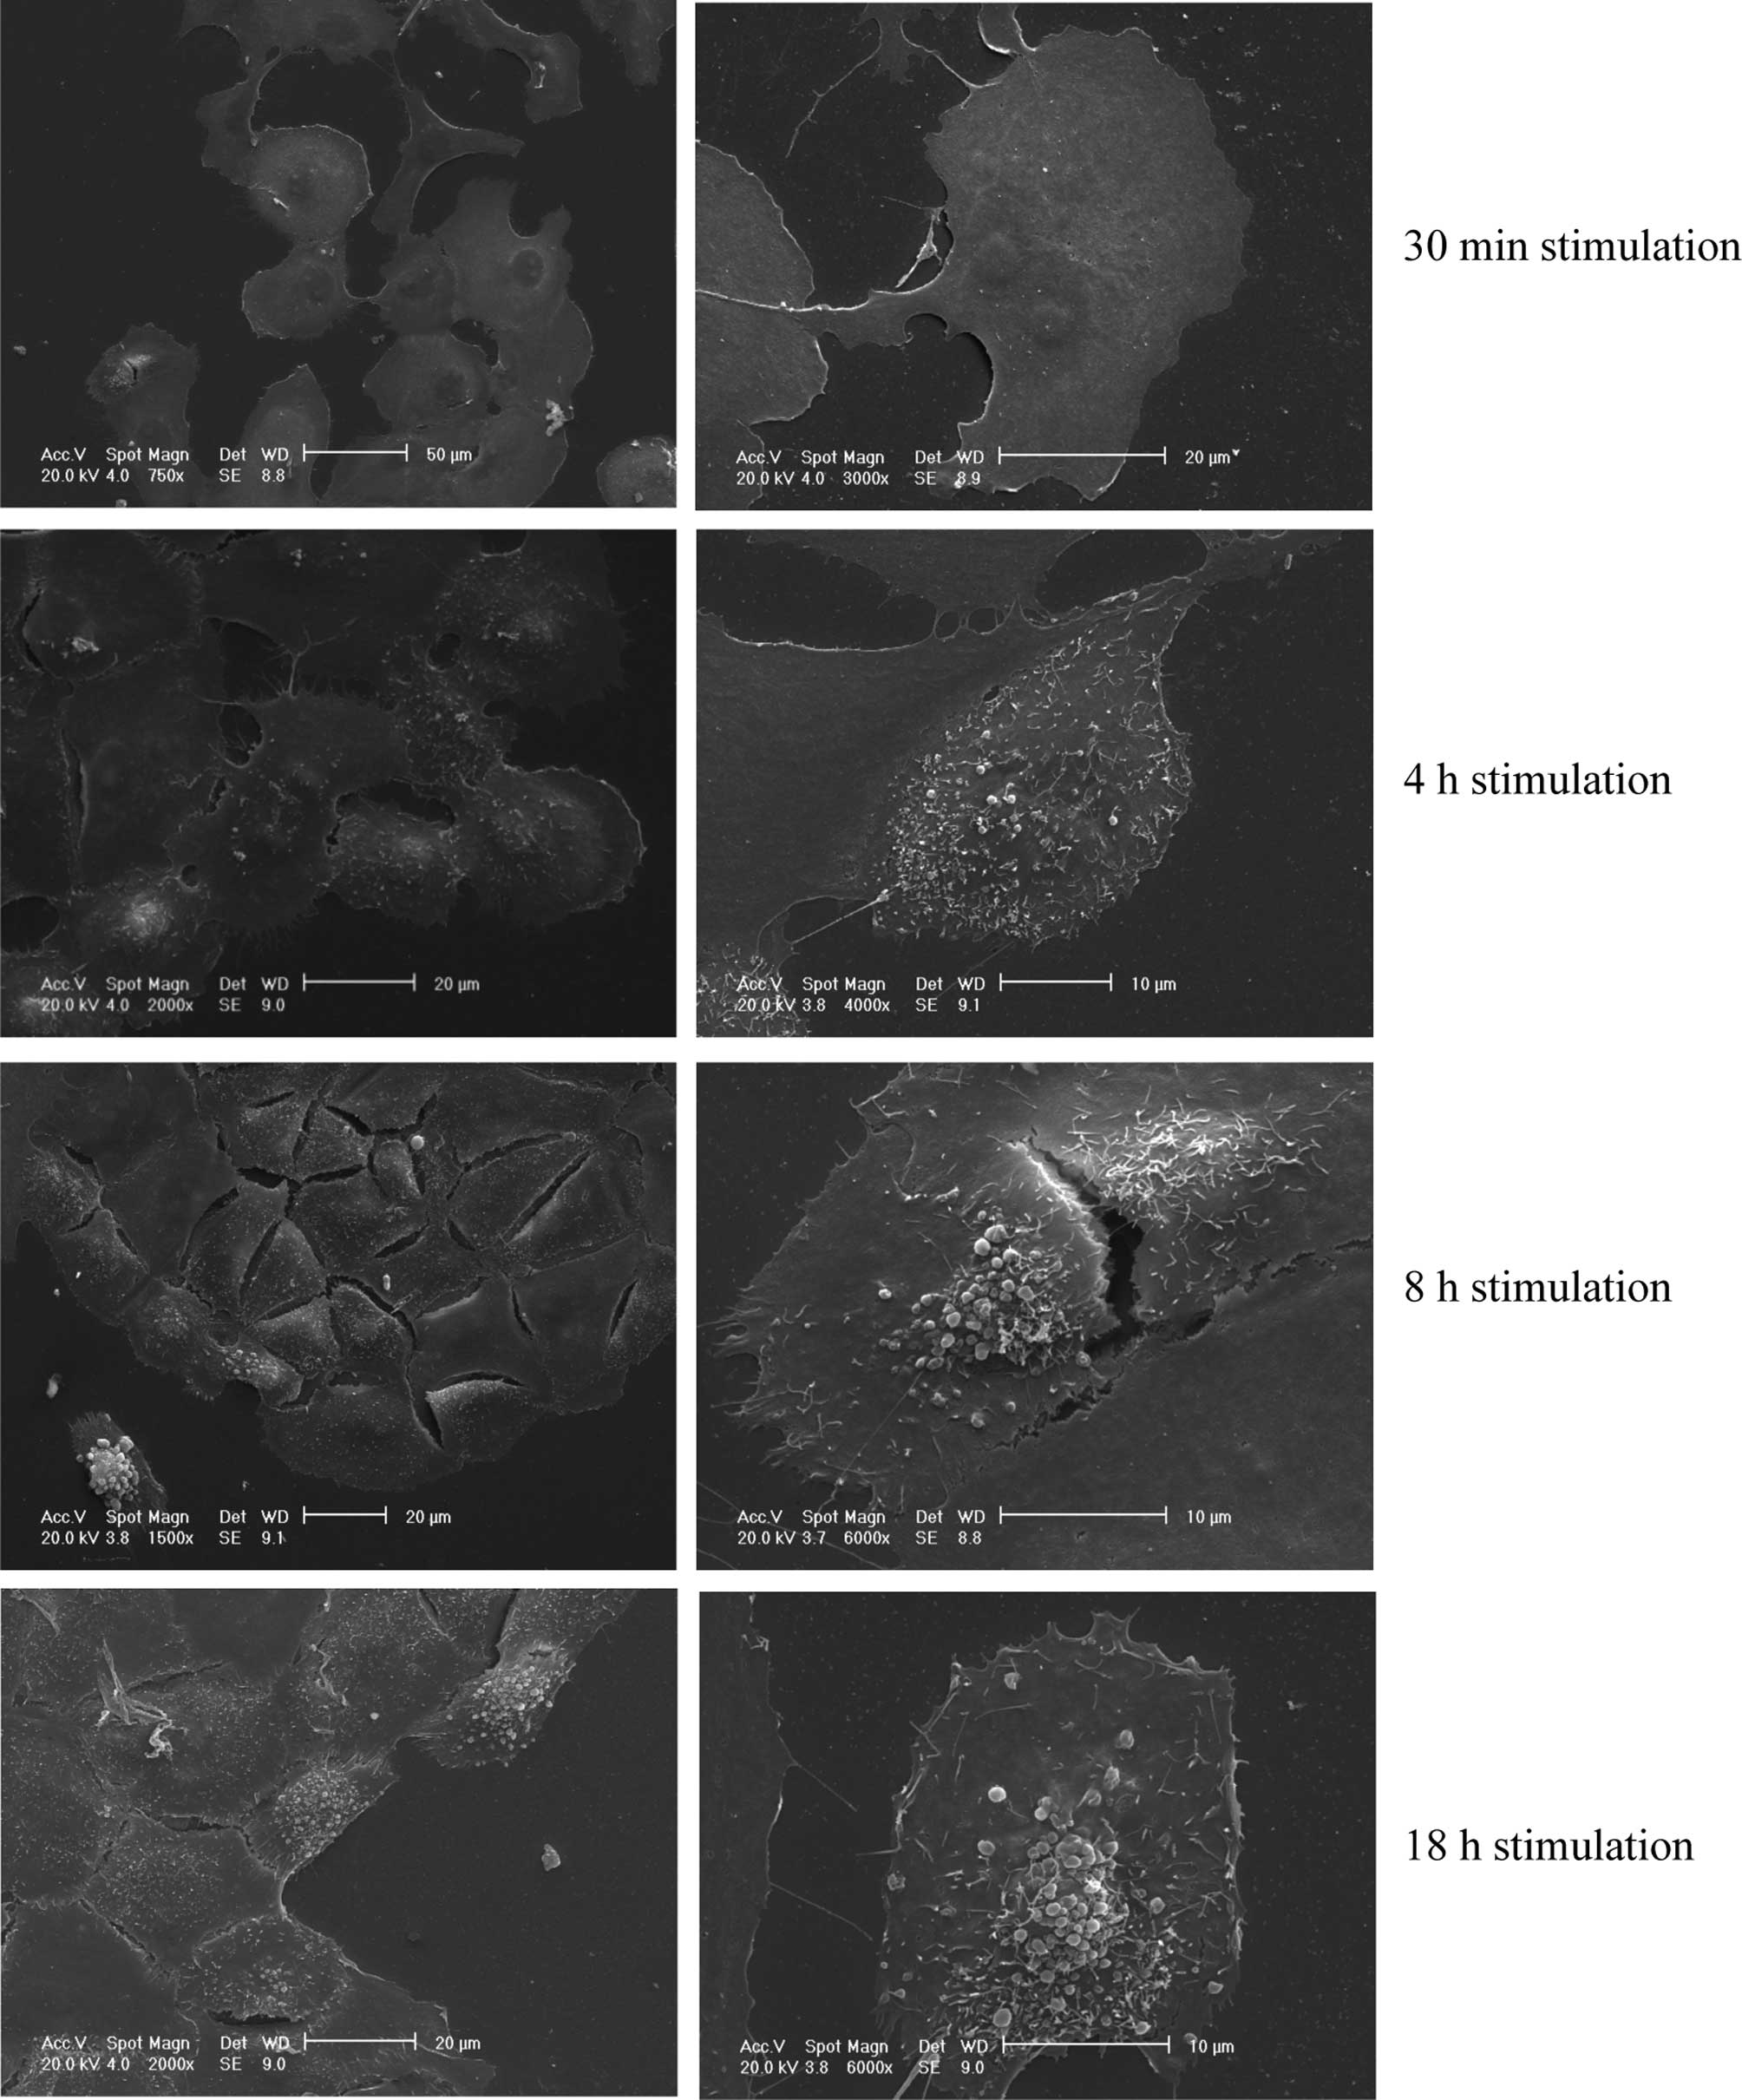
The SEM assay revealed a time-dependent release of
EVs from the cell surface (Fig. 1).
After 30 min, the cell surface completely lacked any membrane
movement and vesicle budding, whereas after 4 h membrane movements
were evident and vesicle release commenced. The latter phenomenon
was particularly evident after 8 h, and even more, after 18 h. The
excretion of EVs involved mainly the central portion of the cell
body.
TEM analysis of EVs isolated at different time
intervals after cell stimulation confirmed their release in the
conditioned medium (Fig. 2A–D) and
showed that after 30 min mainly small EVs were released (mean size,
<100 nm), while the release of larger EVs (mean size, >100
nm) occurred later (Fig. 2E).
Moreover, the amount of smaller EVs decreased as the stimulation
time increased, whereas the opposite occurred for the larger EVs,
whose presence was recorded after 4 h and whose amount increased
proportionally to the stimulation time (Fig. 2E).
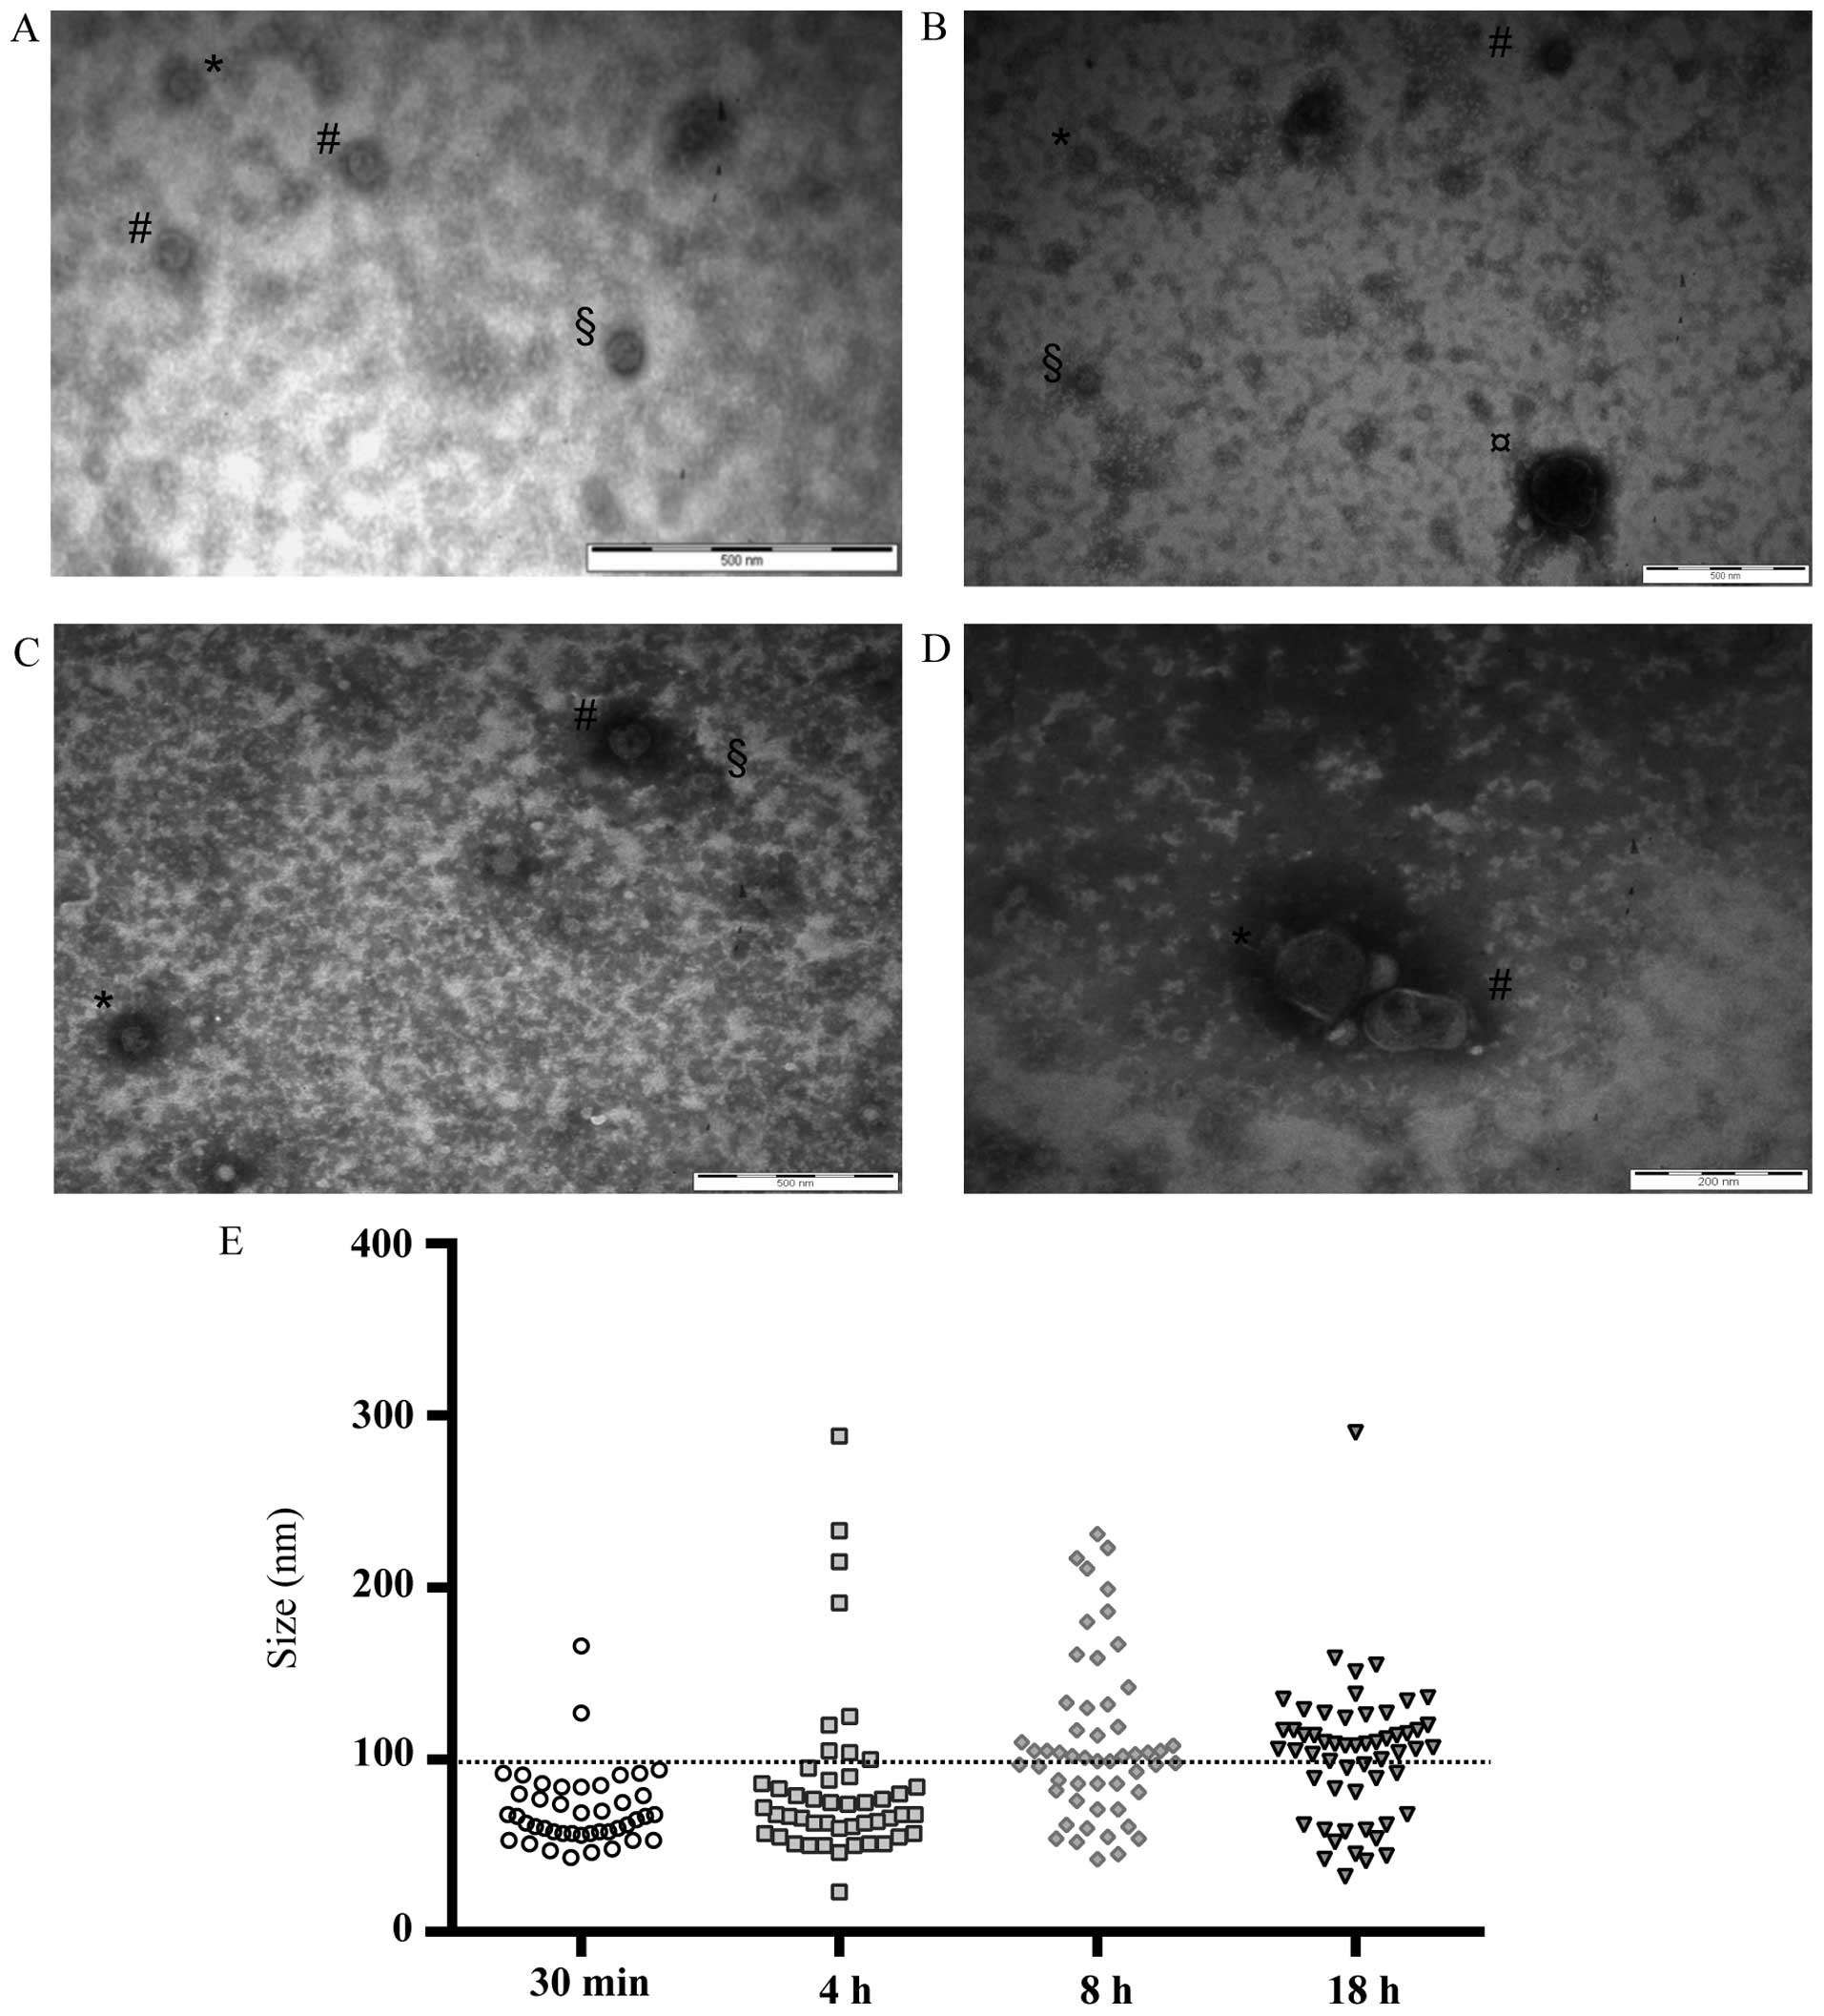 | Figure 2TEM analysis. Transmission electron
microscopy images of vesicles isolated from conditioned medium of
CABA I cells. (A) Post-FBS stimulation (30 min). Bar, 500 nm (EVs
size: *, 43 nm; #, 51 nm; §, 63
nm). (B) Post-FBS stimulation (4 h). Bar, 500 nm (EVs size:
#, 75 nm; *, 66 nm; §, 51 nm;
¤, 233 nm). (C) Post FBS stimulation (8 h). Bar, 500 nm
(EVs size: #, 104 nm; *, 81 nm; §,
52 nm). (D) Post-FBS stimulation (18 h). Bar, 200 nm (EVs size:
#, 126 nm; *, 114 nm). (E) Graph shows the
size of EVs analyzed from 19-20-19-34 transmission electron
microscopy images (for 30 min, 4, 8 and 18 h, respectively): each
EV observed on the grids corresponds to one dot. The horizontal bar
is the size limit (100 nm) that usually distinguishes exosomes and
microvesicle subpopulations. TEM, transmission electron microscopy;
EVs, extracellular vesicles. |
In the subsequent experiments only the shorter and
longer stimulation time were taken into account. EVs released in
medium after 30 min and 18 h from starved cells after FBS
stimulation were isolated and their number and size distribution
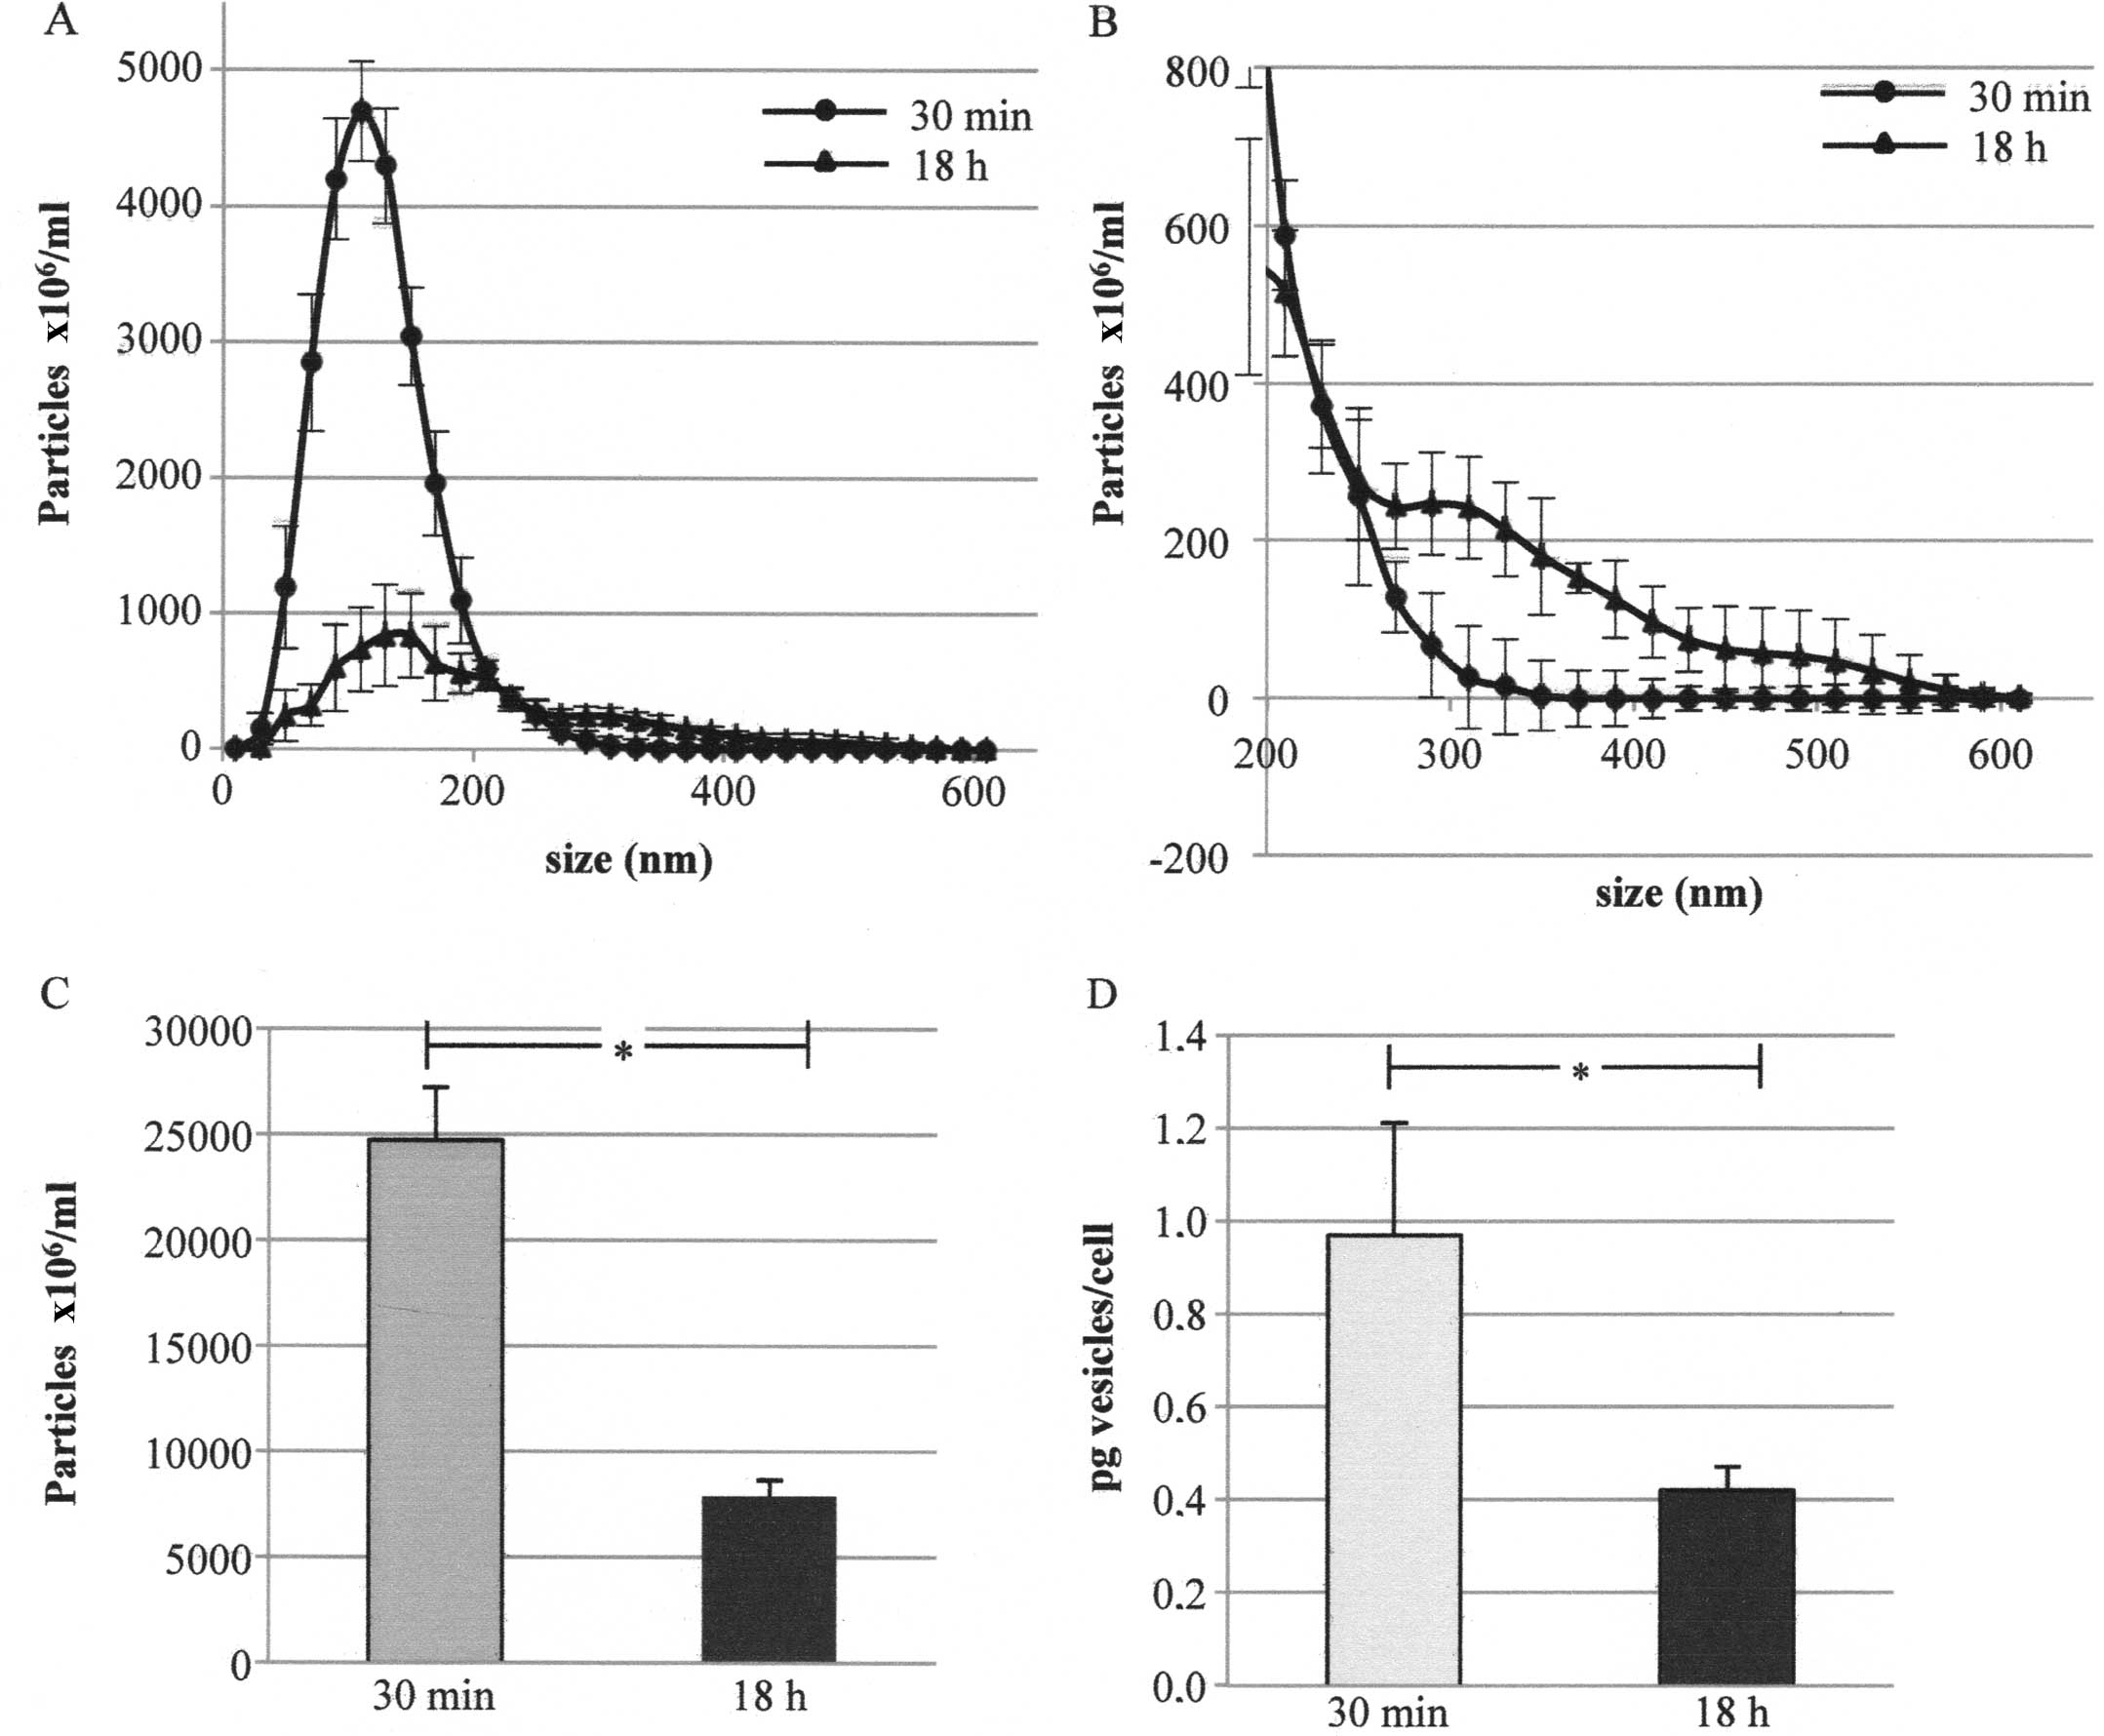
were analyzed by means of NanoSight. Fig. 3A shows the number of particles in
the conditioned media after deduction of the contribution of
particles from non-conditioned ones. Fig. 3B also shows the same graph reporting
only a size of >200 nm. After 30 min the cells released mainly
particles whose mean size was ~100 nm (peak mean in five replicates
at 100–127 nm) whereas after 18 h an additional peak at higher
dimensions was evident (lower and higher peak mean in five
replicates at 126–135 and 371–456 nm, respectively) (Fig. 3A and B).
The NanoSight assay also showed that the number of
particles (i.e., of EVs) was higher in the medium conditioned for
30 min than that in the medium conditioned for 18 h
(24,712×06/ml and 7,857×06/ml particles,
respectively) (Fig. 3C). A further
quantification performed by the analysis of EVs protein content
confirmed the previous data: the amount of EVs was higher in the
medium conditioned for 30 min than that in the medium conditioned
for 18 h (0.97 and 0.42 pg/cell, respectively) (Fig. 3D).
Molecular characterization
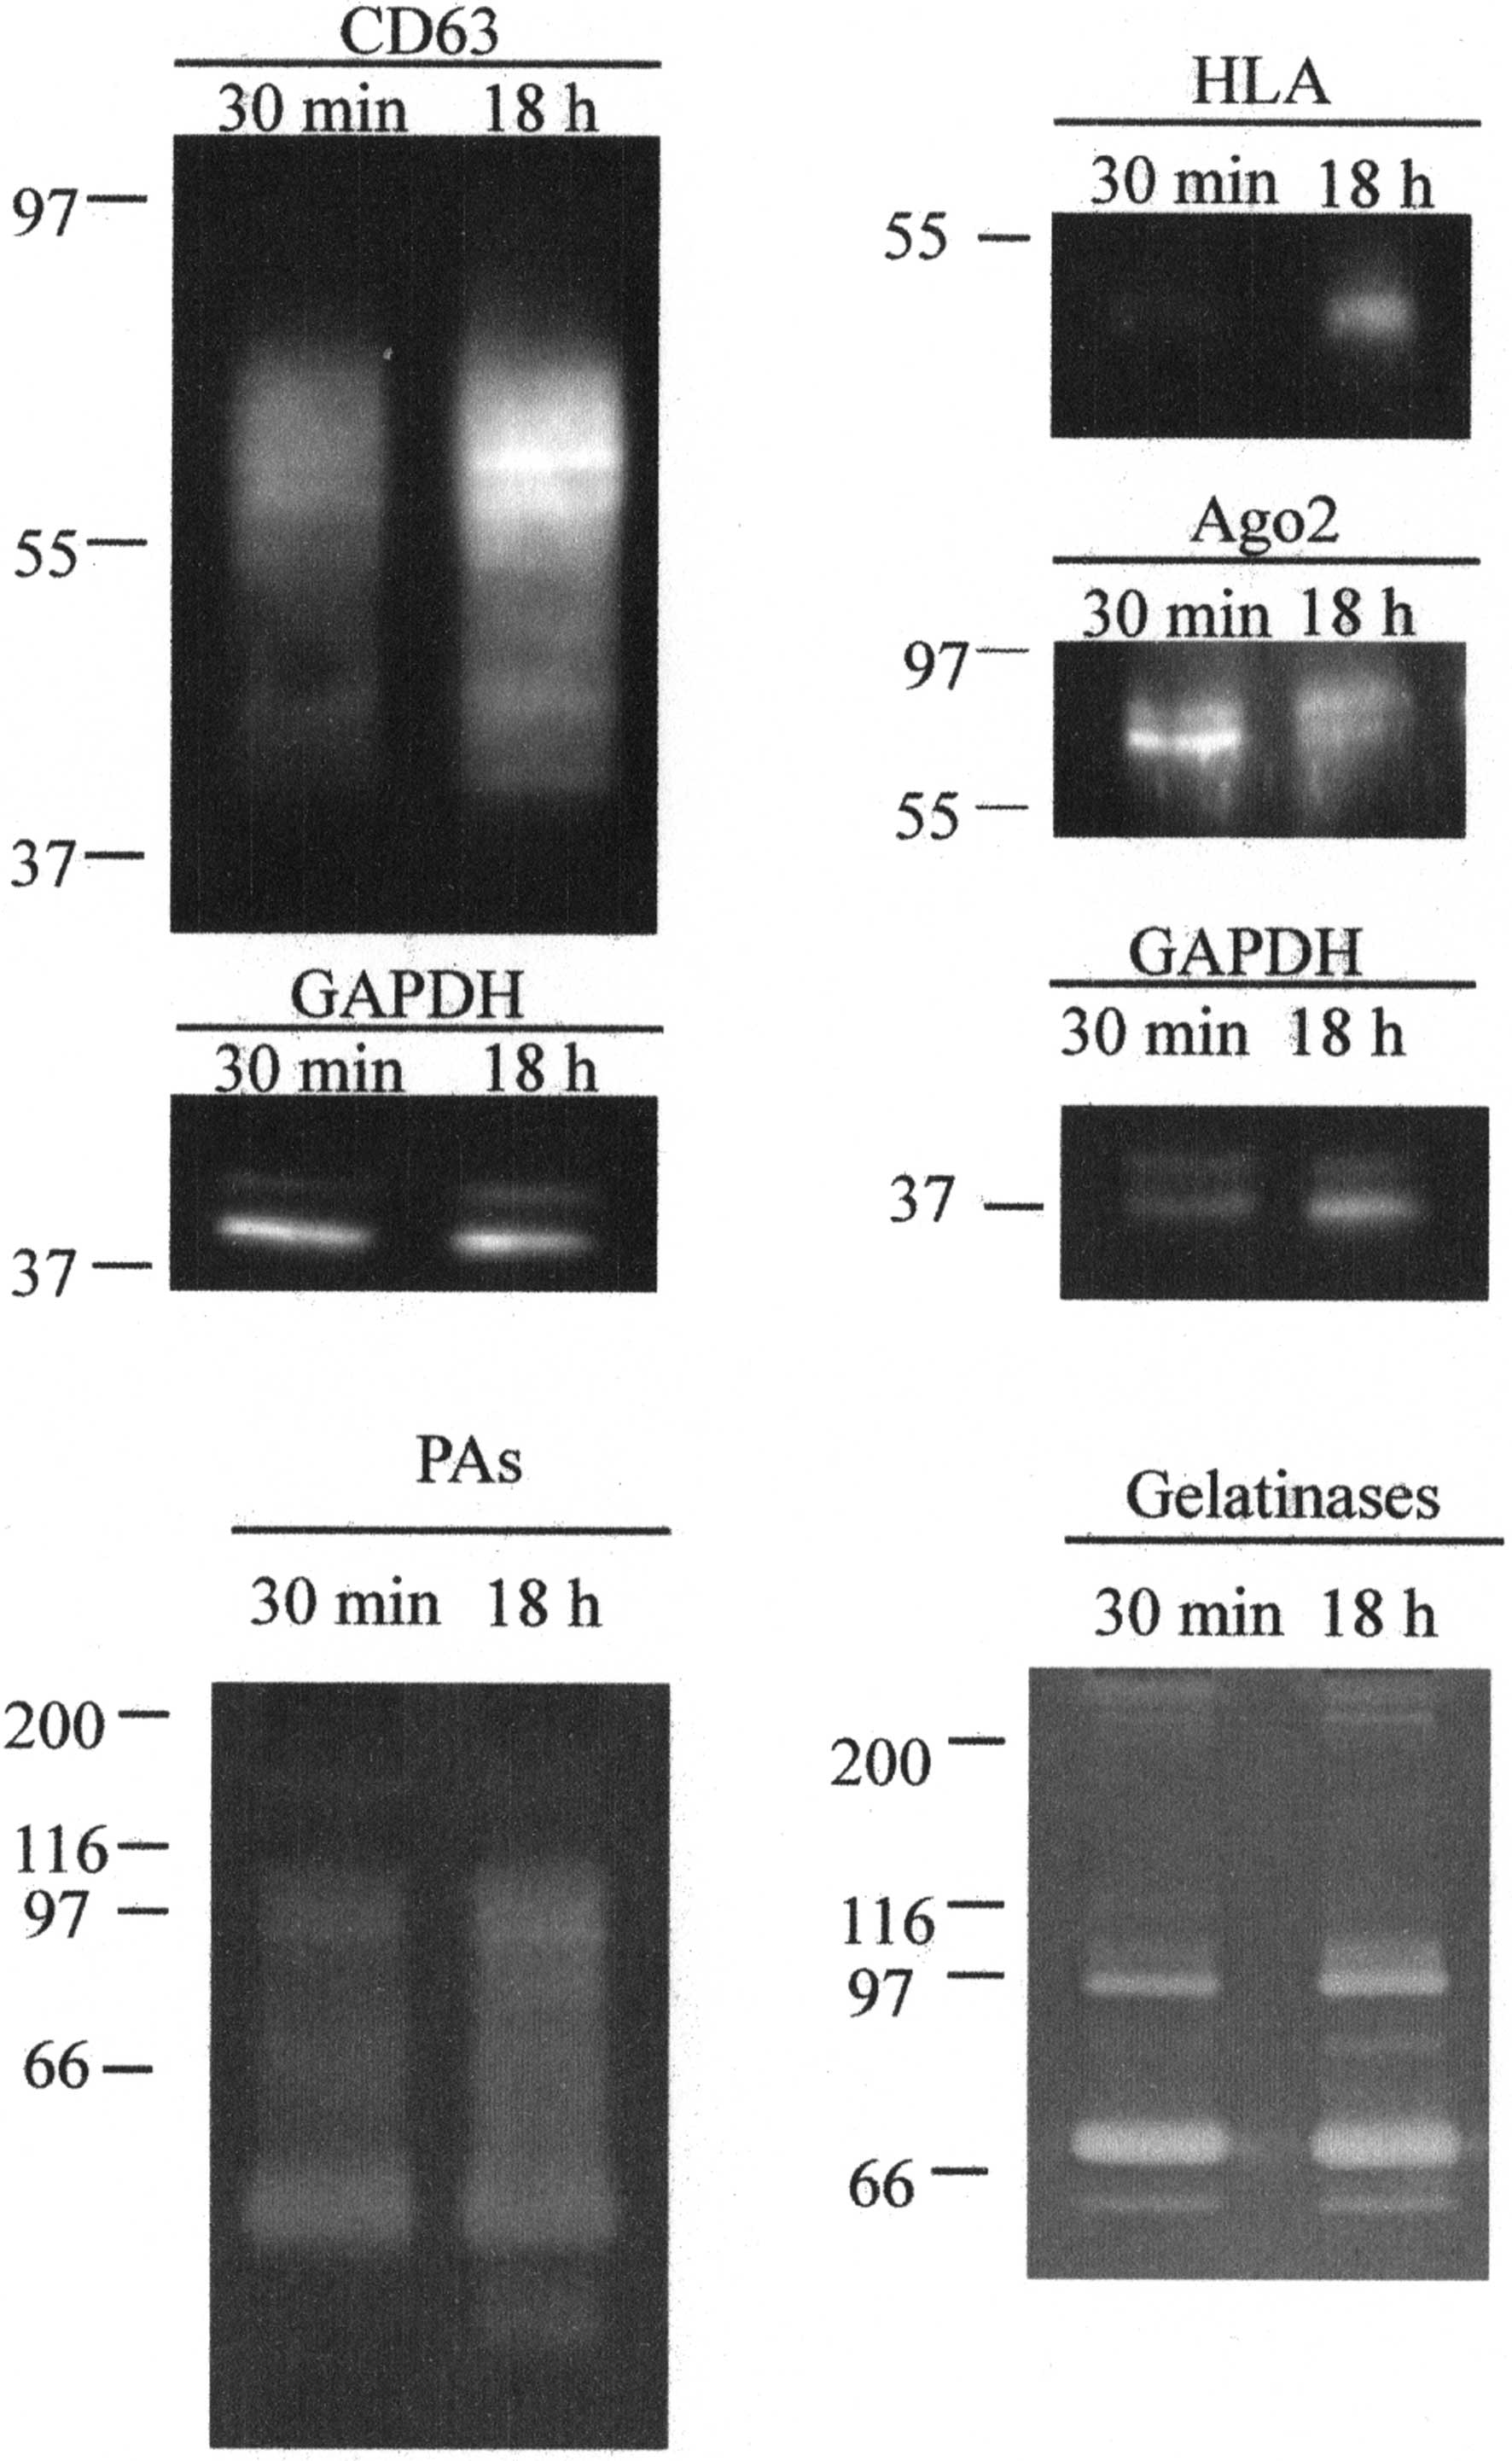
CD63, HLA and Ago-2 expression was assessed using
western blotting. The presence of gelatinases and plasminogen
activators was also assessed by zymography techniques (Fig. 4).
The anti-CD63 antibody revealed a protein with a
size ranging 39–77 kDa, suggesting that the CD63 contained in
vesicles was in a glycosylated form. In EVs released after 18 h
stimulation the amount of protein was ~2-fold higher (1.92 ± 0.12)
than that in EVs released after 30 min.
The anti-HLA antibody revealed a protein with a size
of 50 kDa. In EVs released after 18 h stimulation the amount of
protein was ~3-fold higher (2.84 ± 0.28) than that in EVs released
after 30 min.
Anti-Ago2 revealed a protein with a size of 78–93
kDa that was slightly more expressed in EVs released after 30 min
(expression ~1.2 higher in 30 min, 1.25±0.13).
Gelatin zymography allowed for the identification of
the gelatinases MMP-2 and -9 both in the pro-enzyme and active form
in the two EVs samples (calculated molecular weights: proMMP-9, 97
kDa; MMP-9, 84 kDa; proMMP-2, 72 kDa; and MMP-2, 64 kDa). MMPs
complexes and/or dimers were also present at a high molecular
weight. The amount of enzymes was substantially equal in the two
samples, with the exception of a slight increase of proMMP-9 and
MMP-9 in the EVs released after 18 h stimulation.
Casein-plasminogen zymography showed the presence of
plasminogen activators in EVs. The assay emphasized that PA-PAI
complexes (84–102 kDa), tissue type-PA (67 kDa) and urokinase
type-PA (both uPA precursor, 55 kDa; and active uPA, 33 kDa-forms)
were associated with EVs. Additionally, the amount of enzymes was
substantially equal in the two samples, with the exception of the
LMW-uPA, which was only present in EVs released after 18 h
stimulation.
Discussion
At present, an ongoing challenge in the study of EVs
is to identify and standardize a method that enables a careful
separation of EVs subpopulations released by cells in conditioned
medium (in vitro) and in biological fluids (in vivo)
(1). In fact, even if EXOs and MVs
clearly differ in their size ranges and cell origin, their specific
features as well as specific functions are not completely clear
since the available isolation techniques are not able to separate
the subpopulations in a precise manner (1). This is probably due to the size
overlap of subpopulations and the lack of specific markers. Two
main strategies are used for the separation of EVs subpopulations,
based on their physical properties or biochemical features that,
however, seem insufficient for a clear separation (1).
In the former approach, size and density are used as
reference parameters and this strategy involves the use of serial
centrifugations and flotation in sucrose gradients (4).
These methods, being based on physical
characteristics, have the advantage of not requiring previous
knowledge of chemical signatures of EVs and the disadvantage of not
allowing the complete discrimination between EXOs and MVs (since
the size distribution of MVs overlaps with that of EXOs at its
lower limit, thus it is possible that these conditions pellet mixed
vesicle populations). For this reason, it may be useful to combine
differential centrifugation with sucrose gradient
ultracentrifugation to isolate EXOs subpopulation or to proceed by
immunoisolation which requires, however, a preliminary knowledge of
the EVs marker profiles (1). In the
latter approach, magnetophoretic sorting or immunoaffinity
chromatography are used (4).
However, no 'optimal' method has been identified thus far (30).
With regard to EVs quantification cytometry is the
most widely used method as it uses size and affinity measurements
through conjugation with specific fluorescent antibodies. However,
that vesicles <200 nm cannot be distinguished from instrumental
noise must be taken into account. Thus, EXOs and smaller MVs cannot
be detected using this technique (8,31).
However, a fluorescence-based, high-resolution flow cytometric
method has been previously developed for quantitative and
qualitative analysis of nanosized membrane vesicles (32). A novel strategy based on the
differential light scattering of different size particles solved in
a fluid medium (NanoSight) has also been previously employed to
count and evaluate the size distribution of nanoparticles (4).
A clear separation of the two subpopulations may
allow us to understand specific features of each subgroup. In order
to obtain this aim, a deeper knowledge of mechanisms involved in
EVs release may be useful to understand their biology, an absolute
requisite to decode their specific role in both physiological and
pathological conditions. Additionally, standardization of
procedures is required to allow a proper comparison of data
obtained from different laboratories, as previously established
(30).
Thus we examined whether different EV subpopulations
were released in a time-dependent manner using CABA I cells that
were first starved in order to synchronize cells and to block EVs
release. FBS deprivation is known to inhibit MVs shedding (33) and we confirmed that it also inhibits
EXOs release, as identified by the fact that no EVs were recovered
from the conditioned medium of starved CABA I (data not shown).
After starvation, the cells were stimulated with FBS
and conditioned medium was collected after different time
intervals. The shorter one was set at 30 min since it is known that
90% of EXOs are externalized within a short time period from
stimulation (34). The subsequent
intervals were set at 4, 8 and 18 h. The result from the SEM assay
suggested that EVs release is a gradual process that increases over
time as shown by the fact that no vesicles or membrane movement
were visible after 30 min although their presence increased over
time and reached the maximum after 18 h. The TEM analysis of
isolated vesicles revealed that in 30 min the population of EVs was
represented almost exclusively by EVs <100 nm (most likely EXOs)
while the presence of larger EVs (most likely MVs) was very
sporadic. The number of MVs increased over time, with a low number
of MVs after 4 and 8 h and a larger quantity after 18 h. At the
latter time, however, EXOs were evident although more infrequently
when compared to 30 min. Thus, when the cells were stimulated EXOs
were rapidly externalized, as they were already stored inside the
cell in multivesicular bodies, while the cell membrane movements
leading to MVs release required a longer time period.
Thus, we focused on EVs released after 30 min and 18
h after stimulation, corresponding to the population with the
higher amount of EXOs and the population with a higher amount of
MVs combined with the lower EXOs contribution, respectively.
This finding was further evidenced with the
NanoSight assay, suggesting the presence of mainly EXOs in the
medium conditioned for 30 min and the subpopulations of EXOs and
MVs in the medium conditioned for 18 h, although in the latter the
amount of smaller EVs was lower (as underlined by the minor peak
height). It is known that NanoSight is unable to distinguish EVs
from non-membranous particles of similar size (30). Thus, non-conditioned media were
treated simultaneously with and in exactly the same manner as
conditioned media and were used as a blank. Moreover, EVs were
resuspended in 0.1 µm triple-filtered PBS to remove any
possible interfering elements, PBS was used as the blank.
NanoSight and the quantification performed by
analysis of EVs protein content suggested that the amount of total
EVs was higher after 30 min than after 18 h. We cannot explain the
reason for the amount of EVs decreasing over time, but we
hypothesize that some of them break or fuse with target cells.
We assessed the presence of several proteins in our
preparations to determine whether any molecules were differentially
expressed. For a generic characterization of EVs, the International
Society for Extracellular Vesicles (ISEV) suggests the
investigation of several proteins from various categories including
extracellular, intracellular, transmembrane and cytosolic (30). We therefore analyzed two
transmembranes (CD63 and HLA), one intracellular (Ago-2) and two
extracellular (gelatinases and plasminogen activators) proteins.
CD63, particularly, was long considered a specific EXOs marker, but
not more nowadays (35–37). CD63 and HLA expression is more
evident in EVs obtained after 18 h of stimulation as compared to
Ago-2, which seems to be slightly more expressed in EVs obtained
after 30 min. By contrast, gelatinases and plasminogen activators
activity of EVs was similar in the two samples, even if after 18 h
the active form of MMP-9 and uPA was markedly expressed. It should
be noted, moreover, that CD63 is contained in vesicles in a
glycosylated form. It is known that glycosylation levels of CD63
strongly influence its cell surface expression and it has been
shown that the glycosylation-mediated localization of CD63 is
associated with several features of cancer progression, such as
drug resistance and invasiveness (38).
Results of the present study suggest that different
times lead to release of different subpopulations of EVs, in terms
of size, amount and molecular composition. Additionally, the
stimulation time should be considered an important factor when
searching among parameters that are useful in the standardization
of procedures for EVs isolation and analysis. Thus, the time
between the stimulation of cells and collection of conditioned
media in vitro, and to some extent in vivo, affects
the heterogeneity and variability of the results. It is therefore
imperative to consider and select the appropriate time point to
collect samples following any treatment in clinical studies.
References
|
1
|
Raposo G and Stoorvogel W: Extracellular
vesicles: exosomes, microvesicles, and friends. J Cell Biol.
200:373–383. 2013. View Article : Google Scholar : PubMed/NCBI
|
|
2
|
Ohno S, Ishikawa A and Kuroda M: Roles of
exosomes and microvesicles in disease pathogenesis. Adv Drug Deliv
Rev. 65:398–401. 2013. View Article : Google Scholar
|
|
3
|
Turturici G, Tinnirello R, Sconzo G and
Geraci F: Extracellular membrane vesicles as a mechanism of
cell-to-cell communication: advantages and disadvantages. Am J
Physiol Cell Physiol. 306:C621–C633. 2014. View Article : Google Scholar : PubMed/NCBI
|
|
4
|
D'Souza-Schorey C and Clancy JW:
Tumor-derived microvesicles: shedding light on novel
microenvironment modulators and prospective cancer biomarkers.
Genes Dev. 26:1287–1299. 2012. View Article : Google Scholar : PubMed/NCBI
|
|
5
|
Enjeti AK, Lincz LF and Seldon M:
Microparticles in health and disease. Semin Thromb Hemost.
34:683–691. 2008. View Article : Google Scholar : PubMed/NCBI
|
|
6
|
Rak J: Microparticles in cancer. Semin
Thromb Hemost. 36:888–906. 2010. View Article : Google Scholar : PubMed/NCBI
|
|
7
|
Mathivanan S, Ji H and Simpson RJ:
Exosomes: extracellular organelles important in intercellular
communication. J Proteomics. 73:1907–1920. 2010. View Article : Google Scholar : PubMed/NCBI
|
|
8
|
György B, Módos K, Pállinger E, Pálóczi K,
Pásztói M, Misják P, Deli MA, Sipos A, Szalai A, Voszka I, et al:
Detection and isolation of cell-derived microparticles are
compromised by protein complexes due to shared biophysical
parameters. Blood. 117:e39–48. 2011. View Article : Google Scholar
|
|
9
|
Bobrie A, Colombo M, Raposo G and Thery C:
Exosome secretion: molecular mechanisms and roles in immune
responses. Traffic. 12:1659–1668. 2009. View Article : Google Scholar
|
|
10
|
Taraboletti G, D'Ascenzo S, Borsotti P,
Giavazzi R, Pavan A and Dolo V: Shedding of the matrix
metalloproteinases MMP-2, MMP-9, and MT1-MMP as membrane
vesicle-associated components by endothelial cells. Am J Pathol.
160:673–680. 2002. View Article : Google Scholar : PubMed/NCBI
|
|
11
|
Van Niel G, Raposo G, Candalh C, Boussac
M, Hershberg R, Cerf-Bensussan N and Heyman M: Intestinal
epithelial cells secrete exosome-like vesicles. Gastroenterology.
121:337–349. 2001. View Article : Google Scholar : PubMed/NCBI
|
|
12
|
Krämer-Albers EM, Bretz N, Tenzer S,
Winterstein C, Möbius W, Berger H, Nave KA, Schild H and Trotter J:
Oligodendrocytes secrete exosomes containing major myelin and
stress-protective proteins: trophic support for axons? Proteomics
Clin Appl. 1:1446–1461. 2007. View Article : Google Scholar : PubMed/NCBI
|
|
13
|
Fauré J, Lachenal G, Court M, Hirrlinger
J, Chatellard-Causse C, Blot B, Grange J, Schoehn G, Goldberg Y,
Boyer V, et al: Exosomes are released by cultured cortical
neurones. Mol Cell Neurosci. 31:642–648. 2006. View Article : Google Scholar : PubMed/NCBI
|
|
14
|
Dolo V, D'Ascenzo S, Giusti I, Millimaggi
D, Taraboletti G and Pavan A: Shedding of membrane vesicles by
tumor and endothelial cells. Ital J Anat Embryol. 110:127–133.
2005.PubMed/NCBI
|
|
15
|
Hood JL, San RS and Wickline SA: Exosomes
released by melanoma cells prepare sentinel lymph nodes for tumor
metastasis. Cancer Res. 71:3792–3801. 2011. View Article : Google Scholar : PubMed/NCBI
|
|
16
|
Al-Nedawi K, Meehan B and Rak J:
Microvesicles: Messengers and mediators of tumor progression. Cell
Cycle. 8:2014–2018. 2009. View Article : Google Scholar : PubMed/NCBI
|
|
17
|
Muralidharan-Chari V, Clancy JW, Sedgwick
A and D'Souza-Schorey C: Microvesicles: mediators of extracellular
communication during cancer progression. J Cell Sci. 123:1603–1611.
2010. View Article : Google Scholar : PubMed/NCBI
|
|
18
|
Lee TH, D'Asti E, Magnus N, Al-Nedawi K,
Meehan B and Rak J: Microvesicles as mediators of intercellular
communication in cancer - the emerging science of cellular
'debris'. Semin Immunopathol. 33:455–467. 2011. View Article : Google Scholar : PubMed/NCBI
|
|
19
|
Giusti I, D'Ascenzo S and Dolo V:
Microvesicles as potential ovarian cancer biomarkers. Biomed Res
Int. 2013:7030482013. View Article : Google Scholar : PubMed/NCBI
|
|
20
|
Mause SF and Weber C: Microparticles:
protagonists of a novel communication network for intercellular
information exchange. Circ Res. 107:1047–1057. 2010. View Article : Google Scholar : PubMed/NCBI
|
|
21
|
van der Meel R, Krawczyk-Durka M, van
Solinge WW and Schiffelers RM: Toward routine detection of
extracellular vesicles in clinical samples. Int J Lab Hematol.
36:244–253. 2014. View Article : Google Scholar : PubMed/NCBI
|
|
22
|
Katsuda T, Kosaka N and Ochiya T: The
roles of extracellular vesicles in cancer biology: toward the
development of novel cancer biomarkers. Proteomics. 14:412–425.
2014. View Article : Google Scholar
|
|
23
|
Redzic JS, Ung TH and Graner MW:
Glioblastoma extracellular vesicles: reservoirs of potential
biomarkers. Pharmgenomics Pers Med. 7:65–77. 2014.PubMed/NCBI
|
|
24
|
Perez A, Loizaga A, Arceo R, Lacasa I,
Rabade A, Zorroza K, Mosen-Ansorena D, Gonzalez E, Aransay AM,
Falcon-Perez JM, et al: A pilot study on the potential of
RNA-associated to urinary vesicles as a suitable non-invasive
source for diagnostic purposes in bladder cancer. Cancers (Basel).
6:179–192. 2014. View Article : Google Scholar
|
|
25
|
Hessvik NP, Sandvig K and Llorente A:
Exosomal miRNAs as biomarkers for prostate cancer. Front Genet.
4:362013. View Article : Google Scholar : PubMed/NCBI
|
|
26
|
Duijvesz D, Luider T, Bangma CH and
Jenster G: Exosomes as biomarker treasure chests for prostate
cancer. Eur Urol. 59:823–831. 2011. View Article : Google Scholar : PubMed/NCBI
|
|
27
|
Rabinowits G, Gerçel-Taylor C, Day JM,
Taylor DD and Kloecker GH: Exosomal microRNA: a diagnostic marker
for lung cancer. Clin Lung Cancer. 10:42–46. 2009. View Article : Google Scholar : PubMed/NCBI
|
|
28
|
Tavoosidana G, Ronquist G, Darmanis S, Yan
J, Carlsson L, Wu D, Conze T, Ek P, Semjonow A, Eltze E, et al:
Multiple recognition assay reveals prostasomes as promising plasma
biomarkers for prostate cancer. Proc Natl Acad Sci USA.
108:8809–8814. 2011. View Article : Google Scholar : PubMed/NCBI
|
|
29
|
Dolo V, Ginestra A, Violini S, Miotti S,
Festuccia C, Miceli D, Migliavacca M, Rinaudo C, Romano FM,
Brisdelli F, et al: Ultrastructural and phenotypic characterization
of CABA I, a new human ovarian cancer cell line. Oncol Res.
9:129–138. 1997.PubMed/NCBI
|
|
30
|
Lötvall J, Hill AF, Hochberg F, Buzás EI,
Di Vizio D, Gardiner C, Gho YS, Kurochkin IV, Mathivanan S,
Quesenberry P, et al: Minimal experimental requirements for
definition of extracellular vesicles and their functions: a
position statement from the International Society for Extracellular
Vesicles. J Extracell Vesicles. 3:269132014. View Article : Google Scholar : PubMed/NCBI
|
|
31
|
Lacroix R, Robert S, Poncelet P, Kasthuri
RS, Key NS and Dignat-George F: Standardization of platelet-derived
microparticle enumeration by flow cytometry using calibrated beads:
results of ISTH SSC collaborative workshop. J Thromb Haemost.
8:2571–2574. 2010. View Article : Google Scholar : PubMed/NCBI
|
|
32
|
Nolte-'t Hoen EN, van der Vlist EJ,
Aalberts M, Mertens HC, Bosch BJ, Bartelink W, Mastrobattista E,
van Gaal EV, Stoorvogel W, Arkesteijn GJ, et al: Quantitative and
qualitative flow cytometric analysis of nanosized cell-derived
membrane vesicles. Nanomedicine. 8:712–720. 2012. View Article : Google Scholar
|
|
33
|
Dolo V, Ginestra A, Cassarà D, Violini S,
Lucania G, Torrisi MR, Nagase H, Canevari S, Pavan A and Vittorelli
ML: Selective localization of matrix metalloproteinase 9, beta1
integrins, and human lymphocyte antigen class I molecules on
membrane vesicles shed by 8701-BC breast carcinoma cells. Cancer
Res. 58:4468–4474. 1998.PubMed/NCBI
|
|
34
|
Koumangoye RB, Sakwe AM, Goodwin JS, Patel
T and Ochieng J: Detachment of breast tumor cells induces rapid
secretion of exosomes which subsequently mediate cellular adhesion
and spreading. PLoS One. 6:e242342011. View Article : Google Scholar : PubMed/NCBI
|
|
35
|
Grant R, Ansa-Addo E, Stratton D,
Antwi-Baffour S, Jorfi S, Kholia S, Krige L, Lange S and Inal J: A
filtration-based protocol to isolate human plasma membrane-derived
vesicles and exosomes from from blood plasma. J Immunol Methods.
371:143–151. 2011. View Article : Google Scholar : PubMed/NCBI
|
|
36
|
Witwer KW, Buzás EI, Bemis LT, Bora A,
Lässer C, Lötvall J, Nolte-'t Hoen EN, Piper MG, Sivaraman S, Skog
J, et al: Standardization of sample collection, isolation and
analysis methods in extracellular vesicles research. J Extracell
Vesicles. 2:203602013. View Article : Google Scholar
|
|
37
|
Andreu z and Yáñez-Mó M: Tetraspanins in
extracellular vesicles formation and function. Front Immunol.
5:4422014. View Article : Google Scholar
|
|
38
|
Tominaga N, Hagiwara K, Kosaka N, Honma K,
Nakagama H and Ochiya T: RPN2-mediated glycosylation of tetraspanin
CD63 regulates breast cancer cell malignancy. Mol Cancer.
13:1342014. View Article : Google Scholar : PubMed/NCBI
|