Introduction
Nasopharyngeal carcinoma (NPC) is a human malignancy
derived from the epithelium of the nasopharyngeal recess. It has a
particularly high incidence in Southeast Asia, and is associated
with genetic and epigenetic events, as well as Epstein-Barr virus
(EBV) infection. It is important to elucidate the molecular
mechanisms of NPC carcinogenesis.
MicroRNAs (miRNAs) are short non-coding RNA
molecules and are involved in post-transcriptional (1–3). The
dysregulation of miRNAs appears to play a crucial role in cancer,
where they exert effects as oncogenes or tumor suppressors
(4). Approximately 50% of miRNAs
are localized in cancer-associated genomic regions, and their
expression can be altered by genomic amplification, loss of
heterozygosity, viral integration and genomic rearrangements
(5). Large-scale profiling studies
revealed a global alteration of the miRNA expression patterns in
human types of cancers (6–8), and distinct miRNA expression
signatures have been proposed as diagnostic and prognostic markers
for various types of human cancer (9,10).
A growing number of cellular miRNAs are now known to
be involved in NPC via targeting specific mRNAs. Most of these,
including miR-29c, miR-218, miR-26a, miR-663, let-7, miR-141,
miR-216b and miR-200a, play an important role in the onset and
progression of NPC (11–18). A unique feature of NPC is its strong
association with EBV latent infection. The full-length EBV genome
is detected in all cases of NPC, suggesting that products of the
EBV genome are involved in the pathogenesis of this malignancy
(19,20). As well as EBV-encoded protein-coding
genes, latently infected NPC cells and tissues also express high
levels of viral miRNAs (21). EBV
is the first human virus known to express miRNAs. To date, >44
EBV miRNAs have been discovered in EBV-positive cell lines, and
they exhibit different expression patterns depending on the sample
and stage of infection (21). Since
EBV severely dysregulates the mRNA profiles of host cells (22), EBV miRNAs may have oncogenic
properties. Functional studies revealed that several EBV-encoded
miRNAs play roles in NPC by targeting a variety of cellular
(23–26) and viral (27–30)
mRNAs. Therefore, both cellular and EBV miRNAs play a crucial role
in NPC (31).
Various genome-wide miRNA expression profiling
studies using microarray-based approaches yielded abundant
information regarding the phenotypes of cancers. Distinct patterns
of cellular miRNA expression and specific miRNA signatures in NPC
have been identified, which are associated with clinicopathological
characteristics as well as prognosis, suggesting that miRNAs play
key roles in the development, invasion and metastasis of NPC
(32–36). Several studies have performed EBV
miRNA expression profiling in NPC cells and tissues (21,37–39).
However, there has been no systematic analysis of both
differentially expressed cellular and EBV miRNA expression profiles
in NPC tissues.
In the present study, we used microarray analyses to
compare the differences in the cellular and EBV miRNA expression
profiles in pooled laser capture microdissected (LCM) NPC tissues
and normal nasopharyngeal epithelial tissues (NNETs). We identified
the target genes of differential cellular and EBV miRNAs using
database predictions, and comparing the resulting information with
the gene expression in NPC reported in the Gene Expression Omnibus
(GEO) (GSE34573 and GSE12452). In addition, we analyzed the
functions and pathways modulated by the cellular and EBV miRNA
target genes. Finally, we constructed an anti-correlated cellular
and EBV miRNA/target gene regulatory network. The resulting data
may be helpful for elucidating the roles of cellular and EBV miRNA
deregulation in NPC carcinogenesis, and also revealing the global
trends in cellular and EBV miRNAs and gene interactions in NPC.
Materials and methods
Sample collection, laser capture
microdissection and total RNA extraction
Paired NPC tissues and adjacent NNETs from 20
patients with confirmed NPC were obtained from the Tumor Hospital
of Hunan Province (China) at the time of diagnosis before any
treatment, and were used for microarrays and quantitative reverse
transcription-PCR (qRT-PCR). Tissue specimens were obtained using
fiber optic nasopharyngoscopy directly at the tumor growth site,
and the adjacent side with an observed normal mucosal morphology
was used for the corresponding non-tumor pair. All patients signed
an informed consent form for participation in the present study,
which had been previously reviewed by the Institutional Review
Board. All tissue samples were verified by histopathology before
microdissection. Laser capture microdissection (LCM) was used to
purify the target cells from the fresh NPC tissues and NNETs using
a Leica AS LMD system (Leica, Mannheim, Germany), as previously
described (40). The cells obtained
from LCM were collected in the cap of a 0.5-ml Eppendorf (EP) tube
containing TRIzol reagent (Invitrogen, Life Technologies, Shanghai,
China). Total RNA was extracted using TRIzol according to the
manufacturer's instructions. The concentration and integrity of the
resulting RNA were evaluated using an Agilent 2100 Bioanalyzer
(Agilent Technologies, Santa Clara, CA, USA). Only total RNA
samples with an RNA integrity number (RIN) ≥7 were used for miRNA
microarray analyses and qRT-PCR. To diminish the effect of
biological sample variation on the results of the microarray
analysis, equal amounts of total RNA from the microdissected cells
of 10 different individuals were pooled to generate one common
sample for each tissue type.
miRNA microarrays
RNA samples were labeled using a miRCURY Hy3/Hy5
labeling kit and hybridized on the miRCURY locked nucleic acid
(LNA) array (version 10.0; Exiqon, KangChen Biotech, Shanghai,
China) according to the manufacturer's instructions. The array
contains probes for 850 human miRNAs and 39 EBV miRNAs, and uses a
one-color technique. The arrays were scanned using a laser scanner
(GenePix 4000B; Molecular Devices, LLC, Sunnyvale, CA, USA), and
the raw data were normalized and analyzed using image analysis
software (GenePix Pro v6.0) to generate a median value for each
miRNA from the repeated probes. The miRNA signal intensities were
log2 transformed, and differentially expressed miRNAs
were analyzed using the significance analysis of microarrays (SAM,
version 3.01). P-values were calculated using t-tests, and
differentially detected miRNAs with a ≥2.0- or ≤0.50 fold-change
and a P-value <0.01 were considered to be statistically
significant.
Quantitative RT-PCR
To validate the miRNA expression levels determined
using microarrays, stem-looped qRT-PCR was performed to detect the
expression of 15 cellular miRNAs (hsa-miR-200b, hsa-miR-34c-5p,
hsa-miR-31, hsa-miR-34b*, hsa-miR-656, hsa-miR-374a, hsa-miR-150,
hsa-miR-200a, hsa-miR-365-1, hsa-miR-15a, hsa-miR-20a, hsa-miR-17,
hsa-miR-18a, hsa-miR-106a and hsa-miR-412) and five EBV miRNAs
(ebv-miR-BART5, ebv-miR-BART6-3p, ebv-miR-BART3, ebv-miR-BART1-5p
and ebv-miR-BART7) in an independent set of samples consisting of
10 pairs of LCM-purified NPCs and NNETs. Briefly, 2 µg of total RNA
was reverse transcribed into cDNA using a reverse transcription kit
according to the manufacturer's protocol (Promega, Madison, WI,
USA). miRNA-specific primers (Bulge-Loop™ miRNA qPCR primers) for
the differentially expressed miRNAs were synthesized by GeneChem
Co. (Shanghai, China) and are summarized in Table I. The RT products were amplified
using real-time PCR with the miScript SYBR-Green PCR kit (Qiagen,
Shanghai, China) according to the manufacturer's instructions; U6
was used as the internal control. The following PCR program was
used: 95°C for 5 min, followed by 40 cycles of 95°C for 10 sec,
60°C for 20 sec and 78°C for 20 sec. The real-time PCR primers used
to amplify the miRNAs were designed based on the miRNA sequences
provided by the Sanger Center miRNA Registry and synthesized by
GeneChem; their sequences are provided in Table II. All qRT-PCR reactions were
performed in triplicate and products were quantified using the
2−ΔΔCt method normalized against U6. All qRT-PCR
reactions were performed on an ABI GeneAmp PCR System 9700 (ABI,
Carlsbad, CA, USA).
 | Table IThe specific stem-looped RT primers
to representatives of differentially expressed miRNAs. |
Table I
The specific stem-looped RT primers
to representatives of differentially expressed miRNAs.
| miRNA | RT primers |
|---|
| hsa-miR-200b |
5′-GTCGTATCCAGTGCGTGTCGTGGAGTCGGCAATTGCACTGGATACGACTCATCAT-3′ |
| hsa-miR-34c-5p |
5′-GTCGTATCCAGTGCGTGTCGTGGAGTCGGCAATTGCACTGGATACGACGCAATC-3′ |
| hsa-miR-31 |
5′-GTCGTATCCAGTGCGTGTCGTGGAGTCGGCAATTGCACTGGATACGACCAGCTAT-3′ |
|
hsa-miR-34b* |
5′-GTCGTATCCAGTGCGTGTCGTGGAGTCGGCAATTGCACTGGATACGACCAATCA-3′ |
| hsa-miR-656 |
5′-GTCGTATCCAGTGCGTGTCGTGGAGTCGGCAATTGCACTGGATACGACAGAGGTT-3′ |
| hsa-miR-374a |
5′-GTCGTATCCAGTGCGTGTCGTGGAGTCGGCAATTGCACTGGATACGACCACTTAT-3′ |
| hsa-miR-200a |
5′-GTCGTATCCAGTGCGTGTCGTGGAGTCGGCAATTGCACTGGATACGACACATCGT-3′ |
| hsa-miR-150 |
5′-GTCGTATCCAGTGCGTGTCGTGGAGTCGGCAATTGCACTGGATACGACCACTGGT-3′ |
| hsa-miR-365-1 |
5′-GTCGTATCCAGTGCGTGTCGTGGAGTCGGCAATTGCACTGGATACGACATAAGGA-3′ |
| hsa-miR-15a |
5′-GTCGTATCCAGTGCGTGTCGTGGAGTCGGCAATTGCACTGGATACGACCACAAAC-3′ |
| hsa-miR-412 |
5′-GTCGTATCCAGTGCGTGTCGTGGAGTCGGCAATTGCACTGGATACGACACGGCT-3′ |
| hsa-miR-20a |
5′-GTCGTATCCAGTGCGTGTCGTGGAGTCGGCAATTGCACTGGATACGACCTACCTG-3′ |
| hsa-miR-18a |
5′-GTCGTATCCAGTGCGTGTCGTGGAGTCGGCAATTGCACTGGATACGACCTATCTG-3′ |
| hsa-miR-17 |
5′-GTCGTATCCAGTGCGTGTCGTGGAGTCGGCAATTGCACTGGATACGACCTACCTG-3′ |
| hsa-miR-106a |
5′-GTCGTATCCAGTGCGTGTCGTGGAGTCGGCAATTGCACTGGATACGACCTACCTG-3′ |
| ebv-miR-BART7 |
5′-GTCGTATCCAGTGCGTGTCGTGGAGTCGGCAATTGCACTGGATACGACCCCTGG-3′ |
|
ebv-miR-BART1-5p |
5′-GTCGTATCCAGTGCGTGTCGTGGAGTCGGCAATTGCACTGGATACGACCACAGCA-3′ |
| ebv-miR-BART3 |
5′-GTCGTATCCAGTGCGTGTCGTGGAGTCGGCAATTGCACTGGATACGACACACCT-3′ |
|
ebv-miR-BART6-3p |
5′-GTCGTATCCAGTGCGTGTCGTGGAGTCGGCAATTGCACTGGATACGACTCTAAGG-3′ |
| ebv-miR-BART5 |
5′-GTCGTATCCAGTGCGTGTCGTGGAGTCGGCAATTGCACTGGATACGACCGATGGG-3′ |
| U6 |
5′-CGCTTCACGAATTTGCGTGTCAT-3′ |
| Table IIThe real-time PCR primers for
amplification of the mature miRNAs. |
Table II
The real-time PCR primers for
amplification of the mature miRNAs.
| miRNA | | Bidirectional
primers | Annealing
temperature (°C) | Product length
(bp) |
|---|
| hsa-miR-200b | GSP |
5′-GGGGTAATACTGCCTGGT-3′ | | |
| R |
5′-TGCGTGTCGTGGAGTC-3′ | 60 | 63 |
| hsa-miR-34c-5p | GSP |
5′-GGGAGGCAGTGTAGTTAGC-3′ | | |
| R |
5′-CAGTGCGTGTCGTGGAGT-3′ | 60 | 66 |
| hsa-miR-31 | GSP |
5′-GGAGGCAAGATGCTGGC-3′ | | |
| R |
5′-CAGTGCGTGTCGTGGAGT-3′ | 60 | 64 |
|
hsa-miR-34b* | GSP |
5′-GGGTAGGCAGTGTCATTAGC-3′ | | |
| R |
5′-CAGTGCGTGTCGTGGAGT-3′ | 60 | 66 |
| hsa-miR-656 | GSP |
5′-GGCGGAATATTATACAGTCAA-3′ | | |
| R |
5′-CAGTGCGTGTCGTGGAGT-3′ | 60 | 66 |
| hsa-miR-374a | GSP |
5′-GGCACCTTATAATACAACCTG-3′ | | |
| R |
5′-TGCGTGTCGTGGAGTC-3′ | 60 | 65 |
| hsa-miR-200a | GSP |
5′-GGGGTAACACTGTCTGGTAG-3′ | | |
| R |
5′-TGCGTGTCGTGGAGTC-3′ | 60 | 63 |
| hsa-miR-150 | GSP |
5′-GCTCTCCCAACCCTTGT-3′ | | |
| R |
5′-TGCGTGTCGTGGAGTC-3′ | 60 | 61 |
| hsa-miR-365-1 | GSP |
5′-GCACTTCACCTGGTCCACT-3′ | | |
| R |
5′-CAGTGCGTGTCGTGGAGT-3′ | 60 | 65 |
| hsa-miR-15a | GSP |
5′-GGGTAGCAGCACATAATGG-3′ | | |
| R |
5′-CAGTGCGTGTCGTGGAGT-3′ | 60 | 67 |
| hsa-miR-412 | GSP |
5′-GCACTTCACCTGGTCCACT-3′ | | |
| R |
5′-CAGTGCGTGTCGTGGAGT-3′ | 60 | 65 |
| hsa-miR-20a | GSP |
5′-GGGTAAAGTGCTTATAGTGC-3′ | | |
| R |
5′-TGCGTGTCGTGGAGTC-3′ | 60 | 63 |
| hsa-miR-18a | GSP |
5′-GGGTAAGGTGCATCTAGTGC-3′ | | |
| R |
5′-TGCGTGTCGTGGAGTC-3′ | 60 | 64 |
| hsa-miR-17 | GSP |
5′-GGGCAAAGTGCTTACAGTGC-3′ | | |
| R |
5′-TGCGTGTCGTGGAGTC-3′ | 60 | 65 |
| hsa-miR-106a | GSP |
5′-GGGGAAAAGTGCTTACAGTG-3′ | | |
| R |
5′-CAGTGCGTGTCGTGGAGT-3′ | 60 | 67 |
| ebv-miR-BART7 | GSP |
5′-GGGCATCATAGTCCAGTGT-3′ | | |
| R |
5′-CAGTGCGTGTCGTGGAGT-3′ | 60 | 65 |
|
ebv-miR-BART1-5p | GSP |
5′-GGCTCTTAGTGGAAGTGACG-3′ | | |
| R |
5′-CAGTGCGTGTCGTGGAGT-3′ | 60 | 67 |
| ebv-miR-BART3 | GSP |
5′-GGCGCACCACTAGTCACC-3′ | | |
| R |
5′-CAGTGCGTGTCGTGGAGT-3′ | 60 | 64 |
|
ebv-miR-BART6-3p | GSP |
5′-AAGCGGGGATCGGACTA-3′ | | |
| R |
5′-CAGTGCGTGTCGTGGAGT-3′ | 60 | 65 |
| ebv-miR-BART5 | GSP |
5′-CGGCAAGGTGAATATAGC-3′ | | |
| R |
5′-TGCGTGTCGTGGAGTC-3′ | 60 | 64 |
| U6 | F |
5′-GCTTCGGCAGCACATATACTAAAAT-3′ | | |
| R |
5′-CGCTTCACGAATTTGCGTGTCAT-3′ | 60 | 89 |
Identification of cellular and EBV miRNA
target genes
The putative target genes of the cellular miRNAs
expressed differentially in miRNA microarrays were predicted using
three databases (miRanda, PITA and TargetScan, 2013). The cellular
miRNA target genes in any of the three databases were selected, and
their potential differential gene expression profiles (GSE34573 and
GSE12452) in NPC biopsies from the National Center for
Biotechnology Information (NCBI)-Gene Expression Omnibus (GEO) were
compared. Potential target genes, which were differentially
expressed in the gene expression profiles in NPC and also had a
negative correlation with the cellular miRNA expression in the
microarrays, were identified and further analyzed.
The putative host target genes of the differentially
expressed EBV miRNAs in the microarrays were predicted using three
databases (RepTar (41),
DIANA-microT v3.0 (42) and
starBase (43), 2013). The host
target genes recorded in any of these databases were selected and
their potential differential gene expression profiles (GSE34573 and
GSE12452) in NPC biopsies from the NCBI-GEO were compared. The
predicted host target genes that were correlated negatively with
the EBV miRNA expression profiles were identified and further
analyzed. The putative viral target genes of the differentially
expressed EBV miRNAs in the microarrays were predicted using the
vHoT database (2013) (44), which
predicts the viral target genes of virus-derived miRNAs using
popular miRNA target prediction algorithms including TargetScan,
miRanda and PITA. The targets of the differentially expressed EBV
miRNAs in the viral genome were identified according to the match
sites of these miRNAs in the EBV genome and the following criteria:
a total context score 0 (TargetScan), a minimum free energy (MFE)
≤0 kcal/mol (miRanda) and a ddG threshold ≤10 (PITA).
GO and Kyoto Encyclopedia of Genes and
Genomes (KEGG) pathway analysis of the cellular and EBV miRNA
target genes
To understand the functions of the predicted host
and virus target genes of the cellular and EBV miRNAs, we performed
ontology classification and KEGG pathway analysis using DAVID
Bioinformatics Resources 6.7 (http://david.abcc.ncifcrf.gov/home.jsp). The target
genes were assigned to functional groups based on biological
processes. Correlation was defined as significantly enriched when
P≤0.05.
Integrative analysis of the cellular
miRNA and gene expression profiles to construct an miRNA/gene
regulatory network
The post-transcriptional regulatory network of an
miRNA and gene is defined as a directed, bipartite graph in which
the expression of the miRNA/target gene interacting pairs are
anti-correlated. The differentially expressed miRNAs and genes of
interest were determined using pathways extracted from KEGG as the
primary nodal networks. The networks were drawn using Cytoscape
2.8.3. The resulting post-transcriptional network identified the
genes regulated by the same miRNAs, as well as miRNAs that regulate
the specific genes of functional relevance.
Establishing an intercross regulatory
network of cellular and EBV miRNAs in NPC
To understand the interaction between cellular and
EBV miRNAs, we identified the target genes regulated by both
cellular and viral miRNAs that were anti-correlated with the miRNA
expression observed in the microarrays. We then established a gene
regulatory network that was co-regulated by both cellular and viral
miRNAs in NPC. The networks were drawn using Cytoscape 2.8.3.
Results
Differentially expressed cellular and EBV
miRNAs in NPC tissues and NNETs
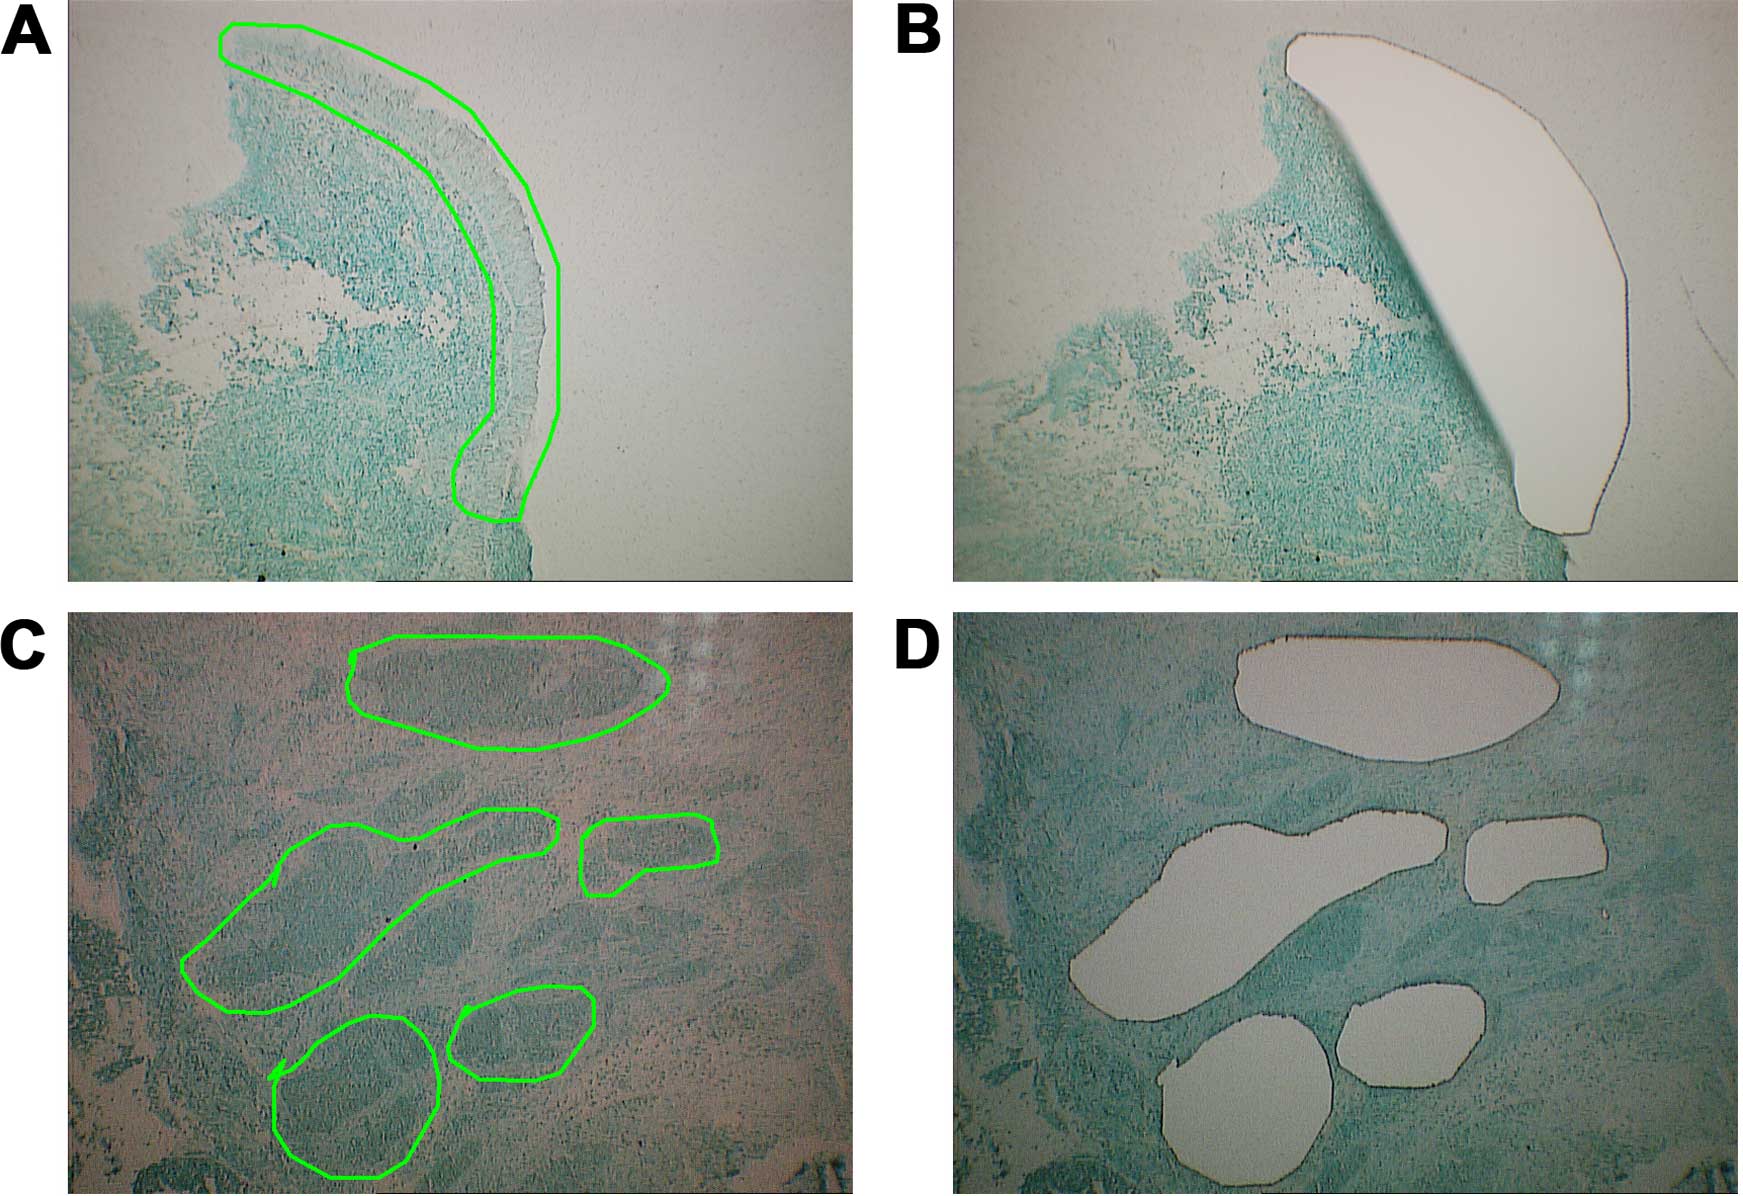
miRNA expression profiling was performed using
pooled LCM-purified NPC tissues and paired NNETs (Fig. 1), and miRCURY LNA arrays (version
10.0) containing 850 human and 39 EBV miRNAs. miRNAs were scored as
positive using SAM; differential expression with a ≥2 fold-change
was regarded as significant. These analyses identified 50 cellular
miRNAs and 9 differential EBV miRNAs that were expressed
differentially between NPC and normal tissues. Among these, 19
cellular miRNAs and 9 EBV miRNAs were upregulated, whereas 31
cellular miRNAs were downregulated in the NPC tissues compared with
the NNETs (Table III).
Importantly, miR-106a, miR-142-3p, miR-155, miR-17, miR-18a, let-7,
miR-200a, miR-200b, miR-31, miR-34b, miR-34c and miR449a were
previously reported to be differentially regulated (11,32,33,36,39).
| Table IIIMicroarray-based detection of the
differentially expressed miRNAs in the NPC tissues and the
NNETs. |
Table III
Microarray-based detection of the
differentially expressed miRNAs in the NPC tissues and the
NNETs.
| miRNA | Chromosome
location | Normalized value
| Fold-change
NPC/NNET |
|---|
| NNET | NPC |
|---|
| Upregulated
cellular miRNAs |
| hsa-miR-106a | Xq26.2 | 0.08 | 0.40 | 4.77 |
|
hsa-miR-142-3p | 17q22 | 0.20 | 0.40 | 2.00 |
|
hsa-miR-142-5p | 17q22 | 0.11 | 0.22 | 2.00 |
| hsa-miR-143 | 5q32 | 0.05 | 0.15 | 3.22 |
| hsa-miR-155 | 21q21.3 | 0.15 | 0.35 | 2.35 |
| hsa-miR-16 | 13q14.2 | 0.12 | 0.28 | 2.30 |
| hsa-miR-17 | 13q31.3 | 0.11 | 0.36 | 3.15 |
| hsa-miR-18a | 13q31.3 | 0.03 | 0.15 | 4.33 |
|
hsa-miR-193a-3p | 17q11.2 | 0.03 | 0.13 | 4.13 |
| hsa-miR-206 | 6p12.2 | 0.23 | 0.55 | 2.35 |
| hsa-miR-20a | 13q31.3 | 0.96 | 1.96 | 2.04 |
| hsa-miR-21 | 17q23.1 | 0.28 | 0.58 | 2.04 |
|
hsa-miR-221* | Xp11.3 | 0.63 | 1.43 | 2.27 |
|
hsa-miR-30b* | 8q24.22 | 5.32 | 14.14 | 2.66 |
|
hsa-miR-30c-2* | 6q13 | 7.33 | 17.96 | 2.45 |
|
hsa-miR-338-5p | 17q25.3 | 0.18 | 0.92 | 5.17 |
| hsa-miR-412 | 14q32.31 | 0.36 | 1.14 | 3.16 |
| hsa-miR-550 | 7p14.3 | 19.23 | 45.50 | 2.37 |
| hsa-miR-637 | 19p13.3 | 0.17 | 0.36 | 2.06 |
| Downregulated
cellular miRNAs |
|
hsa-let-7b* | 22q13.31 | 1.26 | 0.04 | 0.04 |
| hsa-miR-1 | 20q13.33 | 2.00 | 1.03 | 0.51 |
|
hsa-miR-105* | Xq28 | 0.19 | 0.09 | 0.50 |
| hsa-miR-133b | 6p12.2 | 3.69 | 0.03 | 0.01 |
|
hsa-miR-138-1* | 3p21.32 | 6.91 | 3.13 | 0.45 |
| hsa-miR-150 | 19q13.33 | 2.20 | 0.65 | 0.30 |
| hsa-miR-15a | 13q14.2 | 1.93 | 0.35 | 0.18 |
| hsa-miR-15b | 3q25.33 | 1.98 | 0.16 | 0.08 |
| hsa-miR-195 | 17p13.1 | 0.24 | 0.01 | 0.04 |
| hsa-miR-200a | 1p36.33 | 0.35 | 0.17 | 0.47 |
| hsa-miR-200b | 1p36.33 | 0.42 | 0.16 | 0.38 |
|
hsa-miR-200c* | 12p13.31 | 1.33 | 0.42 | 0.31 |
| hsa-miR-31 | 9p21.3 | 0.12 | 0.01 | 0.12 |
| hsa-miR-326 | 11q13.4 | 0.87 | 0.14 | 0.16 |
| hsa-miR-328 | 16q22.1 | 0.29 | 0.14 | 0.49 |
| hsa-miR-335 | 7q32.2 | 0.15 | 0.04 | 0.23 |
|
hsa-miR-34b* | 11q23.1 | 0.63 | 0.00 | 0.01 |
|
hsa-miR-34c-5p | 11q23.1 | 1.81 | 0.10 | 0.06 |
| hsa-miR-365 |
16p13.12/17q11.2 | 1.51 | 0.25 | 0.16 |
| hsa-miR-374a | Xq13.2 | 3.27 | 0.05 | 0.02 |
| hsa-miR-449a | 5q11.2 | 0.63 | 0.02 | 0.04 |
|
hsa-miR-450b-3p | Xq26.3 | 0.13 | 0.03 | 0.25 |
|
hsa-miR-486-5p | 8p11.21 | 1.90 | 0.79 | 0.42 |
| hsa-miR-506 | Xq27.3 | 0.36 | 0.14 | 0.38 |
|
hsa-miR-513-5p | Xq27.3 | 12.49 | 4.95 | 0.40 |
|
hsa-miR-518a-3p | 19q13.42 | 5.23 | 2.68 | 0.51 |
|
hsa-miR-574-5p | 4p14 | 2.19 | 0.61 | 0.28 |
| hsa-miR-647 | 20q13.33 | 0.86 | 0.37 | 0.43 |
| hsa-miR-656 | 14q32.31 | 1.59 | 0.09 | 0.06 |
|
hsa-miR-886-3p | 5q31.1 | 0.41 | 0.18 | 0.44 |
|
hsa-miR-886-5p | 5q31.1 | 0.70 | 0.30 | 0.42 |
| Upregulated EBV
miRNA |
|
ebv-miR-BART8* | | 0.08 | 0.28 | 3.37 |
| ebv-miR-BART4 | | 0.04 | 0.12 | 3.47 |
| ebv-miR-BART5 | | 0.12 | 0.52 | 4.45 |
|
ebv-miR-BART1-5p | | 0.06 | 0.25 | 4.19 |
|
ebv-miR-BART18-3p | | 0.14 | 0.28 | 2.02 |
|
ebv-miR-BART10 | | 0.00 | 0.22 | 110.83 |
|
ebv-miR-BART6-3p | | 0.02 | 0.17 | 7.22 |
| ebv-miR-BART3 | | 0.004 | 0.64 | 160.19 |
| ebv-miR-BART7 | | 0.004 | 0.44 | 109.9 |
Compared with all previous published studies,
several novel miRNAs that were upregulated in NPC were identified
in the present study: hsa-miR-142-5p, hsa-miR-193a-3p,
hsa-miR-221*, hsa-miR-30b*, hsa-miR-30c-2*, hsa-miR-338-5p,
hsa-miR-412, hsa-miR-550 and hsa-miR-637. In addition several novel
miRNAs that were downregulated in NPC were identified:
hsa-miR-105*, hsa-miR-133b, hsa-miR-138-1*, hsa-miR-200c*,
hsa-miR-326, hsa-miR-328, hsa-miR-365, hsa-miR-374a,
hsa-miR-450b-3p, hsa-miR-506, hsa-miR-513-5p, hsa-miR-518a-3p,
hsa-miR-574-5p, hsa-miR-647, hsa-miR-656, hsa-miR-886-3p and
hsa-miR-886-5p.
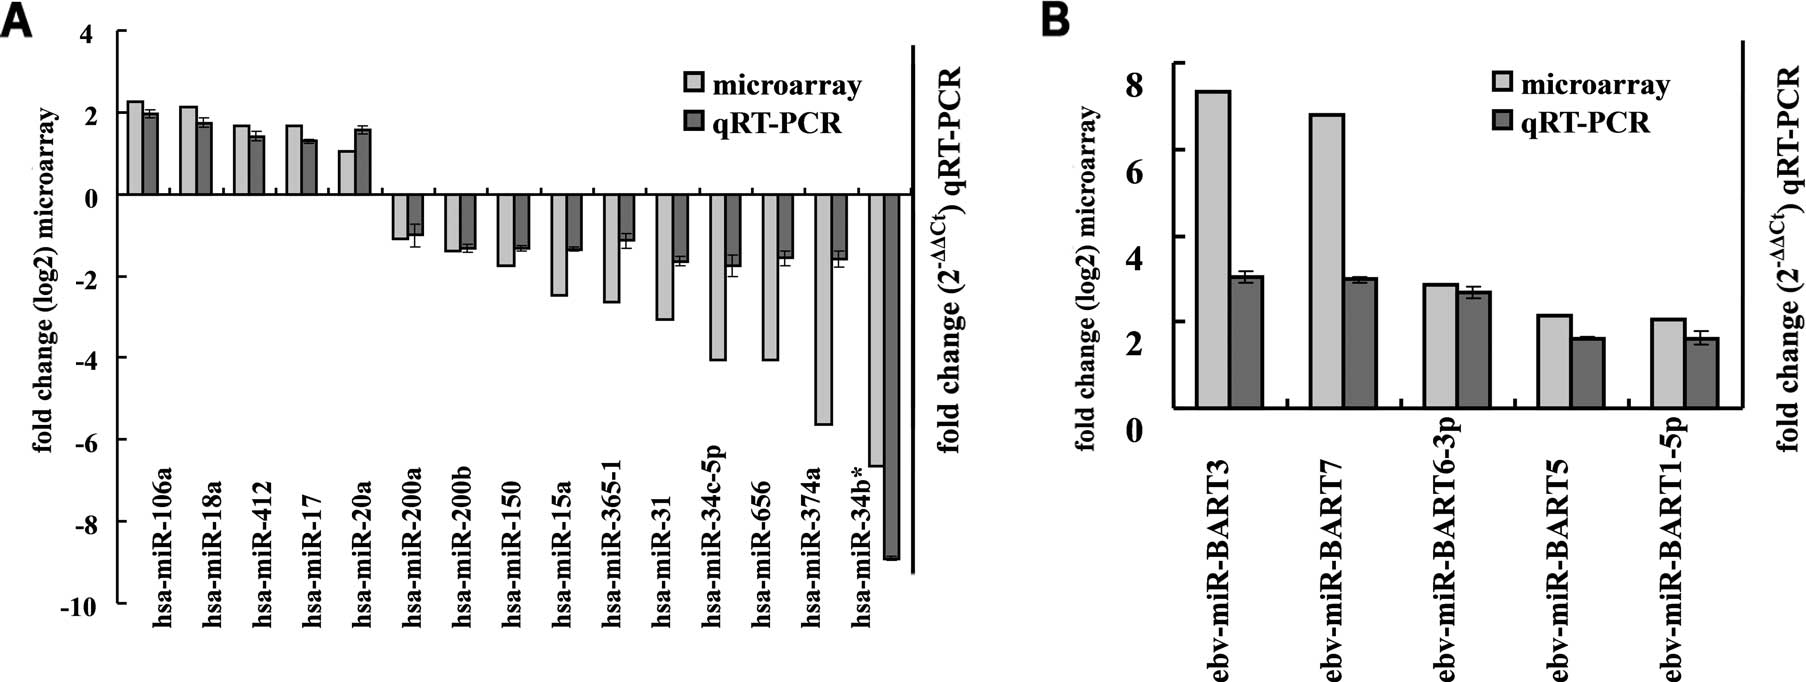
Validation of the miRNA microarray
results using qRT-PCR
To validate the microarray data, qRT-PCR was
performed to quantify the expression of 15 cellular miRNAs and 5
EBV miRNAs in an independent set of 10 LCM-purified NPCs and paired
NNETs. Data revealed that the expression of hsa-miR-200b,
hsa-miR-34c-5p, hsa-miR-31, hsa-miR-34b*, hsa-miR-656,
hsa-miR-374a, hsa-miR-150, hsa-miR-200a, hsa-miR-365-1 and
hsa-miR-15a was significantly decreased, whereas hsa-miR-20a,
hsa-miR-17, hsa-miR-18a, hsa-miR-106a, hsa-miR-412, ebv-miR-BART5,
ebv-miR-BART6-3p, ebv-miR-BART3, ebv-miR-BART1-5p and ebv-miR-BART7
were significantly increased in the NPC tissues when compared with
the NNETs. These observations were consistent with the results of
the miRNA microarrays (Fig. 2).
Prediction of the miRNA target genes
The putative target genes of 50 differentially
expressed cellular miRNAs were predicted using the three databases
as described in Materials and methods. A total of 69,869 target
genes were recorded by the databases (data not shown). To identify
more genuine target genes, all the predicted cellular miRNA targets
were compared with the differential gene expression profiles in NPC
tissues within NCBI-GEO. This identified 555 cellular miRNA target
genes that were expressed differentially in NPC and negatively
correlated with the expression of the differentially expressed
miRNAs. Among these target genes, 218 and 337 were regulated by the
upregulated and downregulated miRNAs, respectively (data not
shown).
The putative host target genes of the nine
upregulated EBV miRNAs were predicted using the three databases as
described in the Materials and methods. This identified 18,993 host
target genes (data not shown), among which 636 were regulated by 4
or more EBV miRNAs (data not shown).
The putative viral target genes of the 9
differentially expressed EBV miRNAs were predicted using vHoT
database. This revealed 68 target genes within the EBV genome for 8
differentially expressed EBV miRNAs using any of the three
algorithms. Among these, 37 viral target genes were predicted at
least by two algorithms (Table
IV). Notably, there were no predicted results for
ebv-miR-BART18-3p.
| Table IVThe 37 putative viral target genes of
the 8 upregulated EBV miRNAs predicted by at least two of the
algorithms TargetScan, miRanda and PITA from the vHoT database. |
Table IV
The 37 putative viral target genes of
the 8 upregulated EBV miRNAs predicted by at least two of the
algorithms TargetScan, miRanda and PITA from the vHoT database.
| Category | Target gene | EBV miRNAs | Gene
description |
|---|
| Capsid | BBRF1 | ebv-miR-BART10,
ebv-miR-BART1-5p, ebv-miR-BART4, ebv-miR-BART8* | Transcription
factor, portal protein |
| Capsid | BcLF1 | ebv-miR-BART1-5p,
ebv-miR-BART3, ebv-miR-BART4 | MCP, VCA, viral
lytic gene (late) |
| Capsid | BDLF1 | ebv-miR-BART7,
ebv-miR-BART3, ebv-miR-BART5, ebv-miR-BART1-5p | MCP |
| Capsid | BTRF1 | ebv-miR-BART10,
ebv-miR-BART7, ebv-miR-BART6-3p | Capsid |
| Capsid | BVRF2 | ebv-miR-BART6-3p,
ebv-miR-BART3, ebv-miR-BART8* | Maturational
protease |
| Capsid | BdRF1 | ebv-miR-BART3,
ebv-miR-BART4, ebv-miR-BART5 | Packaging,
terminase small subunit, internal scaffold protein |
| Glycoprotein | BALF4 | ebv-miR-BART3,
ebv-miR-BART1-5p, ebv-miR-BART7 |
Glycoprotein-encoding genes, product
gB |
| Glycoprotein | BDLF3 | ebv-miR-BART10,
ebv-miR-BART1-5p, ebv-miR-BART3 |
Glycoprotein-encoding genes, product
gp150 |
| Glycoprotein | BILF1 | ebv-miR-BART4,
ebv-miR-BART10, ebv-miR-BART1-5p, ebv-miR-BART5, ebv-miR-BART7 | Product gp64,
undetected in mature virus |
| Glycoprotein | BILF2 | ebv-miR-BART3,
ebv-miR-BART5, ebv-miR-BART6-3p, ebv-miR-BART7 | Product gp78 |
| Glycoprotein | BLLF1 | ebv-miR-BART3,
ebv-miR-BART1-5p, ebv-miR-BART7 |
Glycoprotein-encoding genes, product
gp350 |
| Glycoprotein | BXLF2 | ebv-miR-BART1-5p,
ebv-miR-BART4, ebv-miR-BART7 | Product gH |
| Latent | EBNA-1 | ebv-miR-BART1-5p,
ebv-miR-BART4, ebv-miR-BART3, ebv-miR-BART6-3p, ebv-miR-BART10,
ebv-miR-BART7, ebv-miR-BART8* | EBNA-1 |
| Latent | EBNA-LP | ebv-miR-BART5,
ebv-miR-BART6-3p, ebv-miR-BART1-5p | |
| Latent | LMP-1 | ebv-miR-BART10,
ebv-miR-BART8* | LMP-1 |
| Latent | LMP-2A | ebv-miR-BART1-5p,
ebv-miR-BART4, ebv-miR-BART10, ebv-miR-BART5 | LMP-2A |
| Latent | LMP-2B |
ebv-miR-BART8*,
ebv-miR-BART1-5p, ebv-miR-BART7 | |
| Latent | RPMS1 | ebv-miR-BART1-5p,
ebv-miR-BART3, ebv-miR-BART4, ebv-miR-BART6-3p, ebv-miR-BART7,
ebv-miR-BART8*, ebv-miR-BART10, ebv-miR-BART5 | |
| Replication | BALF5 | ebv-miR-BART10,
ebv-miR-BART1-5p, ebv-miR-BART4, ebv-miR-BART6-3p,
ebv-miR-BART7 | Polymerase |
| Replication | BBLF2/BBLF3 |
ebv-miR-BART6-3p | Primase-associated
factor |
| Tegument | BALF2 | ebv-miR-BART6-3p,
ebv-miR-BART1-5p, ebv-miR-BART3, ebv-miR-BART4, ebv-miR-BART5,
ebv-miR-BART8* | Replication, viral
lytic gene (EA), ssDNABP |
| Tegument | BFRF1A | ebv-miR-BART7 | Form the terminase
complex, cleavage of DNA concatemers |
| Tegument | BGLF1 | ebv-miR-BART3,
ebv-miR-BART5, ebv-miR-BART7 | Capsid-assoc,
packaging |
| Tegument | BGLF3 | ebv-miR-BART5,
ebv-miR-BART10, ebv-miR-BART4 | Undetected in
mature virus |
| Tegument | BNRF1 | ebv-miR-BART3,
ebv-miR-BART5, ebv-miR-BART7, ebv-miR-BART4 | MTP |
| Tegument | BOLF1 | ebv-miR-BART7,
ebv-miR-BART3, ebv-miR-BART5, ebv-miR-BART6-3p | LTPBP |
| Tegument | BORF2 | ebv-miR-BART7,
ebv-miR-BART3, ebv-miR-BART5, ebv-miR-BART8* | Ribonucleotide
reductase large subunit, RNR-L |
| Tegument | BPLF1 | ebv-miR-BART3,
ebv-miR-BART6-3p, ebv-miR-BART7, ebv-miR-BART8*,
ebv-miR-BART10, ebv-miR-BART1-5p, ebv-miR-BART4, ebv-miR-BART5 | LTP |
| Tegument | BRLF1 | ebv-miR-BART5,
ebv-miR-BART7 | Product Rta |
| Tegument | BRRF2 | ebv-miR-BART5,
ebv-miR-BART6-3p | Likely undergoes
post-translational modification, including phosphorylation |
| Tegument | BSLF1 | ebv-miR-BART7,
ebv-miR-BART8* | Virally encoded
replication proteins, primase |
| Tegument | BVRF1 | ebv-miR-BART6-3p,
ebv-miR-BART1-5p, ebv-miR-BART4 | Capsid-assoc,
portal plug |
| Transcription
factor | BHRF1 | ebv-miR-BART3,
ebv-miR-BART8* | Bcl-2 homolog |
| Transcription
factor | BZLF1 | ebv-miR-BART10,
ebv-miR-BART3, ebv-miR-BART4 | Zta, viral lytic
genes (immediate early, ZEBRA) site-specific DNA binding protein,
transcriptional activator, origin binding protein, A BZLF1 mutation
affects global expression of EBV lytic genes |
| ? | BDLF4 | ebv-miR-BART4,
ebv-miR-BART8* | |
| ? | BLLF2 | ebv-miR-BART3 | |
| ? | BWRF1 |
ebv-miR-BART6-3p | |
Gene Ontology (GO) function and KEGG
pathway analyses of the miRNA target genes
A total of 218 and 337 target genes whose expression
was regulated by upregulated and downregulated cellular miRNAs,
respectively, and negatively correlated with the expression of
miRNAs in NPC were uploaded into DAVID for functional and pathway
enrichment analyses. The results showed that 118 and 447 GO
functions were annotated for upregulated and downregulated cellular
miRNA targets (P≤0.05), respectively. Of these, 2 and 35 pathways
were enriched statistically (P≤0.05) among the upregulated and the
downregulated cellular miRNA targets, respectively.
In addition, the 636 targets that were regulated by
4 or more EBV miRNAs were also uploaded into DAVID for functional
and pathway enrichment analyses. Data revealed that 101 GO
functions and 12 pathways were statistically enriched (P≤0.05). The
most enriched GO terms and KEGG pathways of the target genes are
shown in Table V, most of which are
involved in carcinogenesis. Notably, the novel differential miRNAs
were all enriched in major cellular functions associated with
tumorigenesis, including the regulation of apoptosis, cell
proliferation, the cell cycle and cell differentiation (data not
shown).
| Table VGO functional annotation and KEGG
pathway analysis of the target genes regulated by the upregulated
and downregulated cellular miRNAs and EBV miRNAs in the NPC
biopsies. |
Table V
GO functional annotation and KEGG
pathway analysis of the target genes regulated by the upregulated
and downregulated cellular miRNAs and EBV miRNAs in the NPC
biopsies.
| Term | Count | % | P-value | FDR |
|---|
| GO functional
annotation of upregulated cellular miRNA target genes |
|
GO:0043065-positive regulation of
apoptosis | 20 | 0.74 | 2.78E-06 | 4.62E−03 |
|
GO:0006917-induction of apoptosis | 16 | 0.59 | 1.64E-05 | 2.74E−02 |
|
GO:0008285-negative regulation of cell
proliferation | 17 | 0.63 | 1.71E-05 | 2.84E−02 |
|
GO:0006915-apoptosis | 22 | 0.82 | 3.08E-05 | 5.13E−02 |
|
GO:0042981-regulation of apoptosis | 26 | 0.96 | 3.56E-05 | 5.92E−02 |
|
GO:0007242-intracellular signaling
cascade | 33 | 1.22 | 1.29E-04 | 2.15E−01 |
|
GO:0042127-regulation of cell
proliferation | 23 | 0.85 | 4.85E-04 | 8.04E−01 |
|
GO:0019220-regulation of phosphate
metabolic process | 17 | 0.63 | 5.26E-04 | 8.72E−01 |
| GO:0006959-humoral
immune response | 7 | 0.26 | 5.31E-04 | 8.80E−01 |
|
GO:0042744-hydrogen peroxide catabolic
process | 4 | 0.15 | 1.25E-03 | 2.05E+00 |
|
GO:0045859-regulation of protein kinase
activity | 13 | 0.48 | 1.70E-03 | 2.78E+00 |
| GO:0002252-immune
effector process | 8 | 0.30 | 1.72E-03 | 2.83E+00 |
| GO:0007264-small
GTPase mediated signal transduction | 12 | 0.44 | 1.98E-03 | 3.25E+00 |
|
GO:0043066-negative regulation of
apoptosis | 13 | 0.48 | 2.10E-03 | 3.44E+00 |
|
GO:0034599-cellular response to oxidative
stress | 5 | 0.19 | 2.21E-03 | 3.61E+00 |
| GO functional
annotation of downregulated cellular miRNA target genes |
|
GO:0042127-regulation of cell
proliferation | 64 | 1.46 | 1.53E-19 | 2.69E−16 |
|
GO:0008284-positive regulation of cell
proliferation | 38 | 0.87 | 4.54E-13 | 7.99E−10 |
|
GO:0043067-regulation of programmed cell
death | 54 | 1.23 | 9.94E-13 | 1.75E−09 |
|
GO:0051726-regulation of cell cycle | 32 | 0.73 | 1.23E-11 | 2.16E−08 |
|
GO:0045449-regulation of
transcription | 104 | 2.38 | 3.94E-10 | 6.92E−07 |
|
GO:0007242-intracellular signaling
cascade | 63 | 1.44 | 1.28E-09 | 2.26E−06 |
|
GO:0010604-positive regulation of
macromolecule metabolic process | 49 | 1.12 | 2.53E-09 | 4.46E−06 |
|
GO:0006357-regulation of transcription
from | 44 | 1.01 | 3.83E-09 | 6.73E−06 |
| RNA polymerase II
promoter |
| GO:0007264-small
GTPase mediated signal transduction | 27 | 0.62 | 4.49E-09 | 7.90E−06 |
|
GO:0043065-positive regulation of
apoptosis | 32 | 0.73 | 8.02E-09 | 1.41E−05 |
| GO:0007049-cell
cycle | 45 | 1.03 | 8.86E-09 | 1.56E−05 |
|
GO:0045596-negative regulation of cell
differentiation | 22 | 0.50 | 1.49E-08 | 2.62E−05 |
|
GO:0006355-regulation of transcription,
DNA-dependent | 76 | 1.74 | 1.62E-08 | 2.84E−05 |
|
GO:0009890-negative regulation of
biosynthetic process | 37 | 0.85 | 1.76E-08 | 3.09E−05 |
|
GO:0045786-negative regulation of cell
cycle | 14 | 0.32 | 2.45E-08 | 4.30E−05 |
| GO functional
annotation of targets regulated by four or more EBV miRNAs |
|
GO:0010557-positive regulation of
macromolecule biosynthetic process | 44 | 0.73 | 1.43E-05 | 2.47E−02 |
|
GO:0010628-positive regulation of gene
expression | 40 | 0.66 | 2.30E-05 | 3.99E−02 |
|
GO:0045941-positive regulation of
transcription | 39 | 0.64 | 2.71E-05 | 4.70E−02 |
|
GO:0051254-positive regulation of RNA
metabolic process | 35 | 0.58 | 2.82E-05 | 4.90E−02 |
|
GO:0006350-transcription | 103 | 1.70 | 2.98E-05 | 5.16E−02 |
|
GO:0048598-embryonic morphogenesis | 26 | 0.43 | 3.39E-05 | 5.87E−02 |
|
GO:0045449-regulation of
transcription | 121 | 2.00 | 5.08E-05 | 8.80E−02 |
|
GO:0051173-positive regulation of
nitrogen compound metabolic process | 40 | 0.66 | 2.05E-04 | 3.56E−01 |
|
GO:0010604-positive regulation of
macromolecule metabolic process | 48 | 0.79 | 4.63E-04 | 8.00E−01 |
|
GO:0010828-positive regulation of glucose
transport | 6 | 0.10 | 6.50E-04 | 1.12E+00 |
|
GO:0010906-regulation of glucose
metabolic process | 7 | 0.12 | 9.26E-04 | 1.59E+00 |
| GO:0035295-tube
development | 18 | 0.30 | 1.08E-03 | 1.86E+00 |
|
GO:0007268-synaptic transmission | 21 | 0.35 | 2.30E-03 | 3.91E+00 |
| GO:0007167-enzyme
linked receptor protein signaling pathway | 23 | 0.38 | 2.36E-03 | 4.02E+00 |
|
GO:0007169-transmembrane receptor protein
tyrosine kinase signaling pathway | 17 | 0.28 | 3.32E-03 | 5.61E+00 |
| KEGG pathways of
upregulated cellular miRNA target genes |
| hsa04115: p53
signaling pathway | 7 | 0.26 | 8.20E-04 | 9.03E−01 |
| hsa05200: pathways
in cancer | 13 | 0.48 | 7.10E-03 | 7.58E+00 |
| KEGG pathways of
downregulated cellular miRNA target genes |
| hsa05200: pathways
in cancer | 42 | 0.96 | 9.06E-15 | 1.04E−11 |
| hsa04510: focal
adhesion | 24 | 0.55 | 7.78E-08 | 8.91E−05 |
| hsa04012: ErbB
signaling pathway | 13 | 0.30 | 1.84E-05 | 2.11E−02 |
| hsa04010: MAPK
signaling pathway | 23 | 0.53 | 3.76E-05 | 4.30E−02 |
| hsa04722:
neurotrophin signaling pathway | 15 | 0.34 | 3.77E-05 | 4.31E−02 |
| hsa04512:
ECM-receptor interaction | 12 | 0.27 | 6.78E-05 | 7.76E−02 |
| hsa04115: p53
signaling pathway | 10 | 0.23 | 2.91E-04 | 3.33E−01 |
| hsa04530:tight
junction | 14 | 0.32 | 3.38E-04 | 3.86E−01 |
| hsa04110: cell
cycle | 13 | 0.30 | 6.31E-04 | 7.20E−01 |
| hsa04660: T cell
receptor signaling pathway | 12 | 0.27 | 6.45E-04 | 7.36E−01 |
| hsa04062:
chemokine signaling pathway | 16 | 0.37 | 9.24E-04 | 1.05E+00 |
| hsa04620:
Toll-like receptor signaling pathway | 11 | 0.25 | 1.41E-03 | 1.61E+00 |
| hsa04662: B cell
receptor signaling pathway | 9 | 0.21 | 2.65E-03 | 2.99E+00 |
| hsa04664: Fc ε RI
signaling pathway | 9 | 0.21 | 3.39E-03 | 3.81E+00 |
| hsa04060:
cytokine-cytokine receptor interaction | 18 | 0.41 | 4.29E-03 | 4.80E+00 |
| hsa04630:Jak-STAT
signaling pathway | 12 | 0.27 | 1.10E-02 | 1.19E+01 |
| hsa04910: insulin
signaling pathway | 11 | 0.25 | 1.14E-02 | 1.22E+01 |
| hsa04210:
apoptosis | 8 | 0.18 | 2.15E-02 | 2.20E+01 |
| hsa04150: mTOR
signaling pathway | 6 | 0.14 | 2.52E-02 | 2.53E+01 |
| hsa04370: VEGF
signaling pathway | 7 | 0.16 | 3.31E-02 | 3.20E+01 |
| KEGG pathways of
the targets regulated by four or more EBV miRNAs |
| hsa04350:
TGF-β signaling pathway | 10 | 0.17 | 1.87E-03 | 2.14E+00 |
| hsa04920:
adipocytokine signaling pathway | 8 | 0.13 | 5.64E-03 | 6.32E+00 |
| hsa00534: heparan
sulfate biosynthesis | 5 | 0.08 | 9.15E-03 | 1.01E+01 |
| hsa04530: tight
junction | 11 | 0.18 | 1.12E-02 | 1.22E+01 |
| hsa04910: insulin
signaling pathway | 11 | 0.18 | 1.18E-02 | 1.28E+01 |
| hsa04520: adherens
junction | 8 | 0.13 | 1.19E-02 | 1.29E+01 |
| hsa04310: Wnt
signaling pathway | 11 | 0.18 | 2.42E-02 | 2.46E+01 |
| hsa04514:
CAMs | 10 | 0.17 | 2.69E-02 | 2.70E+01 |
| hsa05200: pathways
in cancer | 18 | 0.30 | 3.60E-02 | 3.45E+01 |
The targets of the upregulated miRNAs were
significantly enriched in two pathway annotations (P<0.05): the
p53 signaling and the cancer pathways. Among the targets of the
downregulated miRNAs, the most statistically significant pathway
annotations (P<0.05) were cancer pathways, focal adhesion, the
ErbB signaling and the MAPK signaling pathways. Notably, target
genes of both the upregulated and downregulated cellular miRNAs are
involved in the p53 signaling pathway. The target genes of EBV
miRNAs are involved in both the TGF-β and Wnt signaling pathways.
This suggests that these pathways may play important roles in the
development of NPC.
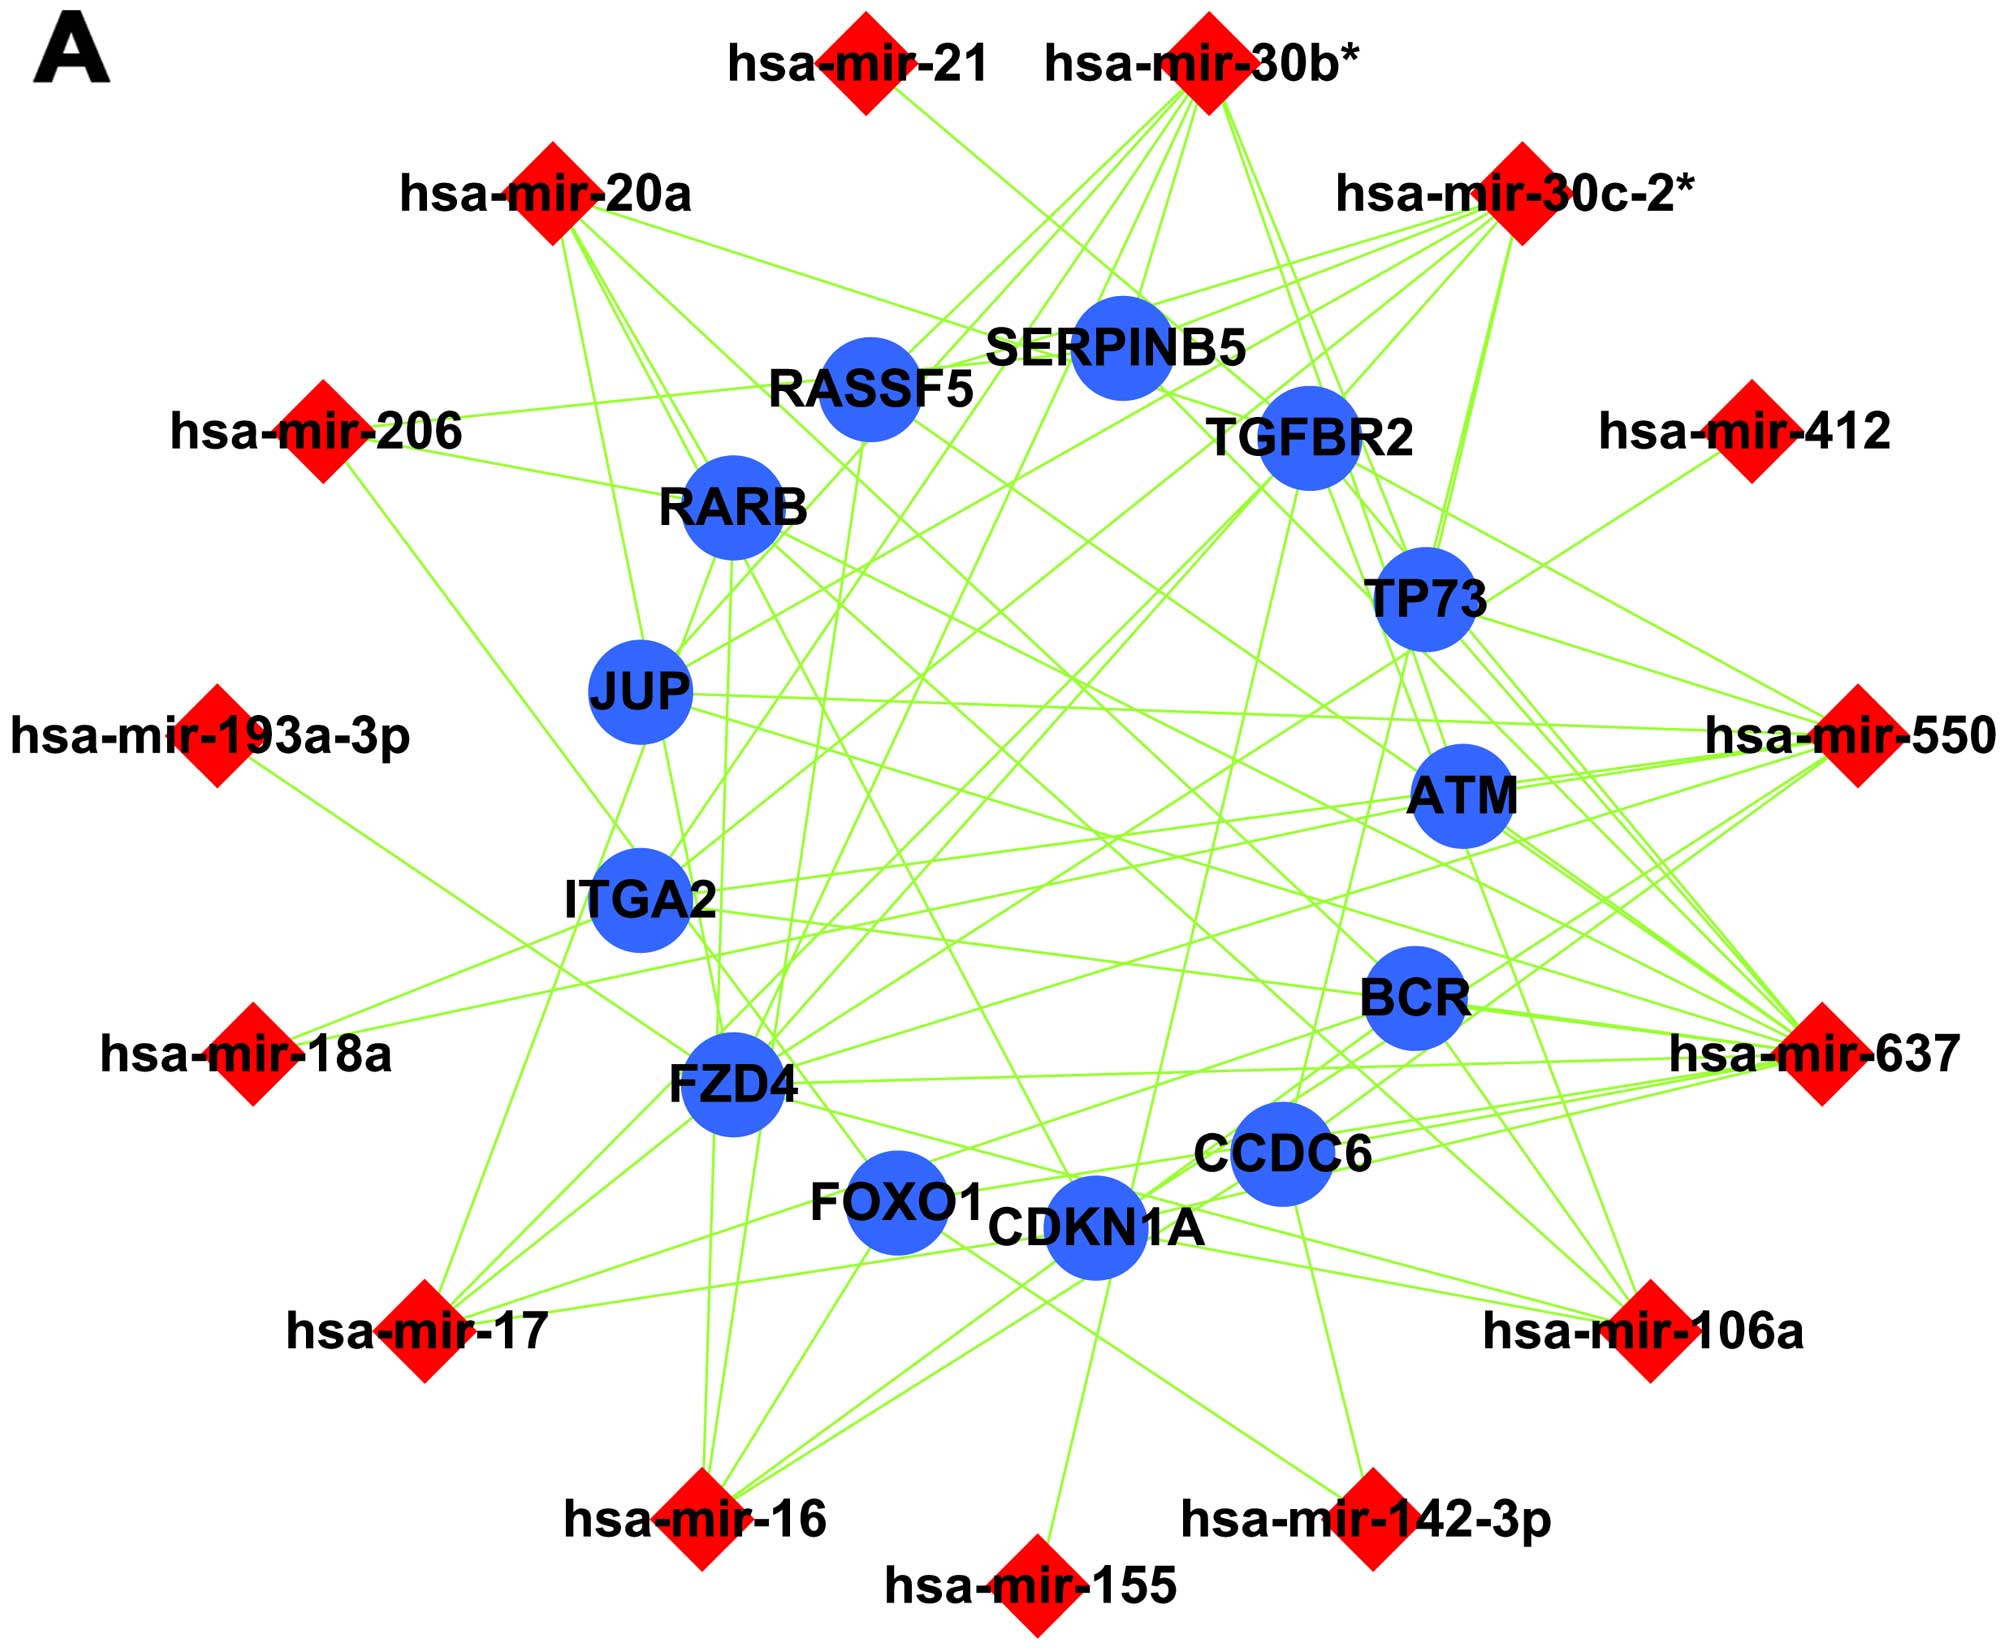
Construction of a cellular miRNA/gene
regulatory network
An miRNA/gene regulatory network was constructed
using miRNA-target gene pairs. In this network, all target genes
were co-regulated by 4 or more miRNAs, enriched in signaling
pathways and their expression was negatively correlated with
cellular miRNA expression. Among the upregulated miRNAs, 15 miRNAs
and 13 target genes were included in a canonical miRNA/gene
regulatory network (Fig. 3A); for
the down-regulated miRNAs, 27 miRNAs and 36 target genes were
included (Fig. 3B).
Establishing an intercross regulatory
network of cellular and EBV miRNAs in NPC
Analyses identified 25 target genes that were
co-regulated by cellular and viral miRNAs and whose expression was
negatively correlated with that of the cellular and viral miRNAs.
As a result, we established a cellular miRNA/viral miRNA/gene
regulatory network in NPC tissues (Fig.
3C). This network combined with the GO and pathway analyses
suggests that cellular and EBV miRNAs may inhibit cell apoptosis
and promote cell proliferation by jointly regulating the expression
of ARHGEF12, SH3GLB1, DHCR24, IGFBP5,
ITGA2, FOXO1 and FZD4.
Discussion
Although the biological effects of many miRNAs have
been individually characterized, the effect of the dysregulation of
multiple miRNAs on cellular functions and in tumors remains largely
unknown. Furthermore, although each miRNA regulates hundreds of
genes, their effect on an individual gene is moderate at best
(45,46). Recent studies suggested that
multiple miRNAs works in concert to regulate targets in a common
pathway (47,48). Therefore, pathway analysis rather
than individual target gene characterization, provides a better
solution for evaluating the biological consequences of global miRNA
dysregulation.
Extensive miRNA profiling has become an important
tool for elucidating their roles in cancer as well as for
identifying biomarkers. To link miRNA profiling data with
biological functions a strategy was developed that analyzes the
functions and pathways that are regulated collectively by
co-expressed miRNAs using computationally predicted targets
(49). However, since all target
prediction algorithms generate a certain number of false positives,
these results significantly reduce the reliability of the data when
the targets predicted for multiple miRNAs are combined to analyze
functional pathways. Therefore, the results of the pathway
enrichment analysis according to co-regulated targets provide a
good insight into the functional role of dysregulated miRNAs.
In the present study, we analyzed both the
expression profiles of both cellular and EBV miRNAs in pooled laser
capture microdissected NPC tissues using microarrays. The analysis
of pooled NPC tissues avoids the large variation that occurs
between samples to help identify bona fide miRNAs and target genes
that are dysregulated in NPCs. In addition, few studies have
performed a systematic analysis of the cellular and EBV miRNA
expression profiles in 20 NPC tissues. Our analyses identified 50
differentially expressed cellular miRNAs and 9 differentially
expressed EBV miRNAs, which regulate a total of 555 and 636 target
genes, respectively. Furthermore, DAVID analysis revealed 37 and 12
pathways that were modulated by cellular and EBV miRNAs in NPC,
respectively. Among these, the cellular miRNAs mainly regulate
pathways involved in apoptosis and cell proliferation, whereas the
EBV miRNAs mainly target genes in the TGF-β and Wnt signaling
pathways. Furthermore, we constructed a cellular and EBV
miRNA/target gene regulatory network (Fig. 3). This global miRNA and target gene
analysis in NPC tissues is important to further understand the
mechanism of NPC carcinogenesis and provide guidance for the
diagnosis and treatment.
Previously, different groups identified a number of
miRNAs that were dysregulated in NPC tissues using microarrays or
RT-PCR, yet there was poor inter-platform consistency (11,32,33,36).
Sengupta et al (11)
analyzed 31 tumor and 10 normal surrounding tissues using
microarrays, and identified 8 cellular miRNAs with ≥5-fold
differential expression between tumor and normal tissues. Chen
et al (32) quantified the
expression of 270 human miRNAs in 13 NPCs and 9 adjacent normal
tissues using RT-PCR, and identified 11 and 24 miRNAs that were
significantly upregulated and down-regulated in NPC samples. Li
et al (36) screened the
miRNA expression changes in 8 NPCs and 4 normal nasopharyngeal
tissues using microarrays, and identified 34 miRNAs that were
expressed differentially in NPC tissues. Luo et al (33) performed miRNA microarrays using 20
different stage NPCs and 6 normal samples, and identified 11 miRNAs
that may mediate the development of NPC. Among these four studies,
only miR-34b and miR-34c were commonly identified as downregulated
in NPC tissues. This poor consistency may be partially attributable
to variations in NPC samples and the different platforms used for
the measurements. Notably, miR-34b and miR-34c were also
significantly downregulated in our pooled NPC tissues (Table III). miR-34 is a downstream target
of p53, and promotes apoptosis (50). The downregulation of miR-34b and
miR-34c strongly suggest that NPC exhibits enhanced cell survival
due to inhibition of apoptosis pathways.
As previously mentioned, Sengupta et al
(11) analyzed only miRNAs with
≥5-fold differential expression between tumor and normal tissues.
They may have excluded some important miRNAs from their dataset.
Therefore, we searched for other miRNAs that were commonly
dysregulated in the remaining three datasets. This revealed that
miR-18a was commonly overexpressed in NPC in these datasets as well
as the present study. miR-18a belongs to the miR-17-92 cluster, and
enhances tumorigenesis by inducing c-Myc expression (51). Similarly, miR-449a was commonly
downregulated in NPC in the current dataset as well as by Chen
et al (32) and Li et
al (36). In addition, let-7b
was downregulated significantly in NPC in the current dataset,
which was consistent with the findings of Li et al (36). Since let-7 targets key cell cycle
proto-oncogenes such as RAS, CDC25a, CDK6, and cyclin D to repress
cell proliferation (52), we
speculate that the downregulation of Let-7 in NPC may play a major
role in tumor growth. Furthermore, miR-200a, miR-200b, and miR-31
were all downregulated in the present study and in the report by
Chen et al (32). The
miR-200 family inhibits NPC cell growth, migration and invasion
(18). miR-31 is a tumor suppressor
gene in breast cancer, and its reduced expression in NPC
contributes to tumorigenesis and metastasis (53). Therefore, miR-18a, miR-449a, Let-7,
the miR-200 family and miR-31 may be commonly dysregulated in NPC,
and play roles in its tumorigenesis, proliferation and
metastasis.
GO analysis found that the cellular miRNAs
upregulated in NPC mainly regulate apoptosis-related genes, whereas
the downregulated miRNAs primarily modulate genes related to cell
proliferation. KEGG pathway analysis demonstrated that the
upregulated miRNAs mainly target the p53 signaling pathway in
cancer, whereas the downregulated miRNAs modulate pathways related
to cancer, focal adhesion, ErbB and MAPK signaling (Table V). Chen et al (32) also observed that miRNAs modulated
apoptosis and survival pathways and enhanced cell cycle progression
and signaling pathways in NPC. Therefore, it is possible that the
upregulated miRNAs such as miR-34b and -34c in NPC inhibit
p53-mediated apoptosis to enhance cell survival; conversely, the
downregulated miRNAs promote cell growth. This may be an important
mechanism for the development of NPCs. Furthermore, we constructed
a cellular miRNA/gene regulatory network, which provides vital
information for the role of miRNAs in the tumorigenesis of
NPCs.
EBV miRNAs are very abundant in NPC, and they may
play important regulatory roles in tumor progression (31). Previously, Wong et al
(39) pooled 5 NPC samples and
identified 29 upregulated EBV-encoded miRNAs in NPC tissues. In the
present study, the 9 EBV miRNAs that were upregulated in 20 NPC
tissues (BART1-5p, BART3, BART4, BART5, BART6, BART7, BART8, BART10
and BART18-3p) were also identified by Wong et al (39). In addition, Zhu et al
(38) reported that EBV-miR-BART4,
BRAT6, and BRAT7 were expressed significantly in NPC samples using
northern blotting. Some of these EBV miRNAs modulate the
transformation, growth and survival of NPC. For example, miR-BART3
targets the DICE1 tumor suppressor to promote cellular growth and
transformation in NPC (54). In
addition, miR-BART5 regulates a cellular protein named
p53-upregulated modulator of apoptosis (PUMA) to modulate host cell
survival (25). miR-BART7 was
proposed as a novel serological biomarker for the diagnosis of NPC
(55). In the present study, KEGG
pathway analysis showed that the upregulated EBV miRNAs mainly
target genes in the TGF-β and Wnt signaling pathways. Both the
TGF-β and Wnt signaling pathways were previously shown to be
dysregulated in NPC (32,56). In addition, the TGF-β signaling
pathway plays a critical role in the progression of human cancer
(57). Activation of the Wnt
signaling pathway in NPC is also associated with NPC development
(58). Therefore, the dysregulation
of EBV miRNAs such as BART3 and BART5 in NPC plays key roles in the
transformation and growth of NPC.
To globally understand the genesis of NPC, we also
established a cellular miRNA/viral miRNA/gene regulatory network in
NPC tissues (Fig. 3C). This network
may help explain how the EBV works with cellular miRNAs to regulate
gene expression and promote the transformation of NPC.
In conclusion, we performed a systematic
characterization of the cellular and EBV miRNA expression profiles
in NPC tissues. Our data suggest that cellular miRNAs such as
miRNA-34b, miRNA-34c, miR-18a and Let-7 mainly target genes
involved in apoptosis and cell proliferation. In addition, we found
that the upregulated EBV miRNAs in NPCs mainly target the TGF-β and
Wnt signaling pathways. These identified cellular and EBV miRNAs
may be potential therapeutic targets for the treatment of NPC. In
addition, we identified 25 target genes that were co-regulated by
cellular and viral miRNAs. Further analysis of this cellular
miRNA/viral miRNA/gene regulatory network may unveil the mechanism
of NPC carcinogenesis.
Acknowledgments
The present study was supported by the National
Natural Science Foundation of China (nos. 81230053, 81172559 and
81272959), the Hunan Provincial Natural Science Foundation of China
(no. 10JJ3045), and the Scientific Research Fund of Hunan
Provincial Education Department (no. 08C566).
Abbreviations:
|
NPC
|
nasopharyngeal carcinoma
|
|
NNET
|
normal nasopharyngeal epithelial
tissue
|
|
EBV
|
Epstein-Barr virus
|
|
GO
|
Gene Ontology
|
|
KEGG
|
Kyoto Encyclopedia of Genes and
Genomes
|
|
LCM
|
laser capture microdissected
|
|
NCBI-GEO
|
National Center for Biotechnology
Information-Gene Expression Omnibus
|
|
qRT-PCR
|
quantitative reverse
transcription-PCR
|
References
|
1
|
Ambros V: The functions of animal
microRNAs. Nature. 431:350–355. 2004. View Article : Google Scholar : PubMed/NCBI
|
|
2
|
Croce CM and Calin GA: miRNAs, cancer, and
stem cell division. Cell. 122:6–7. 2005. View Article : Google Scholar : PubMed/NCBI
|
|
3
|
Bushati N and Cohen SM: microRNA
functions. Annu Rev Cell Dev Biol. 23:175–205. 2007. View Article : Google Scholar : PubMed/NCBI
|
|
4
|
Chen CZ: MicroRNAs as oncogenes and tumor
suppressors. N Engl J Med. 353:1768–1771. 2005. View Article : Google Scholar : PubMed/NCBI
|
|
5
|
Calin GA, Sevignani C, Dumitru CD, Hyslop
T, Noch E, Yendamuri S, Shimizu M, Rattan S, Bullrich F, Negrini M,
et al: Human microRNA genes are frequently located at fragile sites
and genomic regions involved in cancers. Proc Natl Acad Sci USA.
101:2999–3004. 2004. View Article : Google Scholar : PubMed/NCBI
|
|
6
|
Lu J, Getz G, Miska EA, Alvarez-Saavedra
E, Lamb J, Peck D, Sweet-Cordero A, Ebert BL, Mak RH, Ferrando AA,
et al: MicroRNA expression profiles classify human cancers. Nature.
435:834–838. 2005. View Article : Google Scholar : PubMed/NCBI
|
|
7
|
Murakami Y, Yasuda T, Saigo K, Urashima T,
Toyoda H, Okanoue T and Shimotohno K: Comprehensive analysis of
microRNA expression patterns in hepatocellular carcinoma and
non-tumorous tissues. Oncogene. 25:2537–2545. 2006. View Article : Google Scholar
|
|
8
|
Kida Y and Han YP: MicroRNA expression in
colon adenocarcinoma. JAMA. 299:2628–2629. 2008. View Article : Google Scholar : PubMed/NCBI
|
|
9
|
Yanaihara N, Caplen N, Bowman E, Seike M,
Kumamoto K, Yi M, Stephens RM, Okamoto A, Yokota J, Tanaka T, et
al: Unique microRNA molecular profiles in lung cancer diagnosis and
prognosis. Cancer Cell. 9:189–198. 2006. View Article : Google Scholar : PubMed/NCBI
|
|
10
|
Schetter AJ, Leung SY, Sohn JJ, Zanetti
KA, Bowman ED, Yanaihara N, Yuen ST, Chan TL, Kwong DLW, Au GKH, et
al: MicroRNA expression profiles associated with prognosis and
therapeutic outcome in colon adenocarcinoma. JAMA. 299:425–436.
2008. View Article : Google Scholar : PubMed/NCBI
|
|
11
|
Sengupta S, den Boon JA, Chen IH, Newton
MA, Stanhope SA, Cheng YJ, Chen CJ, Hildesheim A, Sugden B and
Ahlquist P: MicroRNA 29c is down-regulated in nasopharyngeal
carcinomas, up-regulating mRNAs encoding extracellular matrix
proteins. Proc Natl Acad Sci USA. 105:5874–5878. 2008. View Article : Google Scholar : PubMed/NCBI
|
|
12
|
Alajez NM, Lenarduzzi M, Ito E, Hui AB,
Shi W, Bruce J, Yue S, Huang SH, Xu W, Waldron J, et al: miR-218
suppresses nasopharyngeal cancer progression through downregulation
of survivin and the SLIT2-ROBO1 pathway. Cancer Res. 71:2381–2391.
2011. View Article : Google Scholar : PubMed/NCBI
|
|
13
|
Lu J, He ML, Wang L, Chen Y, Liu X, Dong
Q, Chen YC, Peng Y, Yao KT, Kung HF, et al: MiR-26a inhibits cell
growth and tumorigenesis of nasopharyngeal carcinoma through
repression of EZH2. Cancer Res. 71:225–233. 2011. View Article : Google Scholar : PubMed/NCBI
|
|
14
|
Yi C, Wang Q, Wang L, Huang Y, Li L, Liu
L, Zhou X, Xie G, Kang T, Wang H, et al: miR-663, a microRNA
targeting p21WAF1/CIP1, promotes the proliferation and
tumorigenesis of nasopharyngeal carcinoma. Oncogene. 31:4421–4433.
2012. View Article : Google Scholar : PubMed/NCBI
|
|
15
|
Wong TS, Man OY, Tsang CM, Tsao SW, Tsang
RK, Chan JY, Ho WK, Wei WI and To VS: MicroRNA let-7 suppresses
naso-pharyngeal carcinoma cells proliferation through
downregulating c-Myc expression. J Cancer Res Clin Oncol.
137:415–422. 2011. View Article : Google Scholar :
|
|
16
|
Zhang L, Deng T, Li X, Liu H, Zhou H, Ma
J, Wu M, Zhou M, Shen S, Li X, et al: microRNA-141 is involved in a
nasopharyngeal carcinoma-related genes network. Carcinogenesis.
31:559–566. 2010. View Article : Google Scholar : PubMed/NCBI
|
|
17
|
Deng M, Tang H, Zhou Y, Zhou M, Xiong W,
Zheng Y, Ye Q, Zeng X, Liao Q, Guo X, et al: miR-216b suppresses
tumor growth and invasion by targeting KRAS in nasopharyngeal
carcinoma. J Cell Sci. 124:2997–3005. 2011. View Article : Google Scholar : PubMed/NCBI
|
|
18
|
Xia H, Ng SS, Jiang S, Cheung WK, Sze J,
Bian XW, Kung HF and Lin MC: miR-200a-mediated downregulation of
ZEB2 and CTNNB1 differentially inhibits nasopharyngeal carcinoma
cell growth, migration and invasion. Biochem Biophys Res Commun.
391:535–541. 2010. View Article : Google Scholar
|
|
19
|
Busson P, Keryer C, Ooka T and Corbex M:
EBV-associated nasopharyngeal carcinomas: From epidemiology to
virus-targeting strategies. Trends Microbiol. 12:356–360. 2004.
View Article : Google Scholar : PubMed/NCBI
|
|
20
|
Wei WI and Sham JS: Nasopharyngeal
carcinoma. Lancet. 365:2041–2054. 2005. View Article : Google Scholar : PubMed/NCBI
|
|
21
|
Qiu J, Cosmopoulos K, Pegtel M, Hopmans E,
Murray P, Middeldorp J, Shapiro M and Thorley-Lawson DA: A novel
persistence associated EBV miRNA expression profile is disrupted in
neoplasia. PLoS Pathog. 7:e10021932011. View Article : Google Scholar : PubMed/NCBI
|
|
22
|
Barth S, Meister G and Grässer FA:
EBV-encoded miRNAs. Biochim Biophys Acta. 1809:631–640. 2011.
View Article : Google Scholar : PubMed/NCBI
|
|
23
|
Xia T, O'Hara A, Araujo I, Barreto J,
Carvalho E, Sapucaia JB, Ramos JC, Luz E, Pedroso C, Manrique M, et
al: EBV microRNAs in primary lymphomas and targeting of CXCL-11 by
ebv-mir-BHRF1-3. Cancer Res. 68:1436–1442. 2008. View Article : Google Scholar : PubMed/NCBI
|
|
24
|
Nachmani D, Stern-Ginossar N, Sarid R and
Mandelboim O: Diverse herpesvirus microRNAs target the
stress-induced immune ligand MICB to escape recognition by natural
killer cells. Cell Host Microbe. 5:376–385. 2009. View Article : Google Scholar : PubMed/NCBI
|
|
25
|
Choy EY, Siu KL, Kok KH, Lung RW, Tsang
CM, To KF, Kwong DL, Tsao SW and Jin DY: An Epstein-Barr
virus-encoded microRNA targets PUMA to promote host cell survival.
J Exp Med. 205:2551–2560. 2008. View Article : Google Scholar : PubMed/NCBI
|
|
26
|
Li Z, Chen X, Li L, Liu S, Yang L, Ma X,
Tang M, Bode AM, Dong Z, Sun L, et al: EBV encoded miR-BHRF1-1
potentiates viral lytic replication by downregulating host p53 in
nasopharyngeal carcinoma. Int J Biochem Cell Biol. 44:275–279.
2012. View Article : Google Scholar
|
|
27
|
Lo AK, To KF, Lo KW, Lung RW, Hui JW, Liao
G and Hayward SD: Modulation of LMP1 protein expression by
EBV-encoded microRNAs. Proc Natl Acad Sci USA. 104:16164–16169.
2007. View Article : Google Scholar : PubMed/NCBI
|
|
28
|
Barth S, Pfuhl T, Mamiani A, Ehses C,
Roemer K, Kremmer E, Jäker C, Höck J, Meister G and Grässer FA:
Epstein-Barr virus-encoded microRNA miR-BART2 down-regulates the
viral DNA polymerase BALF5. Nucleic Acids Res. 36:666–675. 2008.
View Article : Google Scholar :
|
|
29
|
Lung RWM, Tong JHM, Sung YM, Leung PS, Ng
DCH, Chau SL, Chan AWH, Ng EKO, Lo KW and To KF: Modulation of
LMP2A expression by a newly identified Epstein-Barr virus-encoded
microRNA miR-BART22. Neoplasia. 11:1174–1184. 2009. View Article : Google Scholar : PubMed/NCBI
|
|
30
|
Lo AK, Dawson CW, Jin DY and Lo KW: The
pathological roles of BART miRNAs in nasopharyngeal carcinoma. J
Pathol. 227:392–403. 2012. View Article : Google Scholar : PubMed/NCBI
|
|
31
|
Marquitz AR and Raab-Traub N: The role of
miRNAs and EBV BARTs in NPC. Semin Cancer Biol. 22:166–172. 2012.
View Article : Google Scholar :
|
|
32
|
Chen HC, Chen GH, Chen YH, Liao WL, Liu
CY, Chang KP, Chang YS and Chen SJ: MicroRNA deregulation and
pathway alterations in nasopharyngeal carcinoma. Br J Cancer.
100:1002–1011. 2009. View Article : Google Scholar : PubMed/NCBI
|
|
33
|
Luo Z, Zhang L, Li Z, Li X, Li G, Yu H,
Jiang C, Dai Y, Guo X, Xiang J, et al: An in silico analysis of
dynamic changes in microRNA expression profiles in stepwise
development of nasopharyngeal carcinoma. BMC Med Genomics. 5:32012.
View Article : Google Scholar : PubMed/NCBI
|
|
34
|
Liu N, Chen NY, Cui RX, Li WF, Li Y, Wei
RR, Zhang MY, Sun Y, Huang BJ, Chen M, et al: Prognostic value of a
microRNA signature in nasopharyngeal carcinoma: A microRNA
expression analysis. Lancet Oncol. 13:633–641. 2012. View Article : Google Scholar : PubMed/NCBI
|
|
35
|
Zeng X, Xiang J, Wu M, Xiong W, Tang H,
Deng M, Li X, Liao Q, Su B, Luo Z, et al: Circulating miR-17,
miR-20a, miR-29c, and miR-223 combined as non-invasive biomarkers
in nasopharyngeal carcinoma. PLoS One. 7:e463672012. View Article : Google Scholar : PubMed/NCBI
|
|
36
|
Li T, Chen JX, Fu XP, Yang S, Zhang Z,
Chen KhH and Li Y: microRNA expression profiling of nasopharyngeal
carcinoma. Oncol Rep. 25:1353–1363. 2011.PubMed/NCBI
|
|
37
|
Chen SJ, Chen GH, Chen YH, Liu CY, Chang
KP, Chang YS and Chen HC: Characterization of Epstein-Barr virus
miRNAome in nasopharyngeal carcinoma by deep sequencing. PLoS One.
5:e127452010. View Article : Google Scholar : PubMed/NCBI
|
|
38
|
Zhu JY, Pfuhl T, Motsch N, Barth S,
Nicholls J, Grässer F and Meister G: Identification of novel
Epstein-Barr virus microRNA genes from nasopharyngeal carcinomas. J
Virol. 83:3333–3341. 2009. View Article : Google Scholar : PubMed/NCBI
|
|
39
|
Wong AM, Kong KL, Tsang JW, Kwong DL and
Guan XY: Profiling of Epstein-Barr virus-encoded microRNAs in
nasopharyngeal carcinoma reveals potential biomarkers and oncomirs.
Cancer. 118:698–710. 2012. View Article : Google Scholar
|
|
40
|
Cheng AL, Huang WG, Chen ZC, Peng F, Zhang
PF, Li MY, Li F, Li JL, Li C, Yi H, et al: Identification of novel
biomarkers for differentiation and prognosis of nasopharyngeal
carcinoma by laser capture microdissection and proteomic analysis.
Clin Cancer Res. 14:435–445. 2008. View Article : Google Scholar : PubMed/NCBI
|
|
41
|
Elefant N, Berger A, Shein H, Hofree M,
Margalit H and Altuvia Y: RepTar: A database of predicted cellular
targets of host and viral miRNAs. Nucleic Acids Res. 39:D188–D194.
2011. View Article : Google Scholar :
|
|
42
|
Maragkakis M, Reczko M, Simossis VA,
Alexiou P, Papadopoulos GL, Dalamagas T, Giannopoulos G, Goumas G,
Koukis E, Kourtis K, et al: DIANA-microT web server: Elucidating
microRNA functions through target prediction. Nucleic Acids Res.
37:W273–W276. 2009. View Article : Google Scholar : PubMed/NCBI
|
|
43
|
Yang JH, Li JH, Shao P, Zhou H, Chen YQ
and Qu LH: starBase: A database for exploring microRNA-mRNA
interaction maps from Argonaute CLIP-Seq and Degradome-Seq data.
Nucleic Acids Res. 39:D202–D209. 2011. View Article : Google Scholar
|
|
44
|
Kim H, Park S, Min H and Yoon S: vHoT: A
database for predicting interspecies interactions between viral
microRNA and host genomes. Arch Virol. 157:497–501. 2012.
View Article : Google Scholar
|
|
45
|
Baek D, Villén J, Shin C, Camargo FD, Gygi
SP and Bartel DP: The impact of microRNAs on protein output.
Nature. 455:64–71. 2008. View Article : Google Scholar : PubMed/NCBI
|
|
46
|
Selbach M, Schwanhäusser B, Thierfelder N,
Fang Z, Khanin R and Rajewsky N: Widespread changes in protein
synthesis induced by microRNAs. Nature. 455:58–63. 2008. View Article : Google Scholar : PubMed/NCBI
|
|
47
|
Cloonan N, Brown MK, Steptoe AL, Wani S,
Chan WL, Forrest AR, Kolle G, Gabrielli B and Grimmond SM: The
miR-17-5p microRNA is a key regulator of the G1/S phase cell cycle
transition. Genome Biol. 9:R1272008. View Article : Google Scholar : PubMed/NCBI
|
|
48
|
Liu Q, Fu H, Sun F, Zhang H, Tie Y, Zhu J,
Xing R, Sun Z and Zheng X: miR-16 family induces cell cycle arrest
by regulating multiple cell cycle genes. Nucleic Acids Res.
36:5391–5404. 2008. View Article : Google Scholar : PubMed/NCBI
|
|
49
|
Gusev Y, Schmittgen TD, Lerner M, Postier
R and Brackett D: Computational analysis of biological functions
and pathways collectively targeted by co-expressed microRNAs in
cancer. BMC Bioinformatics. 8(Suppl 7): S162007. View Article : Google Scholar : PubMed/NCBI
|
|
50
|
Chang TC, Wentzel EA, Kent OA,
Ramachandran K, Mullendore M, Lee KH, Feldmann G, Yamakuchi M,
Ferlito M, Lowenstein CJ, et al: Transactivation of miR-34a by p53
broadly influences gene expression and promotes apoptosis. Mol
Cell. 26:745–752. 2007. View Article : Google Scholar : PubMed/NCBI
|
|
51
|
Dews M, Homayouni A, Yu D, Murphy D,
Sevignani C, Wentzel E, Furth EE, Lee WM, Enders GH, Mendell JT, et
al: Augmentation of tumor angiogenesis by a Myc-activated microRNA
cluster. Nat Genet. 38:1060–1065. 2006. View Article : Google Scholar : PubMed/NCBI
|
|
52
|
Johnson CD, Esquela-Kerscher A, Stefani G,
Byrom M, Kelnar K, Ovcharenko D, Wilson M, Wang X, Shelton J,
Shingara J, et al: The let-7 microRNA represses cell proliferation
pathways in human cells. Cancer Res. 67:7713–7722. 2007. View Article : Google Scholar : PubMed/NCBI
|
|
53
|
O'Day E and Lal A: MicroRNAs and their
target gene networks in breast cancer. Breast Cancer Res.
12:2012010. View Article : Google Scholar : PubMed/NCBI
|
|
54
|
Lei T, Yuen KS, Xu R, Tsao SW, Chen H, Li
M, Kok KH and Jin DY: Targeting of DICE1 tumor suppressor by
Epstein-Barr virus-encoded miR-BART3* microRNA in nasopharyngeal
carcinoma. Int J Cancer. 133:79–87. 2013. View Article : Google Scholar : PubMed/NCBI
|
|
55
|
Zhang G, Zong J, Lin S, Verhoeven RJ, Tong
S, Chen Y, Ji M, Cheng W, Tsao SW, Lung M, et al: Circulating
Epstein-Barr virus microRNAs miR-BART7 and miR-BART13 as biomarkers
for nasopharyngeal carcinoma diagnosis and treatment. Int J Cancer.
136:E301–E312. 2015. View Article : Google Scholar
|
|
56
|
Zeng ZY, Zhou YH, Zhang WL, Xiong W, Fan
SQ, Li XL, Luo XM, Wu MH, Yang YX, Huang C, et al: Gene expression
profiling of nasopharyngeal carcinoma reveals the abnormally
regulated Wnt signaling pathway. Hum Pathol. 38:120–133. 2007.
View Article : Google Scholar
|
|
57
|
Meulmeester E and Ten Dijke P: The dynamic
roles of TGF-β in cancer. J Pathol. 223:205–218. 2011. View Article : Google Scholar
|
|
58
|
Chou J, Lin YC, Kim J, You L, Xu Z, He B
and Jablons DM: Nasopharyngeal carcinoma - review of the molecular
mechanisms of tumorigenesis. Head Neck. 30:946–963. 2008.
View Article : Google Scholar : PubMed/NCBI
|