Introduction
Histone deacetylases (HDACs) are enzymes involved in
transcriptional repression mainly through removal of acetyl groups
from the positively charged histone tails and allowing histones to
wrap the DNA tightly. In addition to deacetylating histones, they
also deacetylate non-histone proteins, resulting in protein
degradation via the ubiquitin-proteasome pathway (1). HDACs exist as components in
multiprotein complexes with transcriptional co-repressors, such as
mSin3, N-CoR and SMRT (2). These
complexes target specific genomic regions by interacting with DNA
binding factors such as transcription factors, nuclear receptors,
methyl-binding proteins, DNA methyl transferases and histone
methyltransferases.
In mammals, there are 18 known HDAC homologs,
subdivided into classes I, IIa, IIb, III and IV (3). HDAC1 was the first identified
mammalian HDAC and is considered the prototype of the HDAC family.
It belongs to class I of HDACs and shares 83% amino acid identity
with another class I member, HDAC2 (4). Both HDAC1 and HDAC2 have almost
identical genomic organization and this indicates that they have
arisen from relatively recent gene duplication and probably share
similar biological functions. They are ubiquitously expressed in
many tissues and since they lack nuclear export signals, they are
found exclusively in the nucleus (5). Despite having some overlapping
biological functions, HDAC1 and HDAC2 also have distinct and even
opposing biological functions. For example, the deletion of HDAC1
alone is lethal in mouse embryos (6). There is also evidence for distinct
functions of HDACs in cancer cells. HDAC2, but not HDAC1, can
inhibit proliferation and induce senescence in MCF7 breast cancer
cells (7). In addition, cellular
responses to growth factors appear to be specific to different
HDACs - silencing of HDAC1 suppresses transforming growth factor
(TGF) β1-induced apoptosis while silencing of HDAC2 increases
spontaneous apoptosis and enhances TGF β1-induced apoptosis in
AML12 murine hepatocytes due to opposing effects on
extracellular-regulated kinase (ERK)1/2 (8).
Recent studies have shown elevated expression of
class I HDACs in solid human tumors (9). HDAC1 and HDAC2 physically associate
with an N-terminally truncated form of p63 (ΔNp63α) to repress the
transcription of pro-apoptotic genes in squamous cell carcinoma
(10). In this study, we
demonstrate that HDAC1 and HDAC2 are upregulated in hepatocellular
carcinoma (HCC) tissues compared to matched adjacent non-tumor
controls. This is consistent with previous studies that show
upregulation of HDAC1 and HDAC2 in hepatocellular cancer (11) and other cancers (12–14).
HCC is the most common form of liver cancer,
accounting for 85 to 90% of all primary liver cancers (15) and liver cancer is the fifth most
common cancer worldwide, with an alarming 748,300 new cases and
695,900 cancer deaths in 2008 (16). Current treatment for HCC includes
surgical resection of the tumor, liver transplantation, and
chemotherapy, but each has its own problems and limitations
(17–20). The use of HDAC inhibitors to target
solid tumors such as HCC is still at an early stage of development.
HDAC inhibitors are thought to function by reversing the aberrant
epigenetic states of cancer cells. Although the effects of pan-HDAC
inhibitors have been widely studied, not much is known of the
differing roles of the various HDAC homologs in cancer. In this
study, we aimed to evaluate the prognostic significance of HDAC1
and HDAC2 gene expression in HCC by applying a competing risk
approach.
Materials and methods
Patients and tissue samples
HCC tumor samples, matched adjacent non-tumor
hepatic tissues and clinical data from 156 patients who underwent
curative surgical resection between 1989 and 2009 were obtained
from the Department of Pathology, National University Hospital of
Singapore (NUH). This study was approved by the National University
of Singapore (NUS)-Institutional Review Board (IRB 09-112).
Tissue microarray and
immunohistochemistry
The tissues were deparaffinized and rehydrated
before antigen retrieval was performed by heating the sections for
30 min in antigen unmasking solution (Vector Laboratories Inc.,
Burlingame, CA, USA) using the microwave oven. The sections were
then treated with 3% hydrogen peroxide, washed in
phosphate-buffered saline with Tween-20 (PBST) (1X PBS, 0.1%
Tween-20), and incubated with primary antibodies overnight at 4°C.
Rabbit polyclonal antibody against HDAC1 from Abcam Inc.
(Cambridge, MA, USA) was used at a 1:8,000 dilution, while rabbit
polyclonal antibody against HDAC2 from Santa Cruz Biotechnology,
Inc. (Santa Cruz, CA, USA) was used at a 1:200 dilution. Sections
were then washed and incubated with a goat anti-rabbit IgG
conjugated with avidin-biotinylated horseradish peroxidase (Dako,
Glostrup, Denmark), before final washing and incubation for 1 min
with DAB substrate. Counterstaining was conducted using hematoxylin
solution (Sigma-Aldrich, St. Louis, MO, USA).
Scoring of the tissue microarray
Each sample on the tissue microarray slides was
scored based on the intensity of HDAC staining in the nuclei of the
hepatocytes, as the presence of nuclear HDACs is relevant to their
transcription-modifying activities. A score of 0 indicated no
staining while a score of 1, 2 and 3 represented low, moderate and
intense staining respectively.
Statistical analysis
The deceased and living status of patients was
determined using the in-house hospital database as well as the
registry of births and deaths, while the recurrence status was
determined using the in-house hospital database. Results are
expressed as mean ± SD for continuous variables or percentages for
dichotomous variables.
As for descriptive statistics, overall frequencies
and distribution of demographic and clinicopathological parameters
by HDAC1 and HDAC2 expression status were calculated by either 2 by
2 or 2 by K tables with Chi-squared test and Fisher's exact test
with the frequency weights (fweights) option to take into account
duplicated observations of tumors and adjacent non-tumor. And two
sample mean comparison test between biomarkers positive and
negative statuses were made using ANCOVA test with the frequency
weights (fweights) option to take into account duplicated
observations of tumors and adjacent non-tumor. The comparisons
between HDAC1 and HDAC2 expression status between tumor and
non-tumor tissue were made using McNemar test. The presence of
HDAC1 expression in tumor and non-tumor tissue was identified using
the cut-off score value of ≥1, and no expression of HDAC1 in tumor
and non-tumor score was identified using '0' and treated as a
reference group. In addition, the levels of HDAC1 expression in
tumor and non-tumor tissue were identified as low level of
expression with a score cut-off 0 to 1 point, and identified as
high level of expression with a score cut-off >2 points in tumor
and non-tumor tissues. Similar comparisons were applied to the
HDAC2 gene expression.
Associations of HDAC1 and HDAC2 gene expression with
disease-specific mortality and recurrence were assessed using
standard univariate and multivariate Cox proportional hazard model
with robust standard error estimates to allow for intragroup
correlation for tumor and adjacent non-tumor tissue measurements in
the same patient. Kaplan-Meier's survival curves with log-rank
tests for comparisons of survival curves were also constructed. The
duration of follow-up in this study was 10 years with median
survival time of 6.96 (95% CI, 4.85–7.46).
Standard Cox proportional hazards model, which
assumes that the hazard ratio is constant over time, was applied
initially. The proportionality assumption of the Cox regression
model was assessed graphically and with the use of Schoenfeld
residuals (21–22) using 'estat phtest' STATA command
after fitting a model with stcox. However, violations of the Cox
proportional hazards assumption were observed for both HDAC1 and
HDAC2 gene expression in tumor and non-tumor tissue to predict
mortality and disease-free survival (DFS), as discussed in the
Results section below. Hence, the competing risk regression model
was used to estimate the impact of HDAC1 and HDAC2 expression (as
main covariates of interest) on the probability of mortality due to
HCC, in which disease recurrence was treated as a competing event.
Similarly, death due to HCC was treated as a competing event when
estimating the impact of HDAC1 and HDAC2 expression on the
probability of recurrence due to HCC. The results (effect sizes)
are expressed as sub-hazard ratios (SHR). In addition, we adjusted
for various demographic, clinicopathological factors, including
tumor staging. The crude cumulative probability of mortality while
accounting for the dependence of the cumulative probability
function (CPF) on the hazards of other competing event (i.e.,
disease recurrence) was calculated. We then compared the resulting
curves between two groups based on the absence vs. presence of
HDAC2 expression in tumor and non-tumor tissue. With the same
approach, we also compared the resulting curves between two groups
based on low expression (score of 0–1) vs. high expression (score
of ≥2) of HDAC1 in tumor and non-tumor tissue.
All statistical analyses were performed using Stata
statistical software (version 11.1; StataCorp LP, College Station,
TX, USA).
Cell lines
The human colon cancer cell line, HCT116, and human
hepatocarcinoma cell lines, HEP3B, HEPG2 and PLC5, were purchased
from the American Type Culture Collection (ATCC; Rockville, MD,
USA). The HCT116 cells were cultured in McCoy's 5A (Sigma-Aldrich)
medium supplemented with 10% fetal bovine serum (Gibco, Grand
Island, NY, USA). The HEP3B, HEPG2 and PLC5 cells were cultured in
Dulbecco's modified Eagle's medium (DMEM; Sigma-Aldrich)
supplemented with 10% fetal bovine serum (Gibco). The cells were
maintained in an incubator at 37°C in a 5% CO2
humidified atmosphere.
Transfection
Twenty-four hours before transfection, the cells
were counted and plated. Twenty picomoles of Invitrogen's Stealth
Select siRNA (a pool of three different sequences targeting the
same gene) or universal control siRNA with matching percentage GC
content and Lipofectamine RNAiMax reagent (Invitrogen) was used
according to the manufacturer's instructions. The siRNA sequences
along the HDAC1 mRNA sequence (5′–3′) were: aacgaauugccugugaggaa
gaguu (siRNA 1A), gcaugacucauaauuugcugcucaa (siRNA 1B), and
caguauucgauggccuguuugaguuc (siRNA 1C). The siRNA sequences along
the HDAC2 mRNA sequence (5′–3′) were: ucu aacagucaaaggucaugcuaaa
(siRNA 2A), gaagauccagacaagagaa uuucua (siRNA 2B), and
ggugauggagauguaucaaccuagu (siRNA 2C).
Cell cycle analysis
Cells were washed in 1X PBS, trypsinized, and
collected. Both the live adherent and dead floating cells were
collected and pelleted at 2,500 rpm for 5 min at 4°C. They were
washed in 1X PBS, fixed in cold 70% ethanol and stored in −20°C for
overnight. The fixed cells were centrifuged at 2,500 rpm for 5 min
at 4°C and washed once in 1X PBS. They were then resuspended in 500
µl propidium iodide (PI) staining solution (0.1% Triton
X-100, 0.2 mg/ml RNaseA, 0.02 mg/ml PI, in 1X PBS) and incubated
for 15 min at 37°C in the dark. The PI-stained cells were filtered
through a 40-µm filter before passing through a Beckman
Coulter Epics Altra at the Flow Cytometry Unit at the National
University Medical Institute. Ten thousand cells were analyzed for
each sample to generate a cell cycle profile. Analysis was carried
out using WinMDI software.
WST-1 cell proliferation assay
To measure cell proliferation, the colorimetric
assay was performed using WST-1 reagent (Roche Applied Science,
Indianapolis, IN, USA). Twelve hours post-transfection, the cells
were trypsinized, counted and replated at 500 cells/well in a
96-well plate. Twenty-four hours after replating, 10 µl of
WST-1 reagent was added to each well containing 100 µl of
media. The plate was returned to the incubator for 4 h before the
absorbance was read at 460 nm using a spectrophotometer. A 'blank'
well with only the media and WST-1 reagent but without cells was
used as negative control.
Colony formation assay
Between 24 to 48 h after transfection or drug
treatment, cells were harvested, counted and plated in triplicate
at 1,000 cells/well in a 6-well plate. After 10 to 14 days, the
wells were washed in 1X PBS and the colonies were stained with
crystal violet solution. The plates were then scanned and the
images were analyzed using the ImageJ (NIH) software to measure the
number of colonies formed in each well.
Results
Expression of HDAC1 and HDAC2 in HCC
tissues and correlation with clinicopathological parameters
Immunohistochemistry was performed on a tissue
microarray constructed from 156 pairs of HCC tissues and their
matched adjacent non-tumor tissues to examine the expression of
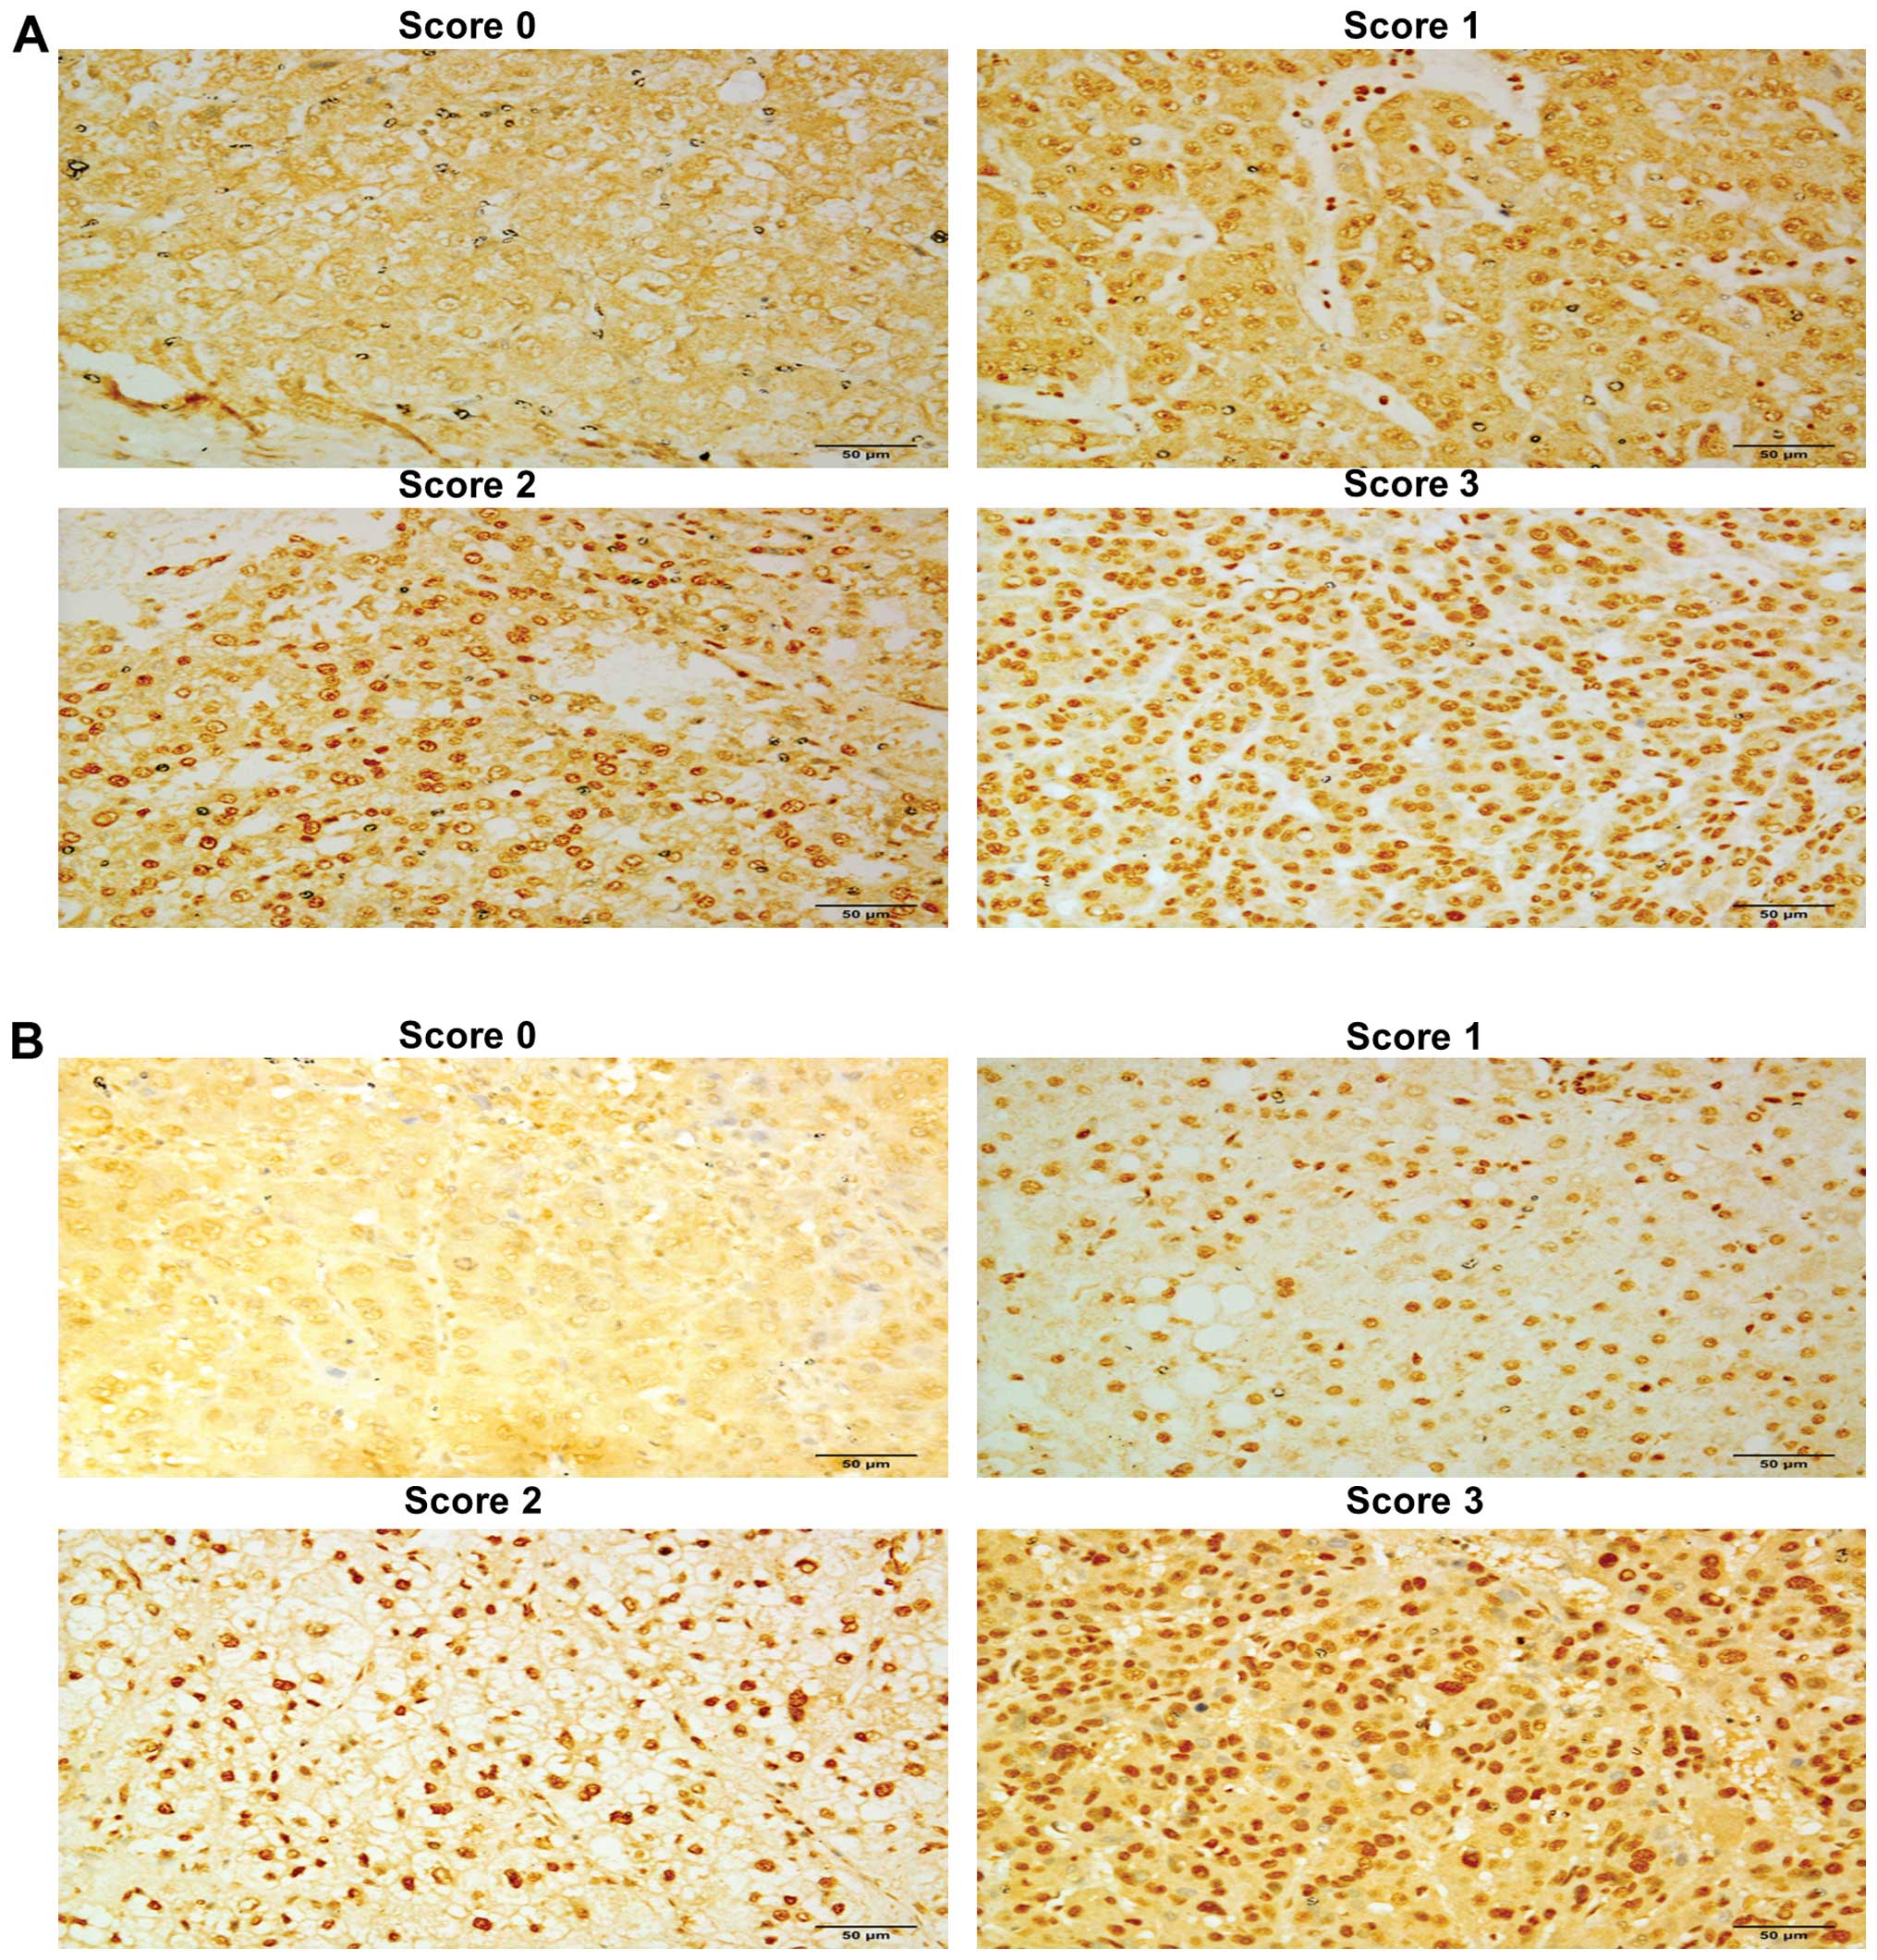
HDAC1 and HDAC2. Scoring was based on the HDAC staining intensity
of the hepatocyte nuclei, where HDACs are known to function, with 0
being undetectable and 3 being the most intensely stained. An
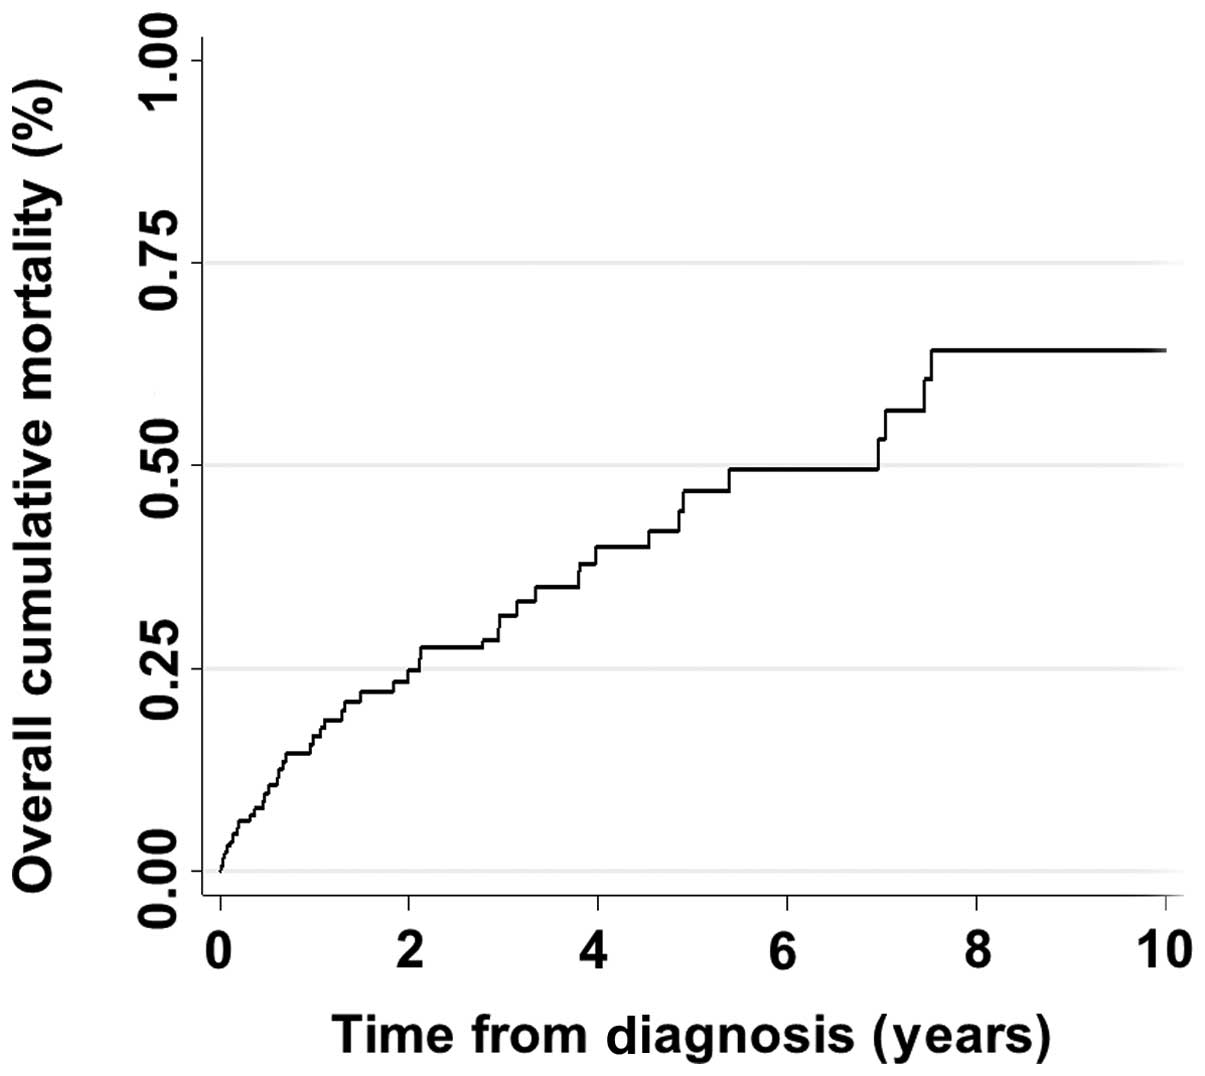
IgG-isotype antibody was used as the negative control. The overall
cumulative mortality rate of patients is shown in Fig. 1. The scoring intensities for HDAC1
and HDAC2 in tumor tissues are shown in Fig. 2, respectively, and the scoring
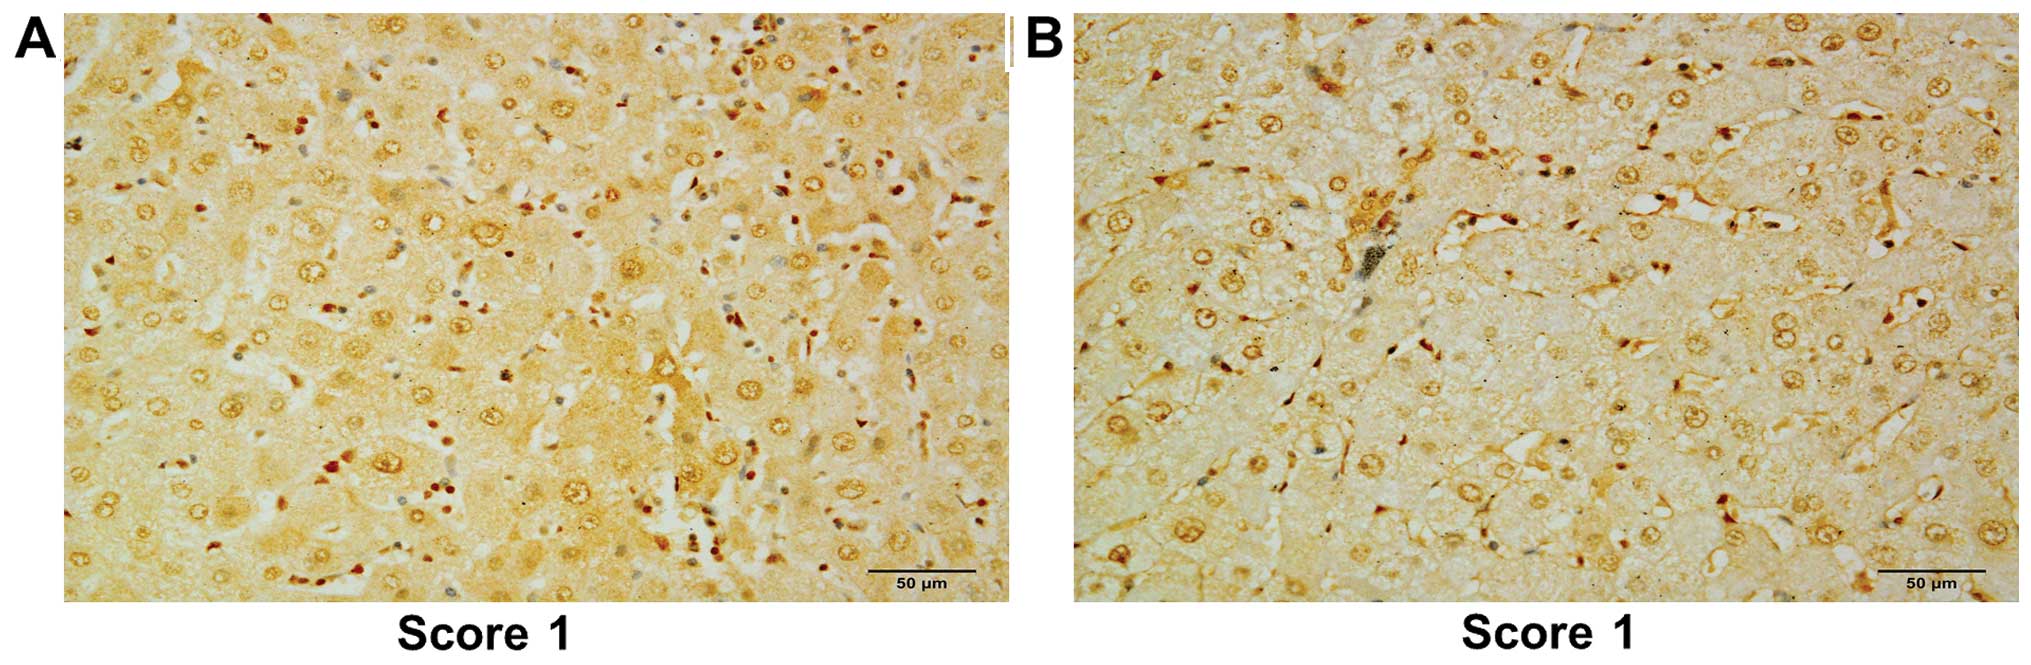
intensities for the respective non-tumor tissues are shown in
Fig. 3. The overall frequencies and
distribution of demographic and clinicopathological parameters by
status of HDAC1 and HDAC2 expression status are shown in Table 1A and B.
 | Table IOverall frequencies and distribution
of demographic and clinicopathological parameters by HDAC1 and
HDAC2 expression status. |
Table I
Overall frequencies and distribution
of demographic and clinicopathological parameters by HDAC1 and
HDAC2 expression status.
A, HDAC1 status and
patient parameters
|
|---|
| Variables | HDAC1(−) | HDAC1(+) | P-value |
|---|
| Age, mean (±
SD) | 57.81 (±13.02) | 58.27 (±13.24) | 0.8219 |
| Gender, n (%) |
| Female | 4 (10.81) | 26 (21.85) | 0.137 |
| Male | 33 (89.19) | 93 (78.15) | |
| Race, n (%) |
| Non-Chinese | 29 (78.38) | 90 (76.27) | 0.791 |
| Chinese | 8 (21.62) | 28 (23.73) | |
| Smoking, n (%) |
| Non-smoker | 21 (58.33) | 60 (61.86) | 0.711 |
| Smoker | 15 (41.67) | 37 (38.14) | |
| Alcohol, n (%) |
| Non-drinker | 21 (58.33) | 62 (60.78) | 0.796 |
| Drinker | 15 (41.67) | 40 (39.22) | |
| HBV status, n
(%) |
| Non-carrier | 13 (36.11) | 41 (35.04) | 0.907 |
| Carrier | 23 (63.89) | 76 (64.96) | |
| HCV status, n
(%) |
| Non-carrier | 34 (91.89) | 112 (94.92) | 0.493 |
| Carrier | 3 (8.11) | 6 (5.08) | |
| Liver capsule, n
(%) |
| Absence | 0 | 3 (4.55) | 0.570 |
| Presence | 22 (100) | 63 (95.45) | |
| Satellite nodules,
n (%) |
| Absence | 35 (94.59) | 104 (87.39) | 0.364 |
| Presence | 2 (5.41) | 15 (12.61) | |
| Multiple lesions, n
(%) |
| No | 29 (78.38) | 104 (87.39) | 0.177 |
| Yes | 8 (21.62) | 15 (12.61) | |
| Histological grade,
n (%)(differentiation) |
| Well | 13 (38.24) | 18 (17.14) | 0.028 |
| Moderate | 16 (47.06) | 73 (69.52) | |
| Poor | 5 (14.71) | 14 (13.33) | |
| Lymphatic invasion,
n (%) |
| No | 11 (91.67) | 57 (85.07) | 1.000 |
| Yes | 1 (8.33) | 10 (14.93) | |
| Vascular invasion,
n (%) |
| No | 19 (65.52) | 67 (64.42) | 0.913 |
| Yes | 10 (34.48) | 37 (35.58) | |
| Cirrhosis, n
(%) |
| No | 16 (43.24) | 63 (52.94) | 0.303 |
| Yes | 21 (56.76) | 56 (47.06) | |
| Tumor stage, n
(%) |
| Stage 1 | 16 (44.44) | 60 (50.42) | 0.559 |
| Stage 2 | 14 (38.89) | 35 (29.41) | |
| Stage 3 and
above | 6 (16.67) | 24 (20.17) | |
| AFP | 1,544.24
(±9,235.63) | 3,149.28
(±5,784.32) | 0.5184 |
| CEA | 3.60 (±2.88) | 2.75 (±2.54) | 0.2939 |
B, HDAC2 status and
patient parameters
|
|---|
| Variables | HDAC2(−) | HDAC2(+) | P-value |
|---|
| Age, mean (±
SD) | 56.09 (±13.53) | 58.69 (±12.97) | 0.961 |
| Gender, n (%) |
| Female | 1 (10) | 29 (19.86) | 0.688 |
| Male | 9 (90) | 117 (80.14) | |
| Race, n (%) |
| Non-Chinese | 8 (80) | 111 (76.55) | 1.000 |
| Chinese | 2 (20) | 34 (23.45) | |
| Smoking, n (%) |
| Non-smoker | 6 (60) | 75 (60.98) | 1.000 |
| Smoker | 4 (40) | 48 (39.02) | |
| Alcohol, n (%) |
| Non-drinker | 7 (70) | 76 (59.38) | 0.740 |
| Drinker | 3 (30) | 52 (40.63) | |
| HBV status, n
(%) |
| Non-carrier | 1 (10) | 53 (37.06) | 0.099 |
| Carrier | 9 (90) | 90 (62.94) | |
| HCV status, n
(%) |
| Non-carrier | 10 (100) | 136 (93.79) | 1.000 |
| Carrier | 0 | 9 (6.21) | |
| Liver capsule, n
(%) |
| Absence | 1 (33.33) | 2 (2.35) | 0.100 |
| Presence | 2 (66.67) | 83 (97.65) | |
| Satellite nodules,
n (%) |
| Absence | 10 (100) | 129 (88.36) | 0.602 |
| Presence | 0 | 17 (11.64) | |
| Multiple lesions, n
(%) |
| No | 8 (80) | 125 (85.62) | 0.643 |
| Yes | 2 (20) | 21 (14.38) | |
| Histological grade,
n (%)(differentiation) |
| Well | 3 (33.33) | 28 (21.54) | 0.222 |
| Moderate | 6 (66.67) | 83 (63.85) | |
| Poor | 0 | 19 (14.62) | |
| Lymphatic
invasion,n (%) |
| No | 2 (100) | 66 (85.71) | 1.000 |
| Yes | 0 | 11 (14.29) | |
| Vascular invasion,
n (%) |
| No | 4 (57.14) | 82 (65.08) | |
| Yes | 3 (42.86) | 44 (34.92) | |
| Cirrhosis, n
(%) |
| No | 3 (30) | 76 (52.05) | 0.207 |
| Yes | 7 (70) | 70 (47.95) | |
| Tumor stage, n
(%) |
| Stage 1 | 4 (40) | 72 (49.66) | 0.416 |
| Stage 2 | 5 (50) | 44 (30.34) | |
| Stage 3 and
above | 1 (10) | 29 (20) | |
| AFP | 1,372.45
(±2,933.55) | 2,862
(±9,098.68) | 0.4536 |
| CEA | 2.03 (±1.24) | 3.42 (±3.44) | 0.4292 |
Overall, we observed that the levels of both HDAC1
and HDAC2 in tumor tissues were significantly higher than those
noted in adjacent non-tumor tissues (P<0.0001, Table II). In addition, the levels of
HDAC1 and HDAC2 expression (i.e., expression level ≥2) were
significantly high in the tumor tissues when compared to the
adjacent non-tumor tissues (P<0.0001 for both HDAC1 and HDAC2 by
McNemar test) (Table II). HDAC1
expression in tumor tissues (but not HDAC2) was higher in the
moderately and poorly differentiated tumors compared to that in the
well-differentiated tumors (P=0.028).
| Table IIDistribution of biomarkers according
to tumor and adjacent non-tumor tissues. |
Table II
Distribution of biomarkers according
to tumor and adjacent non-tumor tissues.
| Variables | HDAC1 | P-value | HDAC2 | P-value |
|---|
| Overall, n (%) |
| No | 139 (44.55) | 0.0791 | 69 (22.12) | <0.001 |
| Yes | 173 (55.45) | | 243 (77.88) | |
| Expression
status |
| (+) in T | 119 (76.28) | <0.0001 | 146 (93.59) | <0.0001 |
| (+) in NT | 54 (34.62) | | 97 (62.18) | |
| Scores in T |
| 0–1 | 88 (56.41) | <0.0001 | 60 (38.46) | <0.008 |
| ≥2 | 68 (43.59) | | 96 (61.54) | |
| Scores in NT |
| 0–1 | 142 (91.03) | | 136 (87.18) | |
| ≥2 | 14 (8.97) | | 20 (12.82) | |
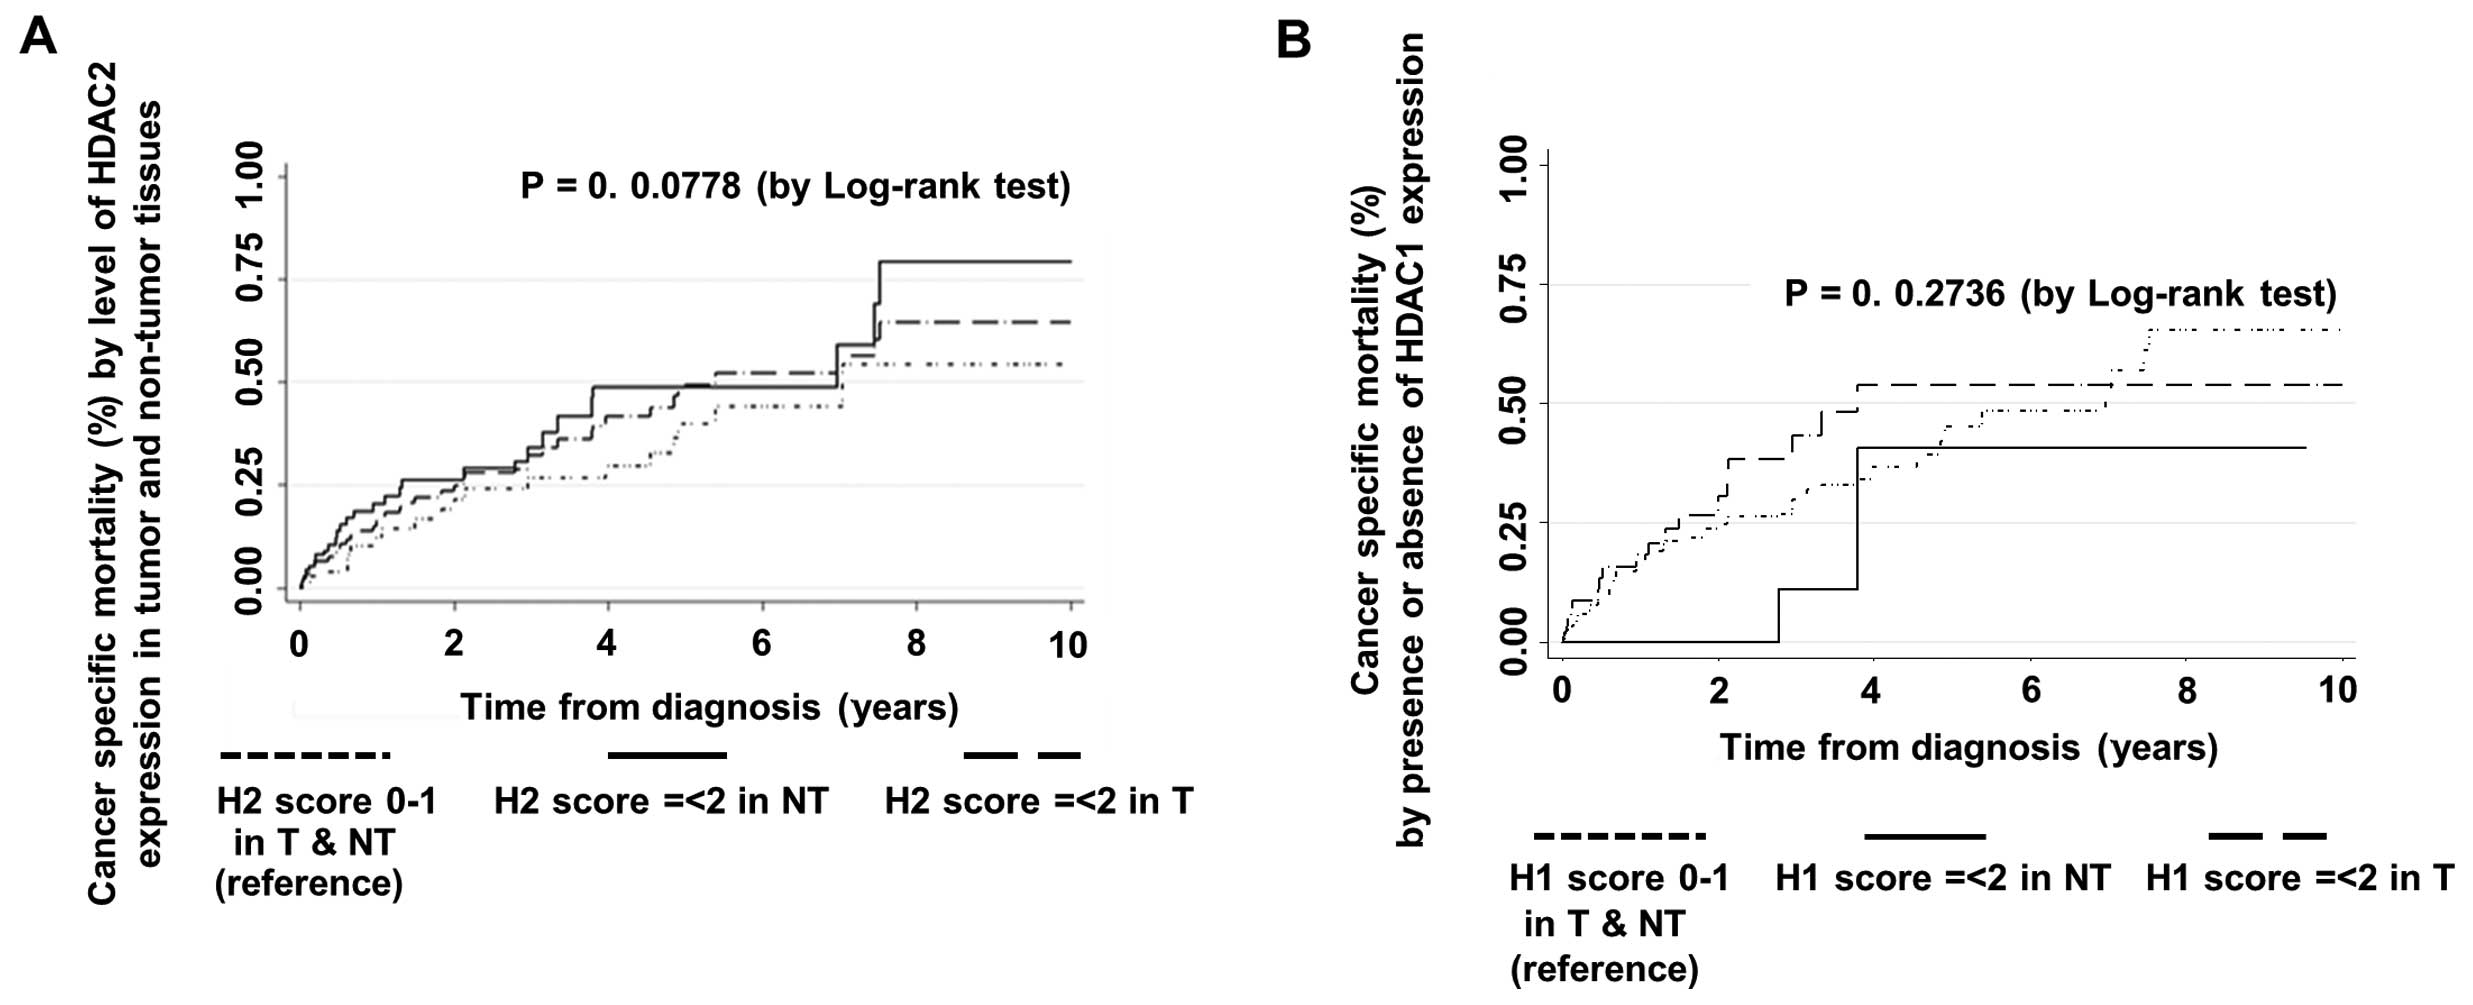
Prognostic value of HDAC1 and HDAC2 and
competing risk regression model
The competing risk regression method was used to
estimate the impact of HDAC1 and HDAC2 expression (as main
covariates of interest) on mortality and disease recurrence. The
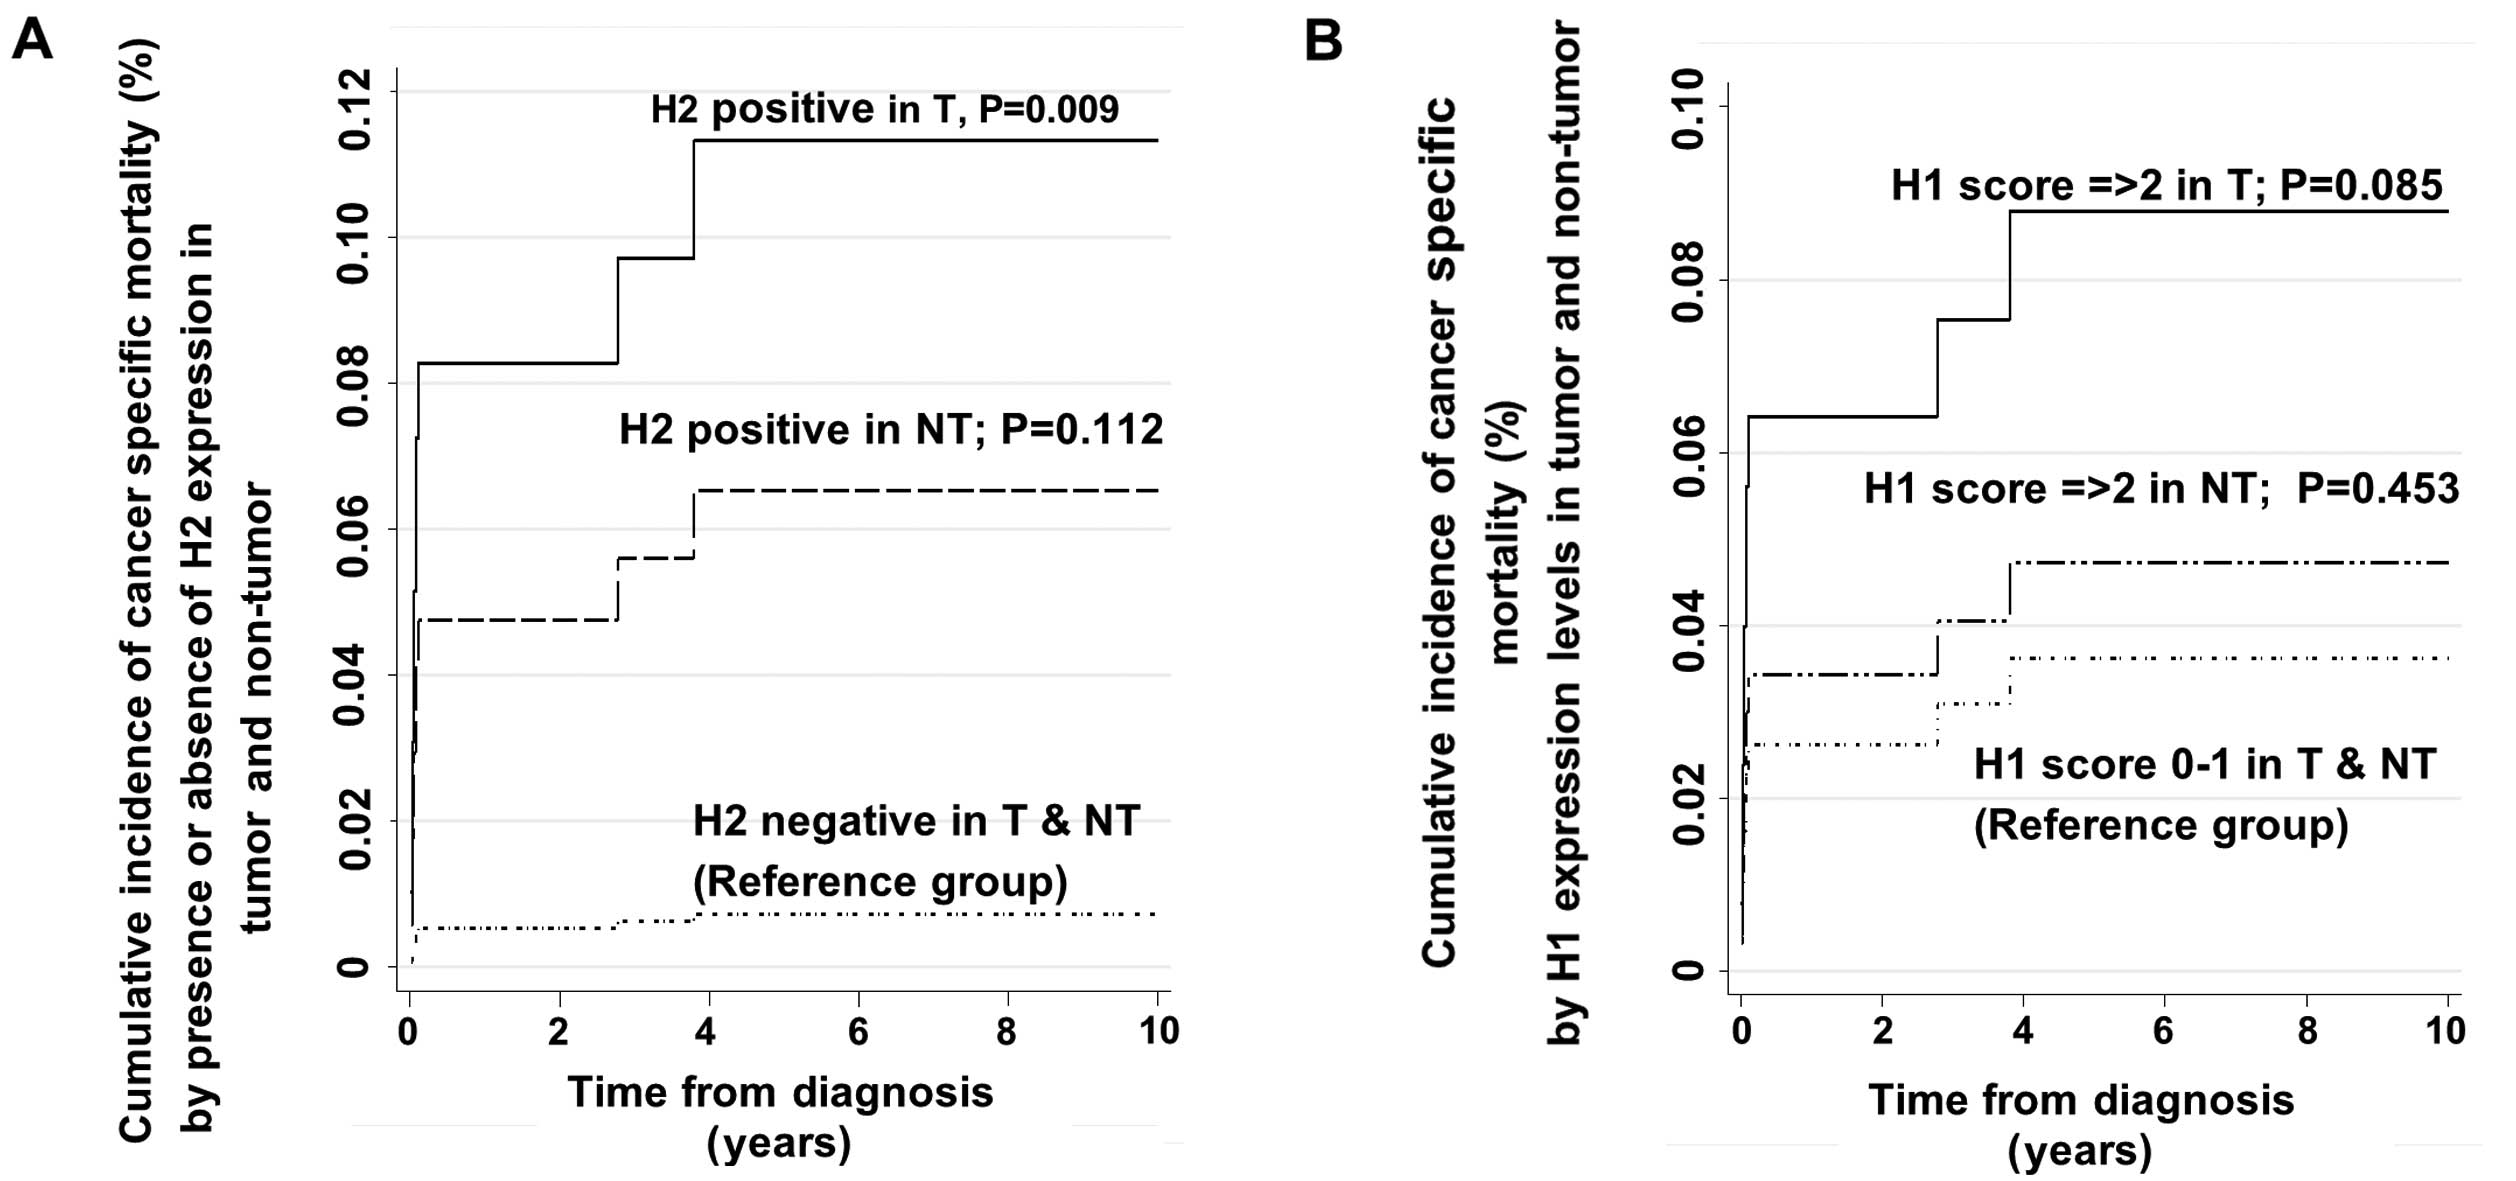
final fitted competing risk regression model showed that the
presence of HDAC2 expression (score ≥1) in tumor tissues is a
significant independent predictor of mortality after adjusting for
other significant risk factors while taking into account disease
recurrence as the other competing risk event (Table III and Fig. 4A). The final adjusted SHR estimate
was 9.24 (95% CI, 1.76–48.43; P=0.009) (Table III). The final adjusted SHR in the
final competing risk model was adjusted for other clinically
important and statistically significant variables in the univariate
testing. These adjusting variables were age at diagnosis, tumor
stage, presence of cirrhosis, presence of multiple lesions, the
presence of vascular invasion, and presence of HDAC1 expression in
tumor and non-tumor tissues.
| Table IIIAdjusted hazard ratio estimates and
SHR estimates of HDAC1 and HDAC2 gene expression in the prediction
of cancer-specific mortality among patients with HCC by final
fitted Cox proportional hazard model and final fitted competing
risk model. |
Table III
Adjusted hazard ratio estimates and
SHR estimates of HDAC1 and HDAC2 gene expression in the prediction
of cancer-specific mortality among patients with HCC by final
fitted Cox proportional hazard model and final fitted competing
risk model.
| Variables | Multivariate Cox
regression (final fitted model)
| Multivariate
competing risk regression (final fitted model)
|
|---|
| Adjusted HR | 95% CI | P-value | Adjusted SHR | 95% CI | P-value |
|---|
| Tumor stage |
| Stage I | 1.0 | – | – | – | – | – |
| Stage II | 2.15 | 0.83–5.60 | 0.117 | 0.52 | 0.14–1.91 | 0.328 |
| Stage ≥III | 5.67 | 1.77–18.13 | 0.003 | 0.37 | 0.04–3.45 | 0.379 |
| Cirrhosis |
| Absence | 1.0 | – | – | 1.0 | – | – |
| Presence | 2.05 | 1.10–3.79 | 0.023 | 3.84 | 1.14–13.01 | 0.030 |
| Multiple
lesions |
| Absence | 1.0 | – | – | 1.0 | – | – |
| Presence | 0.74 | 0.23–2.37 | 0.615 | 2.00 | 0.30–13.46 | 0.478 |
| Vascular
invasion |
| Absence | 1.0 | – | – | 1.0 | – | – |
| Presence | 1.69 | 0.72–3.95 | 0.227 | 1.83 | 0.47–7.08 | 0.380 |
| Age at
diagnosis | 1.01 | 0.99–1.04 | 0.282 | 1.03 | 0.98–1.07 | 0.220 |
| HDAC1 gene
expression status |
| HDAC1(−) (T and
NT) | 1.0 | – | – | 1.0 | – | – |
| HDAC1(+) (NT) | 1.25 | 0.66–2.34 | 0.490 | 1.65 | 0.44–6.16 | 0.453 |
| HDAC1(+) (T) | 1.23 | 0.60–2.52 | 0.570 | 0.52 | 0.12–2.27 | 0.382 |
| HDAC2 gene
expression status |
| HDAC2(−) (T and
NT) | 1.0 | – | – | 1.0 | – | – |
| HDAC2(+) (NT) | 1.77 | 0.83–3.79 | 0.141 | 6.04 | 0.66–55.57 | 0.112 |
| HDAC2(+) (T) | 1.43 | 0.63–3.23 | 0.393 | 9.24 | 1.76–48.43 | 0.009 |
The prediction of mortality by levels of HDAC1
expression (i.e., score 0–1 vs. ≥2) as a main covariate of interest
showed a tendency towards higher risk of mortality in patients with
high HDAC1 expression in tumors (Table
IV and Fig. 4B), although the
presence of HDAC1 expression alone was not found to be a
significant predictor of mortality. The SHR estimate for high HDAC1
expression levels (score ≥2) in the tumor tissues was 2.48 with 95%
CI, 0.88–7.00. However, this value did not reach statistically
significant levels. As for the prediction of disease recurrence
using multivariate competing risk regression approach, neither the
presence of HDAC1 or HDAC2 (i.e., score ≥1), nor the levels of
HDAC1 or HDAC2 expression (i.e., score 0–1 vs. score ≥2)
prognosticated HCC recurrences in our population (Tables V and VI).
| Table IVAdjusted hazard ratio estimates and
SHR estimates of the HDAC1 and HDAC2 genes with high level
expression in the prediction of cancer-specific mortality among
patients with HCC by final fitted Cox proportional hazard model and
final fitted competing risk model. |
Table IV
Adjusted hazard ratio estimates and
SHR estimates of the HDAC1 and HDAC2 genes with high level
expression in the prediction of cancer-specific mortality among
patients with HCC by final fitted Cox proportional hazard model and
final fitted competing risk model.
| Variables | Multivariate Cox
regression (final fitted model)
| Multivariate
competing risk regression (final fitted model)
|
|---|
| Adjusted HR | 95% CI | P-value | Adjusted SHR | 95% CI | P-value |
|---|
| Tumor stage |
| Stage I | 1.00 | – | – | 1.00 | – | – |
| Stage II | 1.83 | 0.76–4.40 | 0.174 | 0.61 | 0.16–2.32 | 0.467 |
| Stage ≥III | 5.85 | 2.04–16.77 | 0.001 | 0.54 | 0.08–3.70 | 0.531 |
| Cirrhosis |
| Absence | 1.00 | – | – | 1.00 | – | – |
| Presence | 1.99 | 1.09–3.65 | 0.025 | 3.46 | 1.10–10.81 | 0.033 |
| Multiple
lesions |
| Absence | 1.00 | – | – | 1.00 | – | – |
| Presence | 0.86 | 0.32–2.35 | 0.772 | 2.31 | 0.41–12.89 | 0.339 |
| Vascular
invasion |
| Absence | 1.00 | – | – | 1.00 | – | – |
| Presence | 1.55 | 0.73–3.28 | 0.256 | 1.38 | 0.43–4.43 | 0.588 |
| Age at
diagnosis | 1.02 | 0.99–1.04 | 0.167 | 1.03 | 0.98–1.08 | 0.223 |
| HDAC1 gene
expression |
| HDAC1 score 0–1 (T
and NT) | 1.00 | – | – | 1.00 | – | – |
| HDAC1 score ≥2
(NT) | 0.97 | 0.27–3.45 | 0.964 | 1.08 | 0.07–17.64 | 0.959 |
| HDAC1 score ≥2
(T) | 1.62 | 0.92–2.85 | 0.092 | 2.48 | 0.88–7.00 | 0.085 |
| HDAC2 gene
expression |
| HDAC2 score 0–1 (T
and NT) | 1.00 | – | – | 1.00 | – | – |
| HDAC2 score ≥2 in
NT | 0.10 | 0.01–0.97 | 0.047 | 0.75 | 0.04–14.70 | 0.850 |
| HDAC2 score ≥2 in
T | 0.76 | 0.48–1.22 | 0.261 | 0.65 | 0.23–1.82 | 0.411 |
| Table VAdjusted hazard ratio estimates and
SHR estimates of HDAC1 and HDAC2 gene expression in the predictions
of recurrence of HCC among patients with HCC by final fitted Cox
proportional hazard model and final fitted competing risk
model. |
Table V
Adjusted hazard ratio estimates and
SHR estimates of HDAC1 and HDAC2 gene expression in the predictions
of recurrence of HCC among patients with HCC by final fitted Cox
proportional hazard model and final fitted competing risk
model.
| Variables | Multivariate Cox
regression (final fitted model)
| Multivariate
competing risk regression (final fitted model)
|
|---|
| Adjusted HR | 95% CI | P-value | Adjusted SHR | 95% CI | P-value |
|---|
| Tumor stage |
| Stage I | 1.0 | – | – | 1.0 | – | – |
| Stage II | 0.69 | 0.28–1.68 | 0.413 | 1.59 | 0.85–2.98 | 0.146 |
| Stage ≥III | 1.12 | 0.40–3.17 | 0.828 | 2.98 | 1.34–6.61 | 0.007 |
| Cirrhosis |
| Absence | 1.0 | – | – | 1.0 | – | – |
| Presence | 1.40 | 0.83–2.34 | 0.203 | 0.97 | 0.62–1.51 | 0.897 |
| Multiple
lesions |
| Absence | 1.0 | – | – | 1.0 | – | – |
| Presence | 2.79 | 0.80–9.78 | 0.109 | 0.64 | 0.24–1.73 | 0.378 |
| Vascular
invasion |
| Absence | 1.0 | – | – | 1.0 | – | – |
| Presence | 3.03 | 1.40–6.59 | 0.005 | 1.48 | 0.81–2.70 | 0.206 |
| Age at
diagnosis | 0.98 | 0.96–1.00 | 0.024 | 1.01 | 0.99–1.02 | 0.305 |
| HDAC1 gene
expression |
| HDAC1 score 0–1 (T
and NT) | 1.0 | – | – | 1.0 | – | – |
| HDAC1 score ≥2
(NT) | 1.35 | 0.75–2.42 | 0.323 | 0.98 | 0.60–1.59 | 0.921 |
| HDAC1 score ≥2
(T) | 1.35 | 0.76–2.37 | 0.302 | 1.24 | 0.74–2.08 | 0.404 |
| HDAC2 gene
expression |
| HDAC2 score 0–1 (T
and NT) | 1.0 | – | – | 1.0 | – | – |
| HDAC2 score ≥2
(NT) | 1.21 | 0.67–2.20 | 0.529 | 1.37 | 0.87–2.17 | 0.179 |
| HDAC2 score ≥2
(T) | 0.94 | 0.51–1.76 | 0.854 | 1.05 | 0.61–1.79 | 0.858 |
| Table VIAdjusted hazard ratio estimates and
SHR estimates of HDAC1 and HDAC2 genes with high-level expression
in the predictions of recurrence of HCC among patients with HCC by
final fitted Cox proportional hazard model and final fitted
competing risk model. |
Table VI
Adjusted hazard ratio estimates and
SHR estimates of HDAC1 and HDAC2 genes with high-level expression
in the predictions of recurrence of HCC among patients with HCC by
final fitted Cox proportional hazard model and final fitted
competing risk model.
| Variables | Multivariate Cox
regression (final fitted model)
| Multivariate
competing risk regression (final fitted model)
|
|---|
| Adjusted HR | 95% CI | P-value | Adjusted SHR | 95% CI | P-value |
|---|
| Tumor stage |
| Stage I | 1.00 | – | – | 1.00 | – | – |
| Stage II | 0.73 | 0.30–1.78 | 0.483 | 1.58 | 0.84–2.96 | 0.156 |
| Stage ≥III | 1.17 | 0.42–3.27 | 0.762 | 3.09 | 1.39–6.87 | 0.006 |
| Cirrhosis |
| Absence | 1.00 | – | – | 1.00 | – | – |
| Presence | 1.41 | 0.84–2.36 | 0.194 | 0.97 | 0.62–1.50 | 0.875 |
| Multiple
lesion |
| Absence | 1.00 | – | – | 1.00 | – | – |
| Presence | 2.88 | 0.84–9.91 | 0.093 | 0.65 | 0.24–1.73 | 0.382 |
| Vascular
invasion |
| Absence | 1.00 | – | – | 1.00 | – | – |
| Presence | 2.71 | 1.23–5.93 | 0.013 | 1.45 | 0.79–2.64 | 0.231 |
| Age at
diagnosis | 0.98 | 0.96–1.00 | 0.060 | 1.01 | 0.99–1.03 | 0.277 |
| HDAC1 gene
expression |
| HDAC1 score 0–1 (T
and NT) | 1.00 | – | – | 1.00 | – | – |
| HDAC1 score ≥2
(NT) | 0.77 | 0.43–1.41 | 0.401 | 0.86 | 0.45–1.64 | 0.652 |
| HDAC1 score ≥2
(T) | 1.02 | 0.61–1.69 | 0.944 | 0.92 | 0.60–1.41 | 0.696 |
| HDAC2 gene
expression |
| HDAC2 score 0–1 (T
and NT) | 1.00 | – | – | 1.00 | – | – |
| HDAC2 score ≥2
(NT) | 0.71 | 0.43–1.18 | 0.185 | 1.01 | 0.56–1.82 | 0.982 |
| HDAC2 score ≥2
(T) | 0.87 | 0.58–1.32 | 0.516 | 0.96 | 0.69–1.33 | 0.795 |
There was no significant interaction between HDAC1
and HDAC2 in prediction of both cancer recurrence and
cancer-specific mortality in this study when HDAC1 and HDAC2 were
treated as either presence or absence categories or different
levels of expression in the competing risk model.
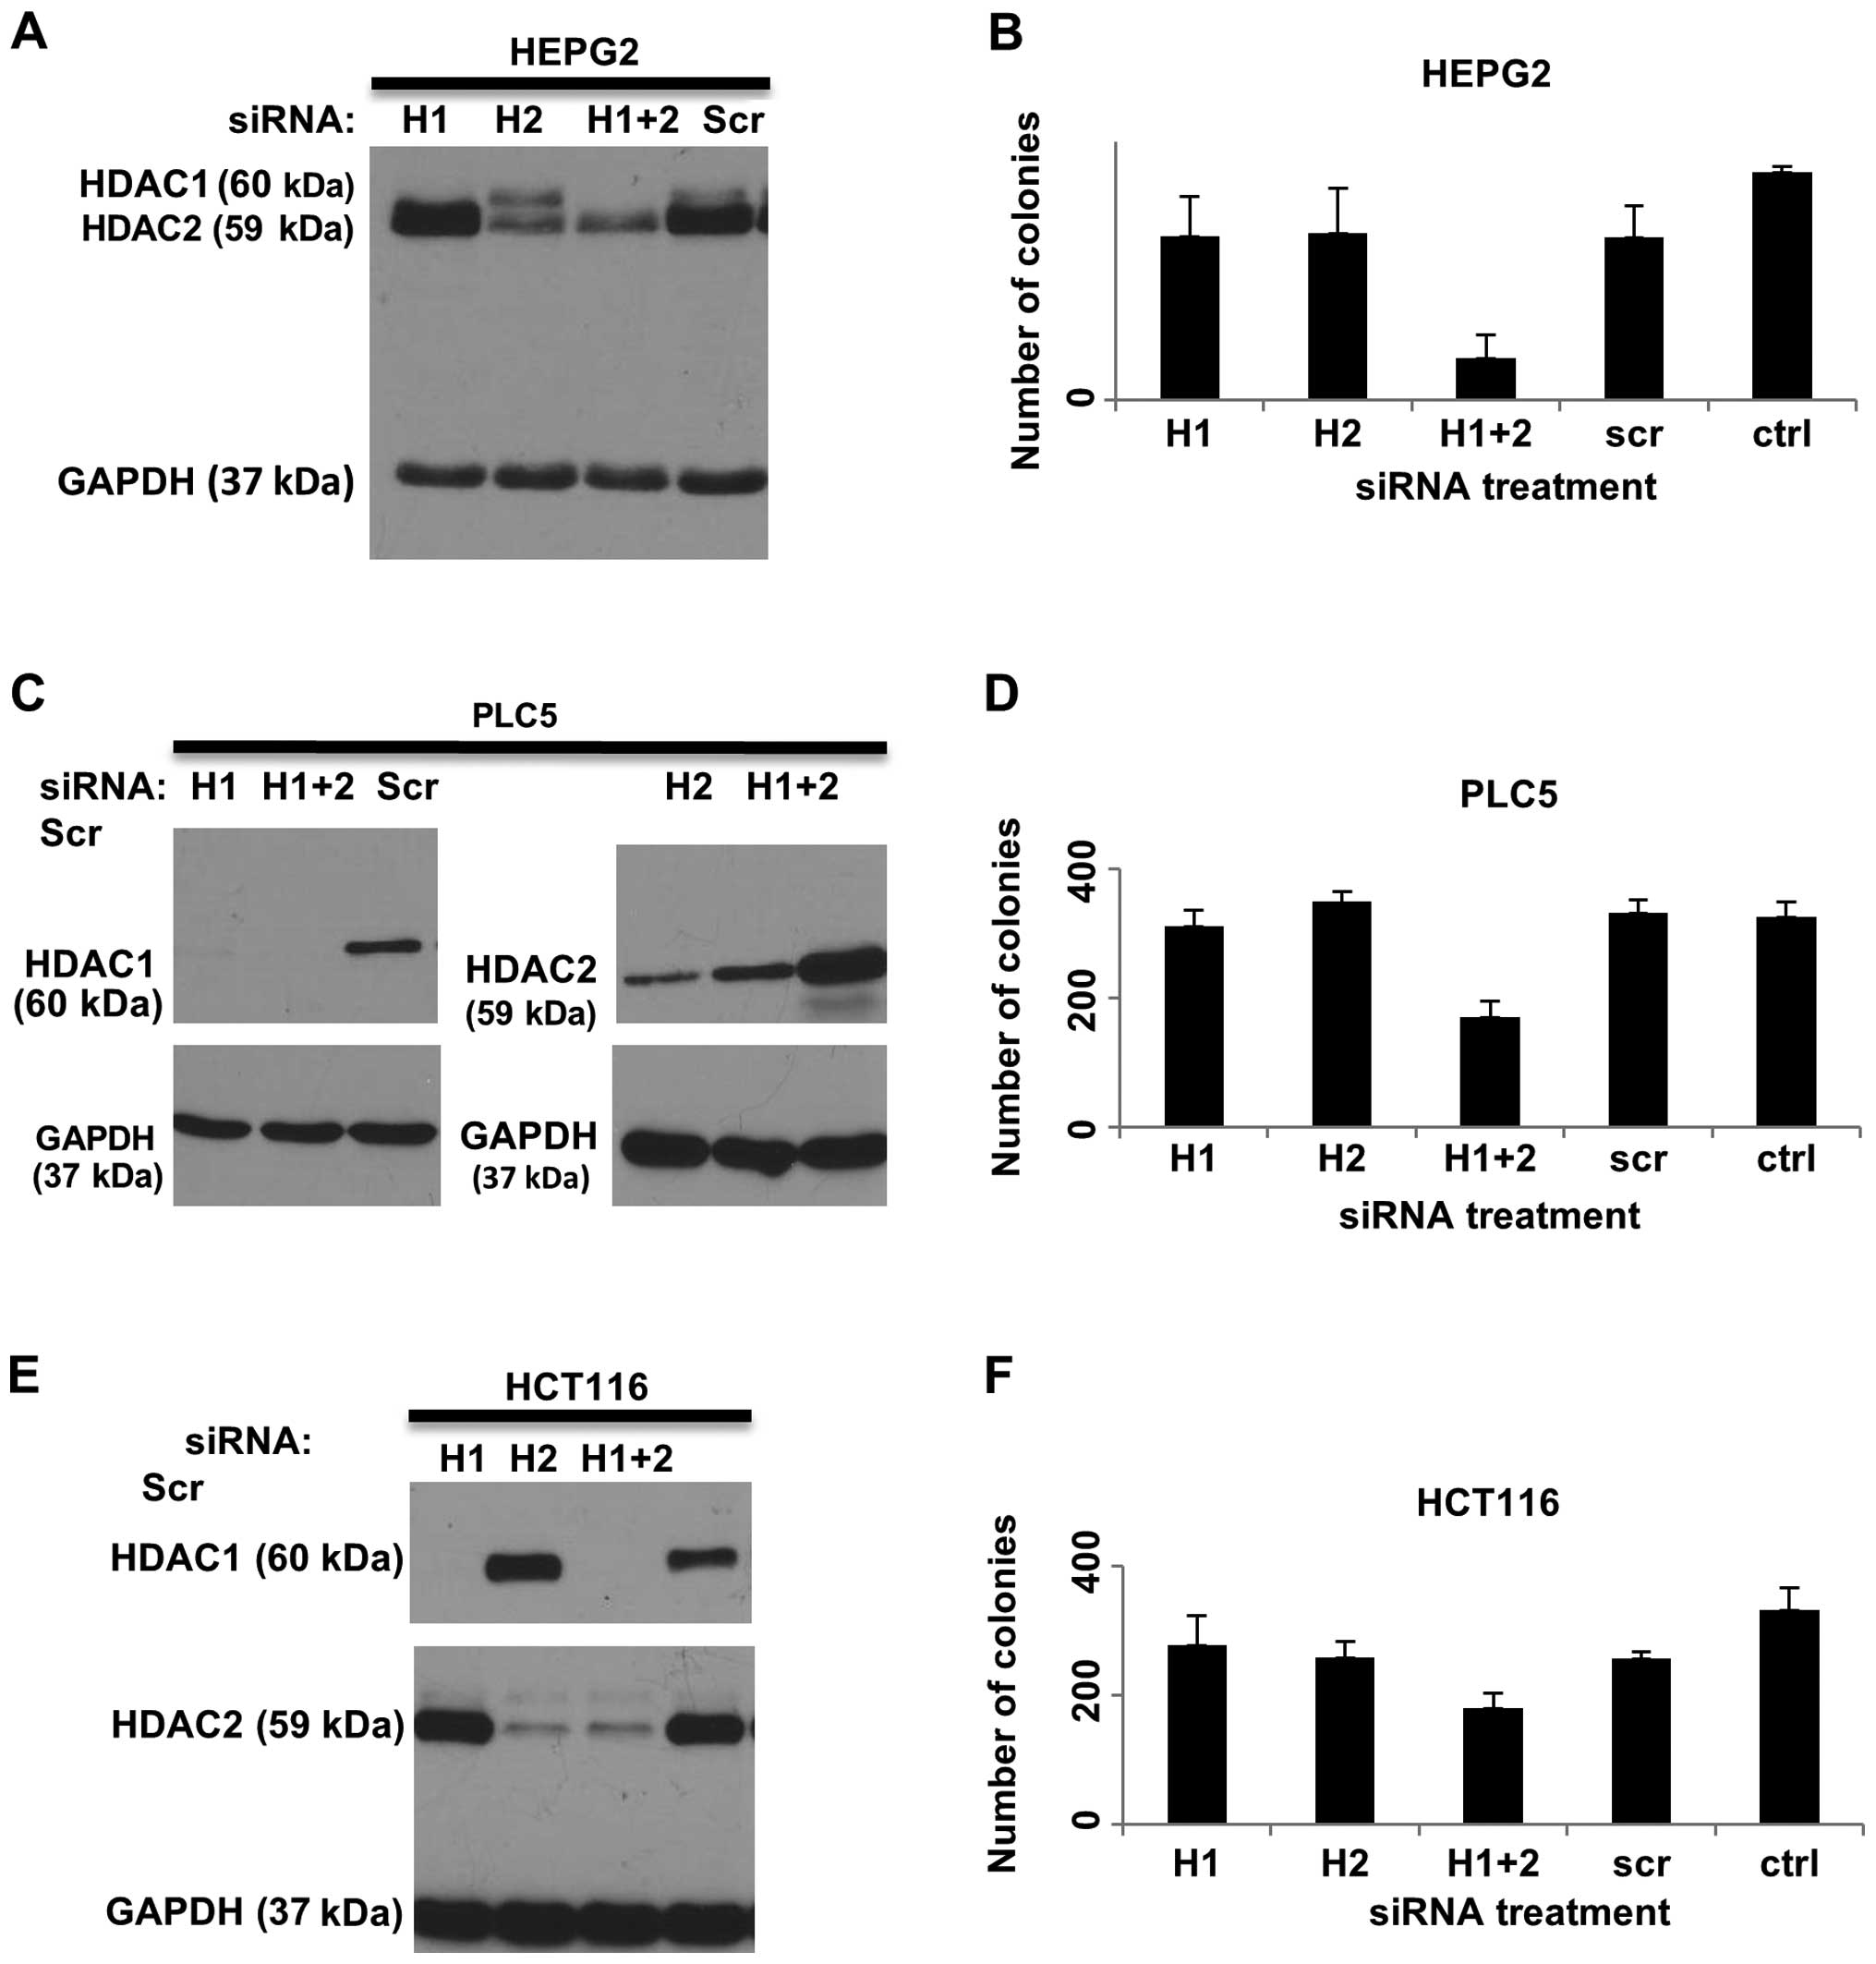
Combined knockdown of HDAC1 and HDAC2
increases cell death and reduces cell proliferation and colony
formation
The expression of HDAC1 and HDAC2 was knocked down
by siRNAs both individually and in combination in three liver
cancer cell lines, HEP3B (Fig. 5A and
B), HEPG2 (Fig. 6A), PLC5
(Fig. 6C) and a colorectal cancer
cell line, HCT116 (Fig. 6E). To
investigate the effects of HDAC1 and HDAC2 on cell proliferation,
WST-1 assay was performed on HEP3B cells treated with HDAC1 and
HDAC2 siRNAs in combination or individually, and compared with
scrambled siRNA-treated (Scr) and untransfected control cells
(Ctrl). Silencing of both HDAC1 and HDAC2 in HEP3B cells
significantly reduced cell growth compared to the controls.
However, knockdown of either HDAC1 or HDAC2 alone did not affect
cell proliferation (Fig. 5C). In
addition, colony formation was reduced when both HDAC1 and HDAC2
were knocked down in HEP3B cells, but not when HDAC1 and HDAC2 were
silenced individually (Fig. 5D).
Similarly, significant reduction in colony formation was only
observed when combined knockdown of HDAC1 and HDAC2 was performed
in the HEPG2 (Fig. 6B), PLC5
(Fig. 6D) and HCT116 (Fig. 6F) cell lines.
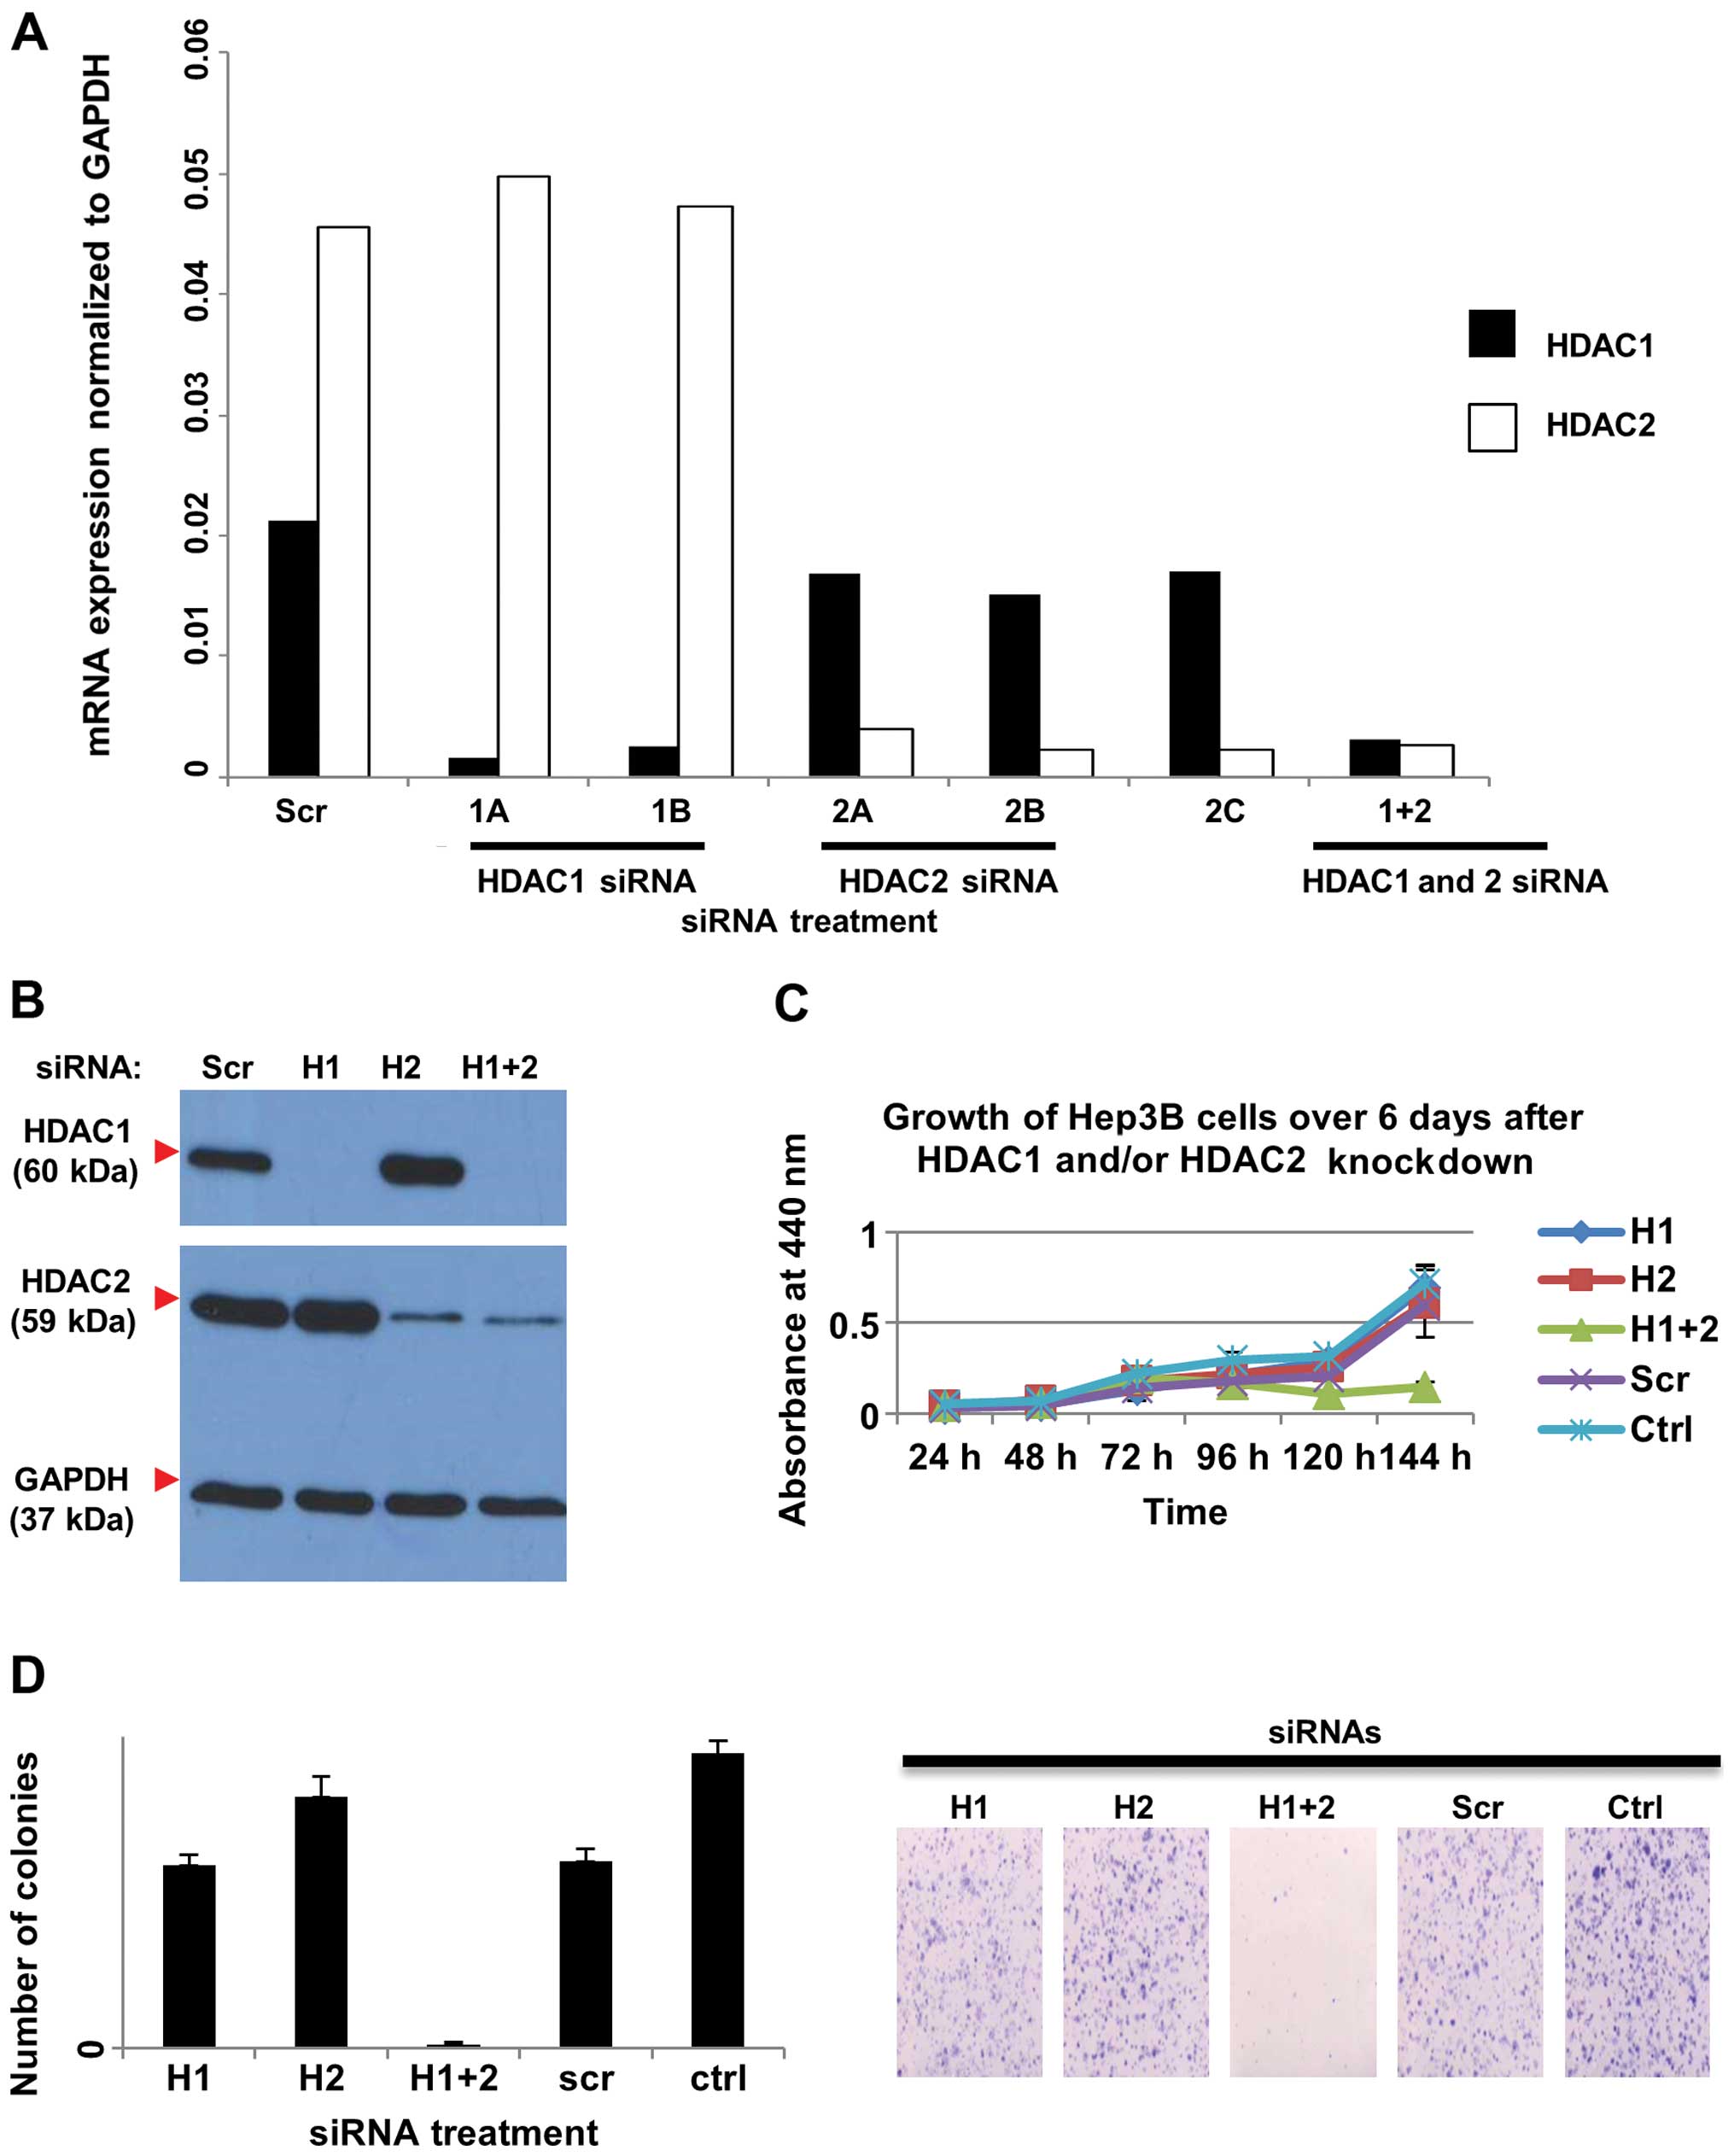 | Figure 5Effects of siRNA knockdown of HDAC1
and/or HDAC2 on HDAC activity in HEP3B cells. Cells were
transfected with HDAC1 siRNA (H1), or HDAC2 siRNA (H2), or both
(H1+2), or non-silencing control siRNA (Scr) for 72 h. (A) Cells
were harvested and RNA was extracted and used for quantitative real
time RT-PCR, carried out in replicates. The sequences specific for
HDAC1 (1A and 1B) resulted in reduced RNA expression of HDAC1
compared to the non-silencing control (Scr) but not HDAC2, and the
sequences specific for HDAC2 (2A, 2B, and 2C) resulted in reduced
RNA expression of HDAC2 compared to the non-silencing control (Scr)
but not HDAC1. (B) Cells transfected with a cocktail of HDAC1
siRNAs and/or HDAC2 siRNAs were harvested for protein, and western
blot analysis using HDAC1- and HDAC2-specific antibodies was
performed. GAPDH was used as the loading control. (C) WST-1 assay
showed that combined knockdown of HDAC1 and HDAC2 reduced the cell
growth over time. HEP3B cells were transfected with HDAC1 siRNA
(H1), or HDAC2 siRNA (H2), or both (H1+2), or non-silencing control
siRNA (Scr) or untransfected (Ctrl). (D) Left panel: Quantification
of colony formation. The average number of colonies in each of the
triplicate wells was plotted against the treatment. Error bars
indicate standard deviations. Right panel: Representative images of
the crystal violet-stained colonies. The combined knockdown of both
HDAC1 and HDAC2 reduced colony formation. Cells were plated at a
low density for 10 days and colonies were stained with crystal
violet before imaging. HDAC, histone deacetylase. |
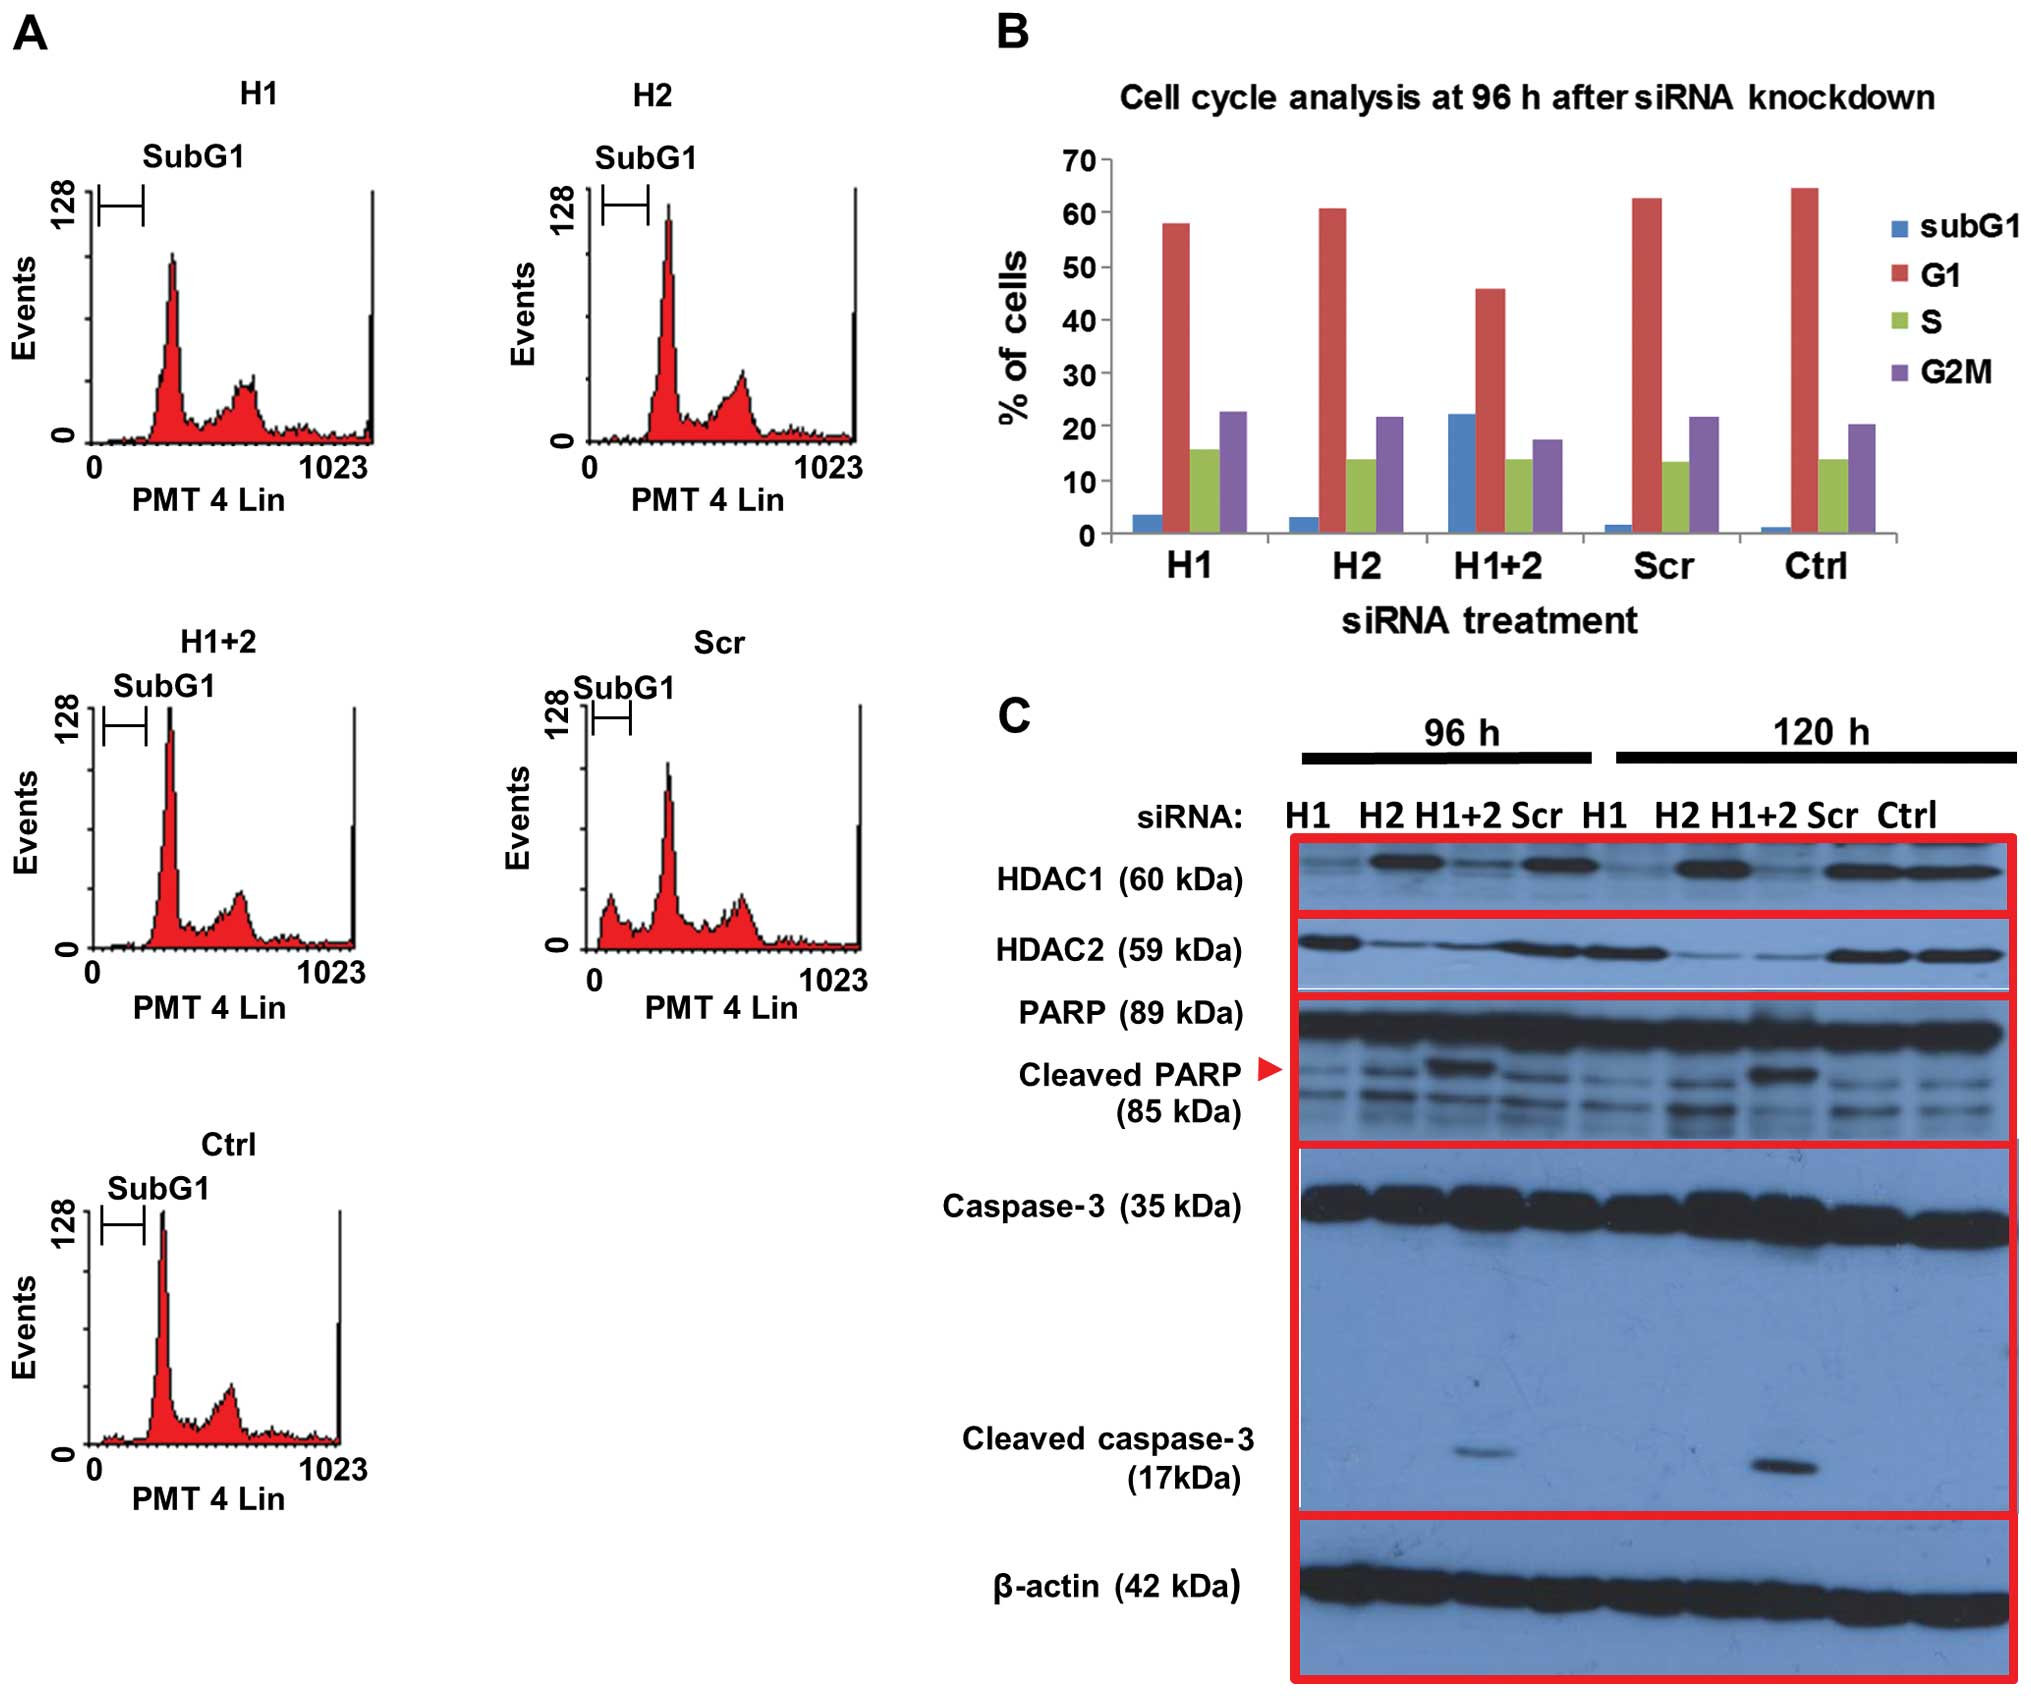
The effects of HDAC1 and HDAC2 on cell death was
assessed by PI staining of fixed HEP3B cells treated with HDAC1 and
HDAC2 siRNAs and control siRNA as above. Flow cytometric analysis
showed that combined knockdown of both HDAC1 and HDAC2
significantly increased the sub-G1 fraction by 22.5% at 96 h
post-transfection, compared to ~2% in the scrambled siRNA and
untreated controls, indicating increased cell death (Fig. 7A and B). In contrast, knockdown of
either HDAC1 or HDAC2 alone did not significantly affect cell
death. The expression of various proteins involved in apoptosis was
investigated by western blotting (Fig.
7C). Consistent with the flow cytometric data on cell death,
cleavage of caspase-3 as well as its substrate PARP were observed
in cells in which both HDAC1 and HDAC2 were knocked down up to 120
h post-transfection, but not in cells treated with either HDAC1 or
HDAC2 siRNA. Taken together, our data suggest that the combined
targeting of HDAC1 and HDAC2 in hepatocellular and colon cancer
cells is more effective in reducing their growth potential and
inducing cell death than selective targeting of either HDAC.
Discussion
In the Singapore cohort of 156 patients, we found
that the expression levels of HDAC1 and HDAC2 in the tumor tissues
were significantly higher than those in matched adjacent non-tumor
tissues, as reported in other studies (13,23–25).
HDAC1 expression was also higher in moderately and poorly
differentiated tumors compared to well-differentiated tumors. Our
data are consistent with previous observations whereby high tumor
HDAC1 was found to be associated with poorer differentiation and
invasion into the portal vein (26). Multivariate analysis using the
competing risk regression model was performed for our cohort. The
standard Cox proportional hazard model was not used as it found to
be inappropriate for our analysis - violation of the Cox
proportional hazards assumption was noted when we applied the
presence or absence of HDAC1 and HDAC2 gene expression in tumor and
non-tumor tissues to predict mortality and DFS (Fig. 8A). A similar violation was found
when we applied the high and low level of HDAC1 and HDAC2 gene
expression (i.e., 0–1 vs. ≥2) in tumor and non-tumor tissues to
predict mortality and DFS (Fig.
8B). The competing risk regression model revealed that high
expression of HDAC1 in tumor tissues (score ≥2) independently
predicted cancer-specific mortality. Our findings are consistent
with Rikimaru et al, who showed that high HDAC1 expression
was associated with poorer survival in HCC patients after hepatic
resection (26).
Recent evidence suggests that HDAC2 promotes
malignant progression in HCC by activating Akt signaling and
epithelial-mesenchymal transformation (23). Consistent with the roles of HDAC2 in
cancer progression, we found that the presence of HDAC2 in tumor
tissues (score ≥1) was an independent predictor of cancer-specific
mortality. This is in agreement with other studies which
demonstrate a correlation between high HDAC2 expression and shorter
overall survival in several cancers including HCC (23,24),
oral cancer (27), gastric cancer
(28) and colorectal cancer
(14). In addition, HDAC2 presence
in adjacent non-tumor hepatic tissues was also identified by the
competing risk regression model as a potential predictor of poorer
survival, although this did not reach levels of significance
(P=0.112).
Importantly, we also found a significant correlation
between HDAC1 expression in adjacent non-tumor hepatic tissues with
the presence of satellite nodules and multiple lesions, suggesting
that HDAC1 activation in the adjacent tumor environment may
contribute to tumor spread. With respect to HDAC2, its presence in
adjacent non-tumor hepatic tissues was significantly associated
with smoking. Previous observations have implicated smoking as a
risk factor in the development of HCC (29), while HDAC inhibition was shown to
reduce the risk of smoking-related cancers such as head and neck
cancers (30). It is thus possible
that HDAC2 upregulation occurs as an early event in smoking-related
hepatocellular transformation.
Our in vitro studies showed that combined
knockdown of HDAC1 and HDAC2 (but not knockdown of either alone)
reduced cell proliferation and survival in HCC and colon cancer
cell lines. The requirement for both HDAC1 and HDAC2 for cell
proliferation was previously observed in B-cell development,
whereby HDAC1 and HDAC2 act together to promote G1 to S phase
progression by inhibiting the transcription of cyclin-dependent
kinase inhibitors p21WAF1/CIP1 and p57Kip2
(31). In HCC, HDAC2 was shown to
be important for oncogenic potential and inhibits the transcription
of p21WAF1/Cip1 by binding to Sp1-binding site enriched
proximal region of the p21WAF1/Cip1 promoter (32). In addition, a positive feedback
mechanism that upregulates HDAC2 expression in response to growth
factors via the PI3 kinase/mTORC1/NF-κBp50 signaling was also
identified in HCC cells (23). In
these cells, increased HDAC2 activity in turn was found to be
required for sustaining elevated PI3 kinase/Akt and mTOR signaling
to promote cancer cell growth and survival (23). Notably, both HDAC1 and HDAC2 have
been found together in association with transcriptional complexes
that regulate oncogenic processes, such as the ZEB1/HDAC
transcription complex which represses E-cadherin expression and
promotes migration of pancreatic cancer cells (33). Our clinical and in vitro data
suggest that HDAC1 and HDAC2 also have independent functions that
contribute to cancer progression, hence targeting both HDACs could
be a useful therapeutic consideration to reduce cancer spread and
improve the mortality rate.
Acknowledgments
The authors thank Assistant Professor Yaw Chyn Lim
for her help in taking the bright field images and Mrs. Tamilarasi
Jegadeesan for her support in the laboratory logistics.
References
|
1
|
Ito K and Adcock IM: Histone acetylation
and histone deacetylation. Mol Biotechnol. 20:99–106. 2002.
View Article : Google Scholar : PubMed/NCBI
|
|
2
|
Glass CK and Rosenfeld MG: The coregulator
exchange in transcriptional functions of nuclear receptors. Genes
Dev. 14:121–141. 2000.PubMed/NCBI
|
|
3
|
Ropero S and Esteller M: The role of
histone deacetylases (HDACs) in human cancer. Mol Oncol. 1:19–25.
2007. View Article : Google Scholar : PubMed/NCBI
|
|
4
|
Yang XJ and Seto E: The Rpd3/Hda1 family
of lysine deacetylases: From bacteria and yeast to mice and men.
Nat Rev Mol Cell Biol. 9:206–218. 2008. View Article : Google Scholar : PubMed/NCBI
|
|
5
|
Johnstone RW: Histone-deacetylase
inhibitors: Novel drugs for the treatment of cancer. Nat Rev Drug
Discov. 1:287–299. 2002. View
Article : Google Scholar : PubMed/NCBI
|
|
6
|
Lagger G, O'Carroll D, Rembold M, Khier H,
Tischler J, Weitzer G, Schuettengruber B, Hauser C, Brunmeir R,
Jenuwein T, et al: Essential function of histone deacetylase 1 in
proliferation control and CDK inhibitor repression. EMBO J.
21:2672–2681. 2002. View Article : Google Scholar : PubMed/NCBI
|
|
7
|
Harms KL and Chen X: Histone deacetylase 2
modulates p53 transcriptional activities through regulation of
p53-DNA binding activity. Cancer Res. 67:3145–3152. 2007.
View Article : Google Scholar : PubMed/NCBI
|
|
8
|
Lei WW, Zhang KH, Pan XC, Wang DM, Hu Y,
Yang YN and Song JG: Histone deacetylase 1 and 2 differentially
regulate apoptosis by opposing effects on extracellular
signal-regulated kinase 1/2. Cell Death Dis. 1:e442010. View Article : Google Scholar
|
|
9
|
Weichert W: HDAC expression and clinical
prognosis in human malignancies. Cancer Lett. 280:168–176. 2009.
View Article : Google Scholar
|
|
10
|
Ramsey MR, He L, Forster N, Ory B and
Ellisen LW: Physical association of HDAC1 and HDAC2 with p63
mediates transcriptional repression and tumor maintenance in
squamous cell carcinoma. Cancer Res. 71:4373–4379. 2011. View Article : Google Scholar : PubMed/NCBI
|
|
11
|
Buurman R, Gürlevik E, Schäffer V, Eilers
M, Sandbothe M, Kreipe H, Wilkens L, Schlegelberger B, Kühnel F and
Skawran B: Histone deacetylases activate hepatocyte growth factor
signaling by repressing microRNA-449 in hepatocellular carcinoma
cells. Gastroenterology. 143:811–820. e1–e15. 2012. View Article : Google Scholar : PubMed/NCBI
|
|
12
|
Fritzsche FR, Weichert W, Röske A, Gekeler
V, Beckers T, Stephan C, Jung K, Scholman K, Denkert C, Dietel M,
et al: Class I histone deacetylases 1, 2 and 3 are highly expressed
in renal cell cancer. BMC Cancer. 8:3812008. View Article : Google Scholar : PubMed/NCBI
|
|
13
|
Weichert W, Röske A, Gekeler V, Beckers T,
Stephan C, Jung K, Fritzsche FR, Niesporek S, Denkert C, Dietel M,
et al: Histone deacetylases 1, 2 and 3 are highly expressed in
prostate cancer and HDAC2 expression is associated with shorter PSA
relapse time after radical prostatectomy. Br J Cancer. 98:604–610.
2008. View Article : Google Scholar : PubMed/NCBI
|
|
14
|
Weichert W, Röske A, Niesporek S, Noske A,
Buckendahl AC, Dietel M, Gekeler V, Boehm M, Beckers T and Denkert
C: Class I histone deacetylase expression has independent
prognostic impact in human colorectal cancer: Specific role of
class I histone deacetylases in vitro and in vivo. Clin Cancer Res.
14:1669–1677. 2008. View Article : Google Scholar : PubMed/NCBI
|
|
15
|
El-Serag HB and Rudolph KL: Hepatocellular
carcinoma: Epidemiology and molecular carcinogenesis.
Gastroenterology. 132:2557–2576. 2007. View Article : Google Scholar : PubMed/NCBI
|
|
16
|
Jemal A, Bray F, Center MM, Ferlay J, Ward
E and Forman D: Global cancer statistics. CA Cancer J Clin.
61:69–90. 2011. View Article : Google Scholar : PubMed/NCBI
|
|
17
|
Lau WY: The history of liver surgery. J R
Coll Surg Edinb. 42:303–309. 1997.PubMed/NCBI
|
|
18
|
Llovet JM, Ricci S, Mazzaferro V, Hilgard
P, Gane E, Blanc JF, de Oliveira AC, Santoro A, Raoul JL, Forner A,
et al: SHARP Investigators Study Group: Sorafenib in advanced
hepatocellular carcinoma. N Engl J Med. 359:378–390. 2008.
View Article : Google Scholar : PubMed/NCBI
|
|
19
|
Portolani N, Coniglio A, Ghidoni S,
Giovanelli M, Benetti A, Tiberio GA and Giulini SM: Early and late
recurrence after liver resection for hepatocellular carcinoma:
Prognostic and therapeutic implications. Ann Surg. 243:229–235.
2006. View Article : Google Scholar : PubMed/NCBI
|
|
20
|
Rahbari NN, Koch M, Schmidt T, Motschall
E, Bruckner T, Weidmann K, Mehrabi A, Büchler MW and Weitz J: Meta-
analysis of the clamp-crushing technique for transection of the
parenchyma in elective hepatic resection: Back to where we started?
Ann Surg Oncol. 16:630–639. 2009. View Article : Google Scholar : PubMed/NCBI
|
|
21
|
Barlow WE and Prentice RL: Residuals for
relative risk regression. Biometrika. 75:65–74. 1988. View Article : Google Scholar
|
|
22
|
Fisher LD and Lin DY: Time-dependent
covariates in the Cox proportional-hazards regression model. Annu
Rev Public Health. 20:145–157. 1999. View Article : Google Scholar : PubMed/NCBI
|
|
23
|
Noh JH, Bae HJ, Eun JW, Shen Q, Park SJ,
Kim HS, Nam B, Shin WC, Lee EK, Lee K, et al: HDAC2 provides a
critical support to malignant progression of hepatocellular
carcinoma through feedback control of mTORC1 and AKT. Cancer Res.
74:1728–1738. 2014. View Article : Google Scholar : PubMed/NCBI
|
|
24
|
Quint K, Agaimy A, Di Fazio P, Montalbano
R, Steindorf C, Jung R, Hellerbrand C, Hartmann A, Sitter H,
Neureiter D, et al: Clinical significance of histone deacetylases
1, 2, 3, and 7: HDAC2 is an independent predictor of survival in
HCC. Virchows Arch. 459:129–139. 2011. View Article : Google Scholar : PubMed/NCBI
|
|
25
|
Song J, Noh JH, Lee JH, Eun JW, Ahn YM,
Kim SY, Lee SH, Park WS, Yoo NJ, Lee JY, et al: Increased
expression of histone deacetylase 2 is found in human gastric
cancer. APMIS. 113:264–268. 2005. View Article : Google Scholar : PubMed/NCBI
|
|
26
|
Rikimaru T, Taketomi A, Yamashita Y,
Shirabe K, Hamatsu T, Shimada M and Maehara Y: Clinical
significance of histone deacetylase 1 expression in patients with
hepatocellular carcinoma. Oncology. 72:69–74. 2007. View Article : Google Scholar : PubMed/NCBI
|
|
27
|
Chang HH, Chiang CP, Hung HC, Lin CY, Deng
YT and Kuo MY: Histone deacetylase 2 expression predicts poorer
prognosis in oral cancer patients. Oral Oncol. 45:610–614. 2009.
View Article : Google Scholar
|
|
28
|
Weichert W, Röske A, Gekeler V, Beckers T,
Ebert MP, Pross M, Dietel M, Denkert C and Röcken C: Association of
patterns of class I histone deacetylase expression with patient
prognosis in gastric cancer: A retrospective analysis. Lancet
Oncol. 9:139–148. 2008. View Article : Google Scholar : PubMed/NCBI
|
|
29
|
Koh WP, Robien K, Wang R, Govindarajan S,
Yuan JM and Yu MC: Smoking as an independent risk factor for
hepatocellular carcinoma: The Singapore Chinese Health Study. Br J
Cancer. 105:1430–1435. 2011. View Article : Google Scholar : PubMed/NCBI
|
|
30
|
Kang H, Gillespie TW, Goodman M, Brodie
SA, Brandes M, Ribeiro M, Ramalingam SS, Shin DM, Khuri FR and
Brandes JC: Long-term use of valproic acid in US veterans is
associated with a reduced risk of smoking-related cases of head and
neck cancer. Cancer. 120:1394–1400. 2014. View Article : Google Scholar : PubMed/NCBI
|
|
31
|
Yamaguchi T, Cubizolles F, Zhang Y,
Reichert N, Kohler H, Seiser C and Matthias P: Histone deacetylases
1 and 2 act in concert to promote the G1-to-S progression. Genes
Dev. 24:455–469. 2010. View Article : Google Scholar : PubMed/NCBI
|
|
32
|
Noh JH, Jung KH, Kim JK, Eun JW, Bae HJ,
Xie HJ, Chang YG, Kim MG, Park WS, Lee JY, et al: Aberrant
regulation of HDAC2 mediates proliferation of hepatocellular
carcinoma cells by deregulating expression of G1/S cell cycle
proteins. PLoS One. 6:e281032011. View Article : Google Scholar : PubMed/NCBI
|
|
33
|
Aghdassi A, Sendler M, Guenther A, Mayerle
J, Behn CO, Heidecke CD, Friess H, Büchler M, Evert M, Lerch MM, et
al: Recruitment of histone deacetylases HDAC1 and HDAC2 by the
transcriptional repressor ZEB1 downregulates E-cadherin expression
in pancreatic cancer. Gut. 61:439–448. 2012. View Article : Google Scholar
|