Introduction
Human skin squamous cell carcinoma (SSCC) accounts
for more than 15% of malignant epithelial tumors, it is a malignant
tumor that can occur in normal skin, but commonly evolves from
precursor lesions. SSCC arising in ulcers is a rare and often
aggressive cutaneous malignancy that arises from chronic wounds or
old scars (1), but the mechanism is
unclear. Autophagy is the basic catabolic mechanism that involves
cell degradation of unnecessary or dysfunctional cellular
components through the actions of lysosomes, and in recent years,
numerous studies showed that autophagy is associated with the
development of many types of cancers, such as colorectal cancer
(2), gastrointestinal stromal tumor
(3), prostate cancer (4), chronic myelogenous leukemia (5) and lymphoma (6). Moreover, pharmacological modulation of
autophagy in tumors may be an important anticancer therapy, as is
supported by the use of autophagy inhibitors in a large number of
clinical trials and currently as a treatment for various types of
cancers that are generally very aggressive or resistant to therapy
(7). However, the role of autophagy
and the mechanisms remain unclear in SSCC.
Microtubule-associated protein 1 light chain 3 (LC3)
is the mammal homologous of Atg8, it locates in the membrane of the
autophagosome, it is a good marker of the process of autophagy
membrane dynamics (8). In the
present study, we evaluated the expression level of LC3, Bcl2
(9,10) and survivin (an anticancer gene)
(11) in SSCC clinical tissues.
Then we assessed clinical and pathological roles of LC3 in SSCC,
and the relationship between LC3 and Bcl2 or survivin were
analyzed. Furthermore, we used the chemotherapy drug 5-fluorouracil
(5-FU) and the autophagy inhibitor 3-methyladenine (3-MA) to
clarify the biological functions of autophagy on the proliferation,
motility, invasion and apoptosis of SSCC cells. The results in SSCC
suggested the possibility of autophagy as a potential target in
SSCC therapy. Furthermore, autophagy inhibited by 3-MA in SSCC was
able to enhance effect of 5-FU-induced chemotherapy
sensitivity.
Materials and methods
Clinical specimens and
immunohistochemical staining
A total of 100 cases of paraffin-embedded tissue of
SSCC biopsy specimens were obtained from the Department of
Pathological Anatomy of Haimen People's Hospital. The samples were
collected from the patients aged 25–90 years, and were
histologically confirmed with no radiotherapy and/or chemotherapy
before operation. Ten cases of surgical margin from the patients
with breast cancer were obtained as control (provided by the
Department of Pathological Anatomy of Nantong University Affiliated
Hospital). All of the patients were staged using the seventh
edition of the International Union Against Cancer
tumor-node-metastasis (TNM) staging system. The present study was
approved by the Institute Research Ethics Committee of the Nantong
University Affiliated Hospital of China.
Tissue chip and hematoxylin and eosin
(H&E) staining
Tissue chips were constructed by the Department of
Pathological Anatomy of Nantong University. Briefly, all tissues
were reviewed and representative areas were marked in paraffin
blocks. Two cylindrical tissue cores were removed from the donor
blocks and transferred to the recipient paraffin blocks, and their
planar array positions were noted. Consecutive sections
(4-µm thick) were cut from the array blocks and placed on
adhesion microscope slides for H&E and/or immunohistochemical
staining for observation.
Immunohistochemistry
Paraffin sections were deparaffinized in xylene,
rehydrated in alcohol concentration gradient, increasing the
accessibility of the antigens in boiling citrate buffer (pH 6.0)
for 20 min and blocking endogenous peroxidase activity in 0.3%
H2O2 at 37°C for 10 min. The sections were
blocked with non-immune goat serum at 37°C for 10 min. Then, the
sections were incubated with the primary antibodies: anti-LC3
(1:100 dilution; Abcam, USA), anti-Bcl2 (1:50 dilution),
anti-survivin (1:50 dilution) (both from Maixin Biotech, China) at
37°C for 30 min, and then at 4°C overnight. The sections were
washed by phosphate-buffered saline (PBS) for 5 min three times,
then incubated by goat anti-rabbit or mouse IgG-HRP (1:100
dilution; Boster, China), immunostaining was performed using the
diaminobenzidine (DAB) substrate chromogen solution and hematoxylin
staining were visualized with the chromogen DAB. The sections were
analyzed by two qualified independent investigators. Five
high-power fields of views per section were captured and
representative images were selected and recorded.
The immunohistochemistry scoring results were
evaluated independently by the pathologists without knowing the
patients clinicopathological outcomes, and then the results were
analyzed according to the intensity of the staining and the
relative abundance of positive cells. The positive expression of
LC3, Bcl2 and survivin were evaluated by cytoplasm/nucleus with
yellow staining. Scores were assigned for the intensity and
percentage of positive staining. Briefly, the IRS assigns subscores
for immunoreactive distribution (0–4) and intensity (0–3), and the
subscores were multiplied to yield the IRS score.
Cell lines and cell culture
A431 cells were cultured in Dulbecco's modified
Eagle's medium (DMEM) supplemented with 10% fetal bovine serum
(FBS) (Gibco, USA). The cell line was maintained at 37°C in a
humidified incubator with 5% CO2. A431 cells were kindly
provided by Professor Tianwen Gao of Xijing Hospital Affiliated to
The Fourth Military Medical University.
Cell proliferation assay
The proliferation ability of A431 cells was measured
by MTT method. A431 cells (1×10³ cells/well) were plated
into a 96-well plate for 24 h, the cells were treated with
5-fluorouracil (5-FU) (Shandong Qilu Pharmaceutical, China) at the
concentrations of 0.1, 1, 10 and 100 µg/ml; 3-MA
(Sigma-Aldrich, USA) treated groups at concentrations of 2, 4 and 8
mmol/l, 3-MA and 5-FU combined groups: i) 3-MA+ 5-FU, the cells
were treated with the optimum concentration of 3-MA at 37°C for 1
h, then the solution was removed and treated with the optimum
concentration of 5-FU; ii) 5-FU+3-MA, the cells were treated with
the optimum concentration of 5-FU at 37°C for 1 h first, then the
solution was removed and treated with the optimum concentration of
3-MA. Both groups were incubated at 37°C for 24 h. MTT (10
µl) (0.5 mg/ml; Aladdin Reagent, China) reagents were added
to each well of the 96-well plate containing 100 µl culture
medium and the plate was incubated for 4 h at 37°C, then 150
µl dimethyl-sulfoxide (DMSO) was added into each well, and
incubation continued for 10 min at 37°C. The optical density (OD)
was measured at 570 nm using a microplate reader (Bio-Rad,
USA).
Real-time quantity PCR (RT-qPCR)
The mRNA expression of LC3 in A431 cells with
different treatments were detected by RT-qPCR. A431 cells
(1×10³ cells/well) were plated into a 96-well plate for
24 h, the cells were treated as: 1 and 10 µg/ml 5-FU; 2 and
4 mmol/l 3-MA (Sigma-Aldrich); untreated group as control. Then,
the cells were incubated at 37°C for 24 h.
Total RNA of cells were extracted using a RISO™ RNA
extraction reagent according to the manufacturer's procedure and
then submitted to a RT-qPCR reaction: 12.5 µl of 2xMaster
Mix (Biomics Biotechnology, China), 0.5 µl of each forward
and reverse primers mix (10 µmol/l each), 0.5 µl of
50X SYBR-Green I and 4 µl RNA as template. Then, the samples
were subjected to reverse transcription for 30 min at 42°C and
initially denatured for 5 min at 95°C, and then 45 cycles of
amplification with the following cycling conditions: 95°C denature
for 20 sec, 58°C annealing for 30 sec and 72°C extension for 30
sec. Glyceraldehyde-3-phosphate dehydrogenase (GAPDH) served as an
internal control. All the primers were designed and obtained from
Biomics Biotechnology, the primer sequence of LC3 was forward,
5′-CCTTCTTCCTGCTGGTGAAC-3′ and reverse, 5′-TCTCCTGCTCGTAGATGTCC-3′;
the primer sequence of β-actin forward, 5′-TGCACCACCAACTGCTTAGC-3′
and reverse, 5′-GGCATGGACTGTGGTCATGAG-3′. The experiment was
performed in triplicate. The results were analyzed by
2−ΔΔCt method (12).
Western blotting
The protein level of LC3 in A431 cells with
different treatments were detected by western blotting. A431 cells
(4×10⁵ cells/well) were plated into a 6-well plate for
24 h, the cells were treated as described in RT-qPCR.
The cells were harvested at 24 h post-treatments,
and then lysed in ice-cold RIPA buffer (Pierce, USA). The
appropriate amount of total cell lysates per lane were separated
with SDS-polyacrylamide gel electrophoresis (SDS-PAGE) and
electroblotted onto polyvinylidine difluoride (PVDF) filter
membranes (Millipore, USA), followed by blocking with 5% skim milk
in TBST (20 mM Tris, 150 mM NaCl, 0.05% Tween-20, pH 7.5) for 2 h
at room temperature, then the membrane was incubated with primary
antibody of rabbit anti-human LC3 (1:500 dilution; Abcam), and
mouse anti-human β-actin (1:500 dilution; Boster) as internal
control. The membranes were then washed in TBST and incubated with
a goat anti-mouse HRP-conjugated secondary antibody (1:1,000
dilution; Boster) at room temperature for 2 h. The specific
proteins were detected with Luminol ECL reagent; the membranes were
exposed to a film (Kodak, USA).
Monodansylcadaverine (MDC) fluorescent
staining
MDC fluorescent staining was performed according to
the method previously described by Biederbick et al
(13). Briefly, a total of
5×10⁴ A431 cells were cultured on a small round slide in
a 24-well plate at 37°C overnight in a humidified incubator with 5%
CO2. When cells reached 50–60% confluence, they were
treated with different methods: 5-FU, 3-MA, 3-MA+5-FU, 5-FU+3-MA
and untreated group as control. Then, the treated cells were
incubated at 37°C for 24 h. After the slides were washed by PBS for
5 min twice, 0.05 mmol/l MDC (Sigma-Aldrich) was added to each
slide, and incubated at 37°C for 1 h protected form light, and then
washed with PBS, the slides were fixed with 4% paraformaldehyde for
15 min, after washed with PBS and mounted. The cells were observed
by immunofluorescence microscopy.
Immunocytochemistry (ICC) and confocal
laser scanning microscopy
The method of cells plating and treatments were as
in the MDC fluorescent staining. Following the different
treatments, the cells were fixed for 30 min with 4%
paraformaldehyde and permeabilized for 15 min with 0.5% Triton
X-100, after washed by PBS three times, then blocked with 1% bovine
serum albumin (BSA) for 30 min at room temperature. Subsequently,
cells were incubated overnight at 4°C with anti-LC3 antibody (1:50
dilution; Abcam), and then with TRITC-conjugated goat anti-rabbit
IgG for 2 h at 37°C. Hoechst 33258 (10 mg/ml) (Life Technologies,
USA) was used for cell nuclei stain for 30 min, then washed in PBS
and mounted in Antifade mounting medium (Beyotime, China). The
cells were observed by immunofluorescence microscopy.
Transmission electron microscopy
A431 cells were plated and treated as previously
described. Before collection, the cells were replaced with fresh
medium, and incubated at 37°C for 15 min, after being washed in
PBS, the cells were collected by centrifugation at 1,000 rpm for 10
min, and then fixed in ice-cold 2.5% glutaraldehyde in PBS,
post-fixed 2 h in 1% OsO4 with 0.1% potassium
ferricyanide, dehydrated through a graded series of ethanol
(50–90%) following incubation in a mixture of 90% ethanol and 90%
acetone (1:1) for 20 min, and then incubated in 90% acetone for
15–20 min at 4°C. After the cells were embedded and fixed, they
were cut into sections (50–60 nm). Uranyl acetate (3%) and lead
citrate stain was used for examination with a transmission electron
microscope (JEOL, Japan).
Hoechst staining
The method of cell plating and treatments were as in
MDC fluorescent staining. Following the different treatments, the
cells were fixed for 30 min with 4% paraformaldehyde, then washed
with PBS for 5 min twice. Hoechst 33258 (10 mg/ml) (Life
Technologies) was used for cell nuclei stain for 30 min, after
washing in PBS and mounted in Antifade mounting medium. The cells
were observed by immunofluorescence microscopy. Cell apoptotic
index (AI) was obtained by counting the number of apoptotic cells
with condensed nuclei among the cells in six to eight randomly
selected view fields.
Cell migration assay
The migration of A431 cells with different
treatments was detected by wound-healing assay. Cells were plated
and treated as previously described into a 12-well plate at the
density of 1×10⁶ cells/well. After 48 h, wound was made
through confluent monolayer cells with a pipette tip and cells were
washed with PBS and then DMEM medium with no FBS. Images of cells
were captured at 0, 24 and 48 h to monitor cell movements.
Cell invasion assay
The invasion ability of A431 cells affected by
different treatments was determined by Matrigel Transwell assay.
Before treatment, Transwell chambers (Corning, USA) were treated
with 20 µl Matrigel (BD, USA) (1:8 diluted in DMEM medium)
per well at 37°C for 1 h. A431 cells were treated with 0.25%
trypsin and suspended in DMEM containing 5-FU and/or 3-MA, 100
µl cell (1×10⁵ cells) suspensions were added into
each upper chamber and 500 µl DMEM containing 10% FBS, and
incubated at 37°C for 24 h. The cells on the top surface of the
membrane were carefully removed with a cotton swab. Cells on the
Transwell chambers were fixed by 75% ethanol for 10 min, washed
with PBS and then stained by 0.2% crystal violet for 10 min, after
washing with PBS twice, the invaded cells on the bottom surface of
the membrane were counted in five random fields (magnification,
×100) per membrane, and the average number of migrated cells per
field was calculated.
Statistical analysis
The experiments were independently performed three
times, the results are shown as mean ± standard deviation (SD), and
statistical analyses were performed using SPSS 19.0 software. The
differences between groups were compared using Student's t-test,
one way ANOVA, χ2 test and Pearson's correlation
analysis to assess statistical significance. All P-values were
based on a two-sided statistical analysis and P<0.05 was
considered to indicate statistical significance.
Results
The expression of LC3 in the SSCC and the
association of Beclin-1 expression with clinicopathological factors
of SSCC
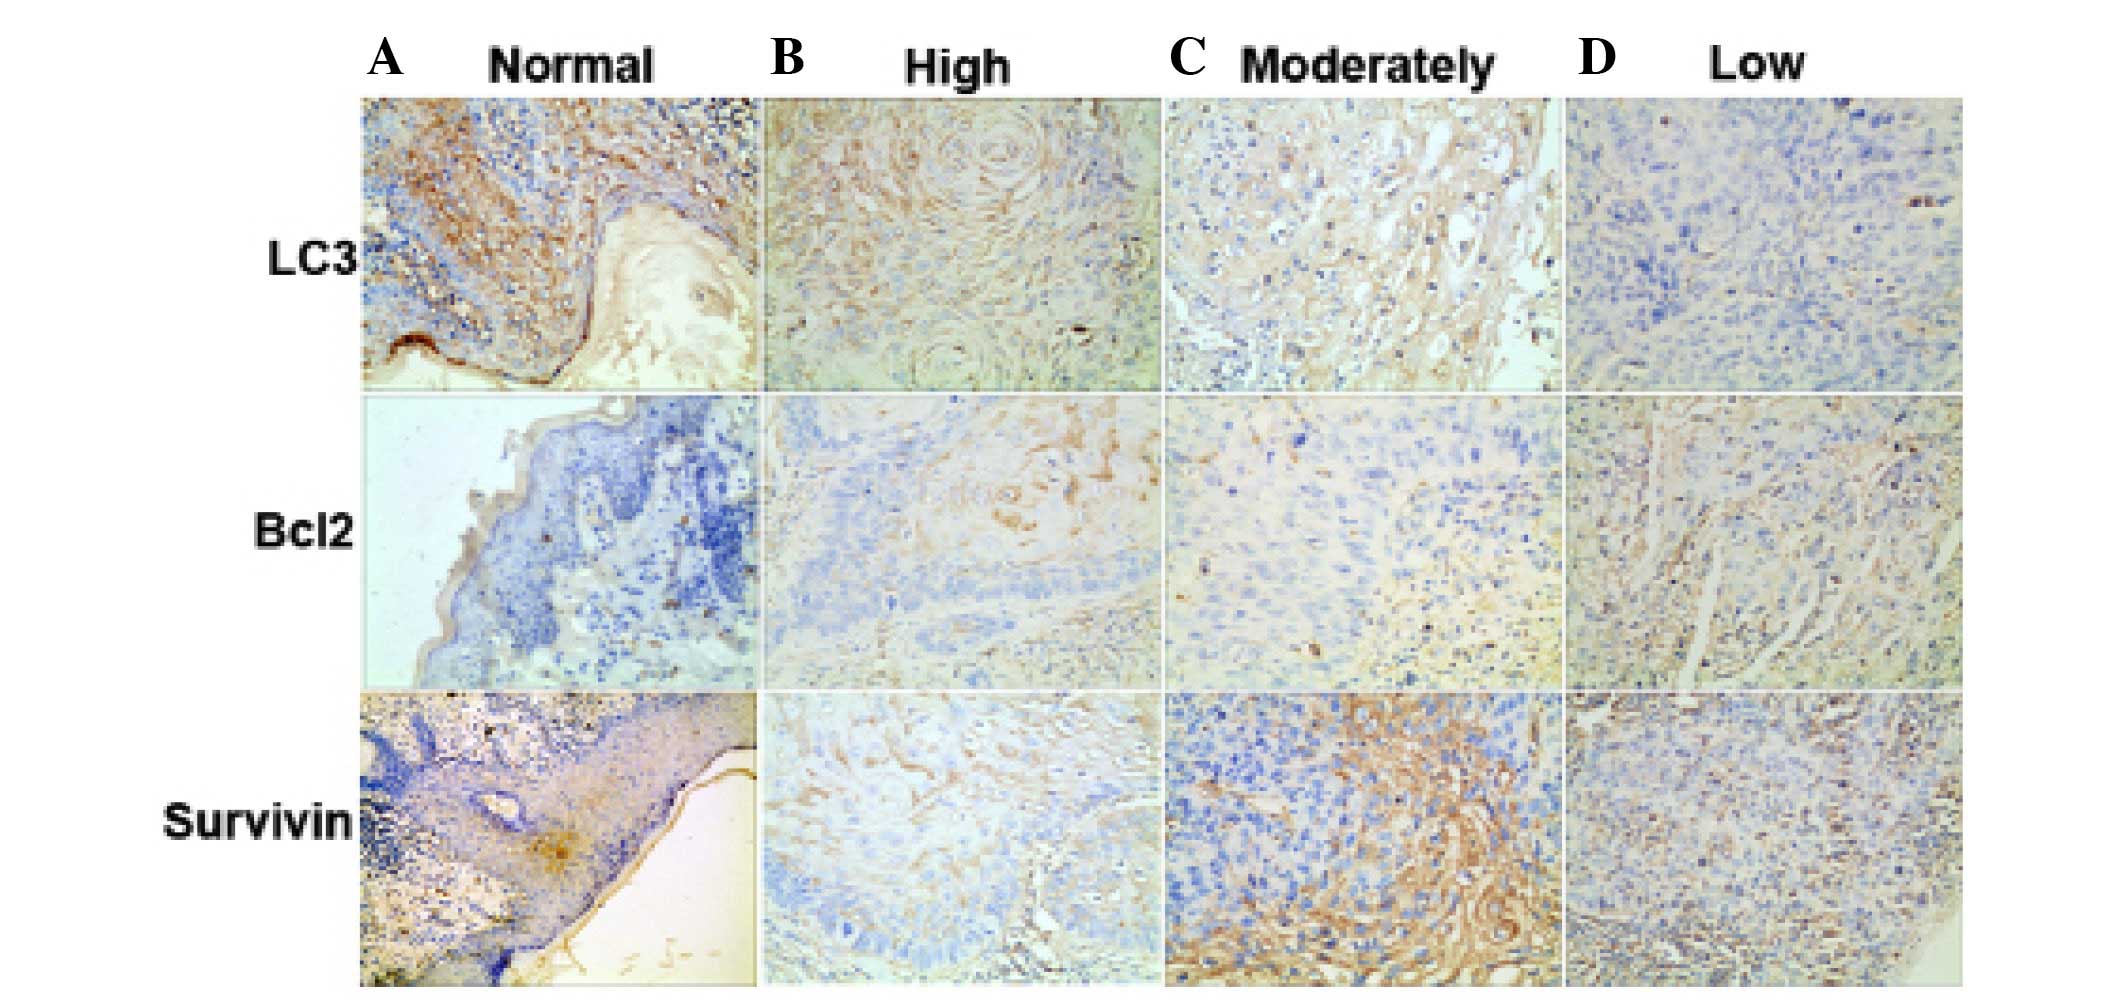
The expression of LC3, Bcl2 and survivin in 100
cases of SSCC tissues and 10 cases of surgical margin from breast
cancers on tissue chip were detected by immunohistochemical
analysis (Fig. 1). A significant
difference was observed in LC3 expression between SSCC and control
samples (P<0.005) (Table I).
 | Table ICorrelation between LC3 expression and
clinicopathological characteristics in SSCC. |
Table I
Correlation between LC3 expression and
clinicopathological characteristics in SSCC.
| Clinicopathological
parameters | No. case | LC3
| χ2 | P-value |
|---|
| (−) | (+) | (++) |
|---|
| Age (years) |
| ≤63 | 53 | 24 | 19 | 10 | 0.310 | 0.857 |
| >63 | 47 | 20 | 16 | 11 | | |
| Location/site |
| Head and face | 70 | 32 | 23 | 15 | 1.246 | 0.975 |
| Body | 6 | 2 | 3 | 1 | | |
| The limbs | 5 | 2 | 2 | 1 | | |
| Genitalia | 19 | 8 | 8 | 3 | | |
| Thickness (mm) |
| ≤5 | 83 | 31 | 37 | 15 | 8.777 | 0.012a |
| >5 | 17 | 13 | 3 | 1 | | |
| TNM stages |
| I | 40 | 10 | 20 | 10 | 16.053 | 0.013a |
| II | 49 | 26 | 18 | 5 | | |
| III | 6 | 3 | 3 | 0 | | |
| IV | 5 | 5 | 0 | 0 | | |
| Types |
| Typical | 54 | 15 | 25 | 13 | 13.506 | 0.036a |
| Acantholytic
SCC | 23 | 14 | 8 | 2 | | |
| Spindle cell
SCC | 12 | 7 | 3 | 2 | | |
| Verrucous SCC | 11 | 8 | 3 | 0 | | |
| Lymph node
metastasis |
| Yes | 5 | 0 | 0 | 0 | 6.699 | 0.036a |
| No | 95 | 39 | 44 | 12 | | |
The results showed that the positive staining of LC3
was 56%, while ~100% in normal tissues (P<0.005), the positive
staining of Bcl2 was 85%, while no expression in normal tissues
(P<0.005), the positive staining of survivin was 96%, while no
expression in normal tissues (P<0.005).
The expression level of LC3 was associated with the
clinicopathological factors of SSCC. The clinical and pathological
data of 100 SSCC patients is displayed in Table I. There was no statistical
differences found between LC3 positive expression and the
characteristics of age and disease site (P>0.05). However, LC3
overexpression in SSCC was strongly associated with thickness
(P=0.012) and TNM stages (P=0.013), types (P=0.036) and lymph node
metastasis (P=0.036) (Table I).
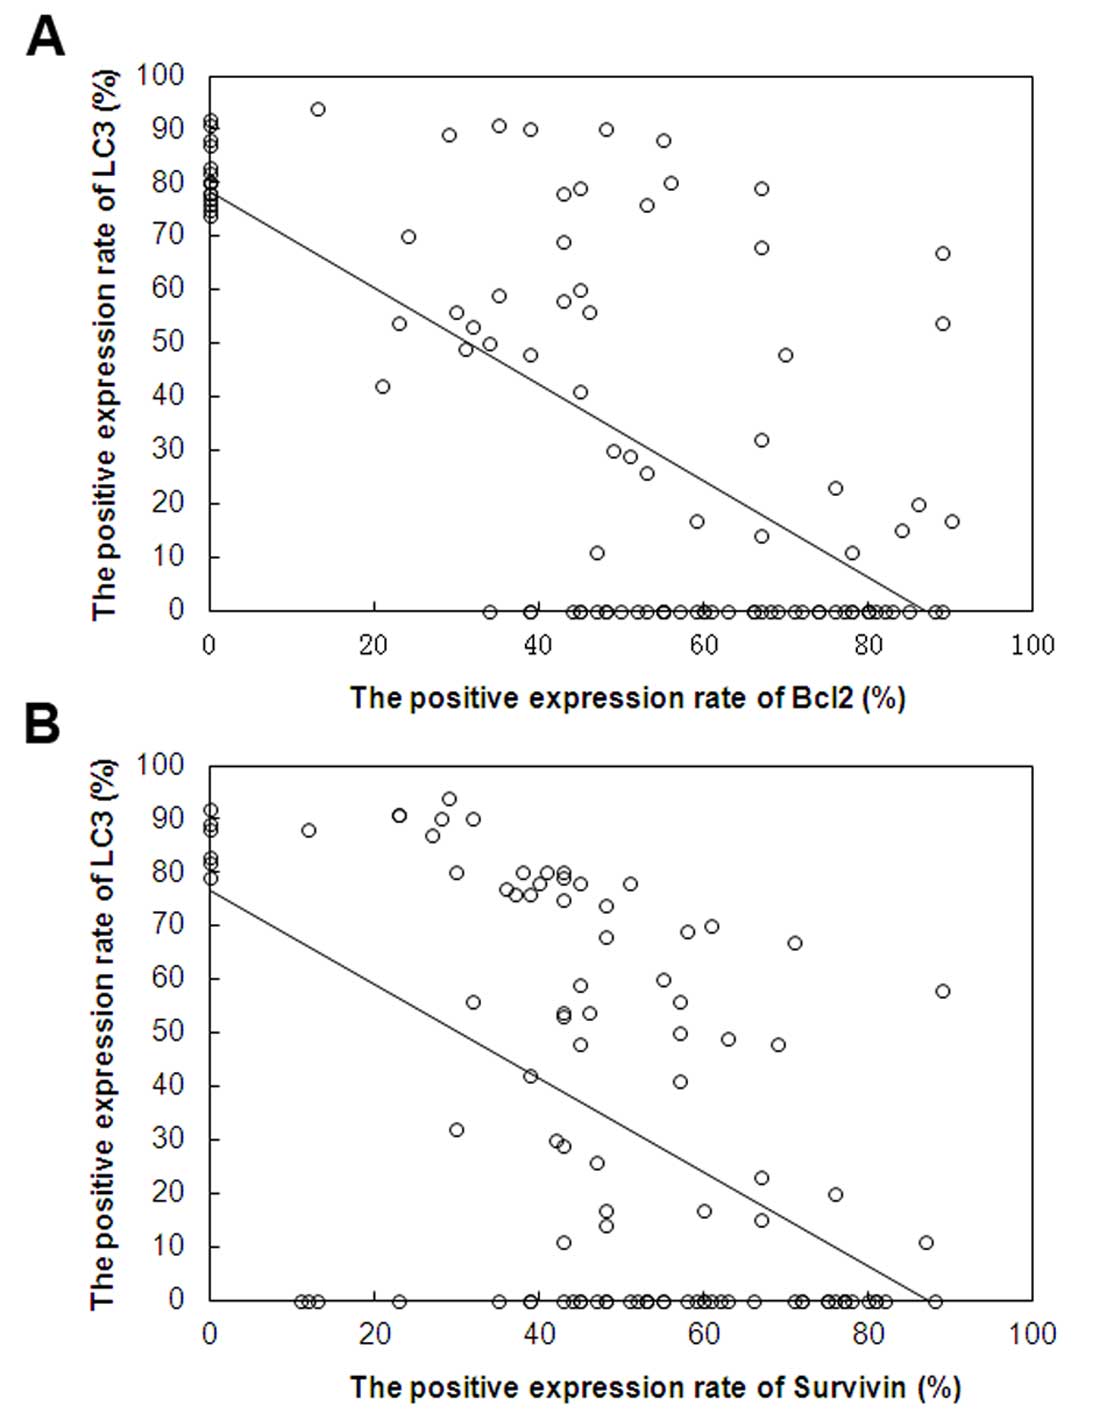
The correlation of the expression of LC3,
Bcl2 and survivin in SSCC
As shown in Fig. 2,
Pearson's correlation analysis shows the association between the
expression of LC3 and Bcl2, LC3 and survivin in 100 cases of SSCC.
Significant negative correlations were the expression of LC3 and
Bcl2 (r=−0.680, P<0.05), LC3 and survivin (r=−0.531,
P<0.05).
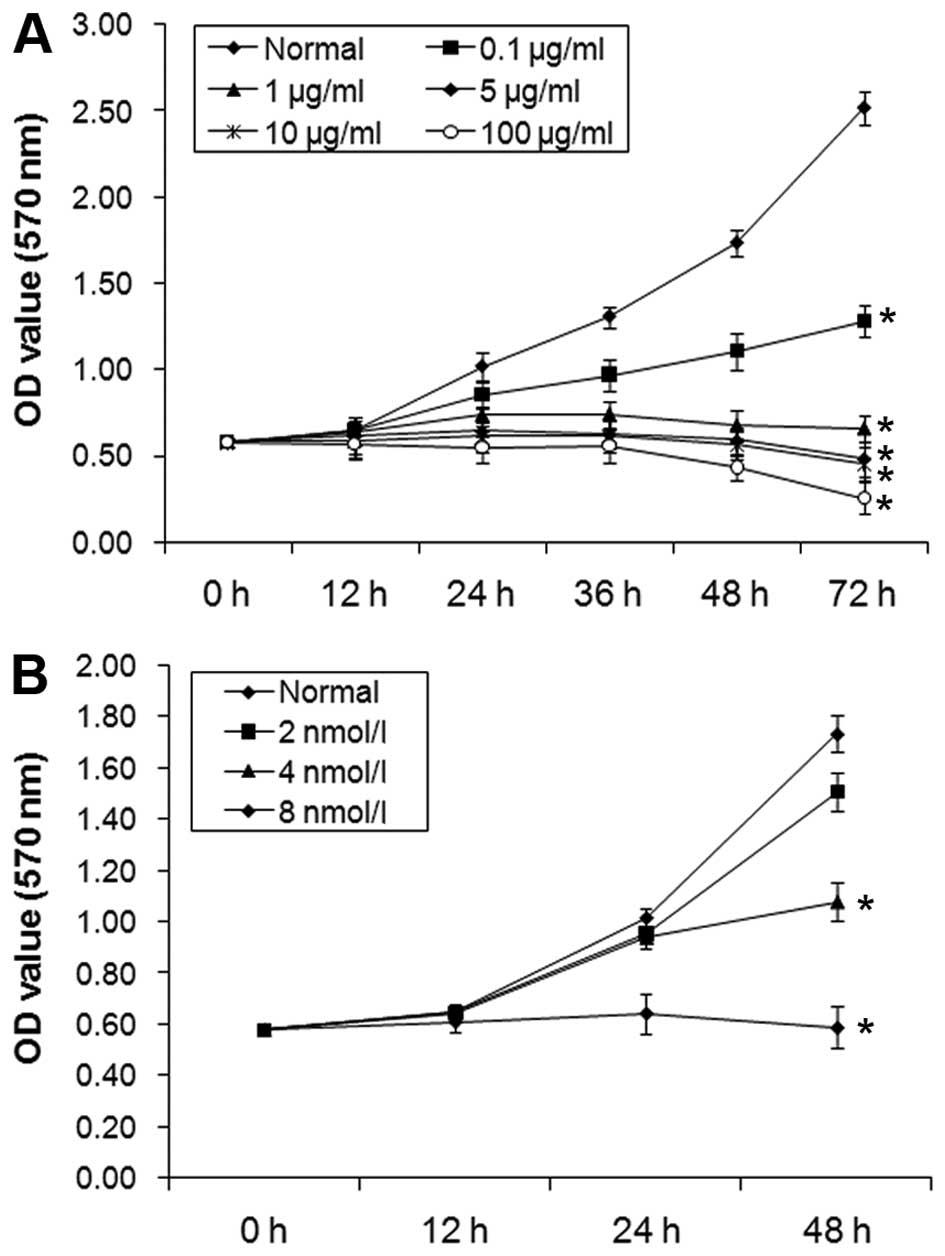
The effect of 5-FU and 3-MA on the
proliferation of A431 cells is dose-dependent
The results of MTT assay showed that the inhibition
rate of A431 cell proliferation was increased according to increase
concentration of 5-FU with 0.1, 1, 10 and 100 µg/ml
(Fig. 3A). Moreover, with
increasing concentration of 3-MA with 2, 4 and 8 mmol/l, the
inhibition rates of proliferation in A431 cells increased (Fig. 3B). The increase of proliferation
inhibition of A431 cells was time-dependent.
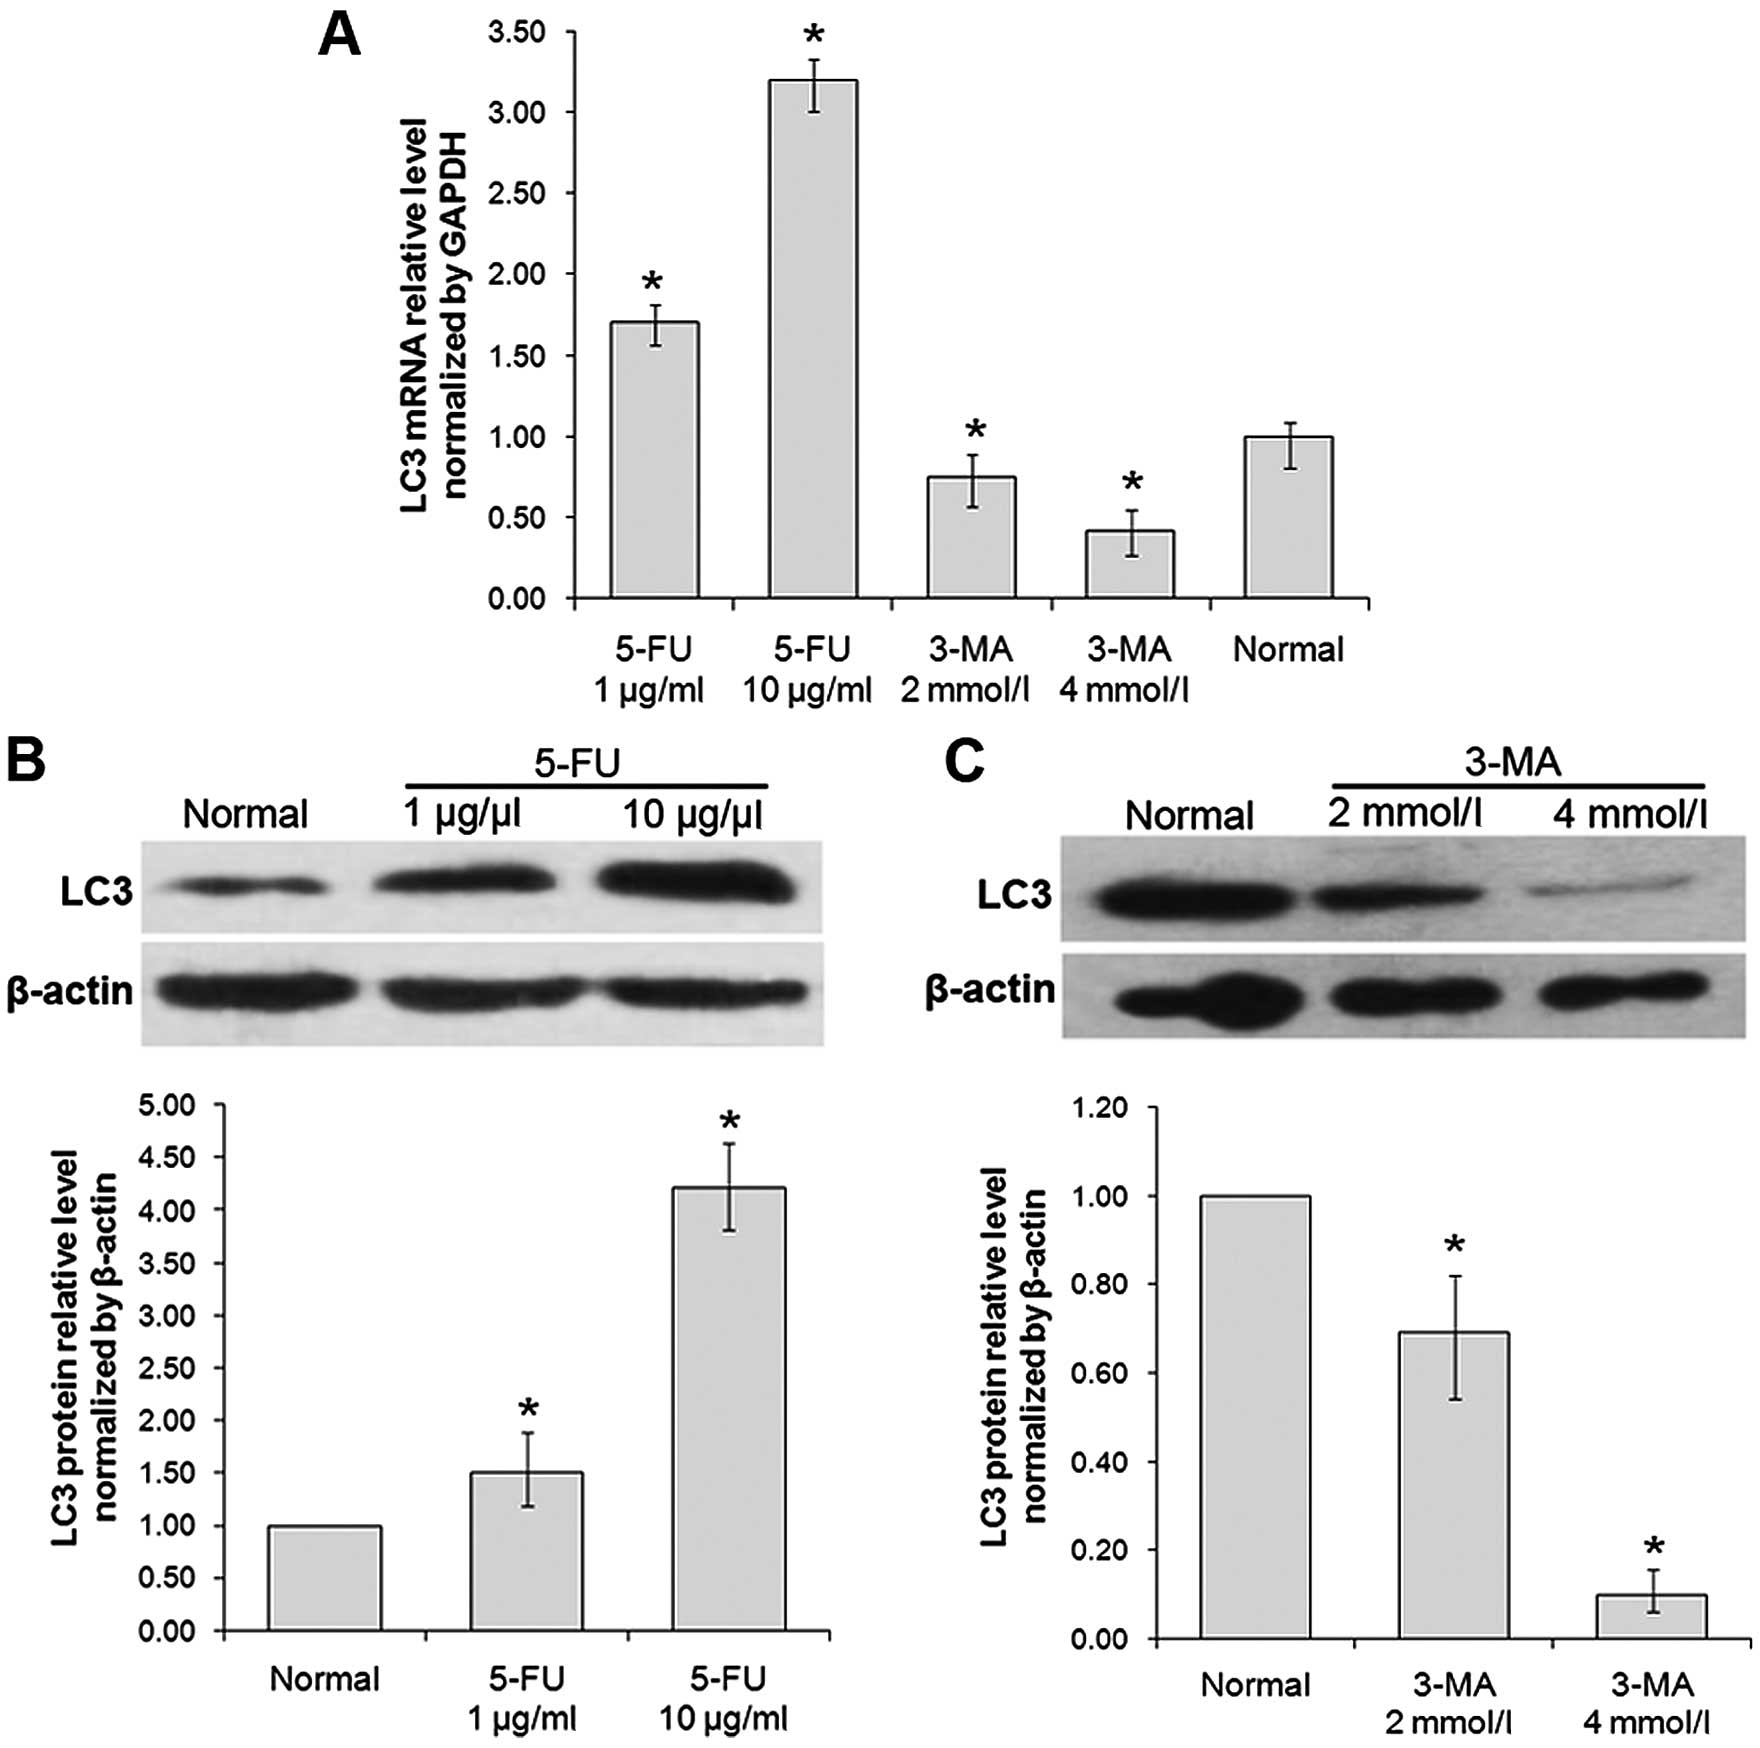
The expression of LC3 and inhibition
effect of autophagy formation in A431 cells
The results of RT-qPCR showed that the mRNA level of
LC3 was, respectively, 1.73- and 3.11-fold increased with the
treatment of 5-FU (1 and 10 µg/ml) for 24 h, compared with
normal group (P<0.05); and the mRNA level of LC3 was 25 and 69%
decreased with the treatment of 3-MA (2 and 4 mmol/l) for 24 h,
respectively, compared with normal group (P<0.05) (Fig. 4A).
The results of western blotting showed that the
protein level of LC3 was 1.79- and 3.19-fold increased with the
cells treated by 1 and 10 µg/ml 5-FU for 24 h, compared with
normal group (P<0.05); and the protein level of LC3 was 22 and
72% decreased, respectively, with the cells treated by 2 and 4
mmol/l 3-MA for 24 h, compared with normal group (P<0.05)
(Fig. 4B).
The results of MTT, RT-qPCR and western blotting
showed that the expression of LC3 was increased significantly in
A431 cells treated with 5-FU at the concentration of 10
µg/ml, while the inhibition rate were increased up to 40%
whereas, treatment with 3-MA at the concentration of 4 mmol/l, the
inhibition rate was increased up to 20%. Thus, 10 µg/ml 5-FU
and 4 mmol/l 3-MA were used for further studies.
The expression of LC3 and inhibition of
autophagy formation in A431 cells
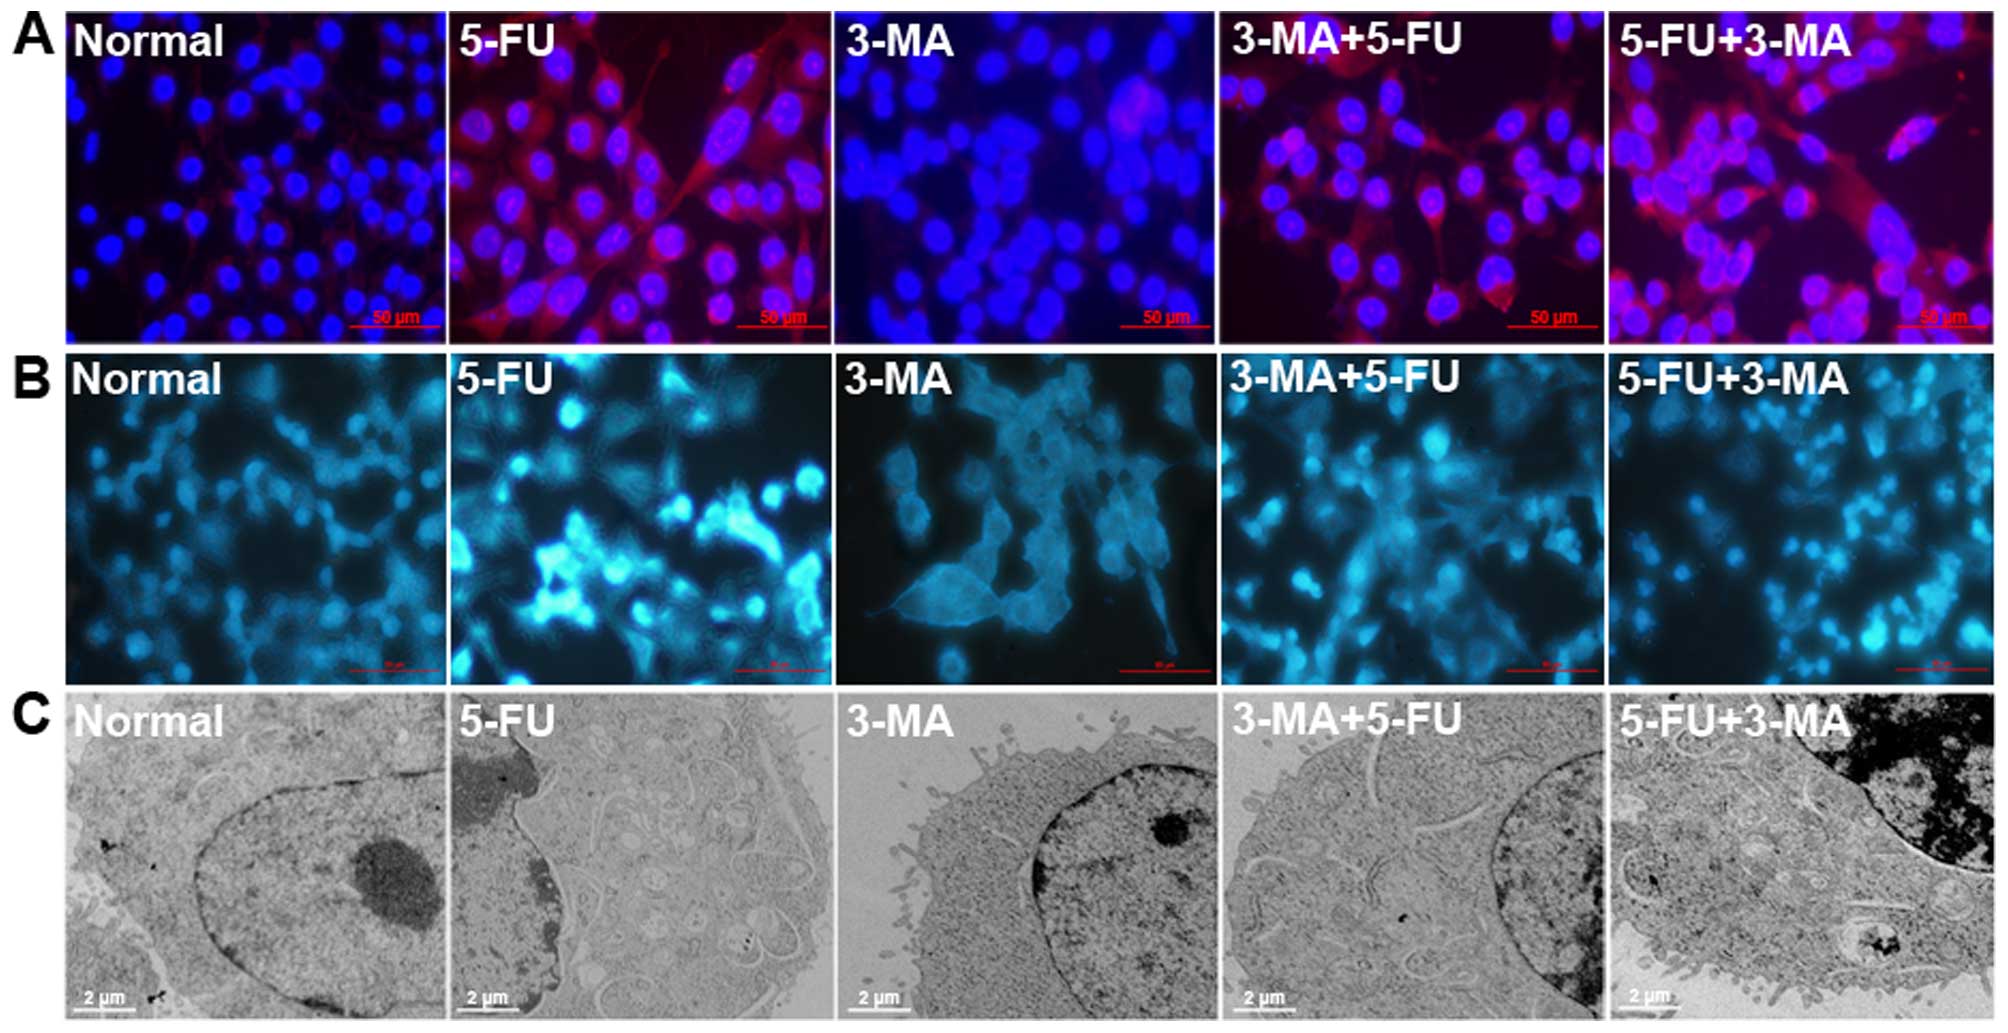
The result of ICC showed that the expression level
of LC3 in 3-MA+5-FU group was lower than other groups (Fig. 5A). MDC is a fluorescent substance,
which is used to detect the occurrence of autophagy, as shown in
Fig. 5B, there was some autophagy
in the normal A431 cells. Compared with normal cells, the numbers
of MDC-labeled cells in 5-FU treated group were increased, the cell
autophagy was induced by 5-FU, but in the 3-MA treated group it was
decreased. There was stronger punctate fluorescence of MDC than
5-FU, but there was no obvious difference in 5-FU+3-MA treated
group.
Compared with normal cells, many autophagic vacuoles
formed in the cytoplasm of A431 cells treated by 5-FU for 24 h
revealed by transmission electron microscopy (Fig. 5C), and no evident autophagic
vacuoles formed in 3-MA treated cells, the number of autophagosomes
in 3-MA+5-FU treated group was less than 5-FU treated group.
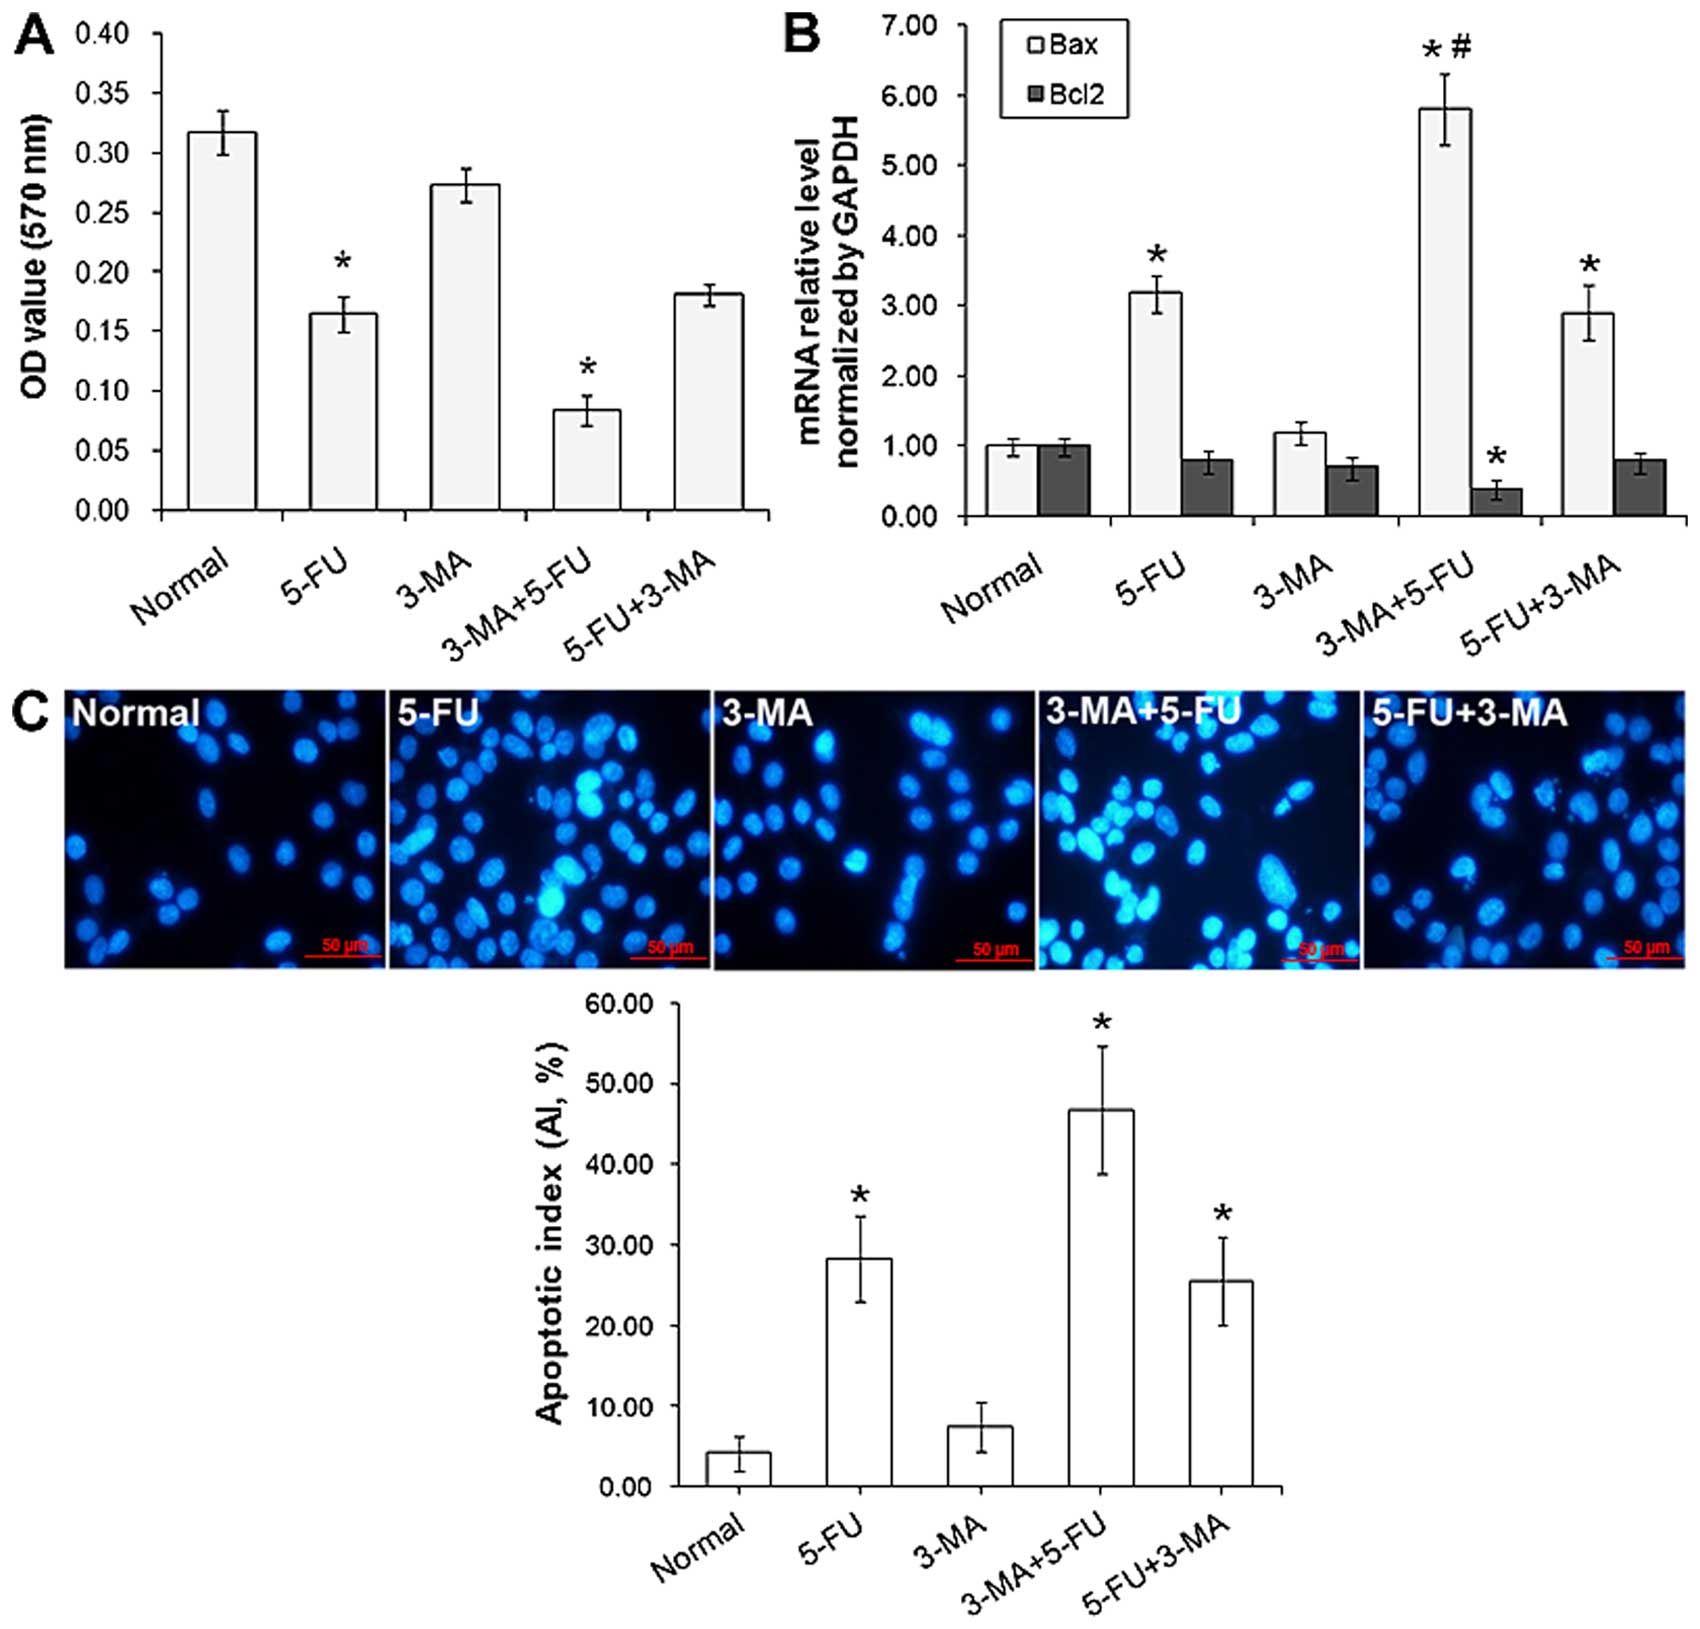
Inhibition effects of 3-MA and/or 5-FU on
the proliferation and apoptosis of A431 cells
Inhibition effect of A431 cell proliferation treated
with 3-MA and/or 5-FU was detected by MTT assay. As shown in
Fig. 6A, the proliferation of A431
was inhibited by 5-FU significantly, treated for 24 h the
inhibition rate was 45%, and there was no obviously inhibition in
3-MA treated group. Yet, in 5-FU+3-MA treated group, the inhibition
rate was up to 68%, the proliferation of A431 cells showed stronger
inhibition than the other groups (P<0.05). In 5-FU+3-MA treated
group, the inhibition rate was lower than in 5-FU (P>0.05). The
results further illustrated that suppression effect of tumor cells
could be re-enhanced efficiency by the method of autophagy specific
inhibitor 3-MA-treated before chemotherapy drug 5-FU.
The expression of apoptotic genes Bax and Bcl2 were
detected by RT-qPCR. As shown in Fig.
6B, compared with normal cells, the mRNA level of Bax was
obviously increased, particularly when compared with 5-FU
(P<0.05), and the mRNA level of Bcl2 in 3-MA+5-FU was decreased
(P<0.05).
The effects of 3-MA and/or 5-FU on cell apoptosis
were detected by Hoechst nuclear staining, as shown in Fig. 6C, typical cell apoptotic features
with condensed nucleic were observed, and the AI in 3-MA+5-FU
treated group was 46%, which is significantly (P<0.05) higher
than the 5-FU treated group (28%).
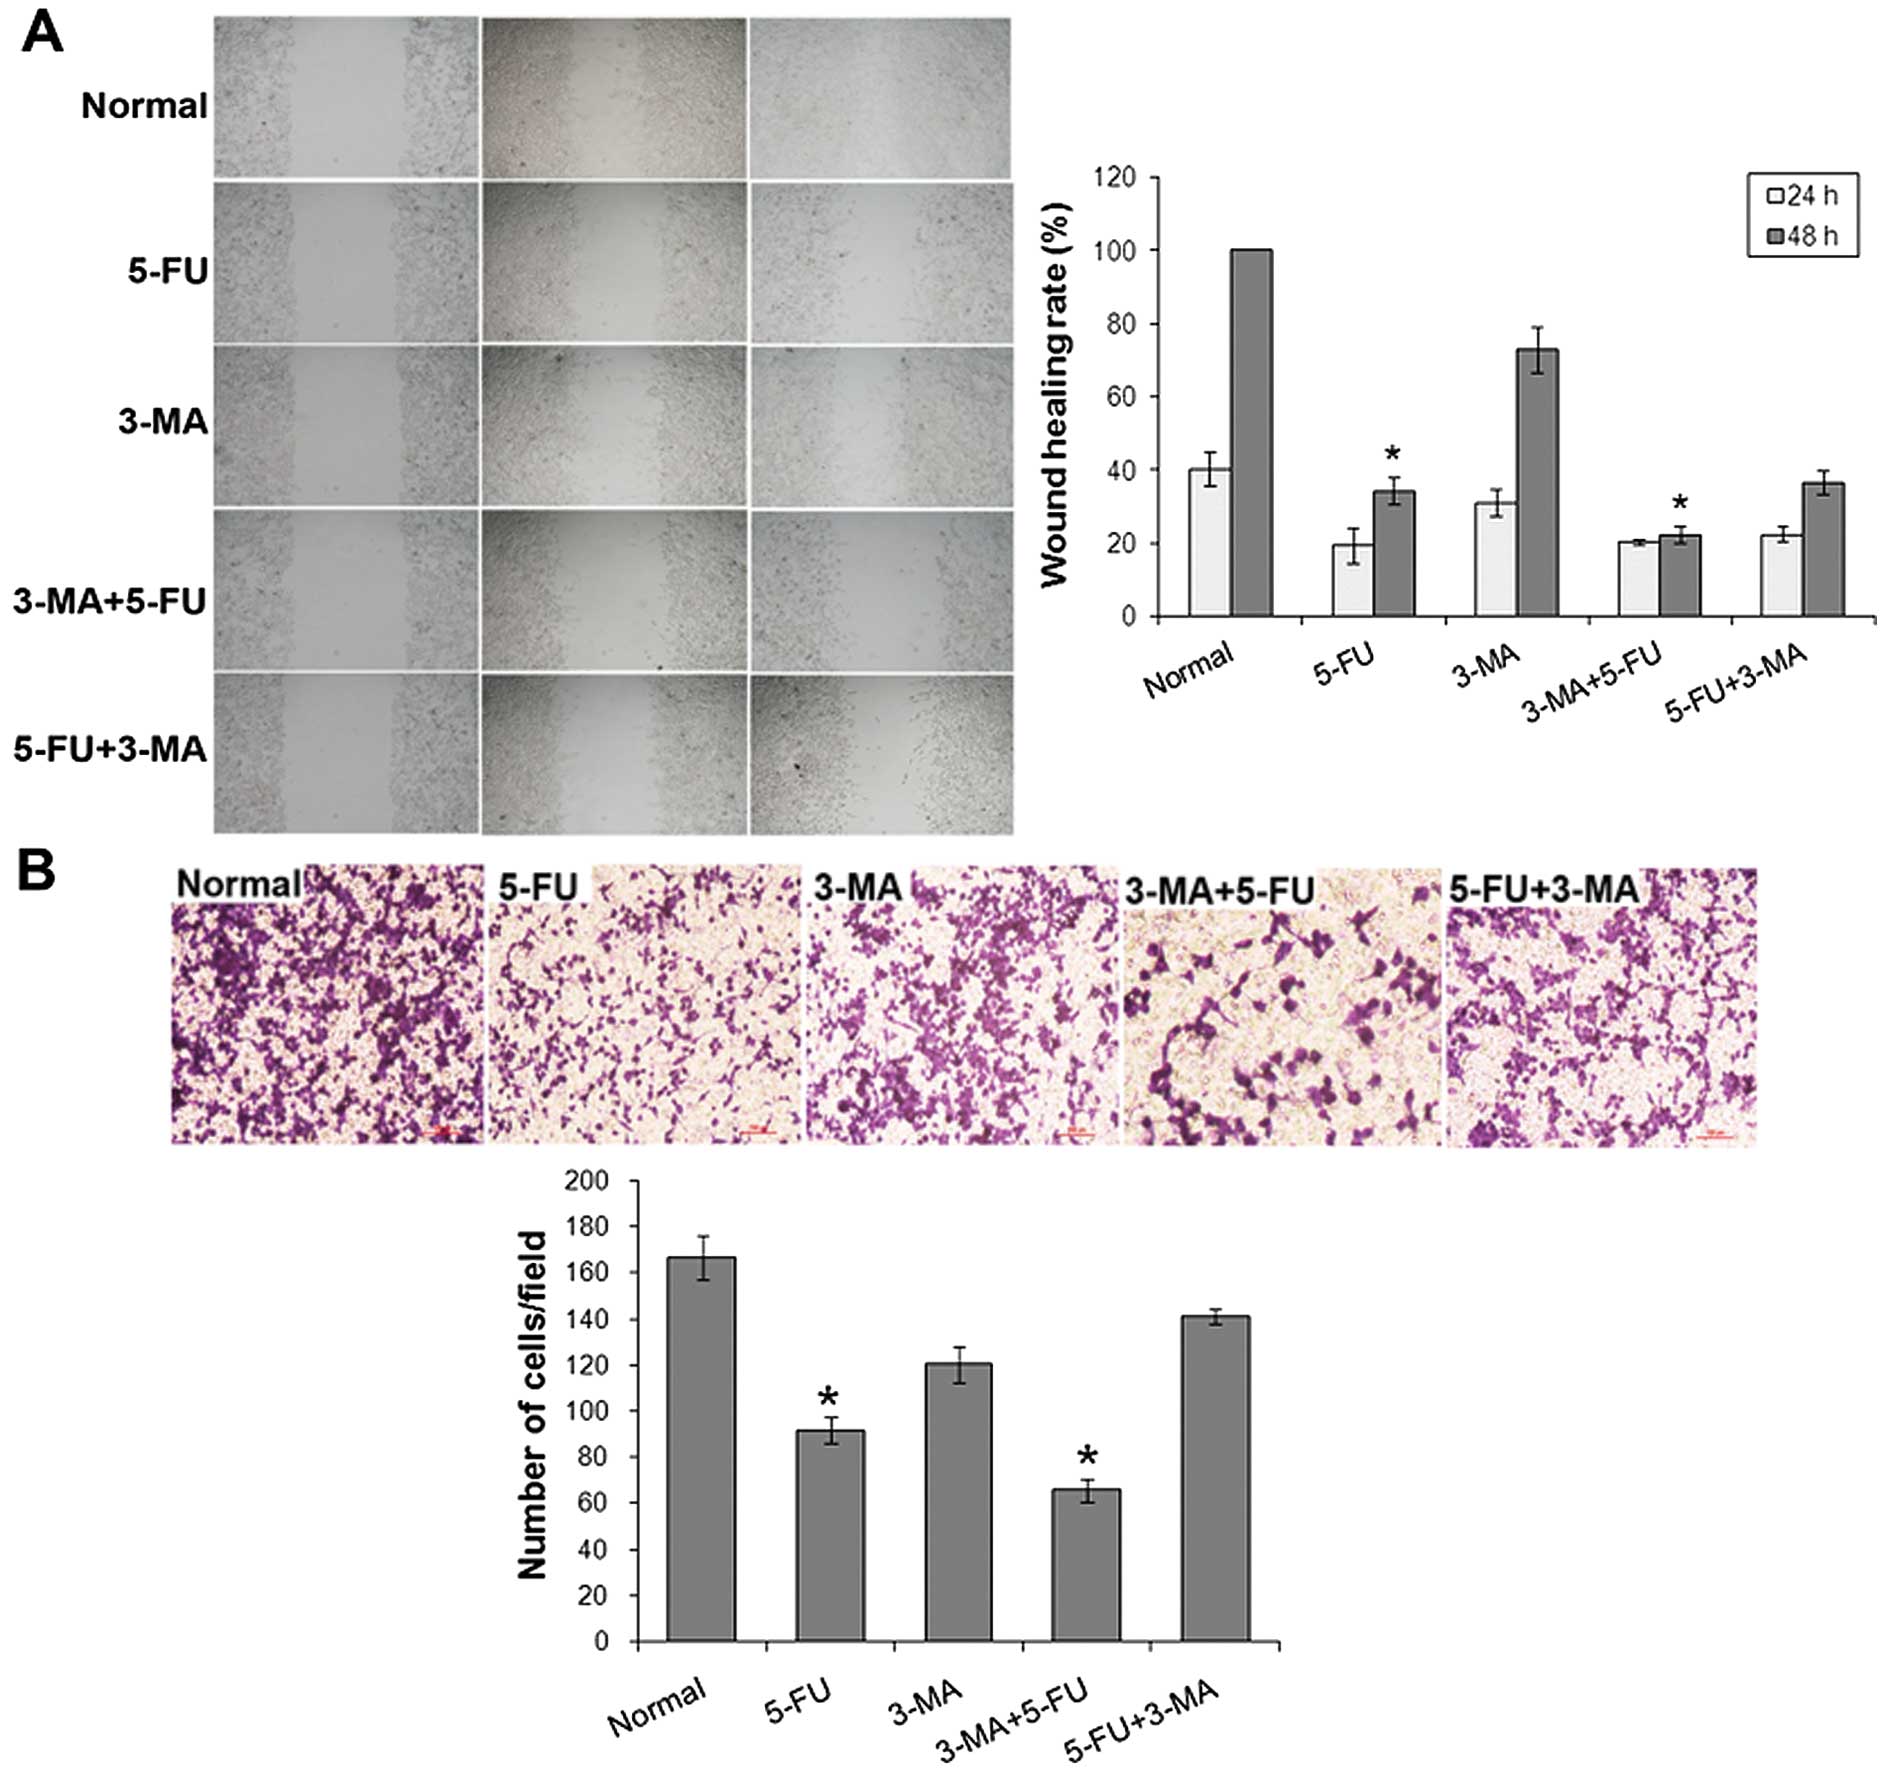
Inhibition effects of 3-MA and/or 5-FU on
the migration and invasion of A431 cells
The migration inhibition effect of A431 cells
treated with 3-MA and/or 5-FU was detected by wound healing assay
(Fig. 7A). The wound healing rate
of normal cells at 24 and 48 h was, respectively (40.06±4.54)% and
100%, 5-FU treated cells was (19.24±4.89)% and (34.13±3.80)%,
3-MA+5-FU treated cells was (20.15±0.58)% and (22.20±2.29)%.
Compared with normal cells and 5-FU treated group, the ability of
cell wound healing was significantly (P<0.05) decreased.
The invasion inhibition effect of A431 cells treated
with 3-MA and/or 5-FU was detected by Transwell assay (Fig. 7B). The cell invasion was inhibited
by 10 µg/ml 5-FU and 3-MA+5-FU treated cells were inhibited
significantly (P<0.05).
Discussion
SSCC is the most common form of non-melanoma skin
cancer, which can occur in normal skin, but often originate in
precancerous lesions, particularly actinic keratosis, Bowen's
disease, and also from actinic cheilitis, alphelasma,
radiodermatitis, arsenical ketatosis, angioderma pigmentosum,
chronic ulcer, burn scars and erosive oral lichen planus. SSCC is
the second most common type of skin malignant tumors, and
>250,000 cases are diagnosed per year (14). Most of the SSCC (80–90%) develop
from the skin of head and neck, is due to chronic ultraviolet light
exposure for many years, mainly due to an outdoor occupation
(15,16). In most cases, SSCC is easily treated
by simple excision or radiation therapy, however, locally advanced
tumor recur in lymph nodes or distant metastasis (17,18).
SSCC could be easily transferred to local lymph nodes at the
beginning, followed by the lung, liver and other organs. Transfer
risk varies depending on the lesion location, the lips and ear risk
is 10–15%, the transfer rate of SSCC in penis, scrotum and anus is
higher than in lips, in other exposed parts it is 2%. Therefore,
research on the mechanism is important for the SSCC treatment and
prevention of recurrence and metastasis.
Autophagy is a common phenomenon in eukaryotic
cells. The breakdown of cellular components promotes cellular
survival during starvation by maintaining cellular energy levels,
autophagy allows the degradation and recycling of cellular
components (19), the autophagosome
formed during this process, then fuses with a lysosome and its
cargo is degraded and recycled. In many diseases, autophagy was
seen as an adaptive response to stress which promotes survival,
whereas it appears to promote cell death in other cases (20). Yet, there is no previous
investigation concerning autophagy in SSCC. In the present study,
we investigated the relationship between the autophagy related gene
LC3 (the mammalian homologue of yeast Atg8, autophagy-related
protein Atg8 is a protein encoded by 117 amino acid, it is
expressed in the early independent cell membrane, autophagosome and
the surface of autophagosome) and Bcl2 or survivin, the results
show that the expression of LC3 is negatively correlated with Bcl2
and/or survivin, revealing that the phenomena of autophagy also
occurred in SSCC. Furthermore, the proliferation, motility,
invasion and apoptosis of SSCC cells could be inhibited by 3-MA
and/or 5-FU, particularly with the order of 3-MA treatment first
and then 5-FU, suggested that 3-MA and 5-FU combination treatment
may be an effective SSCC therapy via autophagy modulation.
Acknowledgments
The present study was supported by the Foundation of
the Production-Study-Research prospective joint research programs
of Jiangsu Province, China (no. BY 2013042-06), and from the
Science Foundation of Nantong City, Jiangsu Province, China (nos.
BK 2014001 and HS 2014004).
References
|
1
|
Cocchetto V, Magrin P, de Paula RA, Aidé
M, Monte Razo L and Pantaleão L: Squamous cell carcinoma in chronic
wound: Marjolin ulcer. Dermatol Online J. 19:72013.PubMed/NCBI
|
|
2
|
Chresta CM, Davies BR, Hickson I, Harding
T, Cosulich S, Critchlow SE, Vincent JP, Ellston R, Jones D, Sini
P, et al: AZD8055 is a potent, selective, and orally bioavailable
ATP-competitive mammalian target of rapamycin kinase inhibitor with
in vitro and in vivo antitumor activity. Cancer Res. 70:288–298.
2010. View Article : Google Scholar
|
|
3
|
Ogata M, Hino S, Saito A, Morikawa K,
Kondo S, Kanemoto S, Murakami T, Taniguchi M, Tanii I, Yoshinaga K,
et al: Autophagy is activated for cell survival after endoplasmic
reticulum stress. Mol Cell Biol. 26:9220–9231. 2006. View Article : Google Scholar : PubMed/NCBI
|
|
4
|
Feldman ME, Apsel B, Uotila A, Loewith R,
Knight ZA, Ruggero D and Shokat KM: Active-site inhibitors of mTOR
target rapamycin-resistant outputs of mTORC1 and mTORC2. PLoS Biol.
7:e382009. View Article : Google Scholar : PubMed/NCBI
|
|
5
|
Stein M, Lin H, Jeyamohan C, Dvorzhinski
D, Gounder M, Bray K, Eddy S, Goodin S, White E and Dipaola RS:
Targeting tumor metabolism with 2-deoxyglucose in patients with
castrate-resistant prostate cancer and advanced malignancies.
Prostate. 70:1388–1394. 2010. View Article : Google Scholar : PubMed/NCBI
|
|
6
|
Alexander A, Cai SL, Kim J, Nanez A, Sahin
M, MacLean KH, Inoki K, Guan KL, Shen J, Person MD, et al: ATM
signals to TSC2 in the cytoplasm to regulate mTORC1 in response to
ROS. Proc Natl Acad Sci USA. 107:4153–4158. 2010. View Article : Google Scholar : PubMed/NCBI
|
|
7
|
Ávalos Y, Canales J, Bravo-Sagua R,
Criollo A, Lavandero S and Quest AF: Tumor suppression and
promotion by autophagy. BioMed Res Int. 2014:6039802014. View Article : Google Scholar : PubMed/NCBI
|
|
8
|
Satoo K, Noda NN, Kumeta H, Fujioka Y,
Mizushima N, Ohsumi Y and Inagaki F: The structure of Atg4B-LC3
complex reveals the mechanism of LC3 processing and delipidation
during autophagy. EMBO J. 28:1341–1350. 2009. View Article : Google Scholar : PubMed/NCBI
|
|
9
|
Levine B, Sinha S and Kroemer G: Bcl-2
family members: Dual regulators of apoptosis and autophagy.
Autophagy. 4:600–606. 2008. View Article : Google Scholar : PubMed/NCBI
|
|
10
|
McCarthy A, Marzec J, Clear A, Petty RD,
Coutinho R, Matthews J, Wilson A, Iqbal S, Calaminici M, Gribben
JG, et al: Dysregulation of autophagy in human follicular lymphoma
is independent of overexpression of BCL-2. Oncotarget.
5:11653–11668. 2014. View Article : Google Scholar : PubMed/NCBI
|
|
11
|
Mita AC, Mita MM, Nawrocki ST and Giles
FJ: Survivin: Key regulator of mitosis and apoptosis and novel
target for cancer therapeutics. Clin Cancer Res. 14:5000–5005.
2008. View Article : Google Scholar : PubMed/NCBI
|
|
12
|
Livak KJ and Schmittgen TD: Analysis of
relative gene expression data using real-time quantitative PCR and
the 2−ΔΔCT method. Methods. 25:402–408. 2001.
View Article : Google Scholar
|
|
13
|
Biederbick A, Kern HF and Elsässer HP:
Monodansylcadaverine (MDC) is a specific in vivo marker for
autophagic vacuoles. Eur J Cell Biol. 66:3–14. 1995.PubMed/NCBI
|
|
14
|
Alam M and Ratner D: Cutaneous
squamous-cell carcinoma. N Engl J Med. 344:975–983. 2001.
View Article : Google Scholar : PubMed/NCBI
|
|
15
|
Veness MJ: Advanced non melanoma skin
cancers of the head and neck: An overview on management. Cancer
Forum. 30:195–201. 2006.
|
|
16
|
Ramirez CC, Federman DG and Kirsner RS:
Skin cancer as an occupational disease: The effect of ultraviolet
and other forms of radiation. Int J Dermatol. 44:95–100. 2005.
View Article : Google Scholar : PubMed/NCBI
|
|
17
|
de Lima Vazquez V, Sachetto T, Perpetuo NM
and Carvalho AL: Prognostic factors for lymph node metastasis from
advanced squamous cell carcinoma of the skin of the trunk and
extremities. World J Surg Oncol. 6:732008. View Article : Google Scholar : PubMed/NCBI
|
|
18
|
Cherpelis BS, Marcusen C and Lang PG:
Prognostic factors for metastasis in squamous cell carcinoma of the
skin. Dermatol Surg. 28:268–273. 2002.PubMed/NCBI
|
|
19
|
Lin NY, Beyer C, Giessl A, Kireva T,
Scholtysek C, Uderhardt S, Munoz LE, Dees C, Distler A, Wirtz S, et
al: Autophagy regulates TNFα-mediated joint destruction in
experimental arthritis. Ann Rheum Dis. 72:761–768. 2013. View Article : Google Scholar
|
|
20
|
Patel AS, Lin L, Geyer A, Haspel JA, An
CH, Cao J, Rosas IO and Morse D: Autophagy in idiopathic pulmonary
fibrosis. PLoS One. 7:e413942012. View Article : Google Scholar : PubMed/NCBI
|