Introduction
Colorectal cancer is the leading cause of cancer
related death globally. Colorectal cancer results from genetic and
epigenetic changes in epithelial cells leading to transformation
into adenocarcinoma and subsequently metastasis (1). The prognosis of patients with advanced
colorectal cancer remains poor and hetero geneous despite advances
in the early diagnosis and treatment of colorectal cancer (2). There are no biomarkers recognized for
advanced colorectal cancer as a cause for the poor prognosis of
patients (3). There is an urgent
need for finding markers for the detection of early colorectal
cancer.
The p53 tumor suppressor gene plays an important
role in response to cellular stress and inhibiting tumor growth by
inducing cell cycle arrest, senescence and apoptosis. Loss of p53
function leads to most cancer development (4). The TP53-induced glycolysis and
apoptosis regulator (TIGAR) is a p53-inducible gene and has been
investigated by gene micro-array analysis, and is located on
chromosome 12p13-3 (5,6). TIGAR shares similarities with the
bisphosphatase domain of phosphofructokinase (PFK-2)/fructose bis
phosphatase (FBPase-2) (6). TIGAR
functions like FBPase-2, which lead to the depletion of
intracellular fructose-2, 6-bisphosphate. Decrease in TIGAR levels
have been shown to increase the levels of fructose 2,6 bisphosphate
and to enhance the rate of glycolysis (6–8). Hence
TIGAR expression results in slowing down the glycolysis pathway.
Enhanced TIGAR expression can lead to the diversion of the
glycolytic metabolites to alternative metabolic pathways such as
hexosamine pathway and pentose phosphate pathway (PPP). The pentose
phosphate pathway plays an important role in generating
ribose-5-phosphate for nucleotide biosynthesis and the production
of NADPH for antioxidant function and fatty acid synthesis.
Accumulation of NADPH leads to an increase in intracellular
glutathione levels which results in lowering reactive oxygen
species (ROS). Most of the studies showed that TIGAR downregulates
ROS and therefore protects against ROS-induced cell death (6,9–12). The
antioxidant functions of TIGAR for cell survival is evident by
protection from stress-induced damage during regeneration of
intestinal tissue (13,14).
During tumor development the metabolic pathways
control redox homeostasis and provide intermediates needed for cell
growth. Several studies have indicated that the deregulation of
TIGAR expression may contribute to cancer development. As TIGAR
lowers ROS and is involved in promoting anabolic pathways and
thereby leads to cell survival in tumor microenvironment. Elevated
TIGAR expression has been reported in colon, breast cancer and
glioblastoma (11,13,15,16).
Depletion of TIGAR sensitizes glioma cells in response to DNA
damage and induces cellular senescence (8). Similarly in nasopharyngeal cancer
cells, inhibition of c-Met decreased TIGAR expression leading to
cell death (17), and in another
finding, intestinal adenoma with APC deletion in LGR5+
intestinal stem cells, mice deficient in TIGAR showed reduced tumor
development (18). Understanding
the TIGAR expression in various stages of colorectal cancers will
be critical in determining its role as a biomarker as well as an
attractive target for cancer therapeutics. TIGAR expression could
be useful for clinical markers for diagnostic, prognostic and
therapeutic applications.
The aim of the present study was to investigate
TIGAR expression in colorectal tumor tissue and adjacent normal
tissue. This study demonstrates that TIGAR expression was
significantly higher in colorectal tumor as compared to adjacent
normal tissue. The results further show that there was significant
increase in TIGAR expression at mRNA and protein levels in stage II
and III colorectal cancer. This is the first report of TIGAR
expression in various stages of colorectal cancer. TIGAR can act as
an independent biomarker for the detection of colorectal cancer and
a therapeutic target for drug discovery.
Materials and methods
Patient samples
Tumor tissue and normal adjacent tissue of 22
patients with colorectal cancer was included in this study.
Patients did not receive any treatment before surgery. Tissue
material after resection for colorectal cancer was collected at the
Department of Surgery, at King Khaled University Hospital (KKUH),
Riyadh, Saudi Arabia between 2012 and 2013. Representative
specimens of macroscopically vital, non-necrotic tumor tissue and
normal colorectal mucosa, taken ≥5 cm distant from the tumor, were
obtained. Specimens were transported on ice to the laboratory and
the tissue was washed with ice-cold phosphate-buffered saline
(PBS), cut in small pieces, frozen in liquid nitrogen and stored at
−80°C until use. Ethical approval for the anonymous use of
colorectal tissue was obtained from the KKUH ethics review
committee. The patient demographics including age, gender, tumor
site and histological stages were recorded in data base according
to Union International Contre le Cancer (UICC)-TNM Staging System
and grading of CRC in accordance with WHO classification.
Histologically adjacent normal tissue from margins of the specimens
served as control tissue. All tissue samples were diagnosed and
classified by two pathologists.
Tissue microarray (TMA)
The construction of tissue microarray (TMA) has been
described (19). Formalin-fixed
paraffin-embedded (FFPE) tissue blocks containing colorectal cancer
were retrieved from the archives of the King Khalid University
Hospital. The TMA was constructed from FFPE tumor blocks using a
manual tissue arrayer (Arraymold kit D IHC World, Woodstock, MD,
USA). Invasive carcinoma areas were identified on H&E stained
slides by an expert pathologist. To construct TMA a 1 mm diameter
needle was used to take three cores from each block corresponding
to the rich tumor areas detected on the slide. The paraffin TMA
blocks were incubated at 37°C for 30 min to enhance the adhesion
between the cores and paraffin. TMA blocks were micro-dissected
using a Leica semi-automatic microtome, and mounted on glass
slides.
Immunohistochemistry
Immunohistochemistry was done as described (20). Paraffin-embedded blocks of tumor
tissues and adjacent normal were cut into 5-µm thick
sections. Slides were deparaffinized in xylene and rehydrated using
a graded ethanol series. Antigen was retrieved by boiling the
slides in a microwave oven for 15 min in 0.01 mol/l citrate buffer
(pH 6.0). Endogenous peroxidase was blocked with a 3%
H2O2-methanol solution, and the slides were
incubated in 10% normal goat serum for 30 min to prevent
non-specific staining. The tissue sections were then incubated
overnight at 4°C with primary antibody [TIGAR sc-166291 (1:100
dilution); Santa Cruz Biotechnology, Dallas, TX, USA]. The standard
biotin-streptavidin-peroxidase method was then used, and the
sections were lightly counterstained with hematoxylin. Breast tumor
was used as positive controls for TIGAR. As a negative control, the
same procedure was conducted without primary antibody. The
expression of TIGAR in tumor and adjacent normal samples was
analyzed using the eSlide capture device (ScanScope CS, Aperio
Technologies Inc., Vista, CA, USA).
Image analysis
High-resolution, whole-slide digital scans of all
TMA glass slides were created with a ScanScope slide scanner
(Aperio Technologies, Inc.). The digital slide images were viewed
by Aperio viewing software (ImageScope), and analyzed using Aperio
image analysis algorithms. In each core, five square fields of a
fixed area of 0.2645 µm2 were randomly selected.
The color deconvolution (color separation) algorithm (Aperio
Technologies, Inc.) was then run on the selected area, and it
generated an intensity range color markup image, segmenting and
color-coding different parts of the image according to the
intensity of positive staining. The area for each of these four
intensity categories (expressed as a percent relative to the total
analysis area), together with the average positive intensity and
the average optical density, was also given as numerical output.
The algorithm output also included a score (0–60) of TIGAR
expression based on the percent strong positive and percent medium
positive. These values were combined and named as the percent
strong positive. The analysis output results were then exported to
excel sheets and subjected to statistical analysis, focusing mainly
on the percentage of the total positive cells as the parameters to
be statistically analyzed and compared.
Quantitative RT-PCR
cDNA synthesis was performed with 1 µg total
RNA (21) using the High Capacity
Reverse Transcription kit (Applied Biosystems). The cDNA samples
were amplified using the SYBR Green qPCR assay kit (Applied
Biosystems) and the StepOnePlus real-time PCR system (Applied
Biosystems). Primers used for TIGAR analysis are: forward,
5′-CTCCAGTGATCTCATGAG-3′; reverse, 5′-AGACACTGGCTGCTAATC-3′.
Cell culture
Human HT-29, HCT-15, HCT116 and SW620 colorectal
cancer cells were grown in DMEM (Invitrogen) containing 10%
heat-inactivated fetal bovine serum, 100 µg/ml streptomycin,
100 U/ml penicillin and 2 mmol/l L-glutamine.
Western blotting
Protein samples were isolated from colorectal cancer
tissues using PARIS kit (Ambion). Total protein concentration was
determined using Bradford protein reagent (Bio-Rad). Soluble
proteins were loaded on precast TGX gels and were analyzed by
immunoblotting with anti-TIGAR (dilution 1:1,000; Santa Cruz
Biotechnology). Reactivity was detected with horseradish
peroxidase-conjugated secondary antibodies and chemiluminescence
(GE Healthcare). Membrane was developed using C-Digit Blot Scanner
(LI-COR, Hamburg, Germany). CRC cell line whole cell lysates were
prepared as described (22).
Soluble proteins were analyzed by immunoblotting with anti-TIGAR
(Santa Cruz Biotechnology) and anti-β-actin (Sigma). Reactivity was
detected with horseradish peroxidase-conjugated secondary
antibodies and chemiluminescence (GE Healthcare). Membranes were
developed using C-Digit Blot Scanner (LI-COR).
Ethics statement
The study complied with the requirements, and was
approved by the Ethics Committee of the King Saud University.
Patient consent was obtained for this study.
Statistical analysis
Statistical analysis was performed using Microsoft
excel. The means between the two groups were compared using
Student's t-test and P-value of ≤0.05 was considered statistically
significant.
Results
Clinico-pathological data of colorectal cancer
patients are summarized in Table I.
All the tumor samples were adenomas with high grades (grade 2 and
3). Majority of the tumors (90%) were advanced at stage II and III.
Forty percent of the tumor was found located in the colon and rest
were in the rectum, sigmoid and recto-sigmoid. Approximately 36% of
the patients had already developed lymph node metastasis.
 | Table IClinical characteristics of colorectal
cancer patients. |
Table I
Clinical characteristics of colorectal
cancer patients.
| Variables | Patients |
|---|
| Number | 22 |
| Men/women | 11/11 |
| Mean age (range) | 57 (36–81) |
| Tumor
localization | |
| Colon | 9 (40%) |
| Rectum | 2 (9%) |
| Sigmoid | 5 (22.7%) |
| Rectosigmoid | 6 (27.3%) |
| Adenocarcinoma | 22 |
| Differentiation
grade | |
| Moderately
differentiated | 19 (86.4%) |
| Poorly
differentiated | 3 (13.6%) |
| Clinical staging | |
| Stage I | 1 (4.5%) |
| Stage II | 12 (54.5%) |
| Stage III | 8 (36.4%) |
| Stage IV | 1 (4.5%) |
| Tumor staging | |
| T2 | 3 (13.6%) |
| T3 | 17 (77.3%) |
| T4 | 2 (9%) |
| Lymph node
status | |
| N0 | 14 (63.6%) |
| N1 | 6 (27.3%) |
| N2 | 2 (9%) |
| Metastasis | |
| Yes | 8 (36.3%) |
| No | 14 (63.6%) |
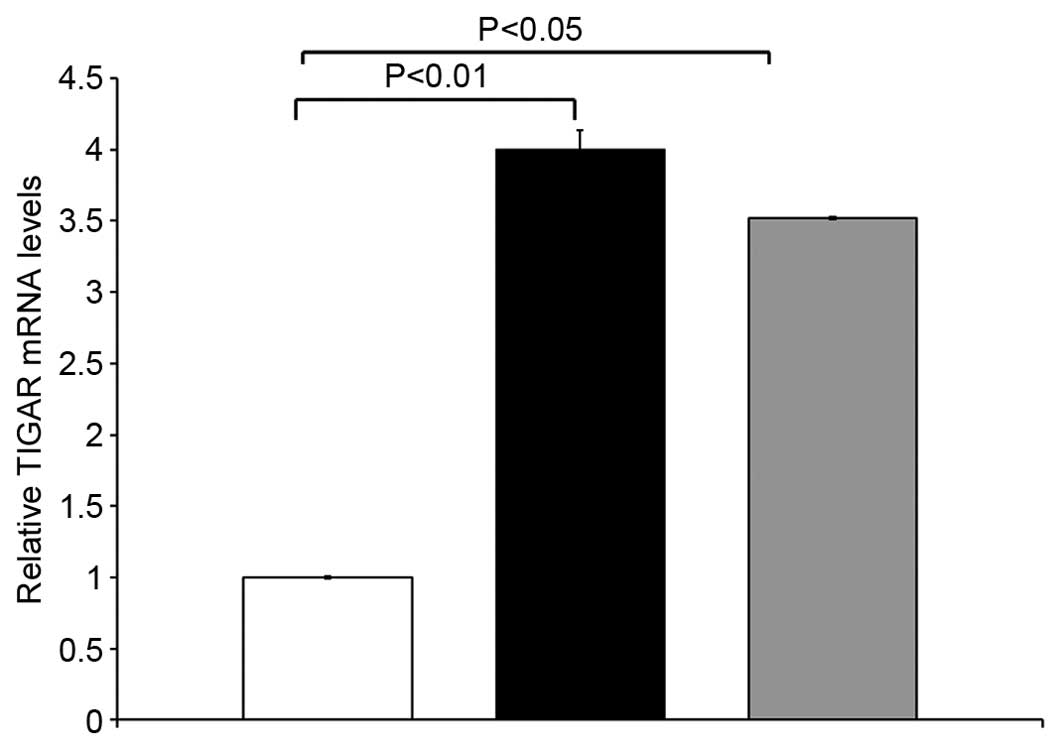
TIGAR mRNA expression in colorectal
cancer
qRT-PCR analyses was performed to determine the
expression of TIGAR in 14 paired primary colorectal tumor tissues
and matched adjacent normal tissues. TIGAR mRNA was upregulated in
colorectal tumor samples compared to adjacent normal tissue from
the same patients. TIGAR mRNA was significantly higher in stage II
colorectal cancer (p<0.01) and stage III CRC (p<0.05) as
compared to adjacent normal tissue (Fig. 1). These results demonstrate that
TIGAR mRNA was overexpressed in stage II and III tumor samples.
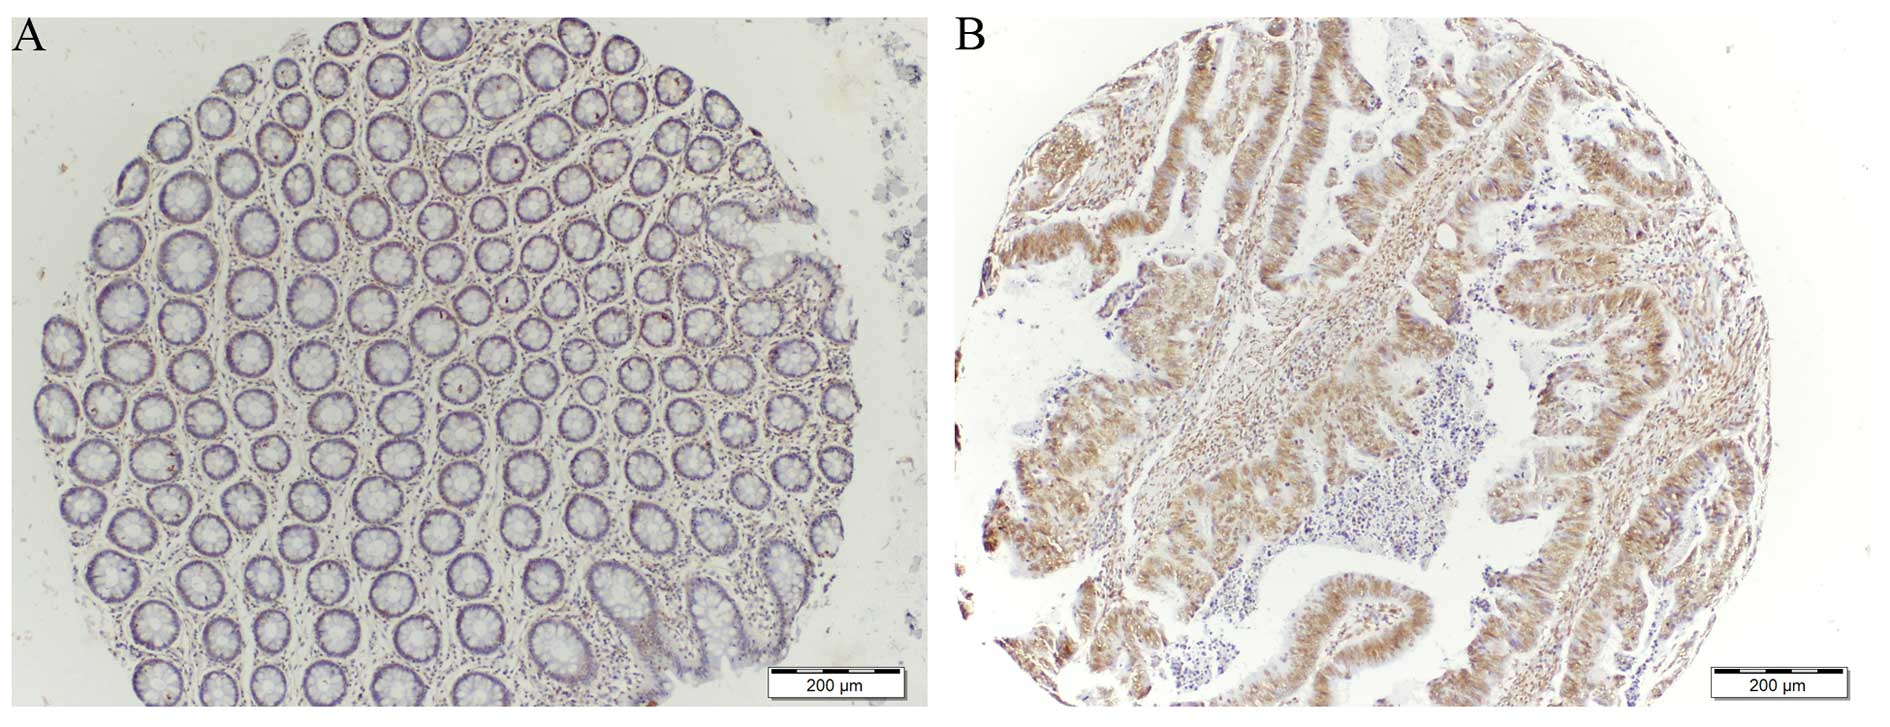
TIGAR staining in colorectal cancer
TIGAR expression was determined on tissue microarray
(TMA) consisting of 22 samples comparing normal and tumor tissue
from the same patients. Immunohistochemical staining for TIGAR
showed an increase in TIGAR protein in colorectal tumor when
compared to adjacent normal tissue (Figs. 2 and 3). Approximately 68% tumor tissues were
strongly positive for TIGAR staining. Weak to moderate TIGAR
staining was detected in the adjacent normal tissue, however,
positive TIGAR staining was detected in 15 of the 22 (68%) tumor
tissues. Additionally, the entire positive staining observed was
found to be mainly with nuclear localization.
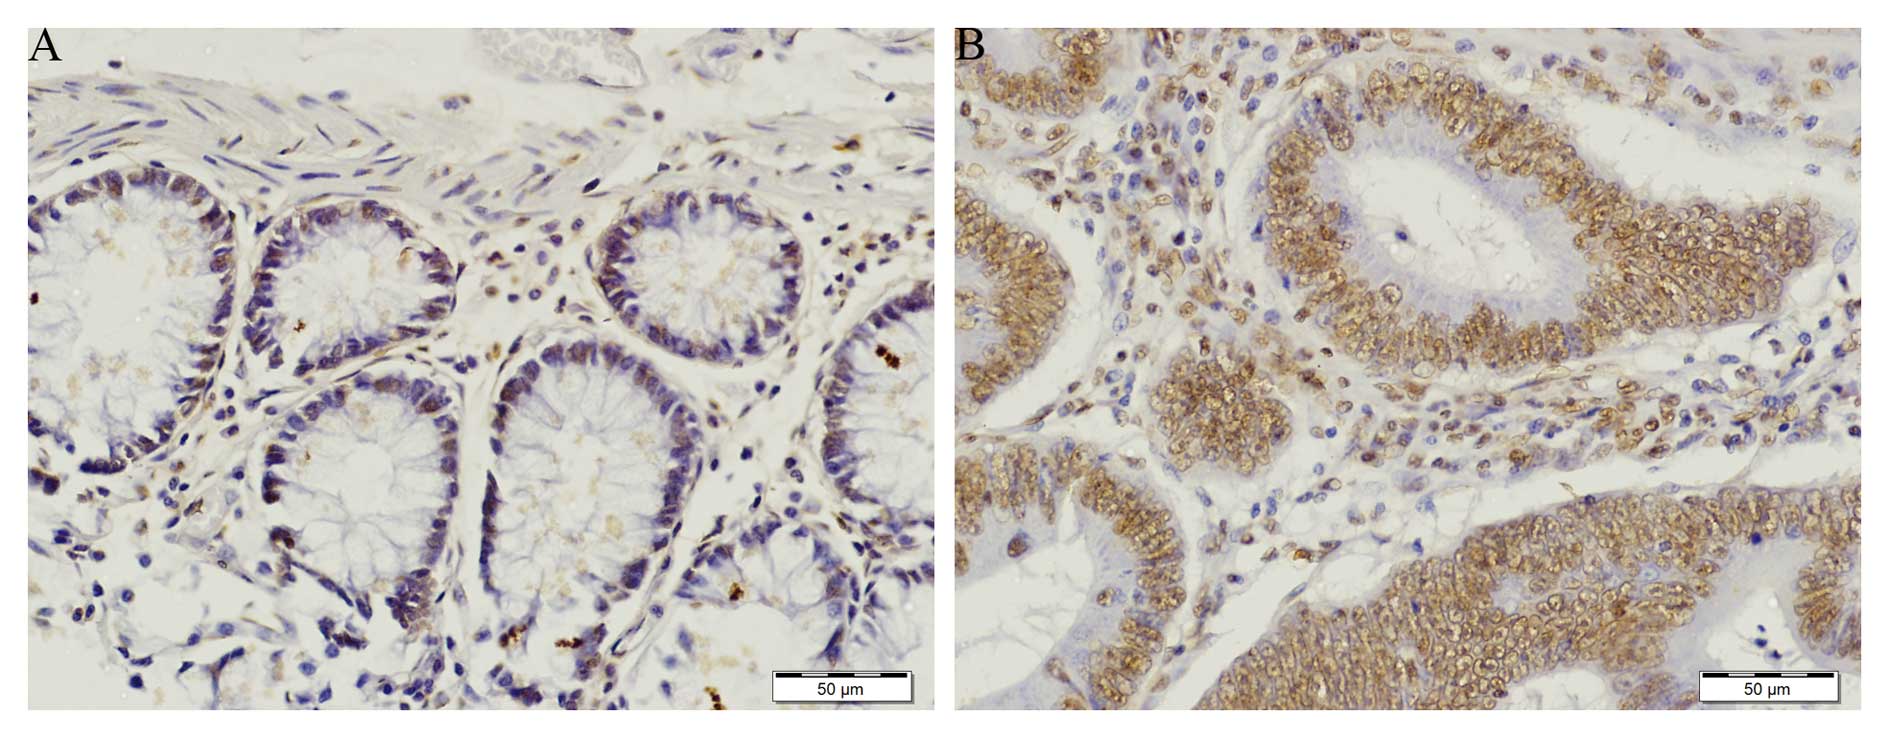
Immunohistochemical analysis of TIGAR
expression
TIGAR staining was prominent in colorectal tumor as
compared to normal adjacent tissue (Figs. 2A and 3A). In normal tissue TIGAR staining was
weak (Fig. 3A). TIGAR was highly
expressed in colorectal tumor and localized in the nucleus
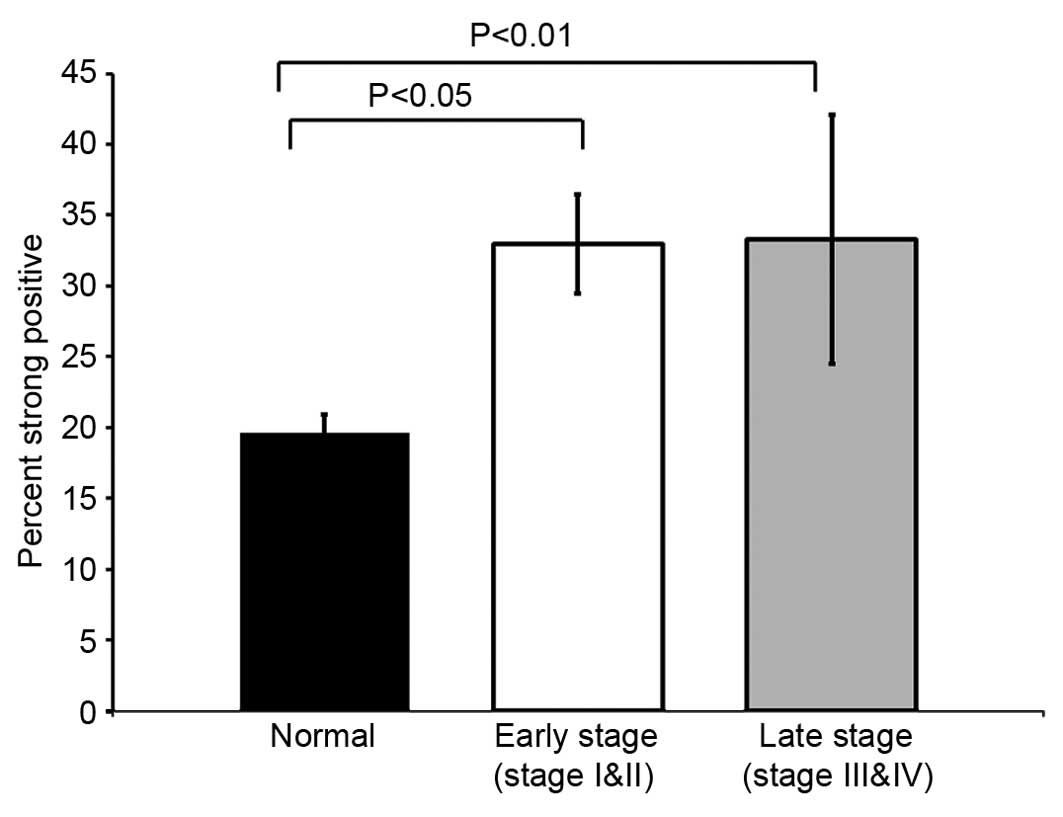
(Figs. 2B and 3B). The strong positive staining of TIGAR
was significantly higher in early stage (stage I and II) colorectal
cancer (p<0.05). The TIGAR staining was also significantly
higher in late stage (stage III and IV) colorectal tumor
(p<0.01) (Fig. 4). In agreement
with the qRT-PCR data, immunohistochemical analysis confirmed that
TIGAR was overexpressed in most of the colorectal tumor tissues as
compared to adjacent normal tissue. Taken together, these finding
indicated that TIGAR is upregulated in colorectal cancer at both
transcriptional and translational levels. These findings
demonstrate that TIGAR protein expression was significantly
increased in tumor samples, with only weak expression in adjacent
normal tissues.
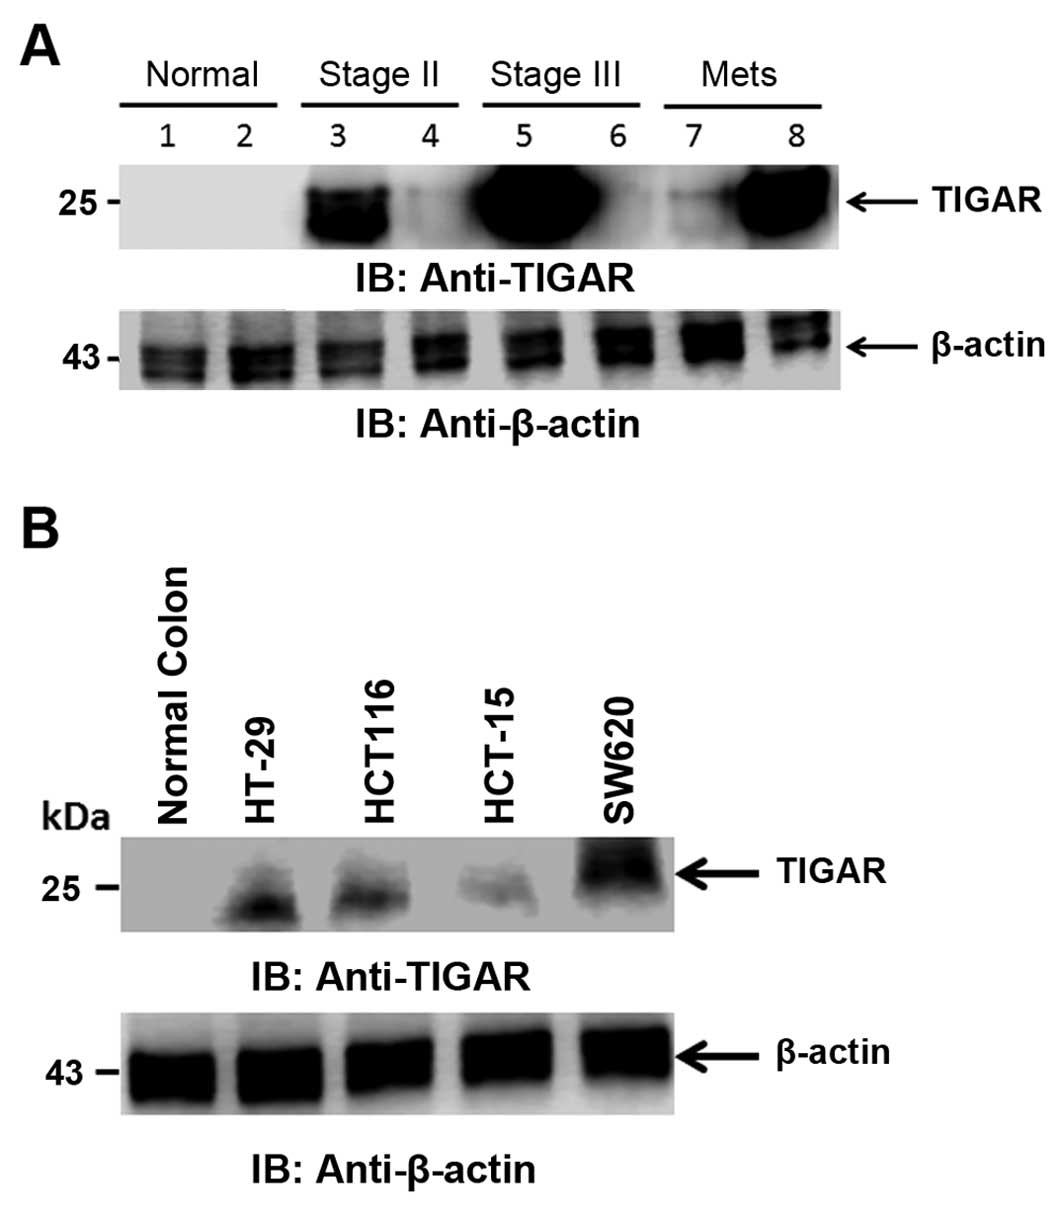
TIGAR expression in CRC patient tissues
and cell lines
TIGAR protein detection was carried out in CRC tumor
tissues. TIGAR protein was highly expressed in stage II and III
colorectal cancer as compared to adjacent normal tissue. TIGAR
protein was also highly expressed in metastatic samples (Fig. 5A). We further performed the
detection of TIGAR protein in CRC cell lines. TIGAR protein was
found to be expressed in all the CRC cell lines tested. TIGAR
protein was expressed in colorectal cancer cell lines HT-29 and
HCT116 as compared to normal colon tissue. TIGAR protein expression
was higher in colorectal cancer metastatic cell line SW620 as
compared to adenocarcinoma cell lines (Fig. 5B). In agreement with TIGAR mRNA and
TIGAR staining in tumor tissues, the TIGAR protein was highly
expressed in CRC tissues and cell lines. These finding collectively
indicated that TIGAR is significantly overexpressed in tumor
samples and CRC cell lines.
Discussion
p53 is a well-known tumor suppressor which prevents
the growth and survival of cancer cells during cellular
transformation by inducing apoptosis or senescence in response to
stress (23). Furthermore, p53
function has been linked to metabolism as well (24). The metabolic activity of p53 is
performed by TIGAR. TIGAR, like FBPase-2 deplete
fructose-2,6-bisphos-phate (F26P2) which is an activator of
phosphofructokinase 1 (PFK1) (6).
Overexpression of TIGAR has been reported in tumors such as colon
cancer (13), breast cancer
(15), and glioblastoma (8,16).
TIGAR expression has not been reported in colorectal cancer
specifically in different stages of colorectal cancer.
The present study investigated the TIGAR mRNA and
protein expression in various stages of colorectal cancer patients
from Saudi Arabia. This study demonstrated that TIGAR mRNA
expression is significantly higher in stage II and stage III
colorectal tumor. This increase in TIGAR mRNA is significant in
stage II colorectal tumor compared to normal tissue (p<0.01).
Immunohistochemical studies revealed that TIGAR staining was
increased in colorectal tumor compared to adjacent normal tissue.
The strong positive staining is significantly higher in early stage
(I and II) colorectal cancer (p<0.05) as well as in the late
stage colorectal cancer (p<0.01). TIGAR staining in all tumors
are found to be concentrated in the nucleus. TIGAR expression has
been shown to be increased in colon cancer (13). However, TIGAR expression has not
been reported in various stages of colorectal cancer. This study
finds TIGAR overexpression in various stages of colorectal cancer
in a different ethnic group involving colorectal cancer patients
from Saudi Arabia. This overexpression of TIGAR may help to support
survival of colorectal cancer cells.
Our finding indicates the TIGAR staining is
increased in both early and late stage colorectal cancer. TIGAR
mRNA is significantly expressed in stage II and stage III
colorectal cancer. TIGAR expression is involved in the progression
of colorectal malignancies as evident by TIGAR expression in the
early stage of colorectal cancer.
The biosynthesis metabolic pathway provides
intermediates for cell growth during malignant progression. The
p53-induced activation of TIGAR leads to an antioxidant response
that promotes cell survival (6,25,26).
In this study, TIGAR protein is found to be highly expressed in
colorectal tumor tissues and CRC cell lines. TIGAR protein was
found to be increased in stage II and III colorectal cancer as
compared to normal adjacent tissue. TIGAR protein was also highly
expressed in metastatic samples. These results are consistent with
earlier report that found that TIGAR was significantly expressed in
colon adenocarcinoma and metastasis (13). This detection of TIGAR expression in
early stage colorectal cancer with respect to earlier report
(13) may be due to different
ethnicity with distinct genetic mutations. TIGAR expression in
early stage can help to support transformation by inducing
increased proliferation of abnormal lesion in the colon. TIGAR
expression is equally distributed from colorectal adenocarcinoma
cell line in HT-29 and HCT116 to Dukes' type C cell line HCT-15 and
metastatic colorectal cancer cell line SW620. Some studies have
shown TIGAR as a potential target for radiosensitization and cell
death of cancer cells. TIGAR knockdown resulted in
radiosensitisation in glioma cells through an accumulation of ROS,
leading to DNA damage and cellular senescence (8).
In conclusion, TIGAR is upregulated in colorectal
cancer patients from Saudi Arabia. TIGAR is highly expressed at the
mRNA and protein levels in stage II and stage III colorectal
cancer. TIGAR protein is also widely expressed in CRC cell lines.
Thus, the high expression of TIGAR protein in various stages of
colorectal cancer may be used for the detection of colorectal
cancer. Overexpression of TIGAR can act as an attractive target for
developing therapeutics for treating colorectal cancer. More
studies with higher sample size specifically comprised of early
stages are needed for better understanding of molecular mechanism
of TIGAR expression possibly making TIGAR a biomarker for early
detection of colorectal cancer.
Acknowledgments
The authors would like to thank the Vice Deanship
Research Chair, Deanship of Scientific Research, King Saud
University for supporting this study. This study was financially
supported by King Saud University, through Vice Deanship of
Research Chairs.
References
|
1
|
Lao VV and Grady WM: Epigenetics and
colorectal cancer. Nat Rev Gastroenterol Hepatol. 8:686–700. 2011.
View Article : Google Scholar : PubMed/NCBI
|
|
2
|
Lin L, Piao J, Gao W, Piao Y, Jin G, Ma Y,
Li J and Lin Z: DEK over expression as an independent biomarker for
poor prognosis in colorectal cancer. BMC Cancer. 13:3662013.
View Article : Google Scholar : PubMed/NCBI
|
|
3
|
Pitule P, Vycital O, Bruha J, Novak P,
Hosek P, Treska V, Hlavata I, Soucek P, Kralickova M and Liska V:
Differential expression and prognostic role of selected genes in
colorectal cancer patients. Anticancer Res. 33:4855–4865.
2013.PubMed/NCBI
|
|
4
|
Vousden KH and Lu X: Live or let die: The
cell's response to p53. Nat Rev Cancer. 2:594–604. 2002. View Article : Google Scholar : PubMed/NCBI
|
|
5
|
Jen KY and Cheung VG: Identification of
novel p53 target genes in ionizing radiation response. Cancer Res.
65:7666–7673. 2005.PubMed/NCBI
|
|
6
|
Bensaad K, Tsuruta A, Selak MA, Vidal MN,
Nakano K, Bartrons R, Gottlieb E and Vousden KH: TIGAR, a
p53-inducible regulator of glycolysis and apoptosis. Cell.
126:107–120. 2006. View Article : Google Scholar : PubMed/NCBI
|
|
7
|
Kimata M, Matoba S, Iwai-Kanai E, Nakamura
H, Hoshino A, Nakaoka M, Katamura M, Okawa Y, Mita Y, Okigaki M, et
al: p53 and TIGAR regulate cardiac myocyte energy homeostasis under
hypoxic stress. Am J Physiol Heart Circ Physiol. 299:H1908–H1916.
2010. View Article : Google Scholar : PubMed/NCBI
|
|
8
|
Peña-Rico MA, Calvo-Vidal MN,
Villalonga-Planells R, Martínez-Soler F, Giménez-Bonafé P,
Navarro-Sabaté À, Tortosa A, Bartrons R and Manzano A: TP53 induced
glycolysis and apoptosis regulator (TIGAR) knockdown results in
radio-sensitization of glioma cells. Radiother Oncol. 101:132–139.
2011. View Article : Google Scholar
|
|
9
|
Yin L, Kosugi M and Kufe D: Inhibition of
the MUC1-C oncoprotein induces multiple myeloma cell death by
down-regulating TIGAR expression and depleting NADPH. Blood.
119:810–816. 2012. View Article : Google Scholar :
|
|
10
|
Lui VW, Lau CP, Cheung CS, Ho K, Ng MH,
Cheng SH, Hong B, Tsao SW, Tsang CM, Lei KI, et al: An RNA-directed
nucleoside anti-metabolite,
1-(3-C-ethynyl-beta-d-ribo-pentofuranosyl) cytosine (ECyd), elicits
antitumor effect via TP53-induced glycolysis and apoptosis
regulator (TIGAR) downregulation. Biochem Pharmacol. 79:1772–1780.
2010. View Article : Google Scholar : PubMed/NCBI
|
|
11
|
Wanka C, Steinbach JP and Rieger J:
Tp53-induced glycolysis and apoptosis regulator (TIGAR) protects
glioma cells from starvation-induced cell death by up-regulating
respiration and improving cellular redox homeostasis. J Biol Chem.
287:33436–33446. 2012. View Article : Google Scholar : PubMed/NCBI
|
|
12
|
Ye L, Zhao X, Lu J, Qian G, Zheng JC and
Ge S: Knockdown of TIGAR by RNA interference induces apoptosis and
autophagy in HepG2 hepatocellular carcinoma cells. Biochem Biophys
Res Commun. 437:300–306. 2013. View Article : Google Scholar : PubMed/NCBI
|
|
13
|
Cheung EC, Athineos D, Lee P, Ridgway RA,
Lambie W, Nixon C, Strathdee D, Blyth K, Sansom OJ and Vousden KH:
TIGAR is required for efficient intestinal regeneration and
tumorigenesis. Dev Cell. 25:463–477. 2013. View Article : Google Scholar : PubMed/NCBI
|
|
14
|
Cooper HS, Murthy SN, Shah RS and
Sedergran DJ: Clinicopathologic study of dextran sulfate sodium
experimental murine colitis. Lab Invest. 69:238–249.
1993.PubMed/NCBI
|
|
15
|
Won KY, Lim SJ, Kim GY, Kim YW, Han SA,
Song JY and Lee DK: Regulatory role of p53 in cancer metabolism via
SCO2 and TIGAR in human breast cancer. Hum Pathol. 43:221–228.
2012. View Article : Google Scholar
|
|
16
|
Sinha S, Ghildiyal R, Mehta VS and Sen E:
ATM-NFκB axis-driven TIGAR regulates sensitivity of glioma cells to
radiomimetics in the presence of TNFα. Cell Death Dis. 4:e6152013.
View Article : Google Scholar
|
|
17
|
Lui VW, Wong EY, Ho K, Ng PK, Lau CP, Tsui
SK, Tsang CM, Tsao SW, Cheng SH, Ng MH, et al: Inhibition of c-Met
down-regulates TIGAR expression and reduces NADPH production
leading to cell death. Oncogene. 30:1127–1134. 2011. View Article : Google Scholar
|
|
18
|
Barker N, Ridgway RA, van Es JH, van de
Wetering M, Begthel H, van den Born M, Danenberg E, Clarke AR,
Sansom OJ and Clevers H: Crypt stem cells as the cells-of-origin of
intestinal cancer. Nature. 457:608–611. 2009. View Article : Google Scholar
|
|
19
|
Rimm DL, Camp RL, Charette LA, Costa J,
Olsen DA and Reiss M: Tissue microarray: A new technology for
amplification of tissue resources. Cancer J. 7:24–31.
2001.PubMed/NCBI
|
|
20
|
Bu XD, Li N, Tian XQ, Li L, Wang JS, Yu XJ
and Huang PL: Altered expression of MUC2 and MUC5AC in progression
of colorectal carcinoma. World J Gastroenterol. 16:4089–4094. 2010.
View Article : Google Scholar : PubMed/NCBI
|
|
21
|
Alam M, Rajabi H, Ahmad R, Jin C and Kufe
D: Targeting the MUC1-C oncoprotein inhibits self-renewal capacity
of breast cancer cells. Oncotarget. 5:2622–2634. 2014. View Article : Google Scholar : PubMed/NCBI
|
|
22
|
Ahmad R, Raina D, Trivedi V, Ren J, Rajabi
H, Kharbanda S and Kufe D: MUC1 oncoprotein activates the IkappaB
kinase beta complex and constitutive NF-kappaB signalling. Nat Cell
Biol. 9:1419–1427. 2007. View
Article : Google Scholar : PubMed/NCBI
|
|
23
|
Vogelstein B, Lane D and Levine AJ:
Surfing the p53 network. Nature. 408:307–310. 2000. View Article : Google Scholar : PubMed/NCBI
|
|
24
|
Matoba S, Kang JG, Patino WD, Wragg A,
Boehm M, Gavrilova O, Hurley PJ, Bunz F and Hwang PM: p53 regulates
mitochondrial respiration. Science. 312:1650–1653. 2006. View Article : Google Scholar : PubMed/NCBI
|
|
25
|
Budanov AV, Sablina AA, Feinstein E,
Koonin EV and Chumakov PM: Regeneration of peroxiredoxins by
p53-regulated sestrins, homologs of bacterial AhpD. Science.
304:596–600. 2004. View Article : Google Scholar : PubMed/NCBI
|
|
26
|
Cosentino C, Grieco D and Costanzo V: ATM
activates the pentose phosphate pathway promoting anti-oxidant
defence and DNA repair. EMBO J. 30:546–555. 2011. View Article : Google Scholar :
|