Introduction
Each year ~990,000 people are diagnosed with gastric
cancer (GC) and ~738,000 die from this disease worldwide, making GC
the fourth most common cancer and the second most common cause of
cancer death (1). The highest
incidence rates are observed in South America, East Europe, and
East Asia (particularly in Korea, Mongolia, Japan and China)
(2). Detection of GC in the early
stage is important to reduce mortality. Many Japanese series have
consistently reported early diagnosis and treatment of GC, with a
5-year survival rate >90%. The key factor for preventing GC is
early diagnosis, as confirmed by the good results obtained in
surgical series in which early cases are frequent (3). Recent developments in the field of
gastrointestinal (GI) endoscopy have been remarkable (4). However, endoscopic biopsy and
pathological morphological observation cannot find all precancerous
lesions and early GC. To improve this situation, there is an urgent
need for novel and reliable biomarkers for early diagnosis of
GC.
In recent years, several studies have confirmed that
long non-coding RNAs (lncRNAs) have emerged as essential regulators
in almost all aspects of biology (5). They are a group of RNA transcripts
that are >200 nucleotides in length and lack significant open
reading frames (6). Accumulating
evidence suggests that lncRNAs play an important role in
tumorigenesis (7). lncRNAs may
function as oncogenes or tumor suppressors by altering the
chromatin structure or by regulating the transcription of
protein-coding genes (8). lncRNA is
the functional end-product, and the level of lncRNA expression
correlates directly with the level of the active molecule. Thus,
the use of lncRNAs in diagnostics has intrinsic advantages over the
use of protein-coding RNAs. In addition, lncRNAs show greater
tissue specificity compared to protein-coding mRNAs and miRNAs,
making them attractive in the search for novel diagnostic and
prognostic cancer biomarkers (9).
It is known that gastric adenocarcinoma accounts for 95% of gastric
malignancies. However, there is little information to clarify the
relationship between lncRNAs, mRNAs and validation in advanced and
early stage GC (10). Therefore,
further study of endoscopic biopsy of GC tissues may help to
establish inner relationships between lncRNA, mRNA and GC.
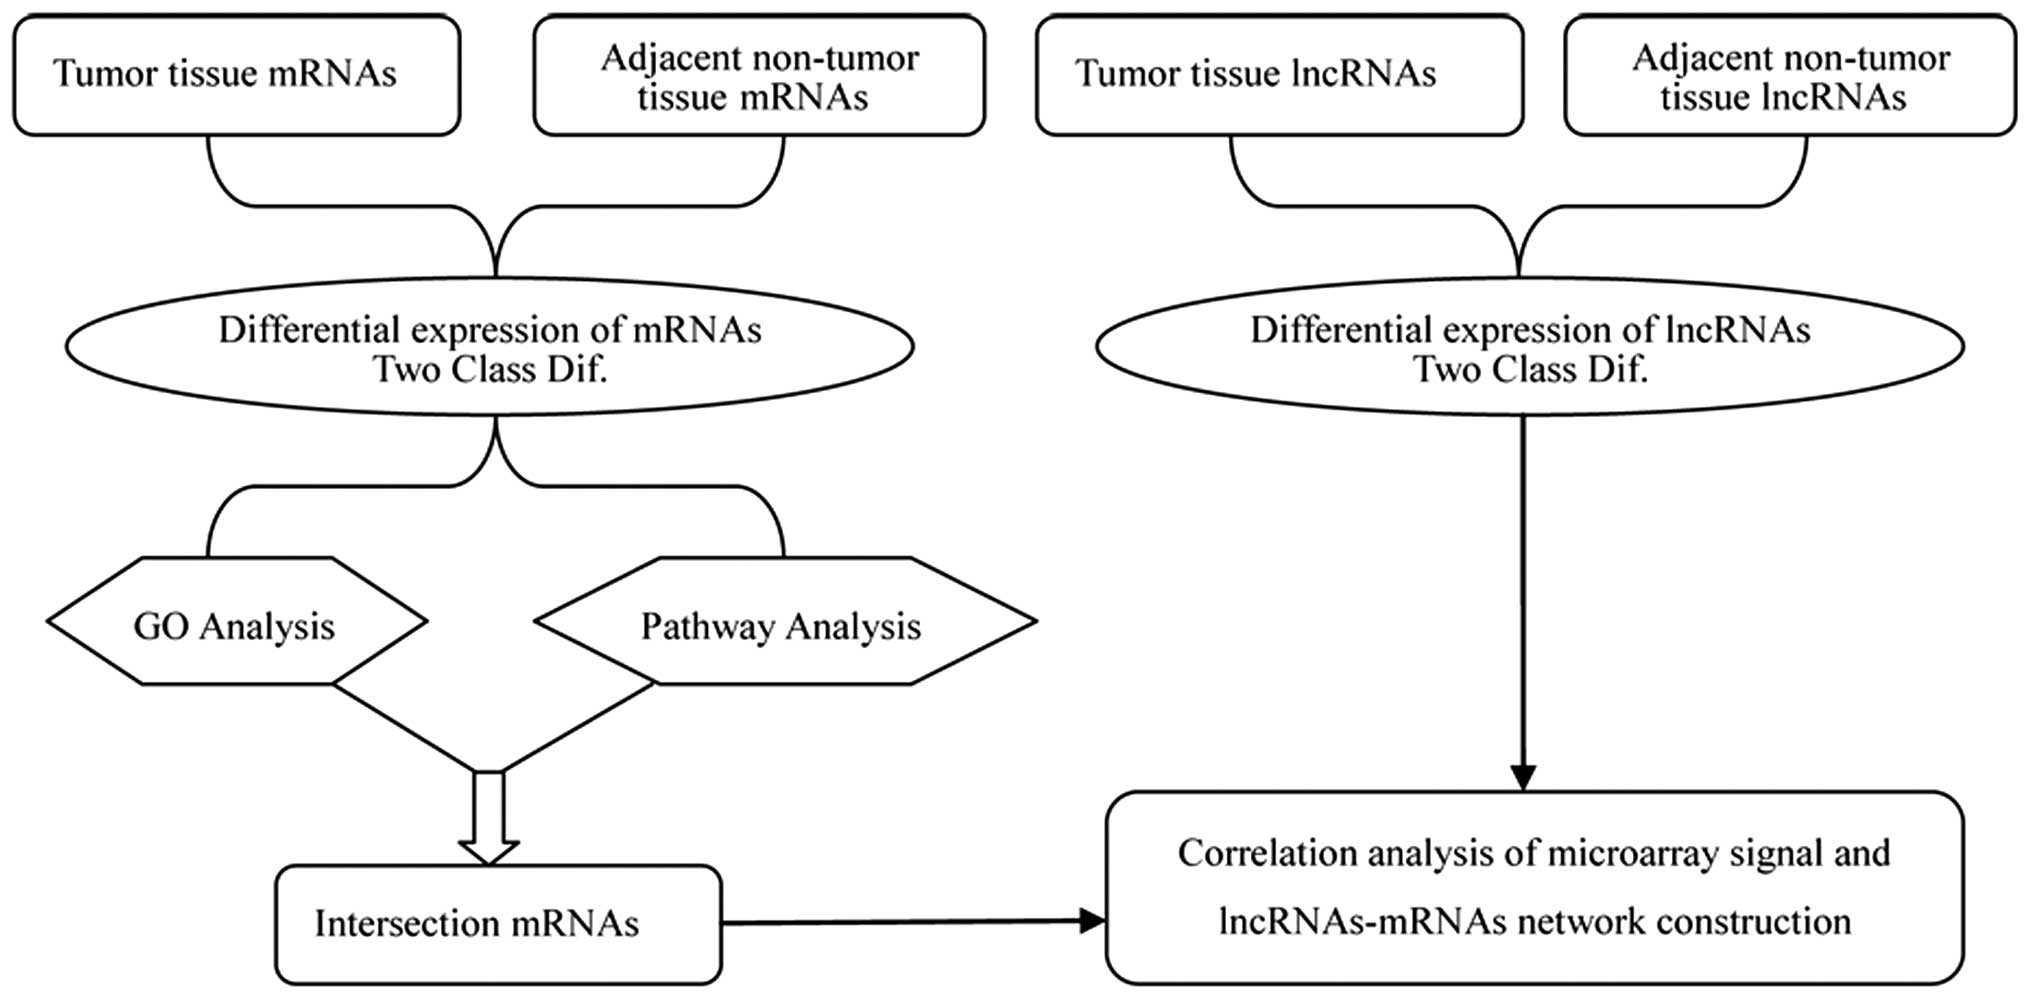
In the present study, differential expression
profiles of lncRNAs and mRNAs were detected from advanced GC
tissues and adjacent non-tumor tissues by microarray analysis. We
investigated the targeted and regulated genes of lncRNAs through
construction of a co-expression network and Gene Ontology (GO)
analysis. Then, we used real-time PCR validation of microarray
differential expression lncRNAs and mRNAs in tumor tissues and
adjacent non-tumor tissues from 30 newly diagnosed advanced GC
patients and 20 newly diagnosed early stage GC patients.
Materials and methods
Specimen collection
The procedures used in the present study were
approved by the Wuwei Tumor Hospital of Gansu (Wuwei, China) and
conformed to the Helsinki Declaration, and current legislation. A
total of 10 human advanced GC specimens and their paired adjacent
non-cancerous tissue specimens were obtained for lncRNA and mRNA
microarray analysis from the Wuwei Tumor Hospital of Gansu
(Table I). In addition, 30 advanced
GC patients and 20 newly diagnosed early stage GC patients were
recruited from the Wuwei Tumor Hospital of Gansu, aged 45–70 years,
for quantitative RT-PCR analysis between 2014–2015. All of these
patients were assigned a diagnosis of GC based on histopathology
and clinical history. Clinical information that was recorded for
each specimen included age, tumor grade, cancer stage, tissue
dimensions and date of resection. The pathologist assessed the
tumor content by microscopic examination of cases where the
percentage of tumor tissue was estimated to be ≥80%. None of the
patients had received preoperative chemoradiation. Adjacent
non-cancerous tissues were located ≥5 cm from the tumor edge.
Tissue samples were immersed in RNAlater (Ambion, Inc., Austin, TX,
USA) and stored at −80°C until use.
 | Table IClinical characteristics of the
patients for lncRNA and mRNA microarray analysis. |
Table I
Clinical characteristics of the
patients for lncRNA and mRNA microarray analysis.
| Histopathology of
gastric cancers patients | Age (years) | Gender | Tumor size
(cm) | TNM stages |
|---|
| Ulcer type ductal
carcinoma | 57 | Male | 2.2×0.7 | T3N2M1 |
| Ulcer type
moderately differentiated adenocarcinoma | 60 | Female | 5×3.5 | T3N2M0 |
| Ulcer type
moderately differentiated adenocarcinoma | 49 | Male | 4×7 | T4aN3M1 |
| Ulcer type
moderately differentiated adenocarcinoma | 62 | Female | 12×8 | T4N3M0 |
| Ulcer type
moderately differentiated adenocarcinoma | 52 | Male | 8×4 | T3N2M0 |
| Ulcer type ductal
carcinoma | 58 | Male | 6×4.5 | T3N1M0 |
| Infiltrating type
moderately differentiated adenocarcinoma | 54 | Male | 7×9 | T4aN3aM1 |
| Ulcer type
moderately differentiated adenocarcinoma | 65 | Male | 2.5×1.6 | T4aN1M0 |
| Mushroom umbrella
poorly differentiated adenocarcinoma | 68 | Female | 6×3 | T3N2M0 |
| Ulcer type low
differentiated adenocarcinoma | 60 | Male | 10×8.5 | T4bN0M0 |
Isolation of RNA
Total RNA was isolated from 10 advanced gastric
adenocarcinoma specimens and their paired adjacent non-cancerous
tissues using TRIzol reagent (Invitrogen, Carlsbad, CA, USA). The
quality of RNA was measured by Agilent Bioanalyzer, which produces
an RNA integrity number (RIN) between 1 and 10, with 10 being the
highest quality samples, showing the least degradation. The RIN
estimates sample integrity using gel electrophoresis and analysis
of the ratios of 28S to 18S ribosomal bands.
lncRNA and mRNA microarray analysis
Three pairs of RNA samples were obtained from 10
patients by pooling RNA from two, four and four patients within one
group as 'one sample'. Thus, we generated three pairs of pooled RNA
samples from GC specimens and their paired adjacent non-cancerous
tissues from 10 patients. These three pairs of RNA samples were
subjected to microarray analysis. RiboArray Custom Array 1*90K
combined microarray was used, which could detect 32,987 lncRNAs
from authoritative data sources, including NCBI RefSeq, H-invDB,
UCSC, LncRNAdb, John Rinn and GENCODE LncRNA. In addition, the
microarray also included Human Gene Expression, which could detect
65,535 mRNAs. Signals were normalized using the median center tool
for genes. ANOVA was used to compare the differentially expressed
lncRNAs and mRNAs.
Differential expression of mRNA
function
Differentially expressed mRNAs were entered into the
Database for Annotation, Visualization and Integrated Discovery
(DAVID), which utilized GO to identify the molecular function
represented in the gene profile and the Kyoto Encyclopedia of Genes
and Genomes (KEGG) to analyze the potential functions of these
genes in the pathways (11).
Bioinformatics analysis of co-expression
of lncRNAs and mRNAs
According to the relationship among miRNA, lncRNA
and mRNA, the post-transcriptional regulation of mRNA transcripts
bound by single-stranded miRNAs is basically established. In the
present study we built lncRNA-mRNA co-expression network which is
based on the theory that lncRNA can regulate miRNA abundance by
sequestering and binding them, acting as so-called miRNA sponges.
Firstly, the differentially expressed lncRNAs and mRNAs were
selected from GC specimens and their paired adjacent non-cancerous
tissues. Standard selection criteria to identify differentially
expressed lncRNAs and mRNAs were established at P<0.05 and fold
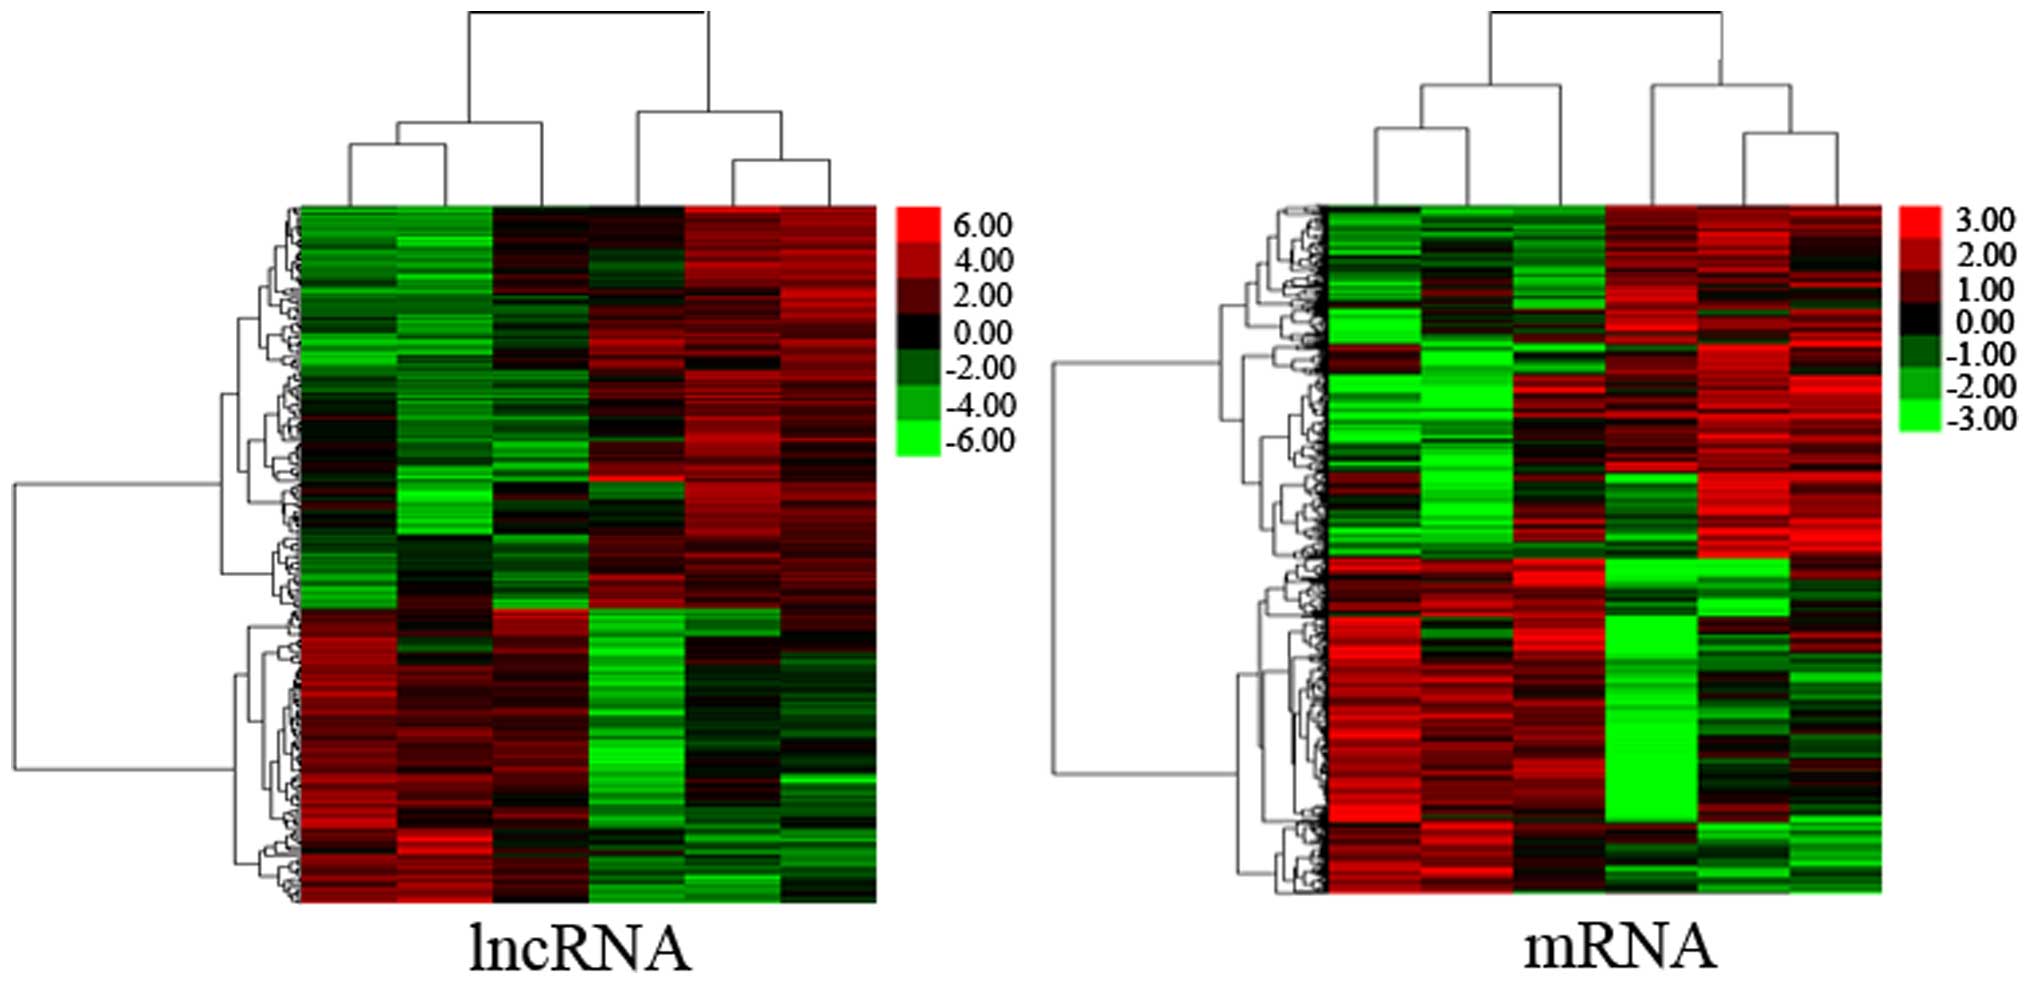
change >2. Then, lncRNA and mRNA co-expression network was
constructed based on the correlation between the differentially
expressed lncRNAs and mRNAs. The correlation of expression profiles
between biological replicates and group conditions was demonstrated
by unsupervised hierarchical cluster analysis (Figs. 1 and 2).
Quantitative real-time PCR
validation
To confirm the microarray results, we performed
qRT-PCR analysis on larger samples, including 30 newly diagnosed
advanced GC and 20 early stage GC patients. Early stage GC patients
were all diagnosed as high level intraepithelial neoplasia by
pathological morphological observation. GC specimens and their
paired adjacent non-cancerous tissues were collected and total RNA
was isolated, then reverse-transcribed using AMV reverse
transcriptase (Promega, Madison, WI, USA). Real-time PCR was done
with GoTaq® qPCR Master Mix (Promega) on StepOnePlus™
PCR System (Applied Biosystems, Waltham, MA, USA). The relative
fold change was calculated using the 2−ΔΔCt method
(12), where ΔCt =
(CtRNAs − CtGAPDH) and ΔΔCt = ΔCttumor
tissues − ΔCtadjacent non-tumor tissues. GAPDH was
chosen as the endogenous standard. The threshold cycle indicated
the fractional cycle number at which the amount of amplified target
reached a fixed threshold and the Ct value was negatively
correlated with copy numbers. In addition, conditional logistic
regression analysis was used to evaluate the association between
differentially expressed RNAs and the risk of GC (13).
Statistical analysis
All the results were expressed as mean ± SD.
Statistical analysis was carried out with the Student's t-test for
comparison of two groups in microarray analysis and ANOVA for
multiple comparisons. In both cases, differences with P<0.05
were considered to indicate a statistically significant result. The
statistical significance of microarray analysis results was
analyzed by fold change and Student's t-test. False discovery rate
was calculated to correct the P-value. We used fold change to
screen differentially expressed LncRNAs and mRNAs, the threshold
values were (fold change ≥2.0 or ≤0.50) and (P<0.05).
Results
Quality of microarray sample RNAs
Microarray sample RNAs were assessed by
electrophoresis on a denaturing agarose gel. Total RNA run on a
denaturing gel has sharp 28S and 18S rRNA bands, and the 28S rRNA
band should be approximately twice as intense as the 18S rRNA band.
This intensity ratio was observed for the RNA in the present study,
indicating that the RNA was intact. The concentration of RNAs
(OD260), protein contamination of RNAs (ratio
OD260/OD280), and organic compound
contamination of RNAs (ratio OD260/OD230)
were measured with the NanoDrop ND-1000. All samples had
OD260/OD280 ratios of total RNA higher than
1.8, indicating adequate RNA concentration.
Overview of lncRNA and mRNA expression
profiles
The lncRNA expression levels of GC tissues and their
paired adjacent non-cancerous tissues were compared. We found that
427 upregulated and 619 downregulated lncRNAs were significantly
differentially expressed (fold change ≥2.0). Cluster analysis was
used to arrange specimens into groups according to their expression
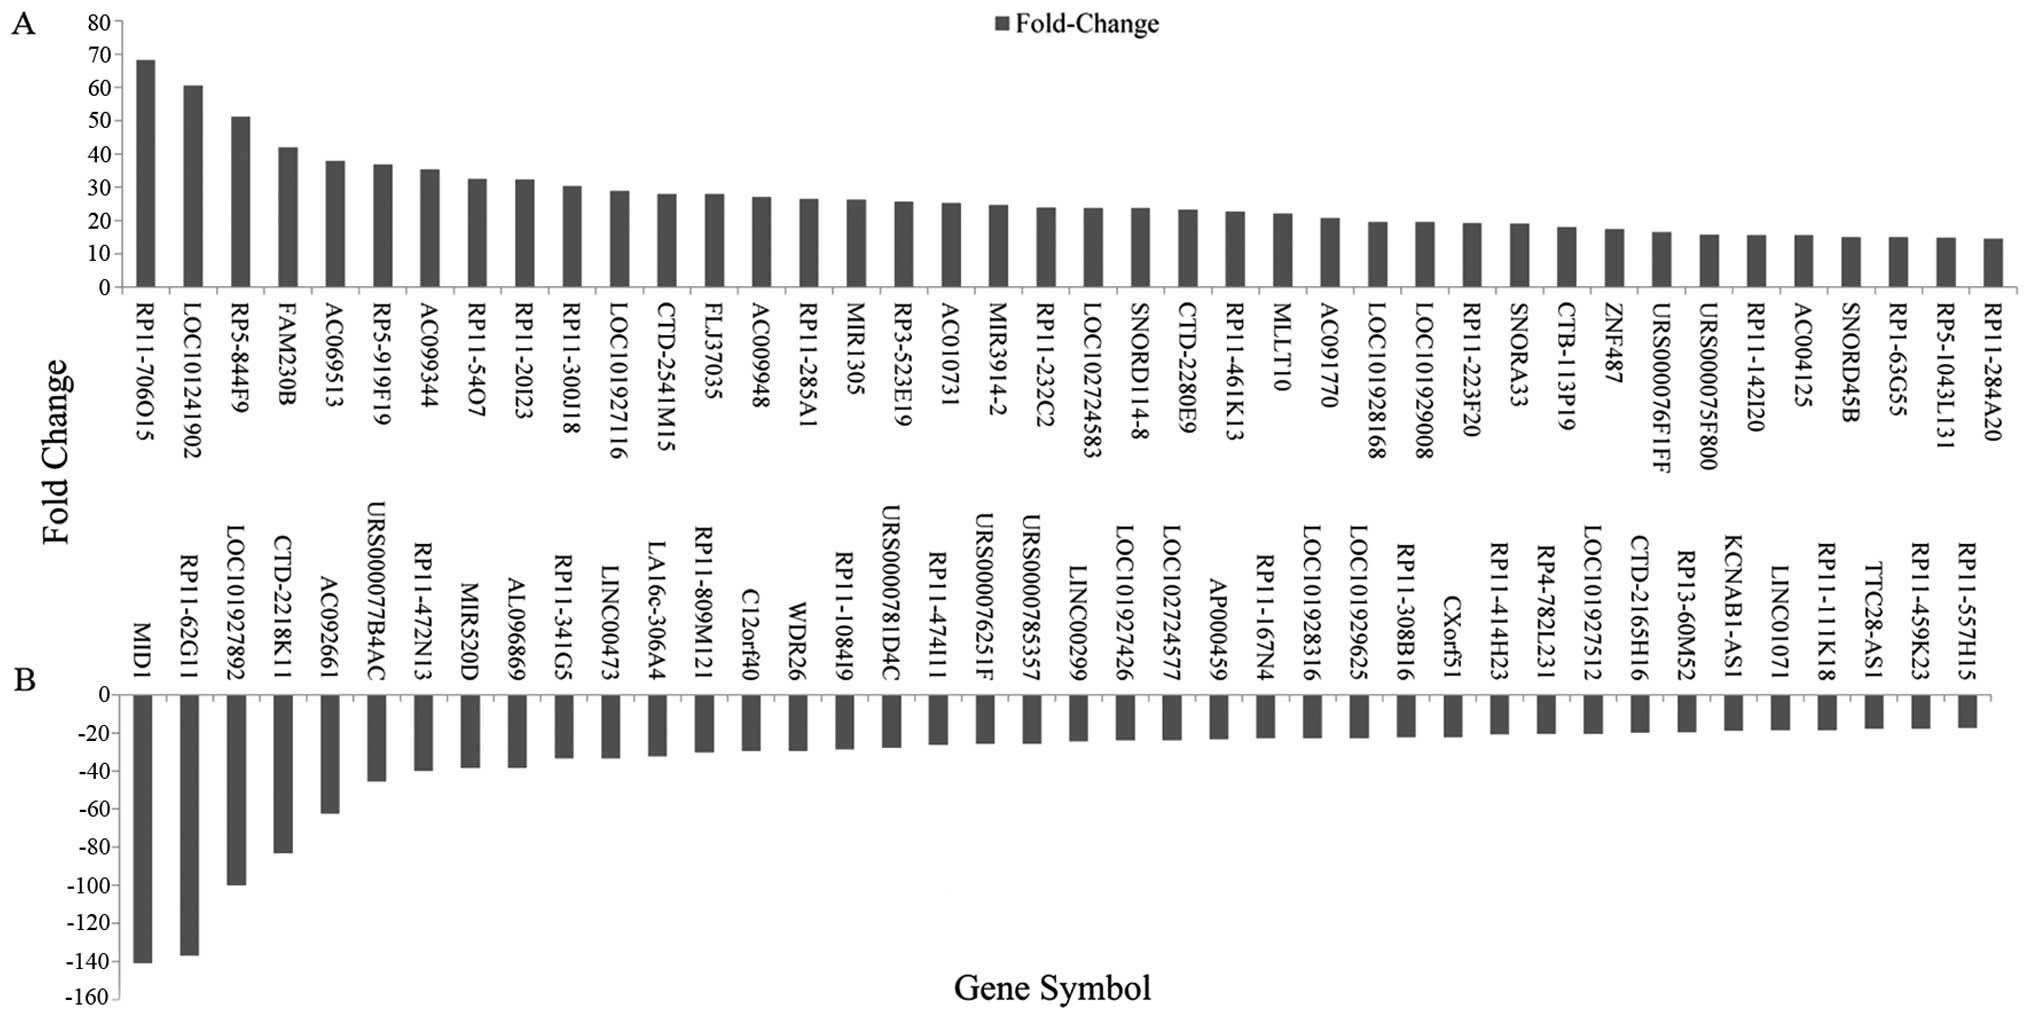
levels (Fig. 2). The top 40
differentially expressed lncRNAs are listed (Fig. 3). RP11-706O15 (fold change, 68.16)
was the most upregulated lncRNA, and MID1 (fold change, 140.85) was
the most downregulated. There were more downregulated than
upregulated lncRNAs according to the microarray data. In addition,
in the GC tissues and their paired adjacent non-cancerous samples,
mRNA expression profiling data showed that 647 upregulated and
2,349 downregulated mRNAs were significantly differentially
expressed (fold change ≥2.0). Hierarchical cluster analysis was
used to arrange specimens into groups according to their expression
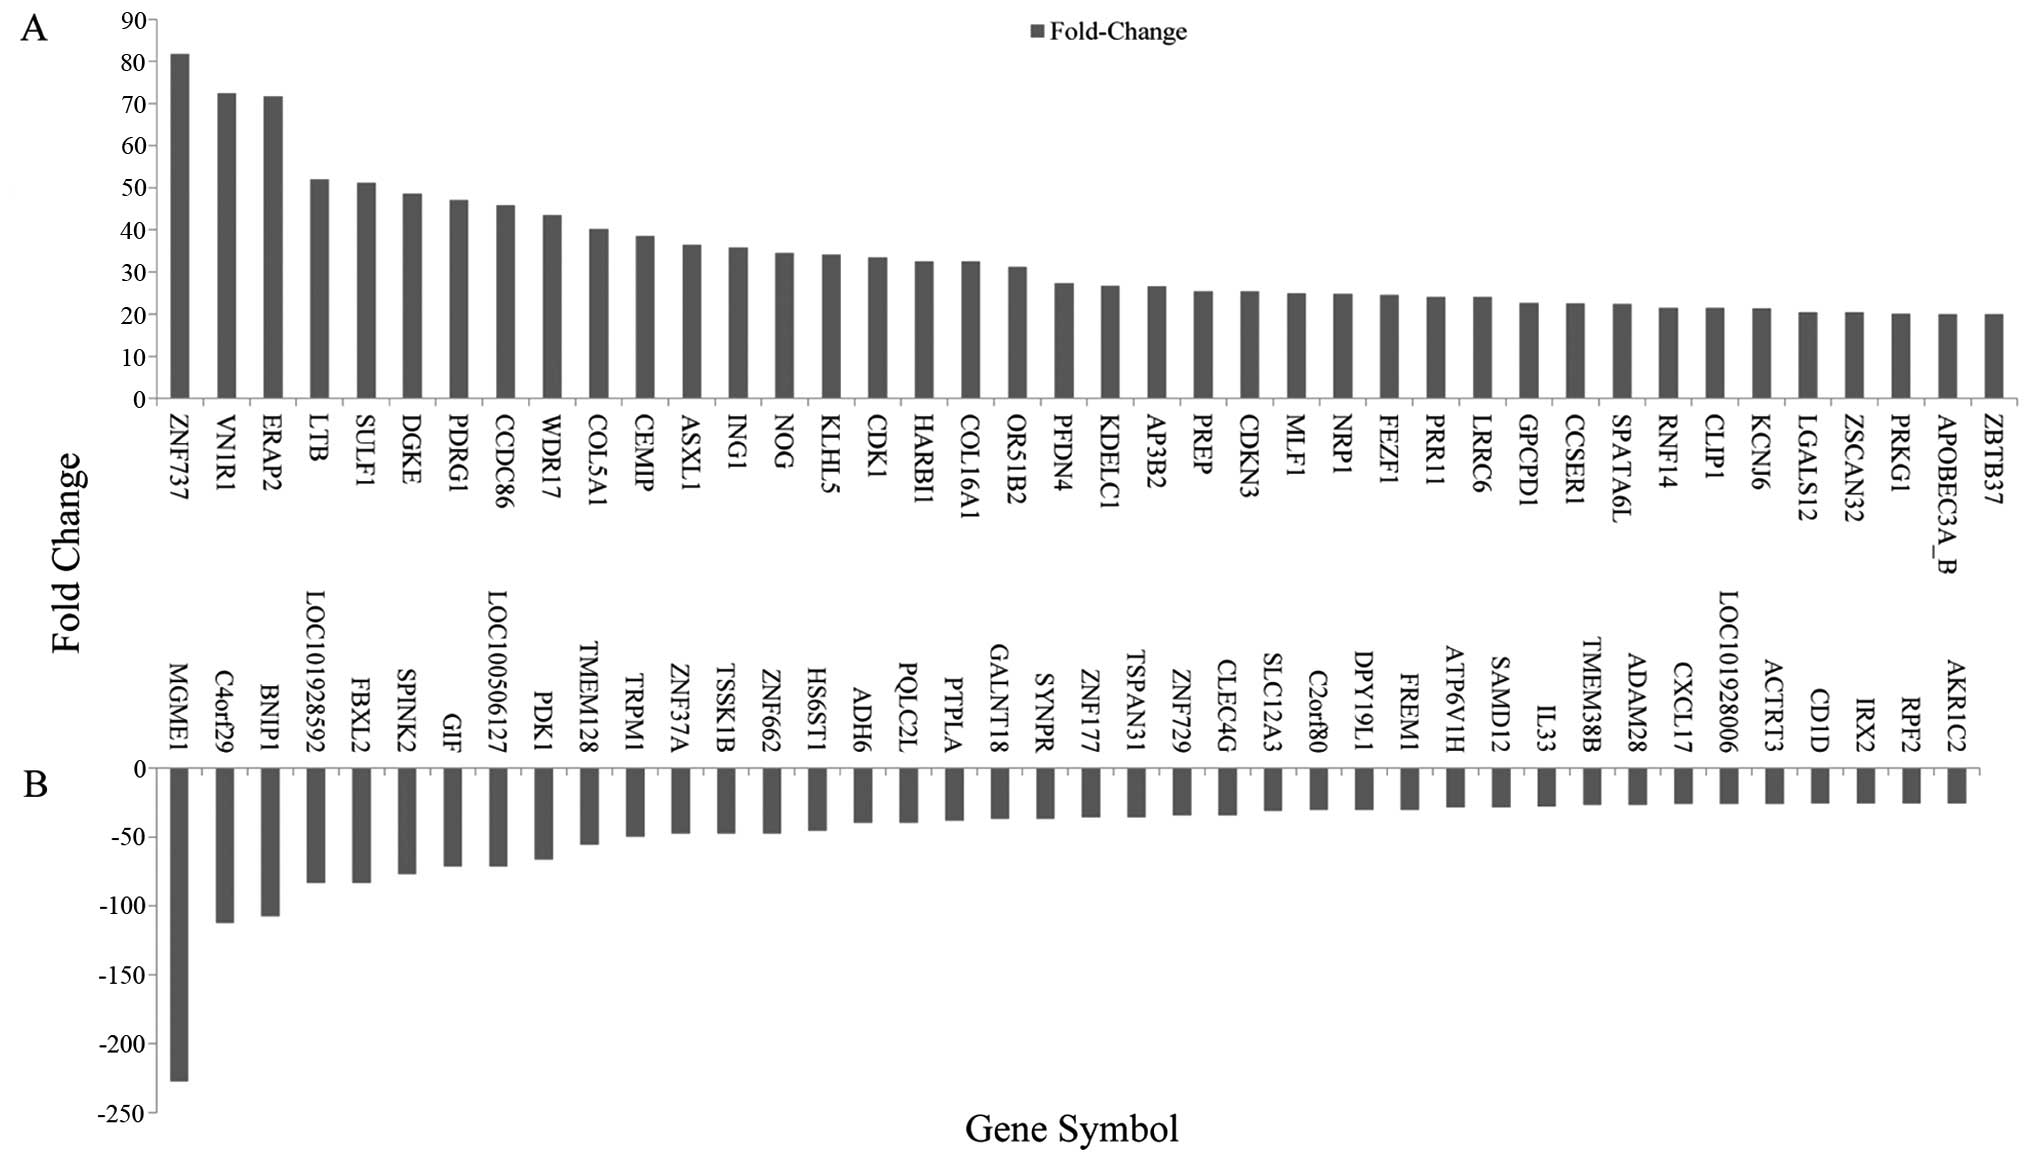
levels (Fig. 2). The top 40
differentially expressed mRNAs are listed (Fig. 4). ZNF737 (fold change, 81.73) was
the most upregulated mRNA, and MGME1 (fold change, 227.27) was the
most downregulated. We found that there were more downregulated
than upregulated mRNAs in this microarray analysis.
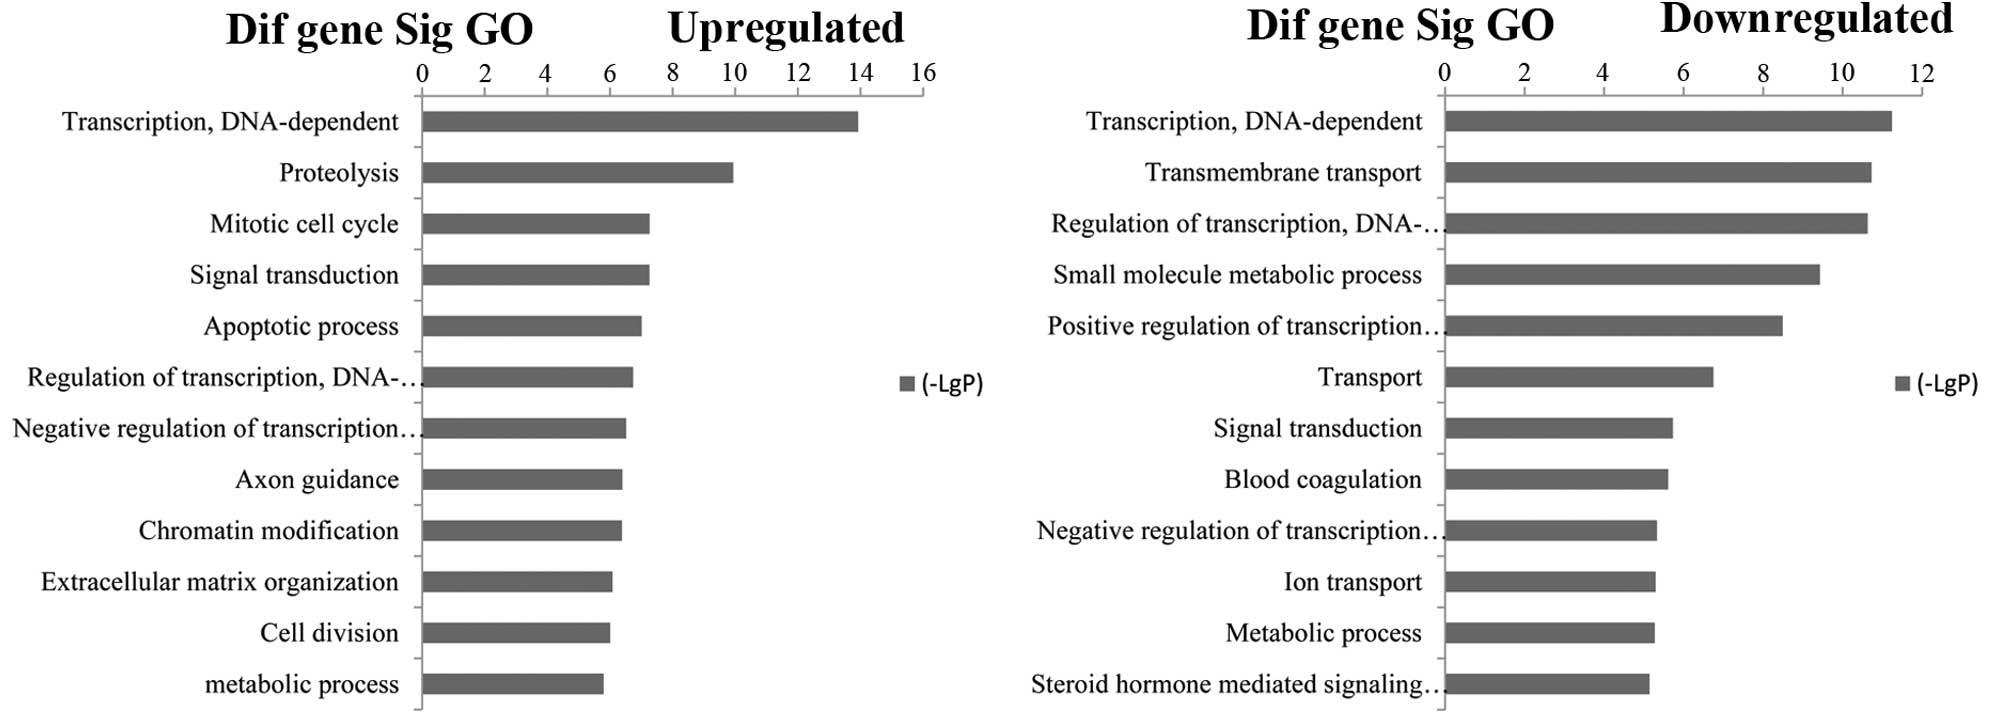
Function analysis of differentially
expressed genes
Differential expression of mRNAs in GC tissues and
adjacent non-cancerous tissues was analyzed by related (GO)
analysis performed by the DAVID functional annotation chart. We
analyzed the enrichment of these differentially expressed mRNAs.
Enrichment provides a measure of the significance of the function,
and as the enrichment increases, the corresponding function is more
specific, which helps us to identify GO with a more definitive
functional description (14). The
results showed that the highest enriched GOs targeted by
upregulated transcripts were DNA-dependent transcription
(GO:0006351), proteolysis (GO:0006508) and mitotic cell cycle
(GO:0000278). The highest enriched GOs targeted by downregulated
transcripts were DNA-dependent transcription (GO:0006351),
transmembrane transport (GO:0055085) and regulation of
DNA-dependent transcription (GO:0006355) (Fig. 5).
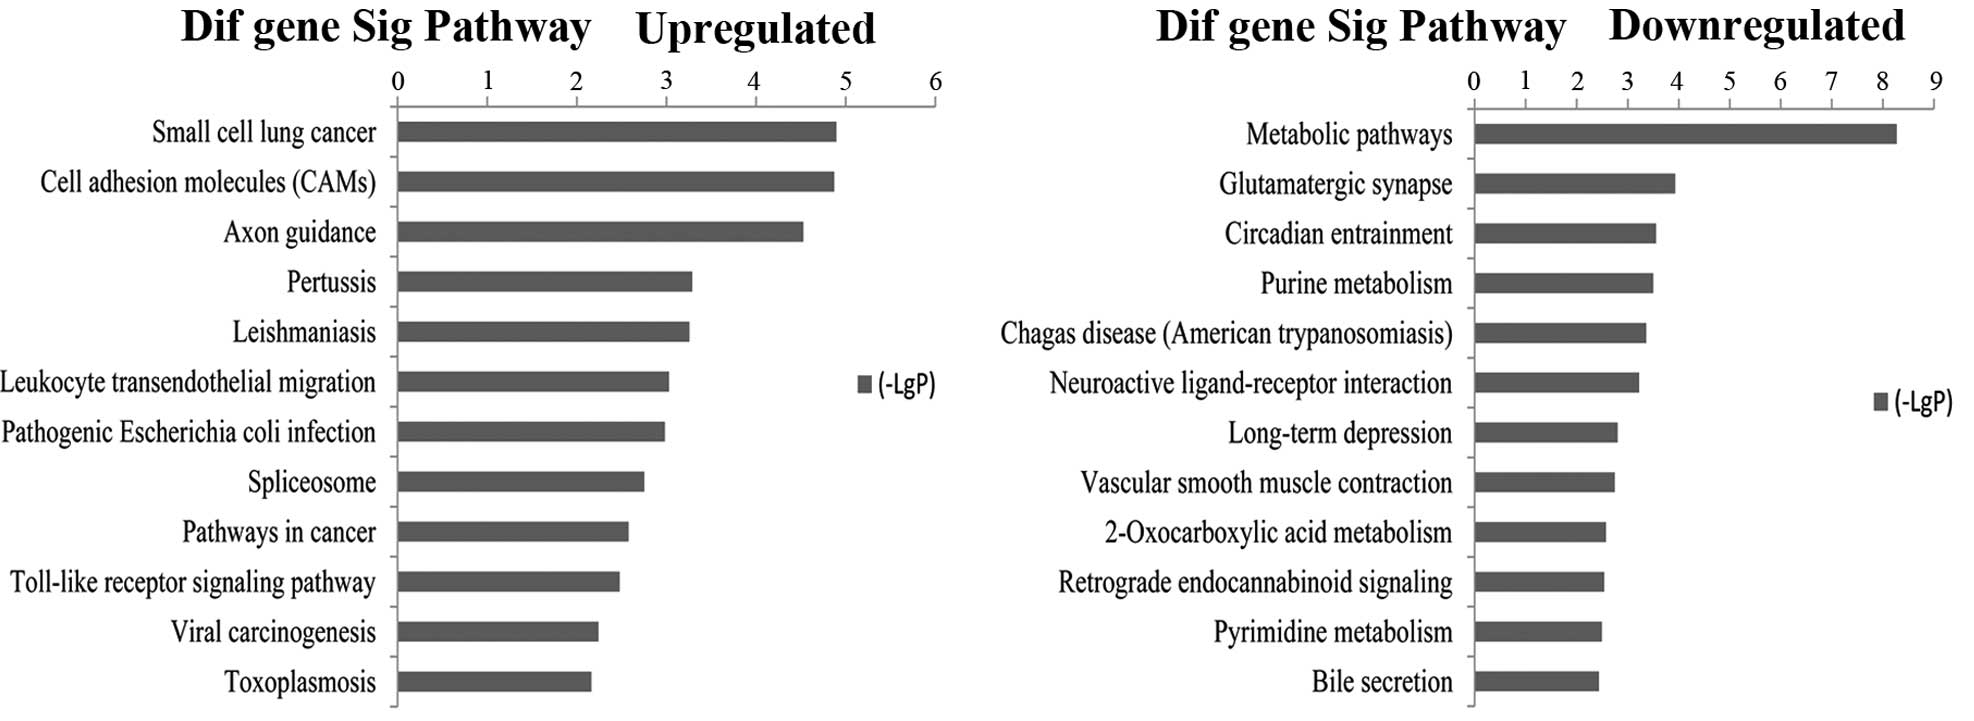
Pathway analysis indicated that 30 pathways
corresponded to upregulated transcripts and that the most enriched
network was small cell lung cancer, composed of 86 targeted genes.
Moreover, pathway analysis also showed that 37 pathways
corresponded to downregulated transcripts and that the most
enriched network was metabolic pathways, composed of 1,193 targeted
genes. Among these pathways, the gene category 'mTOR signaling
pathway', is involved in the carcinogenesis of gastric cardia
adenocarcinoma and gastric adenocarcinoma (15). The gene category 'gastric acid
secretion' has been investigated as a cause of adenocarcinoma at
the gastroesophageal junction and the distal esophagus (16). The gene category 'pathways in
cancer' is involved in the development of gastric cancer (17) (Fig.
6).
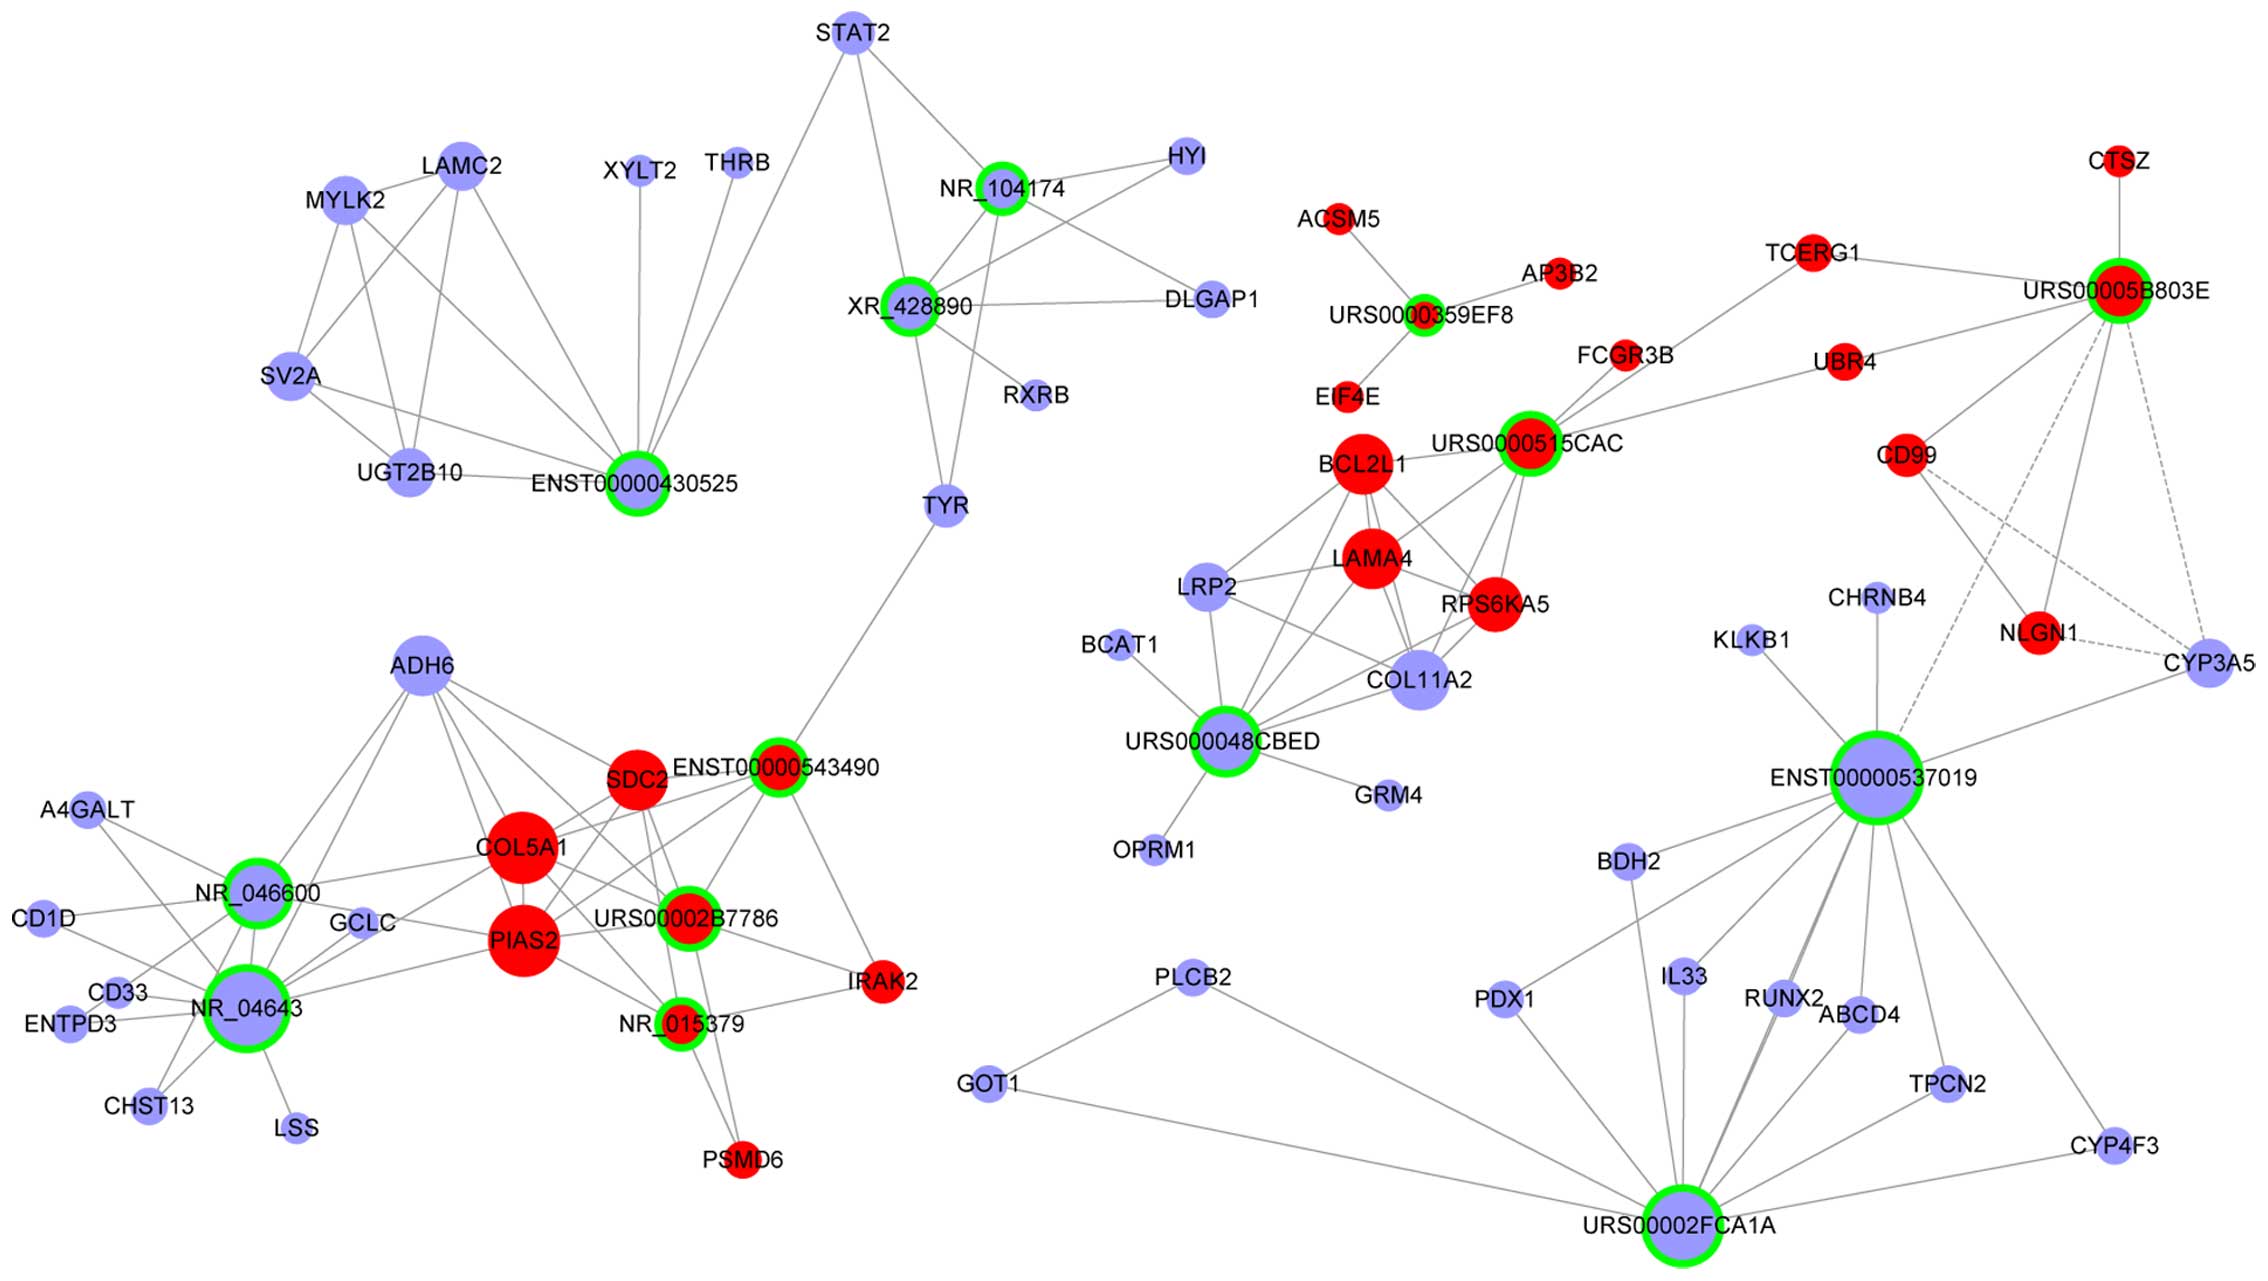
Construction of the lncRNA-mRNA
co-expression network
We used a coding and non-coding gene co-expression
(CNC) network to evaluate the interactions among lncRNAs and
identify the core regulatory lncRNAs in the network. The principle
of co-expression network studies is that if the expression pattern
of lncRNAs and mRNAs shows an identical or opposite curve to the
other, there is likely to be some interaction between the two
genes. By bioinformatics analysis, the co-expression network in GC
and their paired adjacent non-tumor tissues was constructed, and by
comparing the differences between them, potential core genes could
be identified (18). Based on our
previous results, we built CNC networks among the differentially
expressed lncRNAs and mRNAs in GC specimens and their paired
adjacent non-cancerous tissue specimens. The results showed network
connections between 184 lncRNAs and 164 mRNAs. We combined the
co-expression network, mRNAs function and microarray profile
differential expression to select the key lncRNAs. We found that 14
lncRNAs and 21 mRNAs were strongly associated (Table II and Fig. 7). Most of the genes mentioned here
are reported to be linked to GC.
| Table IIKey lncRNAs and mRNAs screened by
co-expression network and microarray profile comprehensive
analysis. |
Table II
Key lncRNAs and mRNAs screened by
co-expression network and microarray profile comprehensive
analysis.
| Name (LncRNAs) | Transcript-ID | Regulation | Degree | Fold-change | Related mRNAs |
|---|
| RP5-919F19 | URS0000515CAC | Upregulation | 7 | 36.924 | COL5A1, EIF4E,
LAMA4, BCL2L1, RPS6KA5, PIAS2, NLGN1, CD99, SDC2 |
| RP11-54O7 | URS00005B803E | Upregulation | 7 | 32.520 |
| RP11-20I23 | URS00002B7786 | Upregulation | 7 | 32.431 |
| CTD-2541M15 | URS0000359EF8 | Upregulation | 3 | 28.039 |
| AC010731 |
ENST00000543490 | Upregulation | 5 | 25.333 |
| UCA1 | NR_015379 | Upregulation | 5 | 11.510 |
| AP000459 | URS000048CBED | Downregulation | 8 | −23.256 |
| LOC101928316 | XR_428890 | Downregulation | 6 | −22.727 | COL11A2, LAMC2,
PLCB2, LRP2, PLCB2, MYLK2, ADH6, GOT1, TYR, CYP3A5, UGT2B10,
SV2A |
| RP11-167N4 |
ENST00000537019 | Downregulation | 12 | −22.727 |
| RP11-111K18 | URS00002FCA1A | Downregulation | 10 | −18.519 |
| LINC01071 | NR_104174 | Downregulation | 5 | −18.519 |
| TTC28-AS1 |
ENST00000430525 | Downregulation | 7 | −17.857 |
| MTOR-AS1 | NR_046600 | Downregulation | 8 | −16.667 |
| MEG3 | NR_046473 | Downregulation | 9 | −2.190 |
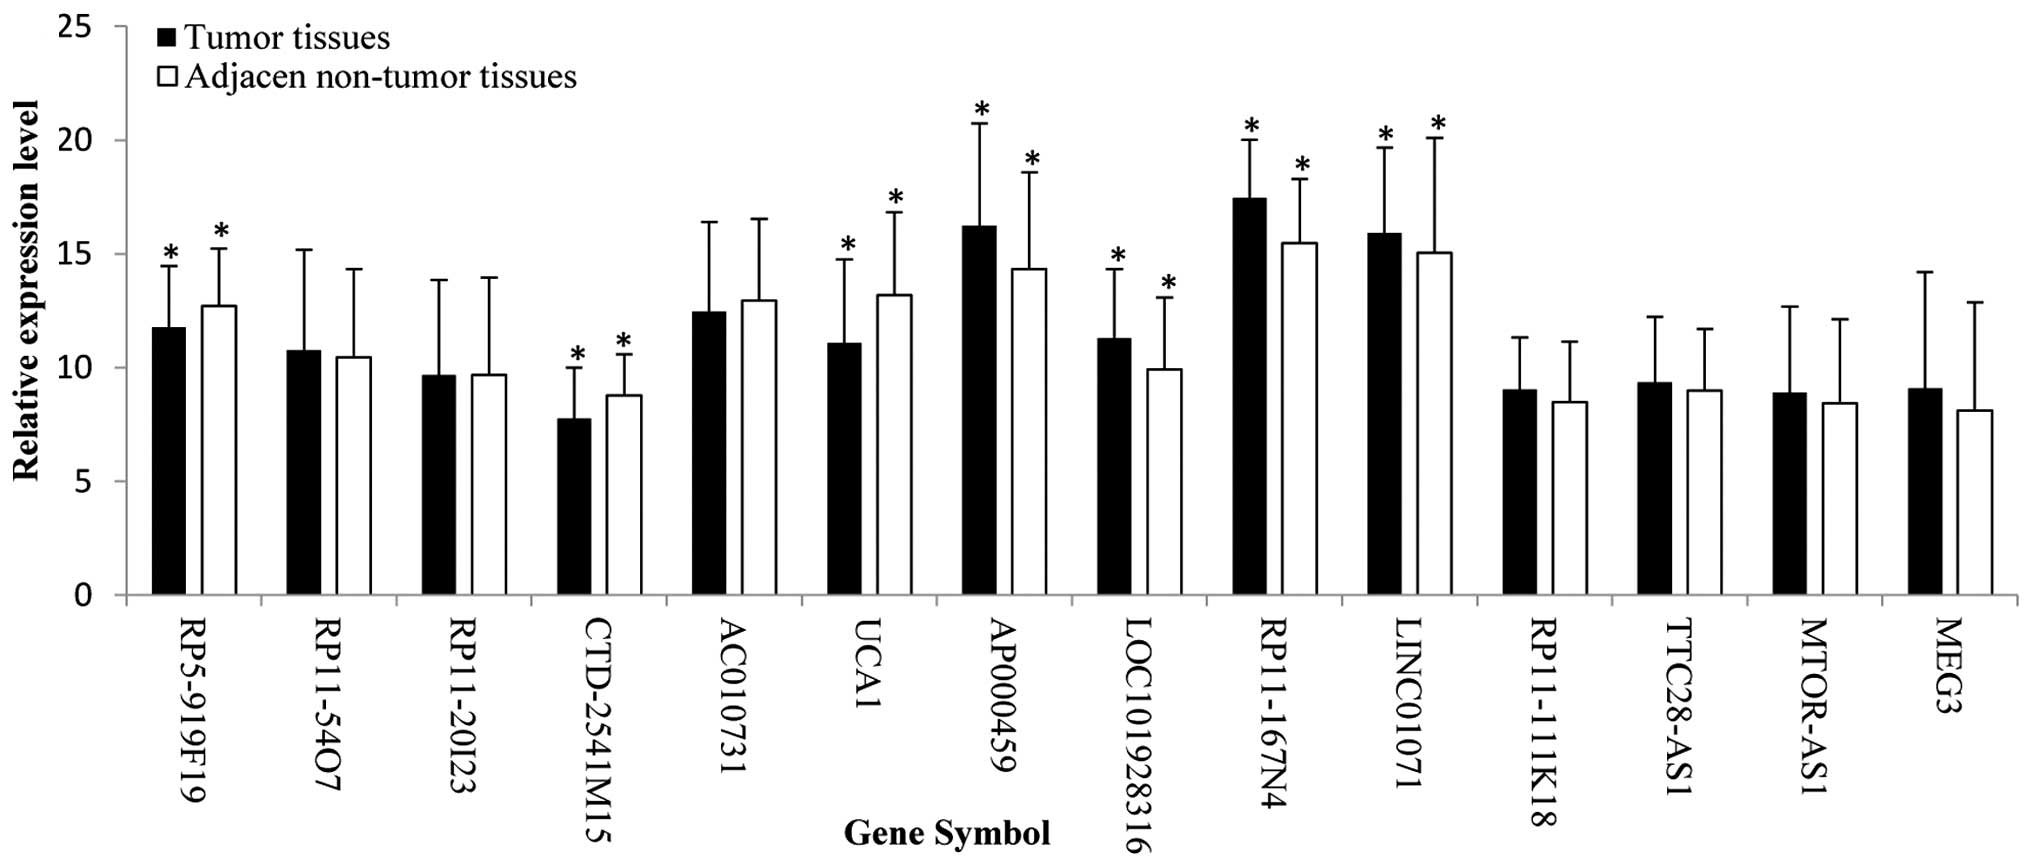
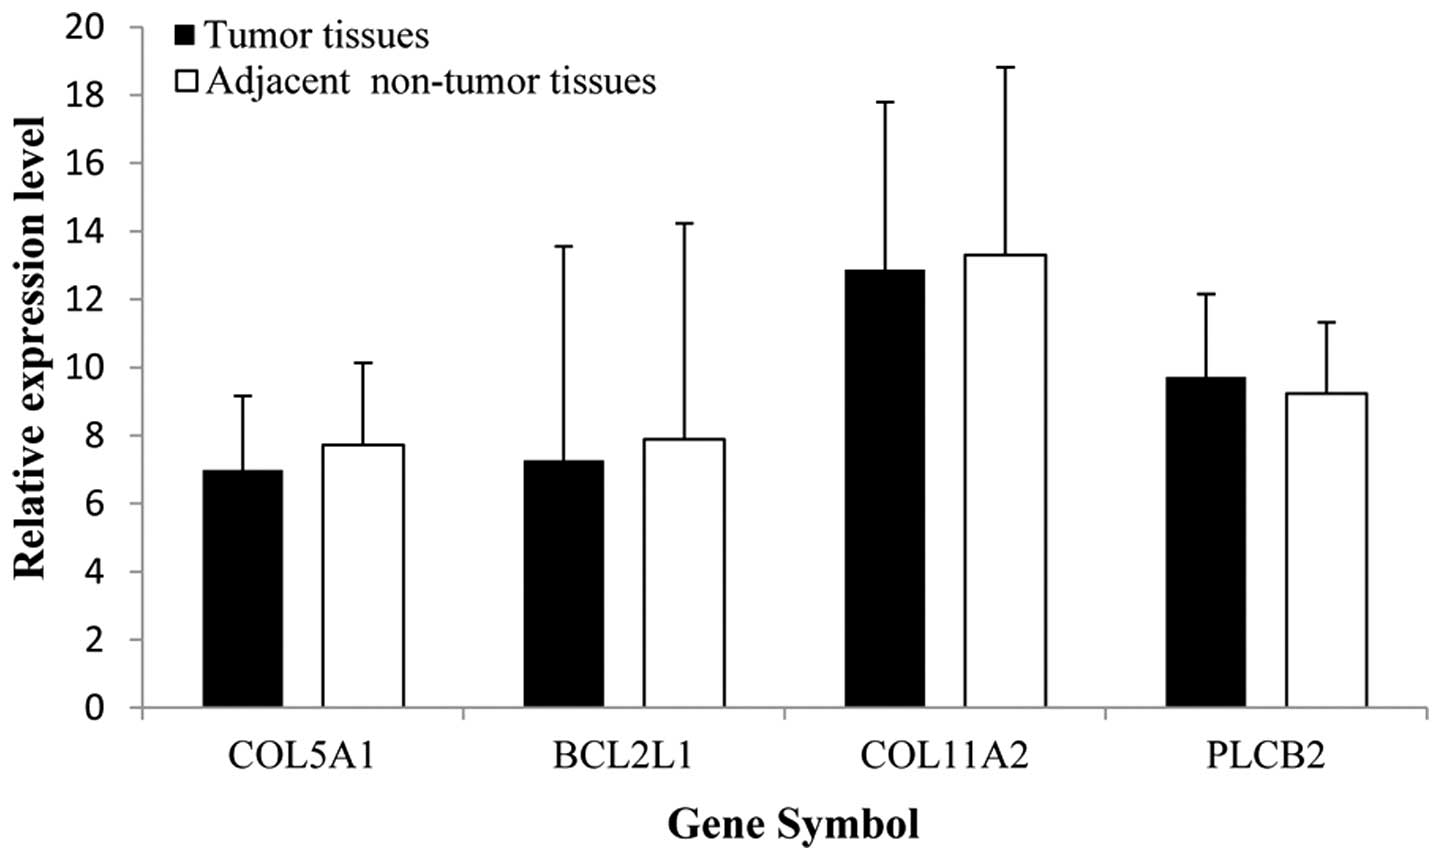
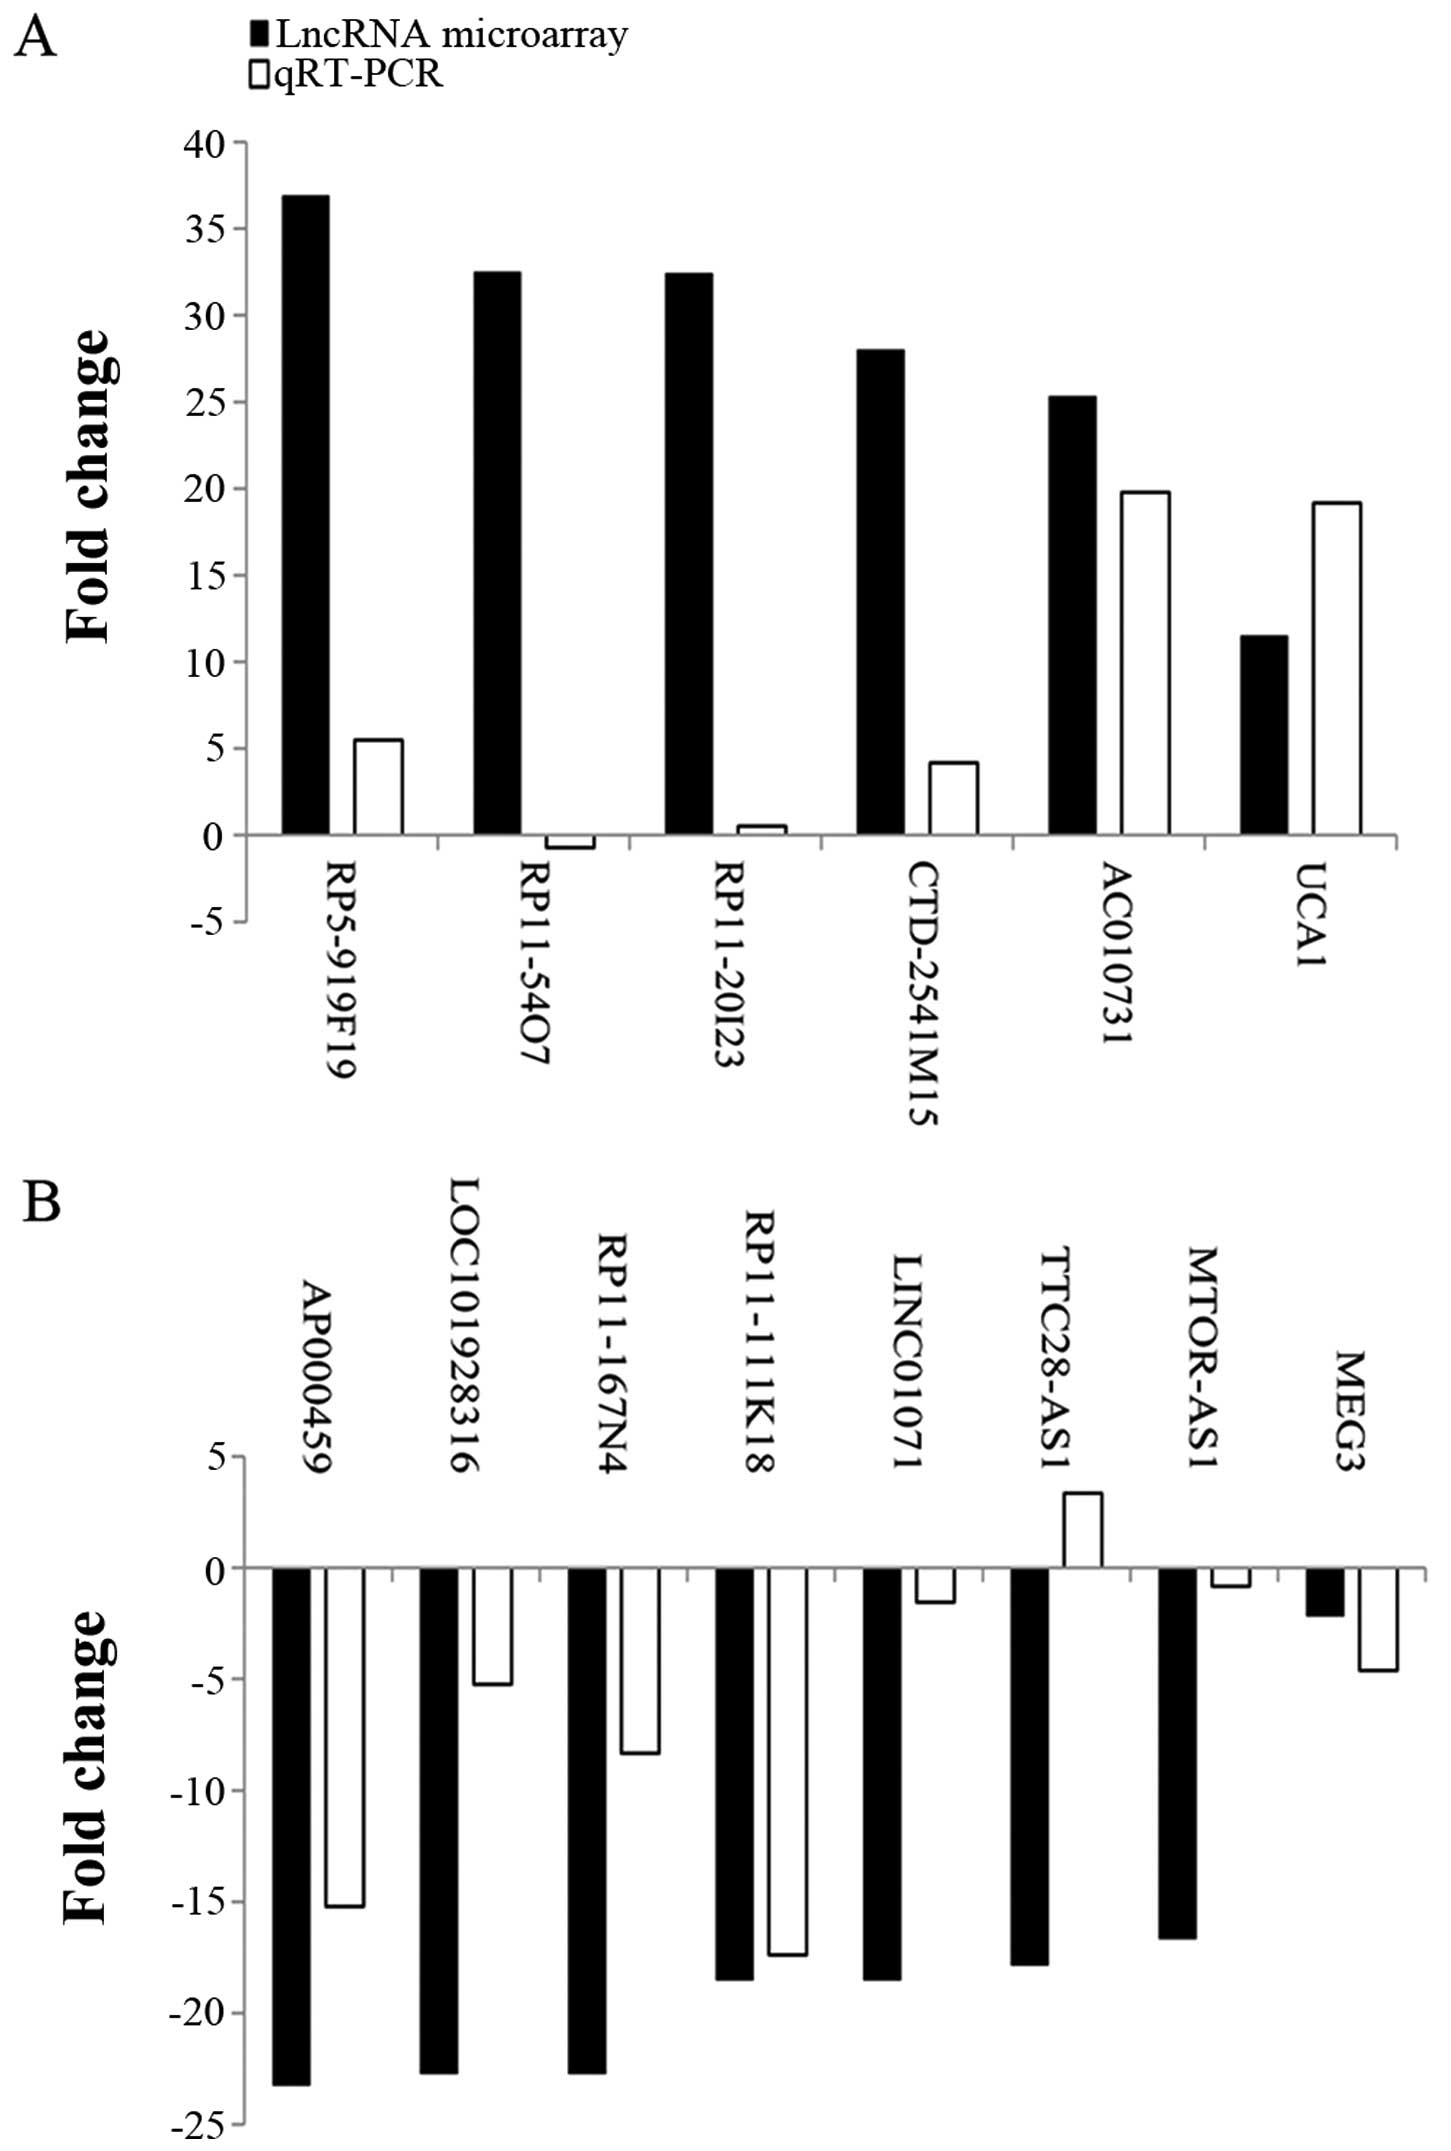
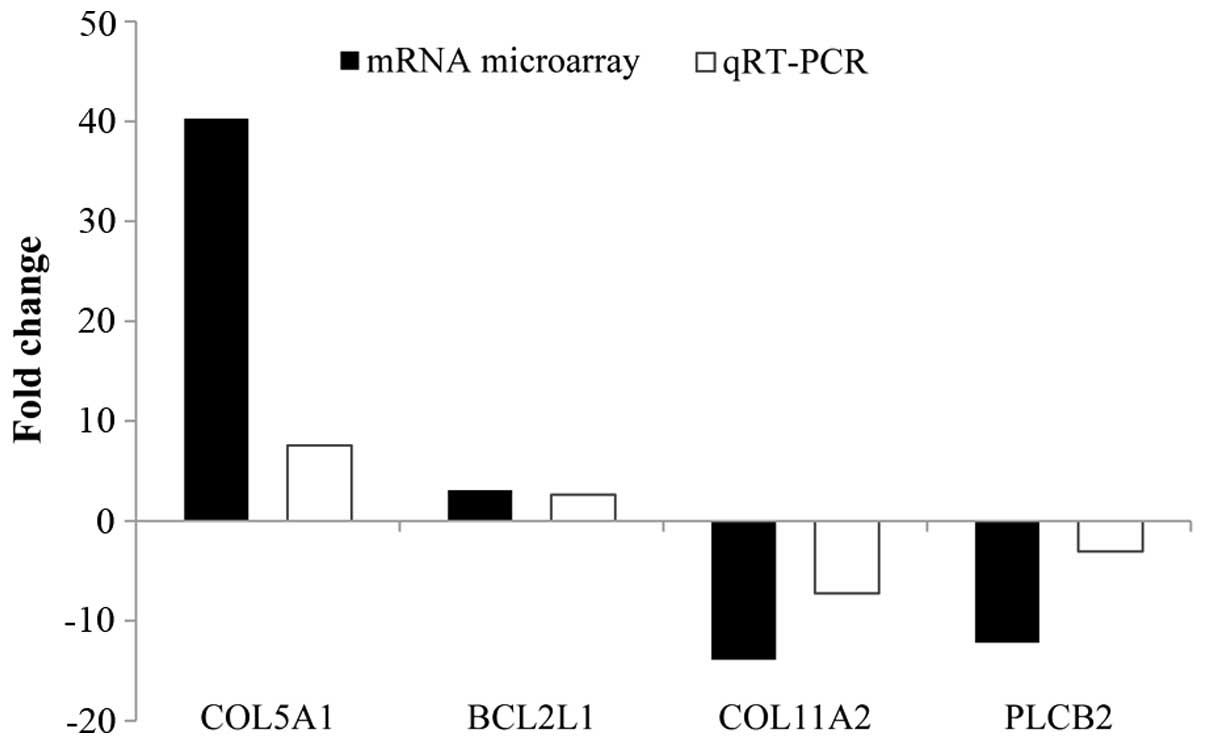
Validation of key lncRNAs and mRNAs by
quantitative RT-PCR in advanced GC
To confirm the reliability and validity of the
microarray data, we selected 14 differentially expressed key
lncRNAs (RP5-919F19, RP11-54O7, RP11-20I23, CTD-2541M15, AC010731,
UCA1, AP000459, LOC101928316, RP11-167N4, LINC01071, RP11-111K18,
TTC28-AS1, MTOR-AS1 and MEG3) and randomly selected four
differentially expressed mRNAs (COL5A1, BCL2L1, COL11A2 and PLCB2),
and analyzed their actual expression levels in 30 advanced GC
samples and paired adjacent non-tumor tissue samples with qRT-PCR.
The relative expression levels of lncRNAs and mRNAs were given as
ratios of RNA to GAPDH transcript levels in the same RNA sample. We
applied the paired t-test to evaluate the difference in gene
expression between the tumor tissues and their adjacent non-tumor
tissues. Results showed that, RP5-919F19, CTD-2541M15 and UCA1
expression was significantly higher in carcinoma than in adjacent
non-tumor tissues (P<0.05) (Table
III; Figs. 8 and 9). AP000459, LOC101928316, RP11-167N4 and
LINC01071 expression was significantly lower in carcinoma than in
adjacent non-tumor tissues (P<0.05) (Figs. 8 and 9). Expression levels of these 14 lncRNAs
and mRNAs were approximately consistent with the microarray results
(Table III; Figs. 10 and 11).
| Table IIIRelative expression of lncRNAs and
mRNAs in 30 pairs of advanced GC tumor and non-tumor tissues. |
Table III
Relative expression of lncRNAs and
mRNAs in 30 pairs of advanced GC tumor and non-tumor tissues.
| Gene symbol | Type | Group | Mean ± SD of
ΔCt | ΔΔCta (mean ± SD) |
2−ΔΔCt | P-value | t-value |
|---|
| RP5-919F19 | LncRNA | Tumor
tissues
Adjacent non-tumor tissues |
11.779±2.693
12.706±2.529 | −0.927±2.252 | 5.499 |
0.046b | 2.098 |
| RP11-54O7 | LncRNA | Tumor
tissues
Adjacent non-tumor tissues |
10.778±4.415
10.441±3.892 | 0.337±3.590 | −0.707 | 0.611 | −0.514 |
| RP11-20I23 | LncRNA | Tumor
tissues
Adjacent non-tumor tissues |
9.671±4.178
9.674±4.287 | −0.002±2.258 | 0.508 | 0.995 | 0.006 |
| CTD-2541M15 | LncRNA | Tumor
tissues
Adjacent non-tumor tissues |
7.773±2.224
8.774±1.816 | −1.000±1.980 | 4.174 |
0.011b | 2.719 |
| AC010731 | LncRNA | Tumor
tissues
Adjacent non-tumor tissues |
12.468±3.943
12.947±3.598 | −0.478±3.661 | 19.787 | 0.503 | 0.687 |
| UCA1 | LncRNA | Tumor
tissues
Adjacent non-tumor tissues |
11.097±3.666
13.198±3.619 | −2.100±2.774 | 19.168 |
0.001b | 3.862 |
| AP000459 | LncRNA | Tumor
tissues
Adjacent non-tumor tissues |
16.231±4.497
14.331±4.256 | 1.900±3.335 | −15.215 |
0.014b | 2.672 |
| LOC101928316 | LncRNA | Tumor
tissues
Adjacent non-tumor tissues |
11.307±3.017
9.907±3.176 | 1.400±2.473 | −5.237 |
0.008b | 2.889 |
| RP11-167N4 | LncRNA | Tumor
tissues
Adjacent non-tumor tissues |
17.467±2.557
15.485±2.800 | −0.184±3.284 | −8.343 |
0.027b | 0.978 |
| LINC01071 | LncRNA | Tumor
tissues
Adjacent non-tumor tissues |
15.928±3.744
15.038±5.068 | 0.747±3.638 | −17.388 |
0.029b | 1.085 |
| RP11-111K18 | LncRNA | Tumor
tissues
Adjacent non-tumor tissues |
9.045±2.270
8.491±2.653 | 0.554±1.839 | −1.553 | 0.137 | 1.536 |
| TTC28-AS1 | LncRNA | Tumor
tissues
Adjacent non-tumor tissues |
9.373±2.853
8.988±2.714 | 0.385±2.930 | 3.354 | 0.509 | 0.671 |
| MTOR-AS1 | LncRNA | Tumor
tissues
Adjacent non-tumor tissues |
8.920±3.764
8.430±3.685 | 0.490±2.584 | −0.838 | 0.333 | 0.986 |
| MEG3 | LncRNA | Tumor
tissues
Adjacent non-tumor tissues |
9.099±5.087
8.101±4.767 | 0.997±2.801 | −4.615 | 0.076 | 1.849 |
| COL5A1 | mRNA | Tumor
tissues
Adjacent non-tumor tissues |
6.982±2.174
7.721±2.412 | −0.429±2.068 | 7.554 | 0.123 | 1.594 |
| BCL2L1 | mRNA | Tumor
tissues
Adjacent non-tumor tissues |
7.259±6.294
7.891±6.338 | −0.607±2.178 | 2.635 | 0.131 | 1.560 |
| COL11A2 | mRNA | Tumor
tissues
Adjacent non-tumor tissues |
12.879±4.909
13.307±5.514 | −0.774±4.937 | −7.249 | 0.656 | 0.452 |
| PLCB2 | mRNA | Tumor
tissues
Adjacent non-tumor tissues |
9.717±2.441
9.226±2.096 | 0.495±2.273 | −3.035 | 0.291 | 1.081 |
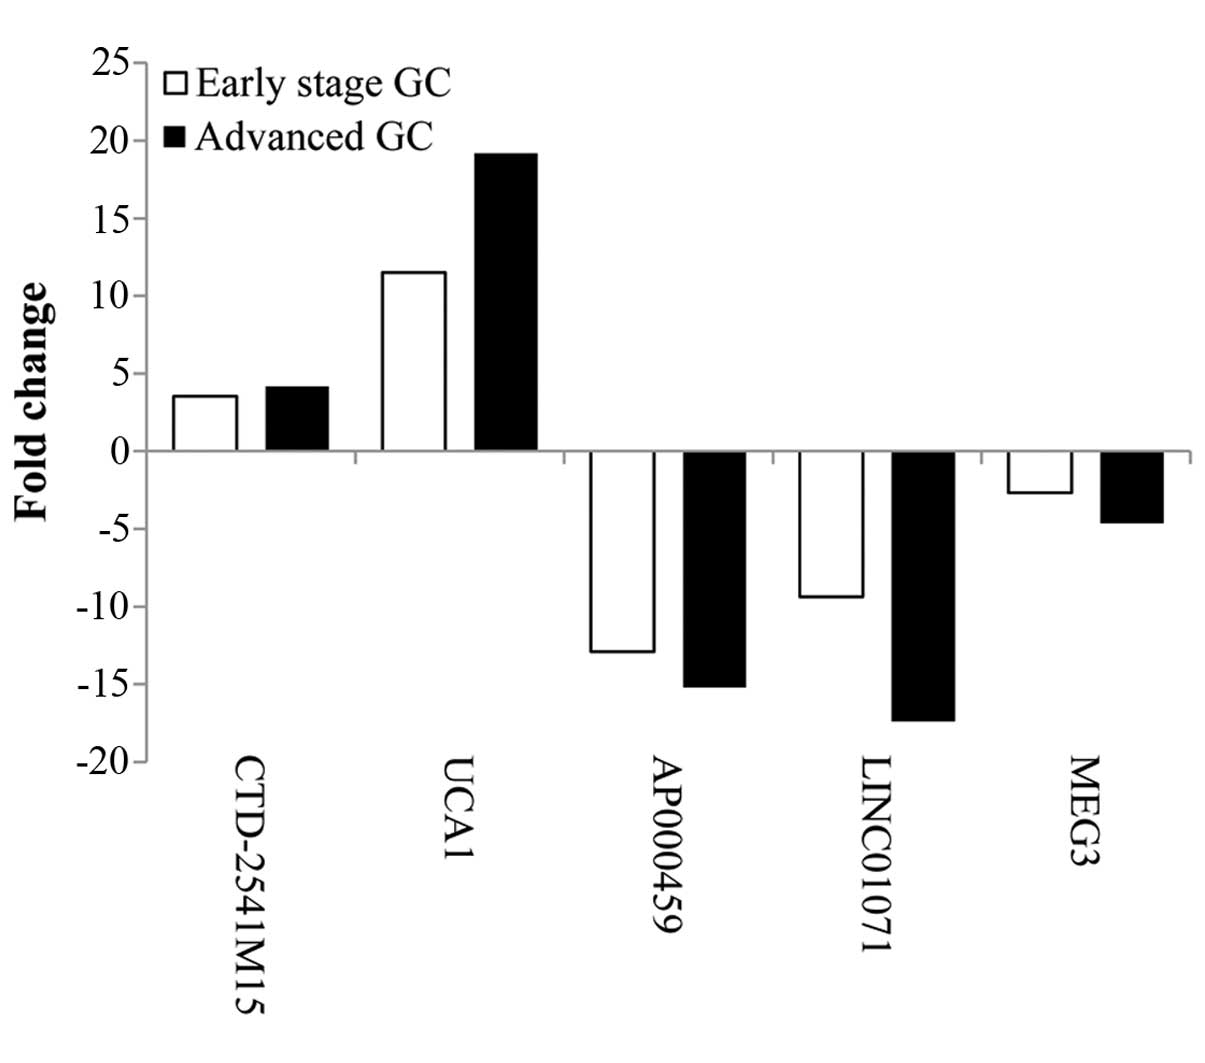
Validation of candidate lncRNAs in early
stage GC
Then, we chose significant differential expression
candidate lncRNAs (RP5-919F19, CTD-2541M15, UCA1, AP000459,
LOC101928316, RP11-167N4, LINC01071 and MEG3) to further validate
20 early stage GC patient samples by qRT-PCR. Results showed that,
the expression levels of CTD-2541M15 and UCA1 were significantly
higher in 20 early stage GC patient tumor tissues than in their
adjacent non-tumor tissues (P<0.050). AP000459, LINC01071 and
MEG3 expression was significantly lower in carcinoma than in
adjacent non-tumor tissues P<0.05 (Table IV). In addition, we also analyzed
the change regularity of the significant differential lncRNAs both
on advanced GC and early stage GC. Based on our results, compared
with adjacent non-tumor tissues, the expression of CTD-2541M15 and
UCA1 showed a significant gradual upward trend from early stage GC
to advanced GC, AP000459, LINC01071 and MEG3 showed a significant
gradual downward trend from early stage GC to advanced GC (Fig. 12).
| Table IVRelative expression of candidate
lncRNAs in 20 pairs of early stage GC tumor and non-tumor
tissues. |
Table IV
Relative expression of candidate
lncRNAs in 20 pairs of early stage GC tumor and non-tumor
tissues.
| Gene symbol | Group | Mean ± SD of
ΔCt | ΔΔCta (mean ± SD) | 2−ΔΔCt | P-value | t-value |
| RP5-919F19 | Tumor
tissues
Adjacent non-tumor tissues |
12.958±3.244
13.205±2.870 | −0.247±2.390 | 1.552 | 0.658 | 0.451 |
| CTD-2541M15 | Tumor
tissues
Adjacent non-tumor tissues |
8.714±2.510
9.670±2.020 | −0.955±2.000 | 3.528 | 0.046b | 2.135 |
| UCA1 | Tumor
tissues
Adjacent non-tumor tissues |
9.387±3.335
11.432±3.803 | −2.045±2.310 | 11.502 | 0.000b | 4.618 |
| AP000459 | Tumor
tissues
Adjacent non-tumor tissues |
14.781±4.333
13.046±4.708 | 1.783±2.551 | −12.911 | 0.012b | 2.831 |
| LOC101928316 | Tumor
tissues
Adjacent non-tumor tissues |
10.766±3.217
10.562±2.712 | 0.203±2.205 | −0.036 | 0.701 | 0.391 |
| RP11-167N4 | Tumor
tissues
Adjacent non-tumor tissues |
15.681±5.507
15.227±5.919 | 0.454±2.917 | 0.450 | 0.673 | 0.440 |
| LINC01071 | Tumor
tissues
Adjacent non-tumor tissues |
13.886±2.595
12.795±3.415 | 1.092±2.919 | −9.379 | 0.044b | 2.181 |
| MEG3 | Tumor
tissues
Adjacent non-tumor tissues |
8.651±3.123
7.338±2.936 | 1.284±2.132 | −2.680 | 0.026b | 2.449 |
Association between verified lncRNAs and
the GC
Conditional logistic regression analysis was used to
evaluate the association between differentially expressed lncRNAs
and the risk of GC. As shown in Table
V, significantly increased risk for GC was associated with
increased expression of CTD-2541M15 and UCA1 (OR=2.860 and 30193,
respectively) and reduced expression of MEG3 (OR=0.132). This
suggested that CTD-2541M15 and UCA1 may function as oncogenes,
while MEG3 might act as tumor suppressors.
| Table VAberrant expression of lncRNAs
associated with GC by conditional logistic regression analysis. |
Table V
Aberrant expression of lncRNAs
associated with GC by conditional logistic regression analysis.
| Gene symbol | Group | β | SE | Wald | P-value | OR | 95% CI |
|---|
| CTD-2541M15 | Tumor
tissues
Adjacent non-tumor tissues | 1.051 | 0.480 | 4.796 |
0.029a | 2.860
1.000 | 1.117–7.326 |
| UCA1 | Tumor
tissues
Adjacent non-tumor tissues | 1.161 | 0.524 | 4.914 |
0.027a | 3.193
1.000 | 1.144–8.915 |
| AP000459 | Tumor
tissues
Adjacent non-tumor tissues | −0.047 | 0.184 | 0.065 | 0.798 | 1.048
1.000 | 0.731–1.502 |
| LINC01071 | Tumor
tissues
Adjacent non-tumor tissues | 0.372 | 0.250 | 2.209 | 0.137 | 1.450
1.000 | 0.888–2.369 |
Discussion
Despite advances in therapeutic options, early
diagnosis and treatment remains the most effective way to reduce GC
mortality. Even if gastrectomy is performed well, most patients
with GC experience recurrence or metastasis within 1–2 years of
surgery (19). The aims of cancer
studies are to characterize systematically the cellular and
molecular mechanisms involved in disease progression, and
consequently, to identify potential biomarkers for predicting
high-risk populations (20).
Therefore, finding novel molecular biomarkers of malignancy has
always been important for cancer prevention and treatment. Like
proteins, mRNAs and miRNAs, lncRNAs show potential as novel
biomarkers and therapeutic targets in different cancer types. These
RNAs are >200 nucleotides and do not encode any protein. Some of
them are strongly correlated with poor prognosis, suggesting a
potential role in cancer progression (21). lncRNAs in GC have predominantly been
reported from western countries and Japan, with few studies from
China (22). Although the molecular
mechanism of GC has been extensively investigated, the exact
pathogenesis of this disease is still unclear (23,24).
Molecular pathology of GC may vary among populations, which is
likely due to differential exposure to disease risk factors
including customs and habits, Helicobacter pylori variants
and medical conditions. In the present study, our aim was to
establish a comprehensive lncRNA and mRNA expression profile for GC
in the Chinese population, a known high-risk population in Wuwei,
and to investigate the mechanisms underlying GC carcinogenesis.
The present study revealed differential lncRNA and
mRNA expression profiles in GC tissues and adjacent non-tumor
tissues samples using microarray analysis. Here, we generated three
pairs of pooled RNA samples from 10 advanced GC patients to
microarray analysis. In this way, we can obtain more information of
microarray detection and avoid separate specimen unique genes. In
addition, using tissue samples to microarray analysis, we could not
guarantee that each piece of specimen contains the same cell types
and quantity, especially in tumor tissues and their adjacent
non-tumor tissues. Thus, pooled RNA samples will improve the
proportion of the same cell type tissues in the total RNA and make
the microarray results more meaningful to population based study.
In the present study, microarray results showed that lncRNA and
mRNA expression levels in GC samples differed from those in
adjacent non-tumor tissues. The microarray expression profile
showed significantly differential expression (fold change ≥2.0) of
427 upregulated and 619 downregulated lncRNAs in 10 GC samples. In
addition, there was significantly differential expression (fold
change ≥2.0) of 647 upregulated and 2,349 downregulated mRNAs. GO
and pathway analysis, and a lncRNA and mRNA co-expression network
were used to study the biological function and potential mechanism
of these genes in GC. We selected key lncRNAs and mRNAs for
validation by quantitative real-time PCR in 30 pairs advanced GC
and 20 early stage GC tissues and their paired adjacent non-tumor
tissues. Finally, we used logistic regression analysis to find the
association between candidate RNAs and the GC.
Several association studies have identified a large
number of lncRNAs that are differentially expressed in disease
states, including oncogenesis (25). An increasing number of studies have
documented a biological link between aberrant expression of lncRNAs
and GC (26). Dysregulation of
lncRNAs, such as CCAT1, CHET1, H19, HOTAIR, MEG3, PVTI and
SPRY4-IT1, is regarded as an important feature of GC (27–31).
However, the expression and functional significance of lncRNAs in
GC tumorigenesis have not been completely characterized. We also
used different databases, including LncRNAdb, Gene Expression
Atlas, Gene Expression Omnibus (GEO), and Array Express Databases,
to analyze the expression level of the most recently cited lncRNAs
in studies on GC (32,33). We found that differentially
expressed lncRNAs and mRNAs, such as UCA1, MEG3, HOTAIR, LINC01071,
COL5A1, BCL2L1, COL11A2 and PLCB2, were the same as in other
studies of GC (34). In the present
study, the GO results showed that the functions of differentially
expressed mRNAs in GC and their paired adjacent non-tumor tissues
were DNA-dependent transcription, proteolysis, mitotic cell cycle,
transmembrane transport and regulation of transcription. Abnormal
expression of these regulatory genes is closely related to tumor
development (35,36). Furthermore, KEGG pathway analysis
revealed 67 pathways that may play key roles in the different core
epigenetic mechanisms of GC, including the mTOR signaling pathway,
gastric acid secretion, pathways in cancer, apoptosis and
transcriptional regulation in cancer. Li et al (17) and Fan et al (37) have characterized differentially
expressed genes that are involved in pathways associated with GC.
They found that BCL2A1, LAMA4, ICM1 and LAMC2 participated in
cancer-related signaling pathways such as mTOR and gastric acid
secretion.
To gain insight into the function of lncRNAs, we
used a lncRNA-mRNA co-expression network, which may be used for
predicting target genes of lncRNAs. The principle of co-expression
networks is that, by comparing the similarity or difference in the
expression pattern of lncRNAs and mRNAs, any correlations between
them can be determined (38,39).
With this method, we compiled a list of lncRNAs and mRNAs that
contained some key transcripts closely related to the pathogenesis
of GC. We combined the results of microarray analysis, gene
function and the co-expression network. The differential expression
of mRNAs that participated in cancer-related pathways and related
lncRNAs were RP5-919F19, RP11-54O7, RP11-20I23, CTD-2541M15,
AC010731, UCA1, AP000459, LOC101928316, RP11-167N4, LINC01071,
RP11-111K18, TTC28-AS1, MTOR-AS1 and MEG33. The LncRNAdb and LncRNA
Diseases database showed that UCA1 is associated with urothelial
cancer (40) and MEG3 with GC
(41). The function of other
lncRNAs was not reported.
Then, we analyzed the expression of 14 lncRNAs and
four mRNAs in 30 pairs of tumor tissues and adjacent non-tumor
tissues by using qRT-PCR. After qRT-PCR verification, we
demonstrated for the first time that RP5-919F19, CTD-2541M15,
AC010731 and UCA1 were upregulated in tumor tissues compared with
adjacent non-tumor tissues, whereas AP000459, LOC101928316,
RP11-167N4 and LINC01071 were downregulated in tumor tissues.
Moreover, expression of seven lncRNAs was significantly correlated
with GC-related mRNAs, suggesting these lncRNAs may play important
roles in GC by regulating their target genes. Although the other
indicators of the lncRNA and mRNA expression results did not differ
significantly, the increases and decreases were approximately
consistent with the microarray results. In the next step, we chose
significant differential expression candidate lncRNAs to further
validate 20 early stage GC patients samples. Results suggest that
CTD-2541M15 and UCA1 was significantly higher expressed, AP000459,
LINC01071 and MEG3 expression was significantly lower in the 20
early stage GC patient tumor tissues than in their adjacent
non-tumor tissues. In addition, these lncRNAs expression levels
appear with gradual upward or downward trends, respectively. Other
indicators did not differ significantly in qRT-PCR, the reason may
be due to the tumor tissues in this study, which were analysed by
matching with adjacent non-tumor tissues instead of normal tissues,
some early lesions might have been confused with normal tissues,
which led to some differences in lncRNA and mRNA expression levels
between the tumor and non-tumor tissues. Furthermore, we found that
expression of CTD-2541M15, UCA1, AP000459, LINC01071 and MEG3 were
sensitive between tumor and adjacent non-tumor tissues. Zheng et
al (42) also found that the
levels of UCA1 in gastric juice from GC patients were significantly
higher than in normal subjects. In addition, Sun et al
(30) found that MEG3 levels were
markedly decreased in GC tissues compared with adjacent normal
tissues. MEG3 expression level was significantly correlated with
TNM stage, depth of invasion and tumor size. However, functions of
CTD-2541M15, AP000459 and LINC01071 have not been reported. The
conditional logistic regression analysis results showed that
CTD-2541M15 and UCA1 may function as carcinogenic genes, while MEG3
might act as tumor suppressor, but the mechanisms of gene
regulation are unclear. In the next step we will launch cell
validation and gene intervention experiments to further study
related functions.
In conclusion, the present study provided
preliminary data that have helped to understand the potential
mechanisms of GC, via differentially expressed lncRNAs and mRNAs.
There was significant differential expression of lncRNAs between
the GC and paired non-cancerous tissues, suggesting that lncRNAs
may play important roles in the tumorigenesis of GC. Further
validating these significant differential expression candidate RNAs
we found that CTD-2541M15, UCA1, AP000459, LINC01071 and MEG3 were
closely related to the progression and development of GC. Our
results suggest that these differentially expressed lncRNAs may be
potential biomarkers for early diagnosis of GC, which is an
interesting direction for further research.
Acknowledgments
The present study was financially supported by the
National Natural Science Foundation of China (81472939 and
81182618), the Qing Lan Project (no. 2012), the 333 project of
Jiangsu Province (no. 2012), the Liu Da Ren Cai Gao Feng Project of
Jiangsu Province (no. 2013-WSW-053) and the Fundamental Research
Funds for the Central Universities.
References
|
1
|
Torre LA, Bray F, Siegel RL, Ferlay J,
Lortet-Tieulent J and Jemal A: Global cancer statistics, 2012. CA
Cancer J Clin. 65:87–108. 2015. View Article : Google Scholar : PubMed/NCBI
|
|
2
|
Siegel R, Ma J, Zou Z and Jemal A: Cancer
statistics, 2014. CA Cancer J Clin. 64:9–29. 2014. View Article : Google Scholar : PubMed/NCBI
|
|
3
|
Tanaka N, Katai H, Taniguchi H, Saka M,
Morita S, Fukagawa T and Gotoda T: Trends in characteristics of
surgically treated early gastric cancer patients after the
introduction of gastric cancer treatment guidelines in Japan.
Gastric Cancer. 13:74–77. 2010. View Article : Google Scholar : PubMed/NCBI
|
|
4
|
Kurella RR, Ancha HR, Ancha HB, Lightfoot
SA, Guild RT and Harty RF: Obscure GI bleeding due to
gastrointestinal stromal tumor (GIST) diagnosed by capsule
endoscopy. J Okla State Med Assoc. 101:35–37. 2008.PubMed/NCBI
|
|
5
|
Cheetham SW, Gruhl F, Mattick JS and
Dinger ME: Long noncoding RNAs and the genetics of cancer. Br J
Cancer. 108:2419–2425. 2013. View Article : Google Scholar : PubMed/NCBI
|
|
6
|
Mercer TR, Dinger ME and Mattick JS: Long
non-coding RNAs: Insights into functions. Nat Rev Genet.
10:155–159. 2009. View
Article : Google Scholar : PubMed/NCBI
|
|
7
|
Tsai MC, Spitale RC and Chang HY: Long
intergenic noncoding RNAs: New links in cancer progression. Cancer
Res. 71:3–7. 2011. View Article : Google Scholar : PubMed/NCBI
|
|
8
|
He Y, Meng XM, Huang C, Wu BM, Zhang L, Lv
XW and Li J: Long noncoding RNAs: Novel insights into hepatocelluar
carcinoma. Cancer Lett. 344:20–27. 2014. View Article : Google Scholar
|
|
9
|
Hung T and Chang HY: Long noncoding RNA in
genome regulation: Prospects and mechanisms. RNA Biol. 7:582–585.
2010. View Article : Google Scholar : PubMed/NCBI
|
|
10
|
Song W, Liu YY, Peng JJ, Liang HH, Chen
HY, Chen JH, He WL, Xu JB, Cai SR and He YL: Identification of
differentially expressed signatures of long non-coding RNAs
associated with different metastatic potentials in gastric cancer.
J Gastroenterol. Jun 5–2015.Epub ahead of print. PubMed/NCBI
|
|
11
|
Zhang T, Jiang M, Chen L, Niu B and Cai Y:
Prediction of gene phenotypes based on GO and KEGG pathway
enrichment scores. Biomed Res Int. 2013:8707952013.PubMed/NCBI
|
|
12
|
Livak KJ and Schmittgen TD: Analysis of
relative gene expression data using real-time quantitative PCR and
the 2(−Delta Delta C(T)) method. Methods. 25:402–408. 2001.
View Article : Google Scholar
|
|
13
|
Vu HL, Troubetzkoy S, Nguyen HH, Russell
MW and Mestecky J: A method for quantification of absolute amounts
of nucleic acids by (RT)-PCR and a new mathematical model for data
analysis. Nucleic Acids Res. 28:E182000. View Article : Google Scholar : PubMed/NCBI
|
|
14
|
Li X, Chen H, Li J and Zhang Z: Gene
function prediction with gene interaction networks: A context graph
kernel approach. IEEE Trans Inf Technol Biomed. 14:119–128. 2010.
View Article : Google Scholar
|
|
15
|
Zhao Z, Han F, Yang S, Wu J and Zhan W:
Oxamate-mediated inhibition of lactate dehydrogenase induces
protective autophagy in gastric cancer cells: Involvement of the
Akt-mTOR signaling pathway. Cancer Lett. 358:17–26. 2015.
View Article : Google Scholar
|
|
16
|
Vilkin A, Levi Z, Morgenstern S, Shmuely
H, Gal E, Hadad B, Hardi B and Niv Y: Higher gastric mucin
secretion and lower gastric acid output in first-degree relatives
of gastric cancer patients. J Clin Gastroenterol. 42:36–41. 2008.
View Article : Google Scholar
|
|
17
|
Li H, Yu B, Li J, Su L, Yan M, Zhang J, Li
C, Zhu Z and Liu B: Characterization of differentially expressed
genes involved in pathways associated with gastric cancer. PLoS
One. 10:e01250132015. View Article : Google Scholar : PubMed/NCBI
|
|
18
|
Carlson MR, Zhang B, Fang Z, Mischel PS,
Horvath S and Nelson SF: Gene connectivity, function, and sequence
conservation: Predictions from modular yeast co-expression
networks. BMC Genomics. 7:402006. View Article : Google Scholar : PubMed/NCBI
|
|
19
|
Songun I, Putter H, Kranenbarg EM, Sasako
M and van de Velde CJ: Surgical treatment of gastric cancer:
15-year follow-up results of the randomised nationwide Dutch D1D2
trial. Lancet Oncol. 11:439–449. 2010. View Article : Google Scholar : PubMed/NCBI
|
|
20
|
Cho JY: Molecular diagnosis for
personalized target therapy in gastric cancer. J Gastric Cancer.
13:129–135. 2013. View Article : Google Scholar : PubMed/NCBI
|
|
21
|
Cogill SB and Wang L: Co-expression
network analysis of human lncRNAs and cancer genes. Cancer Inform.
13(Suppl 5): 49–59. 2014.PubMed/NCBI
|
|
22
|
Wang YY, Ye ZY, Zhao ZS, Tao HQ and Li SG:
Systems biology approach to identification of biomarkers for
metastatic progression in gastric cancer. J Cancer Res Clin Oncol.
136:135–141. 2010. View Article : Google Scholar
|
|
23
|
Charvat H, Sasazuki S, Inoue M, Iwasaki M,
Sawada N, Shimazu T and Yamaji T: Prediction of the 10-year
probability of gastric cancer occurrence in the Japanese
population: The JPHC study cohort II. Int J Cancer. Jul 28–2015.
View Article : Google Scholar : Epub ahead of print.
PubMed/NCBI
|
|
24
|
Song H, Ekheden IG, Zheng Z, Ericsson J,
Nyrén O and Ye W: Incidence of gastric cancer among patients with
gastric precancerous lesions: Observational cohort study in a low
risk Western population. BMJ. 351:h38672015. View Article : Google Scholar : PubMed/NCBI
|
|
25
|
Li M, Qiu M, Xu Y, Mao Q, Wang J, Dong G,
Xia W, Yin R and Xu L: Differentially expressed protein-coding
genes and long noncoding RNA in early-stage lung cancer. Tumour
Biol. Jul 16–2015.Epub ahead of print.
|
|
26
|
Chen X, Sun J, Song Y, Gao P, Zhao J,
Huang X, Liu B, Xu H and Wang Z: The novel long noncoding RNA
AC138128.1 may be a predictive biomarker in gastric cancer. Med
Oncol. 31:2622014. View Article : Google Scholar : PubMed/NCBI
|
|
27
|
Mizrahi I, Mazeh H, Grinbaum R, Beglaibter
N, Wilschanski M, Pavlov V, Adileh M, Stojadinovic A, Avital I,
Gure AO, et al: Colon cancer associated transcript-1 (CCAT1)
expression in adenocarcinoma of the stomach. J Cancer. 6:105–110.
2015. View Article : Google Scholar : PubMed/NCBI
|
|
28
|
Zhuang M, Gao W, Xu J, Wang P and Shu Y:
The long non-coding RNA H19-derived miR-675 modulates human gastric
cancer cell proliferation by targeting tumor suppressor RUNX1.
Biochem Biophys Res Commun. 448:315–322. 2014. View Article : Google Scholar : PubMed/NCBI
|
|
29
|
Pan W, Liu L, Wei J, Ge Y, zhang J, Chen
H, Zhou L, Yuan Q, Zhou C and Yang M: A functional lncRNA HOTAIR
genetic variant contributes to gastric cancer susceptibility. Mol
Carcinog. Jan 3–2015. View
Article : Google Scholar : Epub ahead of print.
PubMed/NCBI
|
|
30
|
Sun M, Xia R, Jin F, Xu T, Liu Z, De W and
Liu X: Downregulated long noncoding RNA MEG3 is associated with
poor prognosis and promotes cell proliferation in gastric cancer.
Tumour Biol. 35:1065–1073. 2014. View Article : Google Scholar
|
|
31
|
Li PF, Chen SC, Xia T, Jiang XM, Shao YF,
Xiao BX and Guo JM: Non-coding RNAs and gastric cancer. World J
Gastroenterol. 20:5411–5419. 2014. View Article : Google Scholar : PubMed/NCBI
|
|
32
|
Niland CN, Merry CR and Khalil AM:
Emerging roles for long Non-Coding RNAs in cancer and neurological
disorders. Front Genet. 3:252012. View Article : Google Scholar : PubMed/NCBI
|
|
33
|
Zhang H, Chen Z, Wang X, Huang Z, He Z and
Chen Y: Long non-coding RNA: A new player in cancer. J Hematol
Oncol. 6:372013. View Article : Google Scholar : PubMed/NCBI
|
|
34
|
Wang J, Song YX and Wang ZN: Non-coding
RNAs in gastric cancer. Gene. 560:1–8. 2015. View Article : Google Scholar : PubMed/NCBI
|
|
35
|
Wu XM, Shao XQ, Meng XX, Zhang XN, Zhu L,
Liu SX, Lin J and Xiao HS: Genome-wide analysis of microRNA and
mRNA expression signatures in hydroxycamptothecin-resistant gastric
cancer cells. Acta Pharmacol Sin. 32:259–269. 2011. View Article : Google Scholar : PubMed/NCBI
|
|
36
|
Chen Z, Zhang L, Xia L, Jin Y, Wu Q, Guo
H, Shang X, Dou J, Wu K, Nie Y, et al: Genomic analysis of drug
resistant gastric cancer cell lines by combining mRNA and microRNA
expression profiling. Cancer Lett. 350:43–51. 2014. View Article : Google Scholar : PubMed/NCBI
|
|
37
|
Fan H, Guo Z and Wang C: Combinations of
gene ontology and pathway characterize and predict prognosis genes
for recurrence of gastric cancer after surgery. DNA Cell Biol.
34:579–587. 2015. View Article : Google Scholar : PubMed/NCBI
|
|
38
|
Zhu YP, Bian XJ, Ye DW, Yao XD, Zhang SL,
Dai B, Zhang HL and Shen YJ: Long noncoding RNA expression
signatures of bladder cancer revealed by microarray. Oncol Lett.
7:1197–1202. 2014.PubMed/NCBI
|
|
39
|
Pujana MA, Han JD, Starita LM, Stevens KN,
Tewari M, Ahn JS, Rennert G, Moreno V, Kirchhoff T, Gold B, et al:
Network modeling links breast cancer susceptibility and centrosome
dysfunction. Nat Genet. 39:1338–1349. 2007. View Article : Google Scholar : PubMed/NCBI
|
|
40
|
Wang Y, Chen W, Yang C, Wu W, Wu S, Qin X
and Li X: Long non-coding RNA UCA1a(CUDR) promotes proliferation
and tumorigenesis of bladder cancer. Int J Oncol. 41:276–284.
2012.PubMed/NCBI
|
|
41
|
Yan J, Guo X, Xia J, Shan T, Gu C, Liang
Z, Zhao W and Jin S: MiR-148a regulates MEG3 in gastric cancer by
targeting DNA methyltransferase 1. Med Oncol. 31:8792014.
View Article : Google Scholar : PubMed/NCBI
|
|
42
|
Zheng Q, Wu F, Dai WY, Zheng DC, Zheng C,
Ye H, Zhou B, Chen JJ and Chen P: Aberrant expression of UCA1 in
gastric cancer and its clinical significance. Clin Transl Oncol.
17:640–646. 2015. View Article : Google Scholar : PubMed/NCBI
|