Introduction
Ovarian cancer is the ninth most common cancer among
women and the fifth leading cause of cancer-related death among
women with recent statistics suggesting that 1 in 71 women will
develop ovarian cancer (1,2). Approximately 70% of ovarian cancer
cases are diagnosed at a late stage and therefore are poorly
treatable (3). Although the current
standard treatment for ovarian cancer involving the use of
paclitaxel and carboplatin after aggressive surgical cytoreduction
usually results in multiyear survival, prolonged use of
platinum-based chemotherapy often induces drug resistance, which
causes ovarian cancer relapse and eventually the death of patients
(4). Such knowledge may translate
into the development of new targeted strategies. In addition, since
ovarian cancer is considered to be a heterogeneous group of
diseases with distinct gene expression profiles, it is likely that
the focus should be towards the development of new targeted
therapies capable of exploiting the molecular and genetic
characteristics of ovarian cancer (5). Therefore, it is necessary to
understand the pathogenesis of ovarian cancer by dissecting the
components involved in the pathogenic procedure, i.e. pathogenic
genes.
The pathogenic genes can be identified in the
laboratory by techniques, such as gene knockout or silencing,
however, the pathogenic gene list is far from complete and it is a
painful process to identify pathogenic genes in the laboratory
considering the genome size and time-consuming experiments
(6). In contrast, computational
methods can provide alternative strategies for this issue, for
instance, high throughput techniques. Traditionally, studies tend
to regard differentially expressed genes (DEGs) between normal and
disease samples as biomarkers and pathogenic genes, but, DEGs alone
may lead to false positives while identifying key genes involved in
disease procedure since some genes are not involved in the pathway
of pathogenic genes even though they show significant expression
change (7). In the meantime,
studies have shown that the most significant genes obtained from
different studies for a particular cancer are typically
inconsistent (8). To overcome this
issue, one could evaluate pathogenic genes for disease-association
using a network strategy (9).
5-Aza-2′-deoxycytidine (decitabine) is a prodrug
that requires metabolic activation by deoxycytidine kinase, an
active inhibitor in the triphosphate form (10). DNA polymerase catalyzes the
insertion of the phosphorylated form of decitabine into DNA, and
the presence of decitabine in place of the 5-methylcytosine in DNA
leads to the inactivation of DNA methyltransferase inducing a
re-expression of the silenced genes (11). It has been demonstrated that
decitabine produces variable antitumor response rates in patients
with solid tumors that may be leveraged clinically with
identification of a predictive biomarker (12). For instance, decitabine is an
effective therapy for myelodysplastic syndromes (MDS) and for acute
myeloid leukemia (AML) (13).
Moreover, its role in the treatment of ovarian cancer has been
defined in regards to the fact that epigenetic therapy upregulates
the expression of imprinted tumor suppressors (14). Hence, more and more research has
focused on ovarian cancer treatment with decitabine, while the
molecular mechanisms of this drug remain unclear.
Therefore, in the present study, we employed a
network approach to predict key genes which are potentially
silenced genes for ovarian cancer before and after treatment with
decitabine. The network approach was based on a pathogenic network
that derived from a protein-protein interaction (PPI) network, DEGs
and known pathogenic genes (seed genes), to identify candidate
genes and silenced genes. Subsequently, topological properties and
pathway enrichment analysis were performed for candidate genes. By
combining weight values and topological properties of candidate
genes and silenced genes before and after treatment with
decitabine, we obtained key genes and validated key genes by
reverse transcriptase-polymerase chain reaction (RT-PCR)
assays.
Materials and methods
Gene expression data
In the present study, the microarray gene expression
profile of ovarian cancer with accession no. E-GEoD-25429 (15) was downloaded from ArrayExpress
database. E-GEOD-25429 was comprised of 91 samples (4 normal
controls, 43 ovarian cancer samples and 41 ovarian cancer samples
treated with decitabine), and deposited on two platforms,
A-AFFY-44-Affymetrix GeneChip Human Genome U133 Plus 2.0
[HG-U133_Plus_2] and A-AFFY-113-Affymetrix GeneChip HT human Genome
U133A [HT_HG-u133A]. When mapping the probes to genes according to
the platforms, a total of 20,107 and 12,494 genes were obtained,
respectively. To avoid batch effects from the different platforms,
we took the intersections of two platforms as the gene expression
profile which consisted of 12,493 genes for further analysis.
Detection of DEGs
To determine expression changes between normal
controls and ovarian cancer before and after treatment with
decitabine while accounting for the enormous number of genes,
Significance Analysis of Microarrays (SAM) (16), which assigns a score to each gene on
the basis of the change in gene expression relative to the standard
deviation of repeated measurements, was utilized in the present
study. We divided the samples into two conditions, condition 1
(normal controls vs. ovarian cancer before treatment) and condition
2 (normal controls vs. ovarian cancer after treatment with
decitabine). By conducting a set of gene-specific t-tests
among two conditions, genes with statistically significant changes
in expression were identified based on SAM. Taking condition 1 as
an example, the relative difference d(i) in gene
expression was defined as following:
are defined as the average levels of expression for gene i
in normal and ovarian cancer, respectively. s(i) is
the standard deviation of repeated expression measurements. The
value for s0 was chosen to minimize the
coefficient of variation.
To identify significant differentially expressed
genes further, genes were ranked in descending order of
d(i) values, so that d(1) was the largest relative difference,
d(2) was the second largest
relative difference, and d(i) was the ith
largest relative difference. Meanwhile dt(i) was the
ith largest relative difference for permutation t.
The expected relative difference, dE(i),
was defined as the average over all permutations,
dE(i) = (∑t dt(i))/n. For
the vast majority of genes, d(i) ≌
dE(i), but some genes were represented by
points displaced from the d(i) =
dE(i) line by a distance greater than a
threshold Δ. As Δ decreased, the number of genes called significant
by SAM increased, the Δ value for condition 1 and condition 2 was
3.600 and 3.436, separately.
Identification of pathogenic network
There are some genes that have been identified as
pathogenic genes of ovarian cancer in Online Mendelian Inheritance
in Man (OMIM) database, an online catalog of human genes and
genetic disorders (17). In the
present study, a total of 87 genes were found, which were also
called as known pathogenic genes. Taking the intersection with the
gene expression profile, we obtained 82 intersected genes and
defined them as seed genes (Table
I).
 | Table ISeed genes of ovarian cancer. |
Table I
Seed genes of ovarian cancer.
| ID | Gene | ID | Gene | ID | Gene | ID | Gene |
|---|
| 1 | MUC1 | 22 |
TNFRSF1B | 43 | SERBP1 | 64 | CLIC4 |
| 2 | TPM3 | 23 | RASAL2 | 44 | VCAM1 | 65 | RNASEL |
| 3 | UCHL5 | 24 | PEA15 | 45 | GADD45A | 66 | EPHA2 |
| 4 | MDM4 | 25 | CHI3L1 | 46 | CD34 | 67 | MASP2 |
| 5 | TP73 | 26 |
SELENBP1 | 47 | NTRK1 | 68 | HSD3B2 |
| 6 | SHC1 | 27 | RWDD3 | 48 | CRP | 69 | HSD3B1 |
| 7 | MTHFR | 28 | RUNX3 | 49 | WNT2B | 70 | PARP1 |
| 8 | PBX1 | 29 | NASP | 50 | KCNH1 | 71 | ASPM |
| 9 | EXO1 | 30 | RAD54L | 51 | EFNA1 | 72 | JUN |
| 10 | AKT3 | 31 | IKBKE | 52 | ROR1 | 73 | SLC2A1 |
| 11 | FGR | 32 | BCL10 | 53 | FCN3 | 74 | RAB25 |
| 12 | VTCN1 | 33 | DPYD | 54 | FASLG | 75 | CHD5 |
| 13 | DESI2 | 34 | PTGS2 | 55 | HDAC1 | 76 | NES |
| 14 | COL11A1 | 35 | PTAFR | 56 | IL10 | 77 | SFN |
| 15 | MTOR | 36 | CD247 | 57 | LPAR3 | 78 | TACSTD2 |
| 16 | KIF14 | 37 | NGF | 58 | LIN28A | 79 | S100A6 |
| 17 | THEMIS2 | 38 | PRDX1 | 59 | S100A4 | 80 | PRDX6 |
| 18 | GSTM1 | 39 | DVL1 | 60 | YBX1 | 81 | LAMTOR5 |
| 19 | E2F2 | 40 | MCL1 | 61 | KISS1 | 82 | MLLT11 |
| 20 | ADSS | 41 | F3 | 62 | DIRAS3 | | |
| 21 | KCNK2 | 42 | EPHX1 | 63 | TGFB2 | | |
Meanwhile, we recruited human PPI from the Search
Tool for the Retrieval of Interacting Genes/Proteins (STRING)
(18), and interactions with score
>0.5 were kept as the background PPI network. Subsequently, a
network was extracted from the background PPI network that included
genes that interacted with seed genes, where the genes were further
required to be DEGs of ovarian cancer before (condition 1) and
after (condition 2) treatment with decitabine. Therefore, genes in
the sub-network were more possibly pathogenic genes. Furthermore, a
smaller sub-network that consisted of genes interacting with at
least two seed genes was extracted from the previous network and
were regarded as the pathogenic network, where the genes in the
pathogenic network were believed to be correlated to
pathogenesis.
Ranking of the pathogenic genes
To facilitate the biologists to select more
confident pathogenic genes from our predictions, each gene was
assigned a weight value based on the interactions and co-expression
with seed genes, where a gene was more confident to be a pathogenic
gene if it interacted and was co-expressed with more seed genes
(6). The co-expression was
evaluated by Pearson correlation coefficients (PCC) (19) between our predicted pathogenic and
seed genes. The weight for gene x, W(x), was
calculated as following:
where S is the set of seed genes, PCC(x,
y) is the correlation coefficient between gene x and
gene y, and I(x, y) is an indication
function, where I(x, y) = 1 if protein
x interacted with protein y and I(x,
y) = 0 otherwise. The weight of each predicted pathogenic
gene could illustrate the correlation between this gene and the
seed genes. The higher the weight of one gene, the more possible
the gene was involved in the pathogenic procedure. In addition, we
defined the potential pathogenic genes not seed genes as candidate
genes of ovarian cancer.
Properties of the pathogenic network
For the purpose of investigating the possible roles
of candidate genes, topological properties of nodes in the
pathogenic network were explored, including degree, betweenness,
closeness and stress. For an undirected network G =
(V, E), where V is the set of vertices
representing nodes in the network, and E is the set of edges
representing the relationships between the actors. A path from node
s to t was defined as a sequence of edges and the
length of a path was the sum of the weights of edges. We used
d(s, t) to denote the distance between
s and t (the minimum length of any path connecting
s and t in G). Let us denote the total number
of shortest paths between vertices s and t by
σst, and the number passing through node v
by σst(v).
Degree
Degree is a simple local measure, based on the
notion of neighborhood. It quantifies the local topology of each
gene by summing up the number of its adjacent genes (20). The degree D(v) of a
node v was defined as:
Betweenness centrality
Betweenness centrality,
CB(v), is a shortest paths
enumeration-based metric in graphs for determining how the
neighbors of a node are interconnected, and is considered as the
ratio of the node in the shortest path between two other nodes
(21), in consequence
CB(v) ϵ [0, 1]. It was calculated as
follows:
Closeness centrality
Closeness centrality,
Cc(v), is a measure of the average length
of the shortest paths to access all other proteins in the network
(22). It was defined as the
reciprocal of the average shortest path length:
Stress
This index computes the number of nodes in the
shortest path between two other nodes (23). If a node was stressed, it would be
traversed by a high number of shortest paths. The stress,
Cs(v) was defined as:
Pathway enrichment analysis of candidate
genes
Kyoto Encyclopedia of Genes and Genomes (KEGG)
pathway enrichment analysis for candidate and seed genes were
performed based on the Database for Annotation, visualization and
integrated Discovery (DAVID) (24).
In addition, pathways which met the criterion P<0.01 were
selected according to Expression Analysis Systematic Explorer
(EASE) test implemented in DAVID (25). The calculating formula of EASE is
shown as follows:
Of which a = a′ − 1, a′ is the
gene number of one gene set in the gene lists; a′ + b
is the number of genes in the gene list including at least one gene
set; a′ + c is the gene number of one gene list in
the background genes; n = a′ + b + c +
d is the number of background genes in EASE.
Validation of candidate genes by
RT-PCR
RT-PCR assays were carried out to validate key
genes. Total RNA was prepared from ovarian cancer cell line A2780
before and after treatment of decitabine, and 10 ovarian cancer
patient tissues using TRIzol reagent (invitrogen, Carlsbad, CA,
USA). In the present study, ovarian cancer cell line A2780 was
kindly provided by the Cancer Center, Qilu Hospital of Shandong
University (Jinan, China). Cells were cultivated in Dulbecco's
modified Eagle's medium (DMEM)/F-12 containing 10% fetal bovine
serum (FBS) (Gibco Life Technologies, Carlsbad, CA, USA), and
antibiotics (100 U/ml penicillin G, 100 µg/ml streptomycin)
and 250 ng/ml fungizone (Roth, Karlsruhe, Germany) at 37°C in a
humidified incubator with 5% CO2 atmosphere (Shanghai
Sumsung Experimental Instrument Co., Ltd., Shanghai, China). When
the cultures reached confluency (6 days), the cells were treated
with 0.05% trypsin/1 mM EDTA for 5 min at 37°C. Subsequently, the
cell suspension was diluted with DMEM/F-12 supplemented with 10%
FBS to a concentration of 2×10⁵ cells/ml, and plated in
12-well culture plates (1 ml/well). Culture medium was changed
after 24 h and then every 3 days. Before performing related
analyses, the cell lines were cultured by decitabine (5
µmol) for 4 h.
For cDNA synthesis, RNA was treated with
oligo(dT)18 primers (Invitrogen), 2 µl RNasin (40
U/µl), 8.0 µl 5X reverse transcriptase buffer, 8.0
µl dNTPs and 2 µl AMV reverse transcriptase (5
U/µl). The reactions were incubated for 1 h at 42°C, 15 min
at 70°C, and adjusted to a final volume of 50 µl. The data
were normalized to β-actin reference. PIK3R2, CCNB1,
IL2, IL1B and CDC6 were taken as examples to
conduct RT-PCR validated assays and their primer sequences are
listed in Table II.
| Table IIPrimer sequences for the five genes
validated by RT-PCR. |
Table II
Primer sequences for the five genes
validated by RT-PCR.
| Gene | Primers (5′-3′)
| Length (bp) |
|---|
| Forward | Reverse |
|---|
| PIK3R2 |
ATGGCACCTTCCTAGTCCGAGA |
CTCTGAGAAGCCATAGTGCCCA | 127 |
| CCNB1 |
GACCTGTGTCAGGCTTTCTCTG |
GGTATTTTGGTCTGACTGCTTGC | 120 |
| IL2 |
AGAACTCAAACCTCTGGAGGAAG |
GCTGTCTCATCAGCATATTCACAC | 152 |
| IL1B |
TCAGCATTAACATGCGTGCTTTCC |
CTTTATATCCTATGAATGAGCCATCTG | 104 |
| CDC6 |
CAGTAGACACAAAACAGGCTCAG |
TGTCGGATCTCCCTCACCAATG | 123 |
| β-actin |
CTCCATCCTGGCCTCGCTGT |
GCTGTCACCTTCACCGTTCC | 268 |
For PCR amplification, the mix contained 10
µl of 10X PCR buffer I, 1 µl of Taq DNA
polymerase (both from Invitrogen), 3 µl of each forward and
reverse primer and 8 µl of dNTPs. Conditions were as
follows: 5 min at 95°C for pre-denaturation, followed by 35 cycles
of 60 sec at 94°C, 30 sec at 55°C and 30 sec at 72°C, and a final
10-min extension at 72°C. Three replicates of the assay within or
between runs were performed to assess reproducibility. Products of
the PCR experiment were analyzed by 1.5% agarose gel
electrophoresis and Quantity One software using a gel imaging
analyzer (Bio-Rad, Hercules, CA, USA).
Results
Detection of DEGs
Prior to the study of the DEGs between the normal
controls and ovarian cancer before and after treatment with
decitabine and investigation of significant genes in ovarian
cancer, we designated two conditions, condition 1 (normal controls
vs. ovarian cancer before treatment) and condition 2 (normal
controls vs. ovarian cancer after treatment with decitabine), or in
other words, condition 1 was the before treatment group and
condition 2 was the after treatment group. A total of 850 and 667
DEGs were obtained from the two conditions based on SAM with
Δ=3.600 and 3.436, separately.
Identification of the pathogenic
network
In the present study, interactions in the STRING
database with a score >0.5 were kept as the background PPI
network. With known pathogenic genes as seed genes, a network was
extracted from the background PPI network, where the genes
interacted with at least one seed gene. Although the genes
interacting with seed genes were possibly pathogenic genes, they
may also just interact with seed genes to maintain the essential
biological processes for ovarian cancer. Therefore, the integration
of DEGs and the network identified above helped to reduce false
positives since it was believed that the expression changes of DEGs
were possibly caused by the interactions with seed genes.
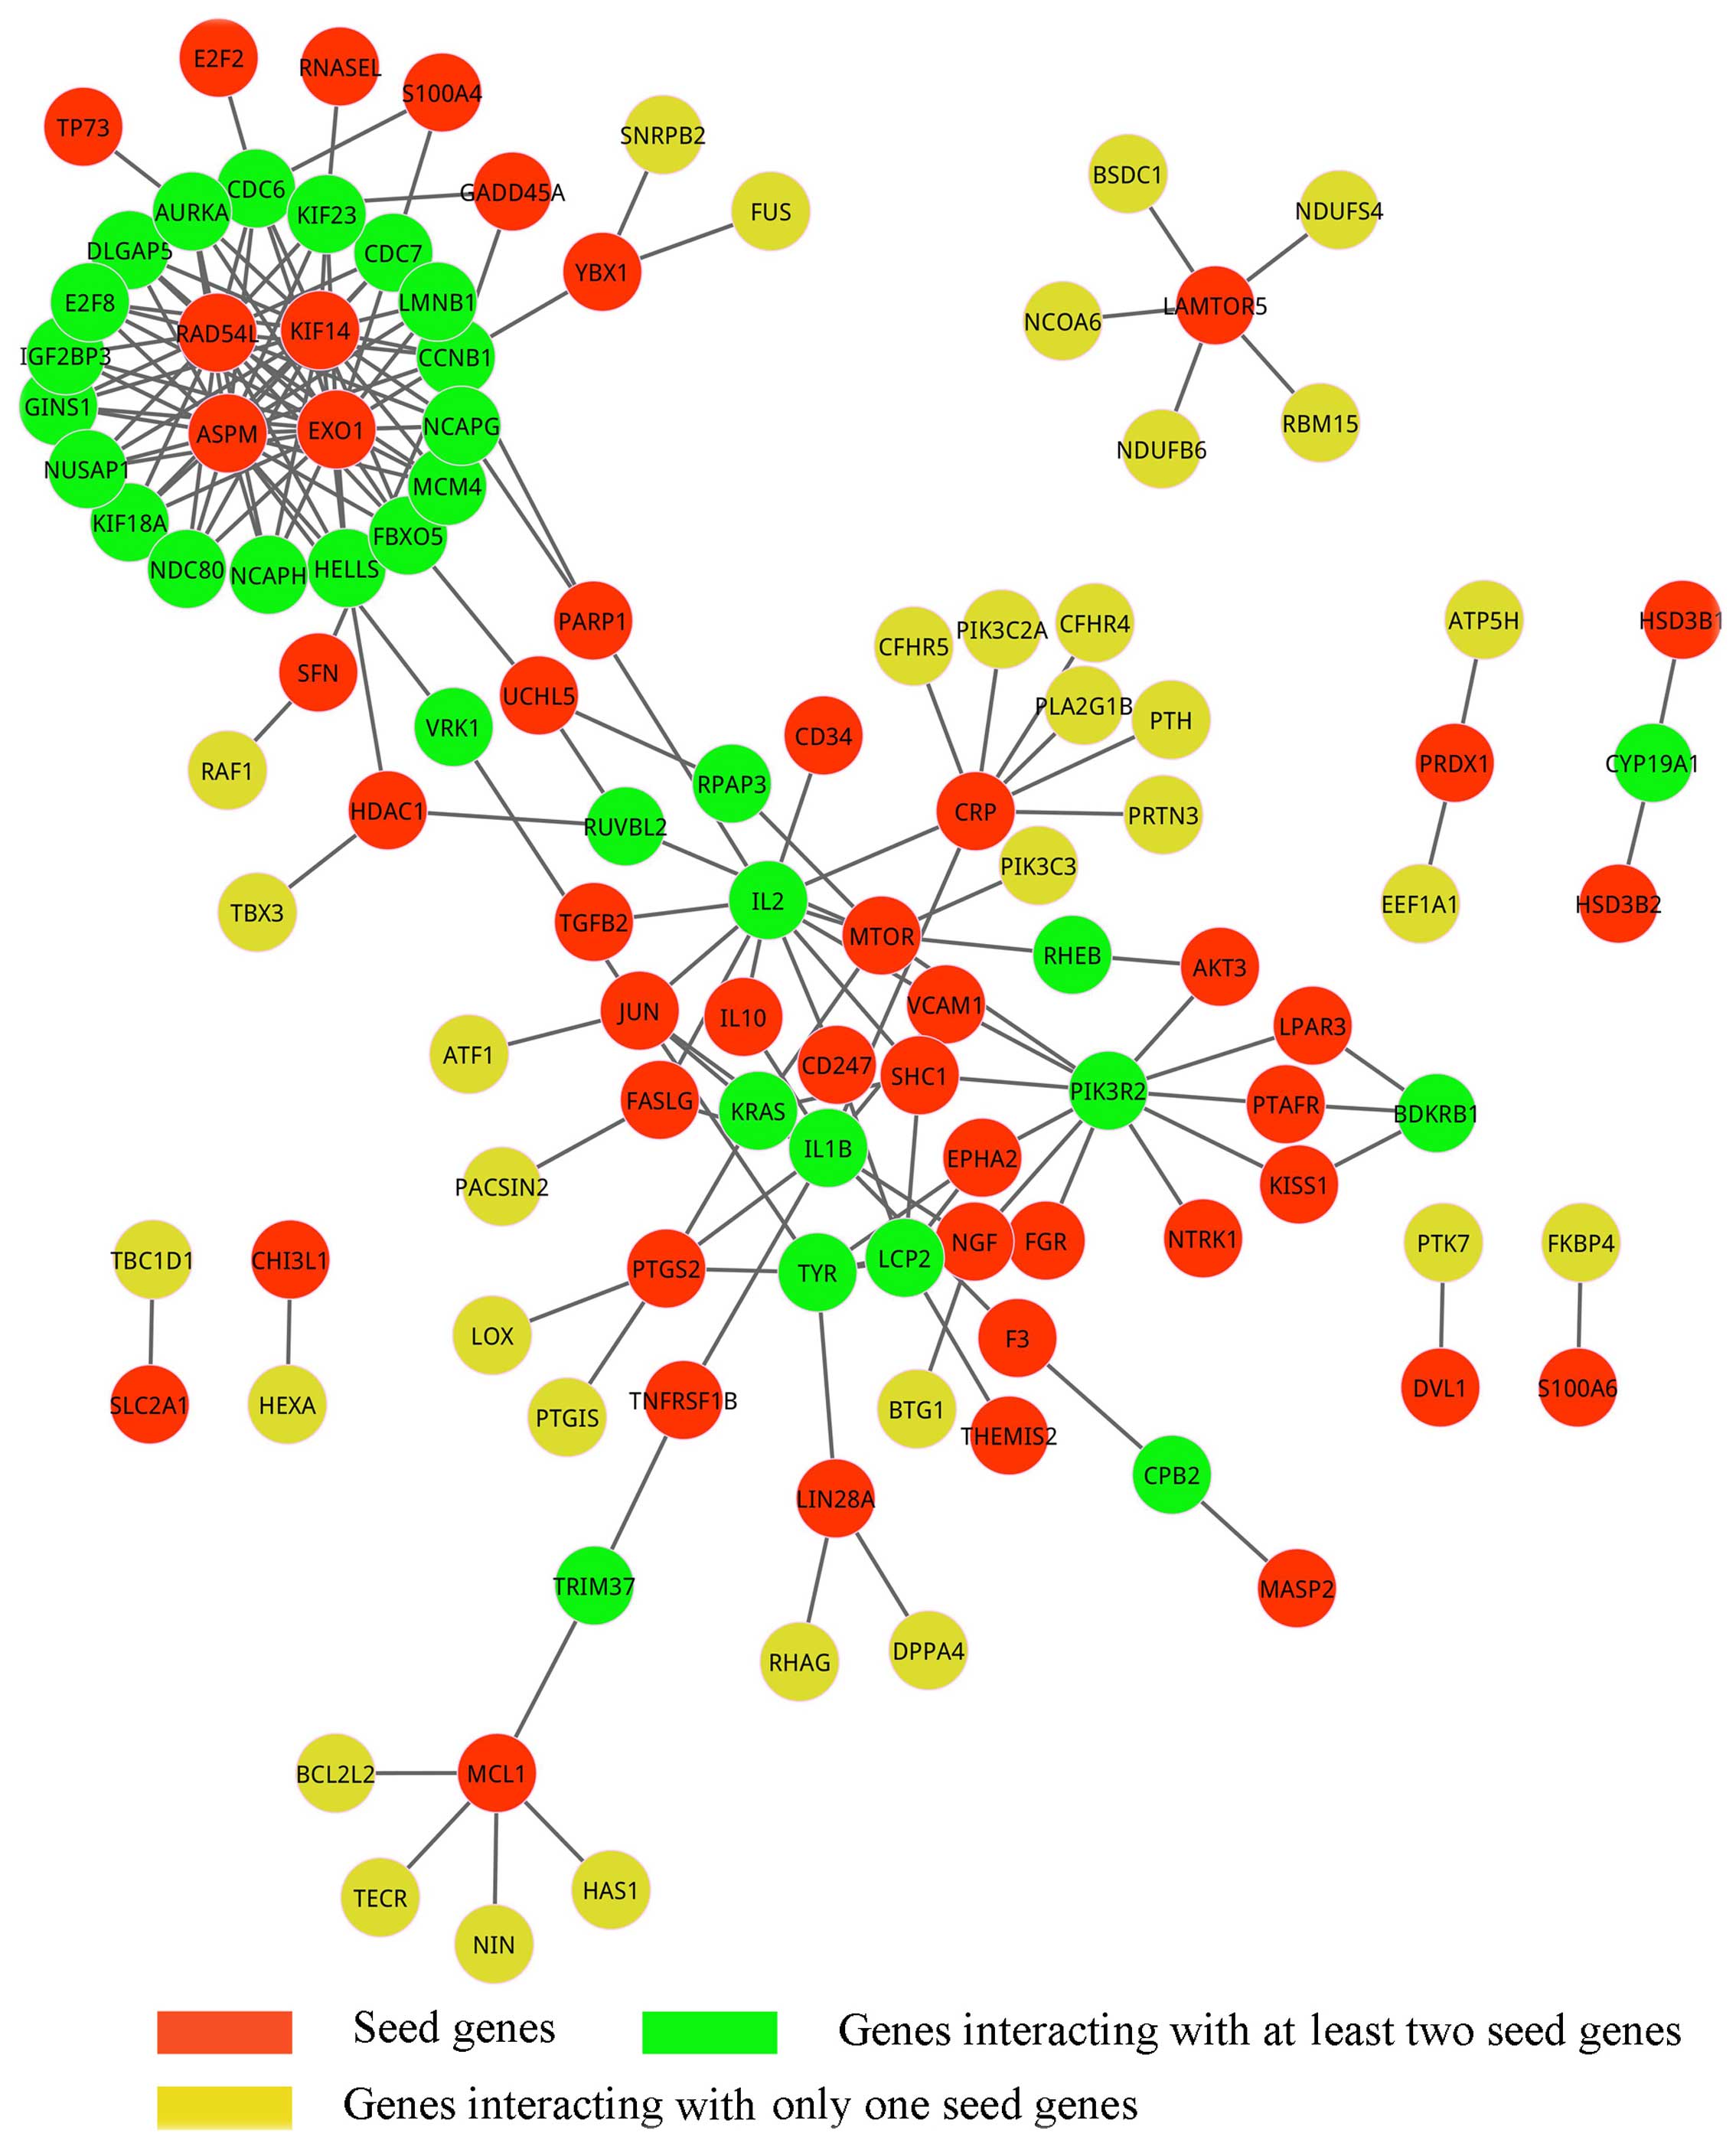
By mapping DEGs from condition 1 to the network
extracted from background PPI network of ovarian cancer before
treatment, we finally obtained a sub-network that consisted of 65
genes except 47 seed genes and 180 interactions which linked to at
least one seed gene (Fig. 1).
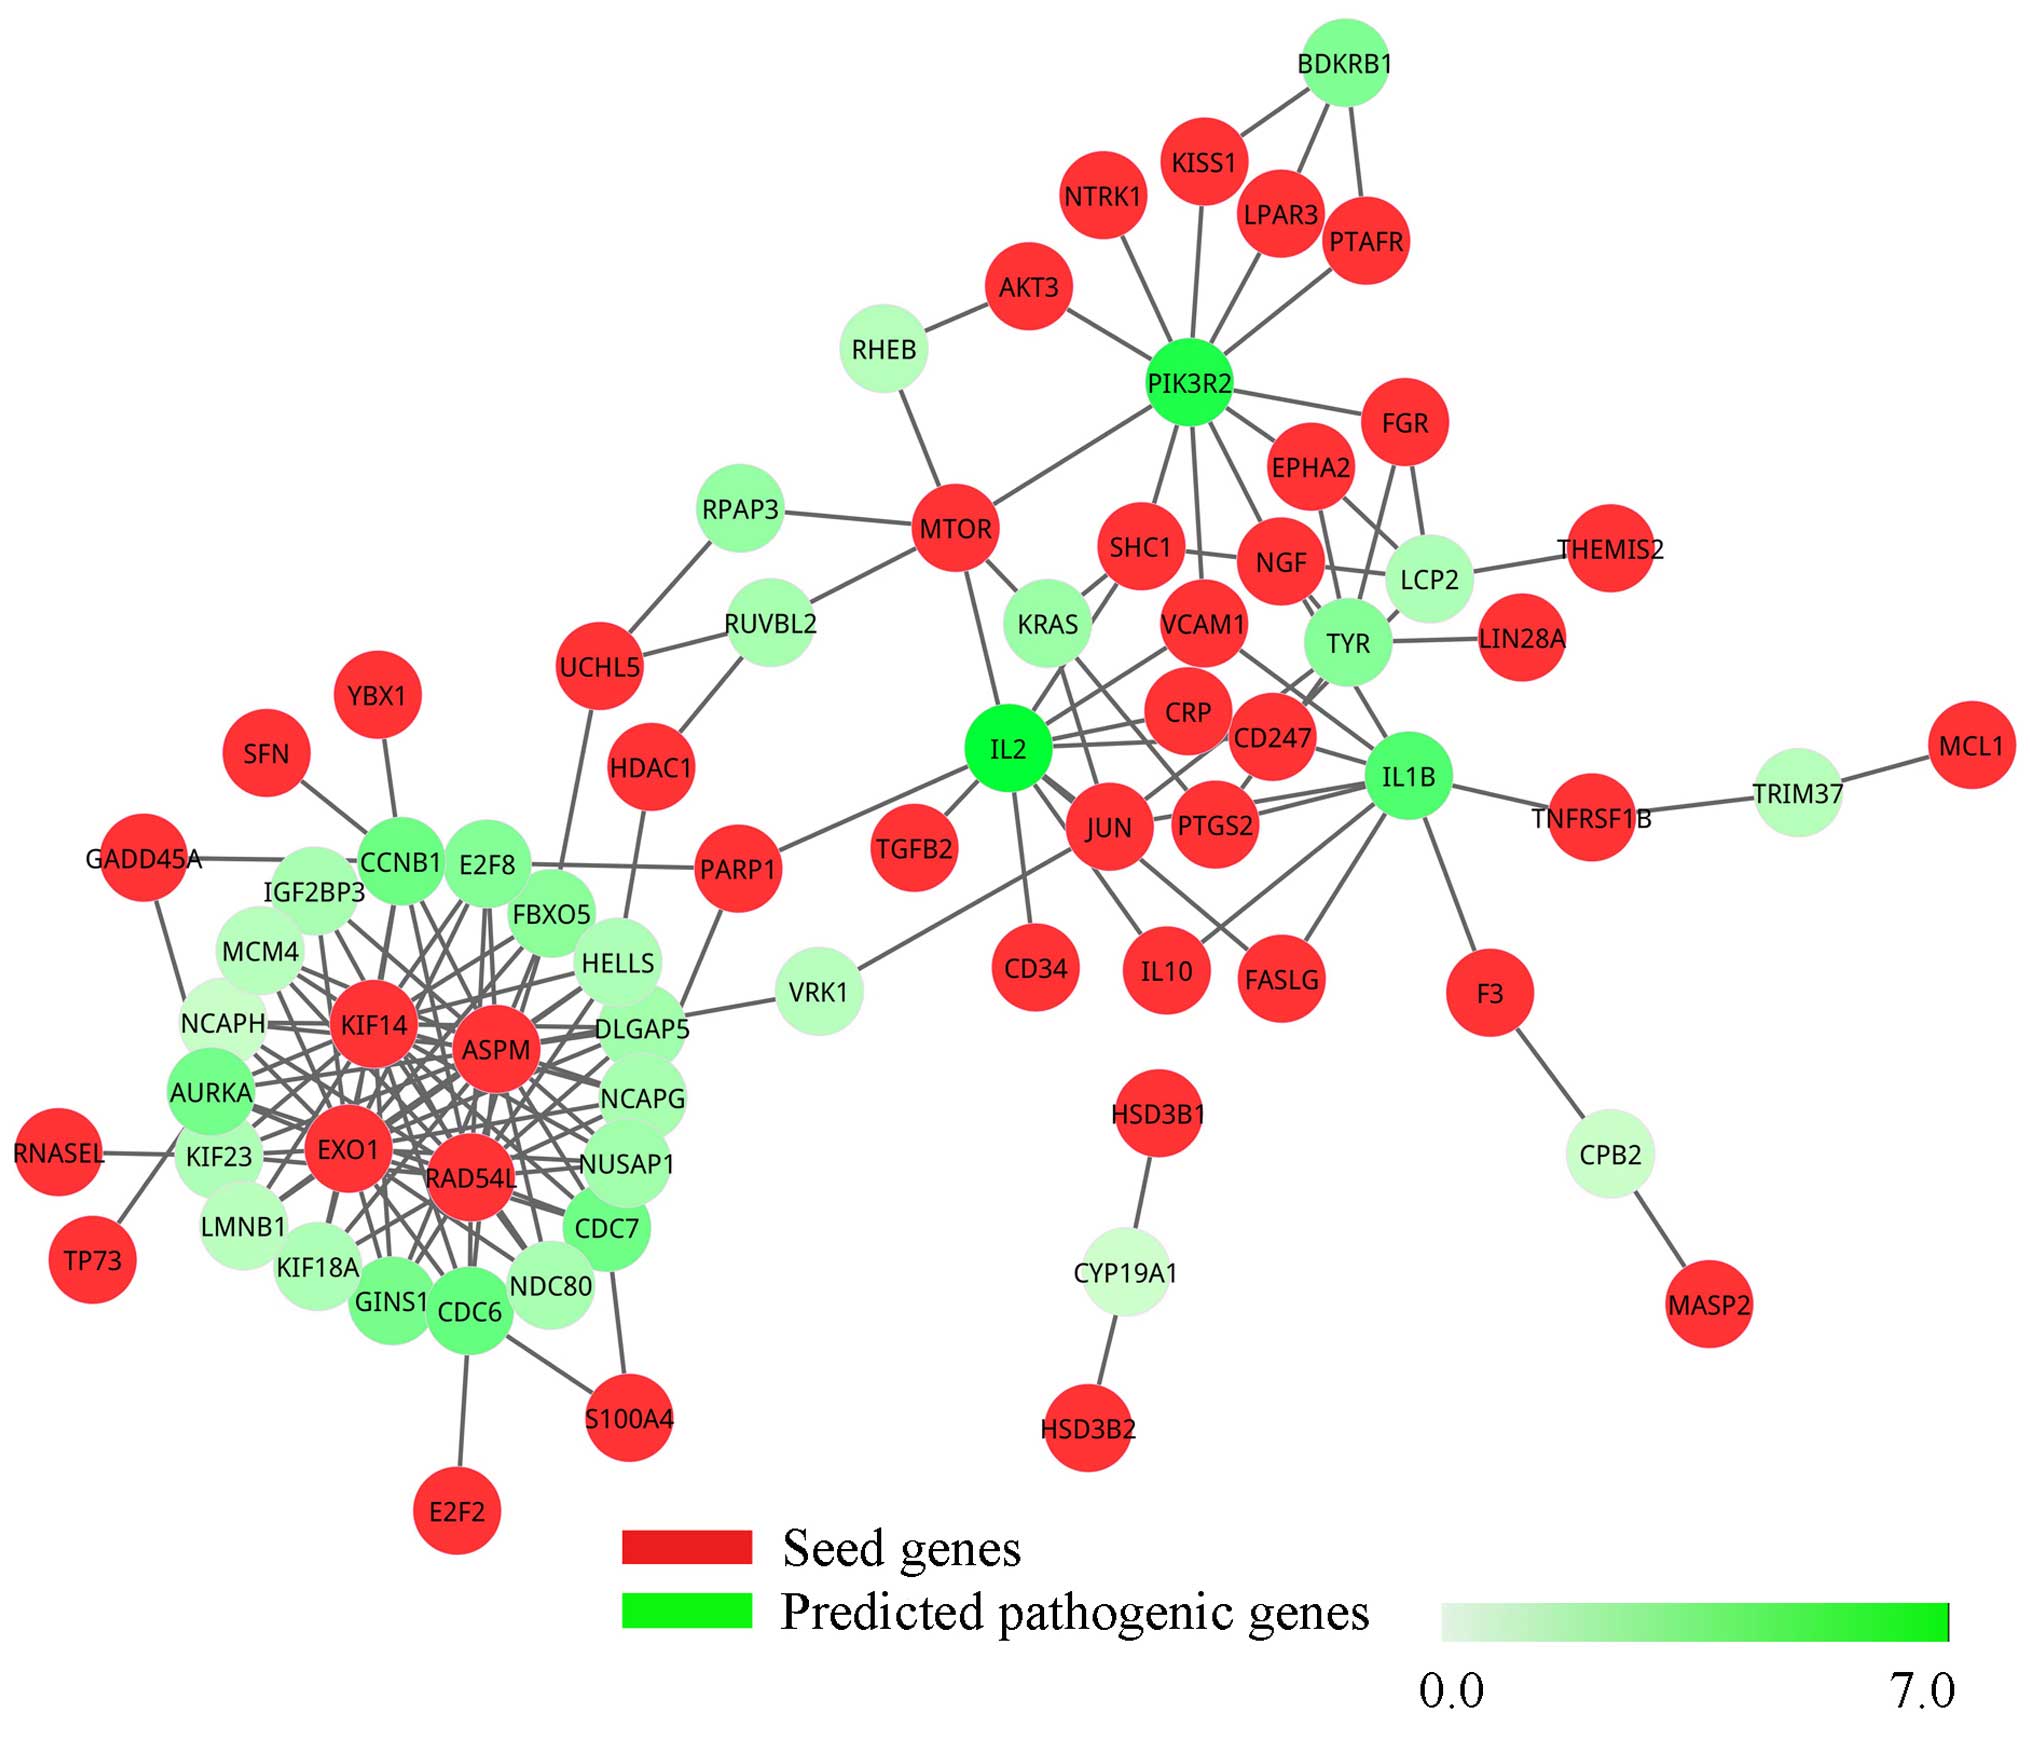
Furthermore, the genes that interacted with at least two seed genes
were identified since these genes are more likely to be pathogenic
genes due to their tight interactions with seed genes. As a result,
147 interactions were investigated to connect to at least two seed
genes, and their interactions involved 73 genes in total, of which
41 were seed genes and the others were candidate genes; the
sub-network is shown in Fig. 2 and
is called pathogenic network. Notably, we found that four seed
genes, KIF14, ASPM, EXO1 and RAD54L,
interacted with each other and formed a clique. Therefore, these
four seed genes may belong to the same complex or pathway that is
involved in the pathogenic procedure.
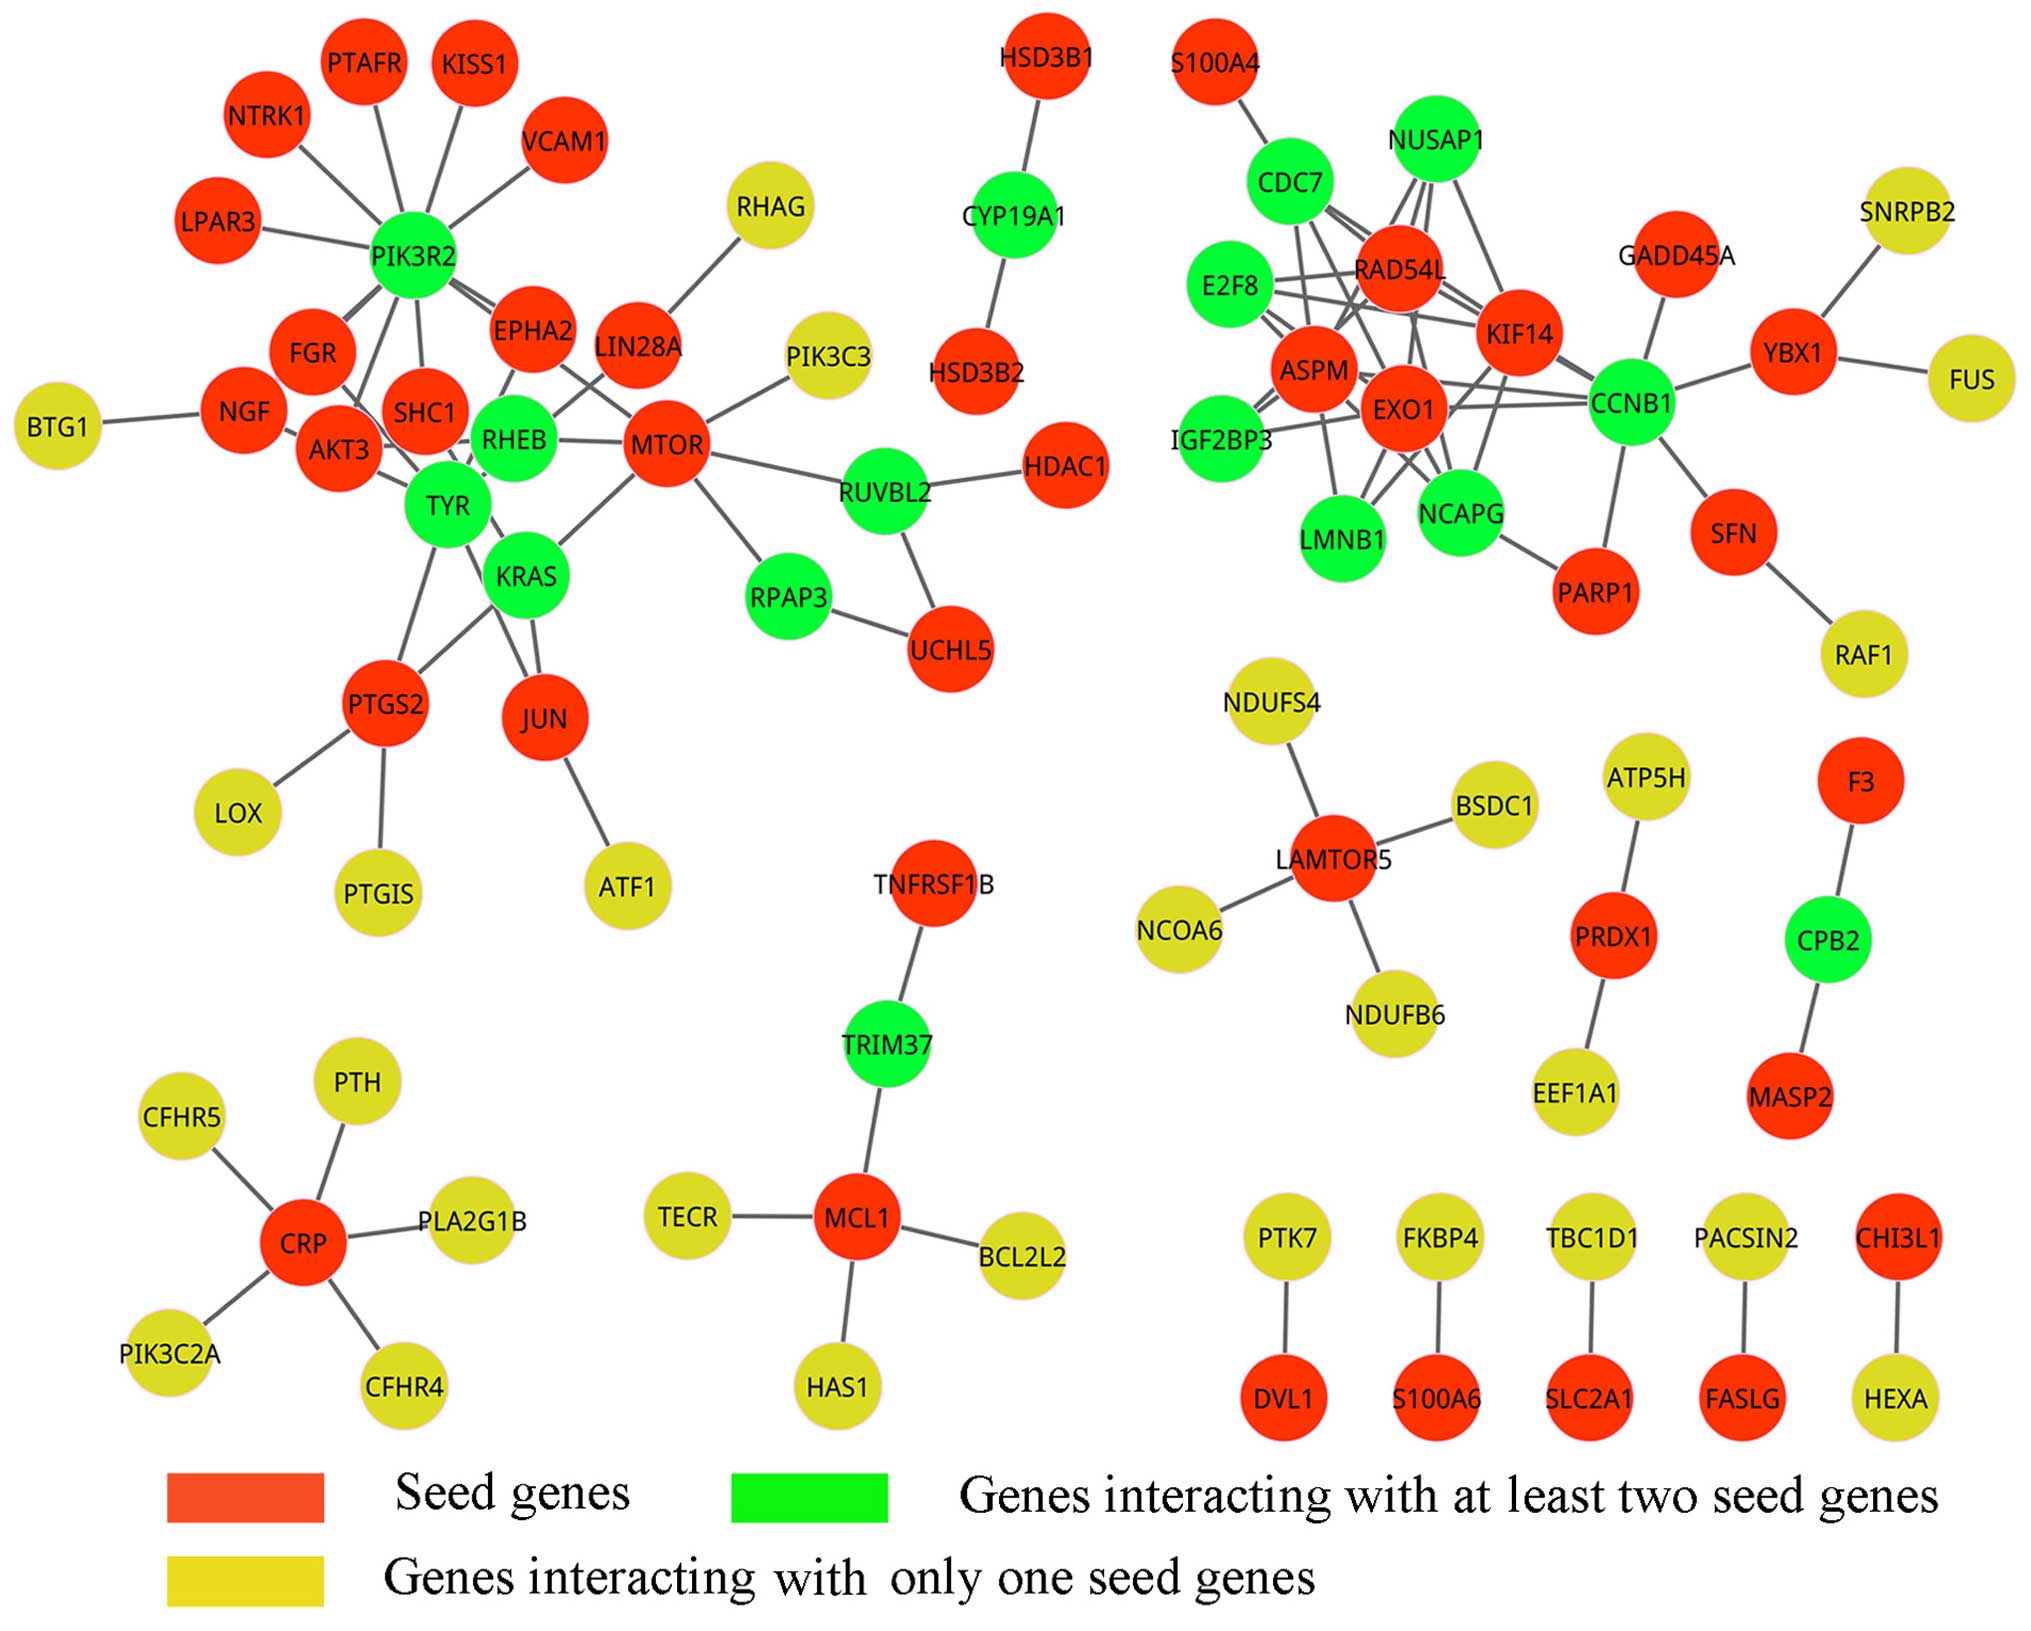
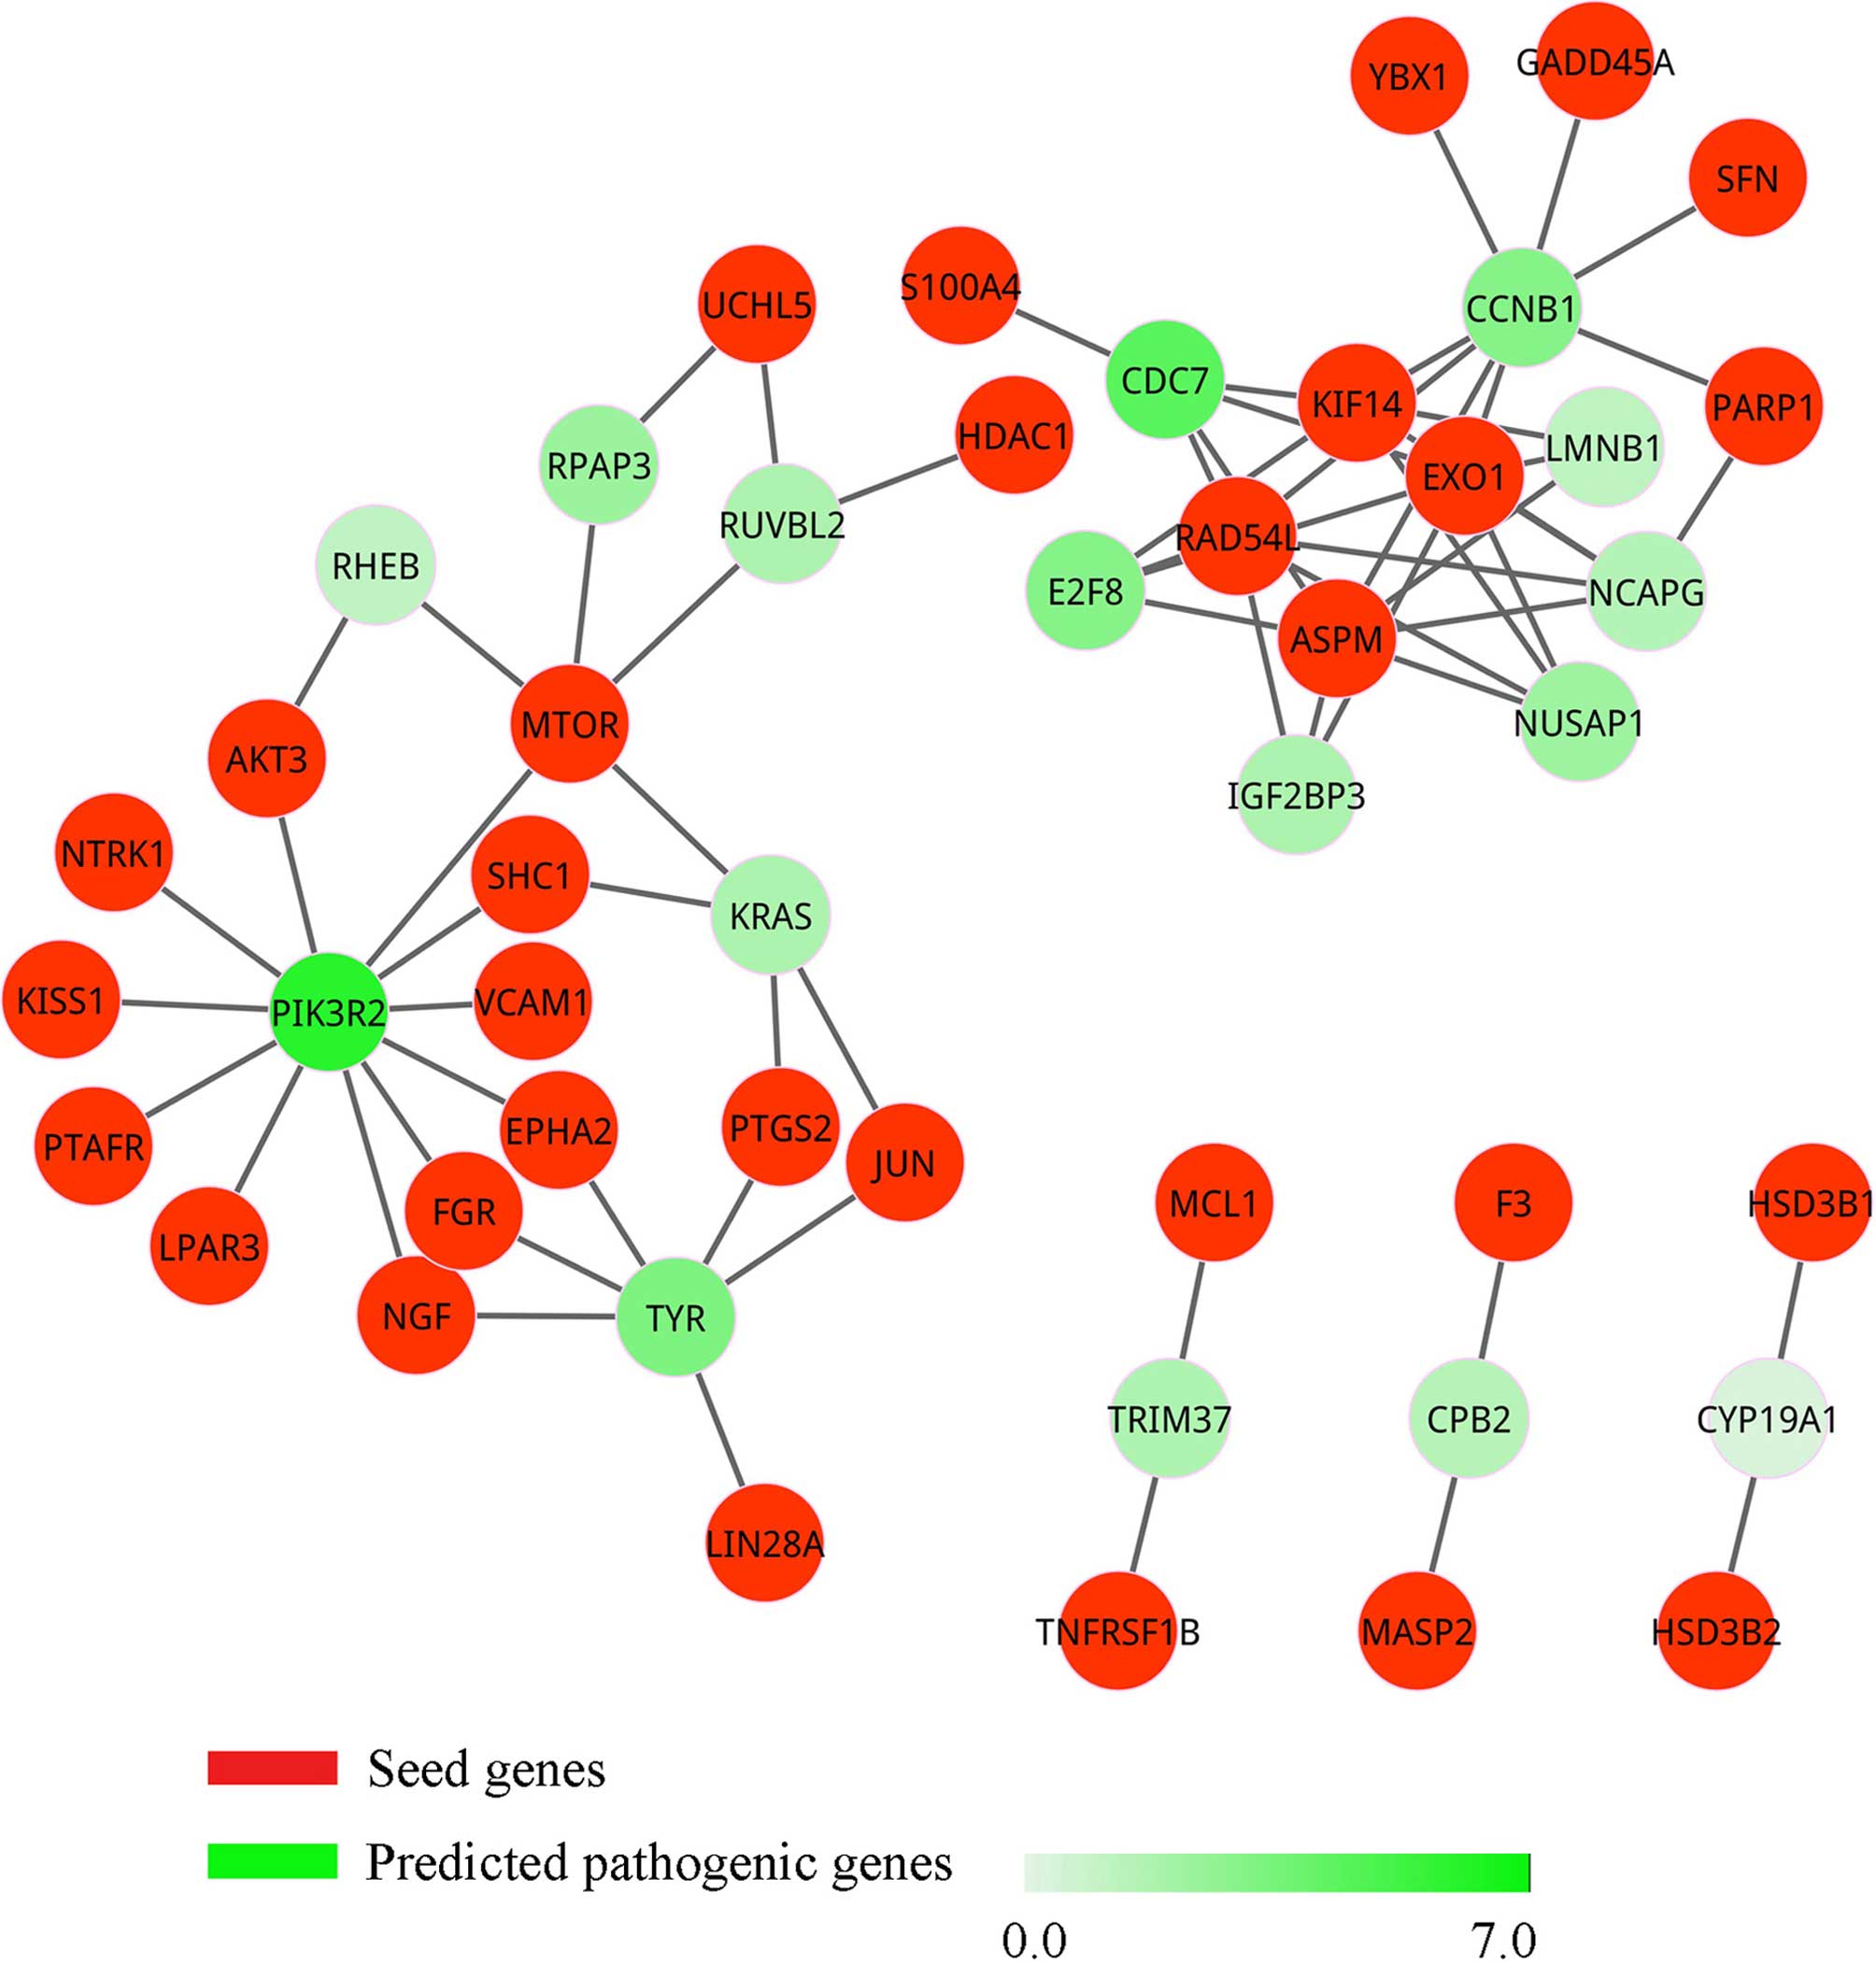
Similarly, when changing DEGs and the background PPI
network before treatment to after treatment, we obtained the
sub-network (Fig. 3) and pathogenic
network (Fig. 4) of ovarian cancer
after treatment with decitabine. In Fig. 3, there were 83 nodes of which 39
were seed genes and 94 edges, but these genes were not entirely
connected together. Discarding genes that only interacted with one
seed gene, 16 candidate genes and 66 interactions were extracted
from the sub-network and were formed into the pathogenic network of
ovarian cancer after treatment.
Ranking of candidate genes
A total of 32 and 16 candidate genes (Tables III and IV) were identified by ranking the
pathogenic genes based on the pathogenic network before and after
treatment. To screen more reliable pathogenic genes, we assigned a
weight to each candidate gene according to PCC, and ranked them in
decreasing order. The higher weight of one gene, the more confident
pathogenic gene of ovarian cancer was. For the candidate genes
before treatment, IL2, PIK3R2, IL1B,
CDC6 and CCNB1 possessed the top five rankings with a
weight of 6.693, 6.027, 4.542, 3.890 and 3.643, respectively. The
candidate genes of the after treatment group were part of that of
before treatment, but their weights had great differences apart
from PIK3R2 and CCNB1. The top five genes after
treatment were PIK3R2, CDC7, TYR, E2F8
and CCNB1.
| Table IIIWeights for the candidate genes of
ovarian cancer before treatment. |
Table III
Weights for the candidate genes of
ovarian cancer before treatment.
| Row | Node | Weight | Row | Node | Weight |
|---|
| 1 | IL2 | 6.963 | 17 | NCAPG | 1.846 |
| 2 | PIK3R2 | 6.027 | 18 | RUVBL2 | 1.830 |
| 3 | IL1B | 4.542 | 19 | IGF2BP3 | 1.816 |
| 4 | CDC6 | 3.890 | 20 | NDC80 | 1.791 |
| 5 | CCNB1 | 3.643 | 21 | KIF18A | 1.680 |
| 6 | CDC7 | 3.577 | 22 | KIF23 | 1.665 |
| 7 | AURKA | 3.443 | 23 | HELLS | 1.624 |
| 8 | GINS1 | 3.385 | 24 | LCP2 | 1.618 |
| 9 | BDKRB1 | 3.026 | 25 | RHEB | 1.447 |
| 10 | E2F8 | 2.904 | 26 | TRIM37 | 1.424 |
| 11 | TYR | 2.854 | 27 | VRK1 | 1.377 |
| 12 | FBXO5 | 2.732 | 28 | MCM4 | 1.321 |
| 13 | RPAP3 | 2.386 | 29 | LMNB1 | 1.236 |
| 14 | KRAS | 2.211 | 30 | NCAPH | 0.829 |
| 15 | NUSAP1 | 2.080 | 31 | CPB2 | 0.777 |
| 16 | DLGAP5 | 2.075 | 32 | CYP19A1 | 0.704 |
| Table IVWeights for the candidate genes of
ovarian cancer after treatment. |
Table IV
Weights for the candidate genes of
ovarian cancer after treatment.
| Row | Node | Weight |
|---|
| 1 | PIK3R2 | 6.028 |
| 2 | CDC7 | 4.421 |
| 3 | TYR | 3.288 |
| 4 | E2F8 | 3.067 |
| 5 | CCNB1 | 3.046 |
| 6 | RPAP3 | 2.336 |
| 7 | NUSAP1 | 2.286 |
| 8 | IGF2BP3 | 1.825 |
| 9 | KRAS | 1.813 |
| 10 | RUVBL2 | 1.797 |
| 11 | TRIM37 | 1.724 |
| 12 | NCAPG | 1.590 |
| 13 | CPB2 | 1.511 |
| 14 | LMNB1 | 1.296 |
| 15 | RHEB | 1.202 |
| 16 | CYP19A1 | 0.425 |
By comparing the two types of candidate genes, we
found that the 16 candidate genes of the after treatment group were
all involved in the 32 candidate genes, and the other 16 candidate
genes before treatment were silenced after treatment. The silenced
genes were: IL2, IL1B, CDC6, AURKA,
GINS1, BDKRB1, FBXO5, DLGAP5,
NDC80, KIF18A, KIF23, HELLS,
LCP2, VRK1, MCM4 and NCAPH, among which
IL2 changed most. The silenced genes with weight in the top
five (IL2, IL1B, CDC6, AURKA and
GINS1) may be more important than others for the decitabine
functional process.
Identification of key genes
In the present study, several indices were utilized
to investigate topological properties of candidate genes, including
degree, betweenness, closeness and stress. Among the 16 common
candidate genes, we removed TRIM37, CPB2 and
CYP19A1 which only interacted with two seed genes and were
not mapped main components of the pathogenic networks, and the
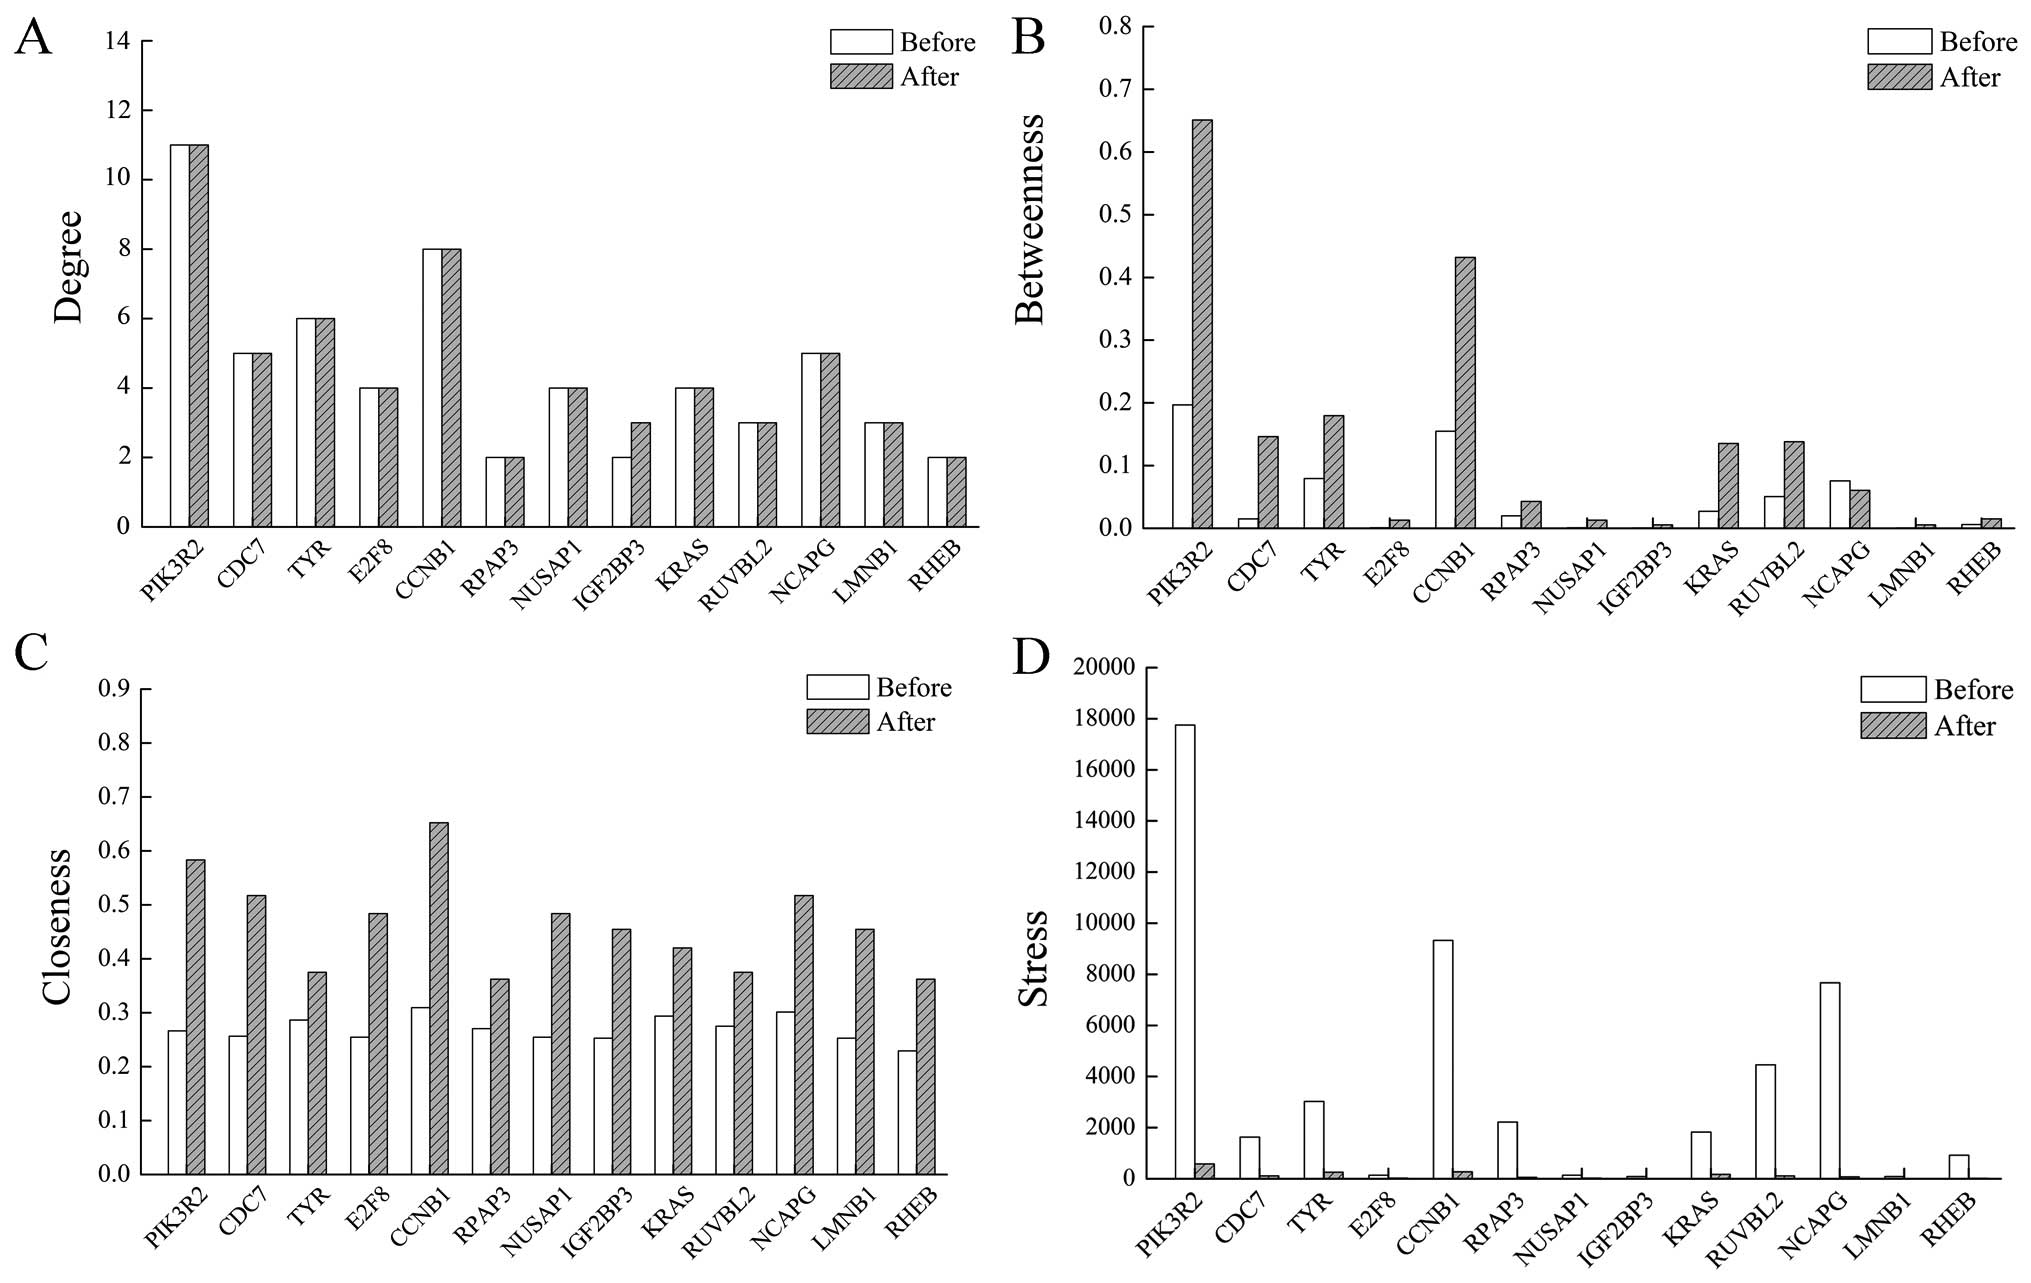
results of the other 13 candidate genes are displayed in Fig. 5. The degree distributions for 12
candidate genes except IGF2BP3 in the before treatment group
were the same as that in the after treatment group. As for
betweenness and stress, PIK3R2 and CCNB1 were changed
to a greater extent than the residual genes. The closeness for
candidate genes in ovarian cancer before treatment was similar, but
small differences were produced in after treatment.
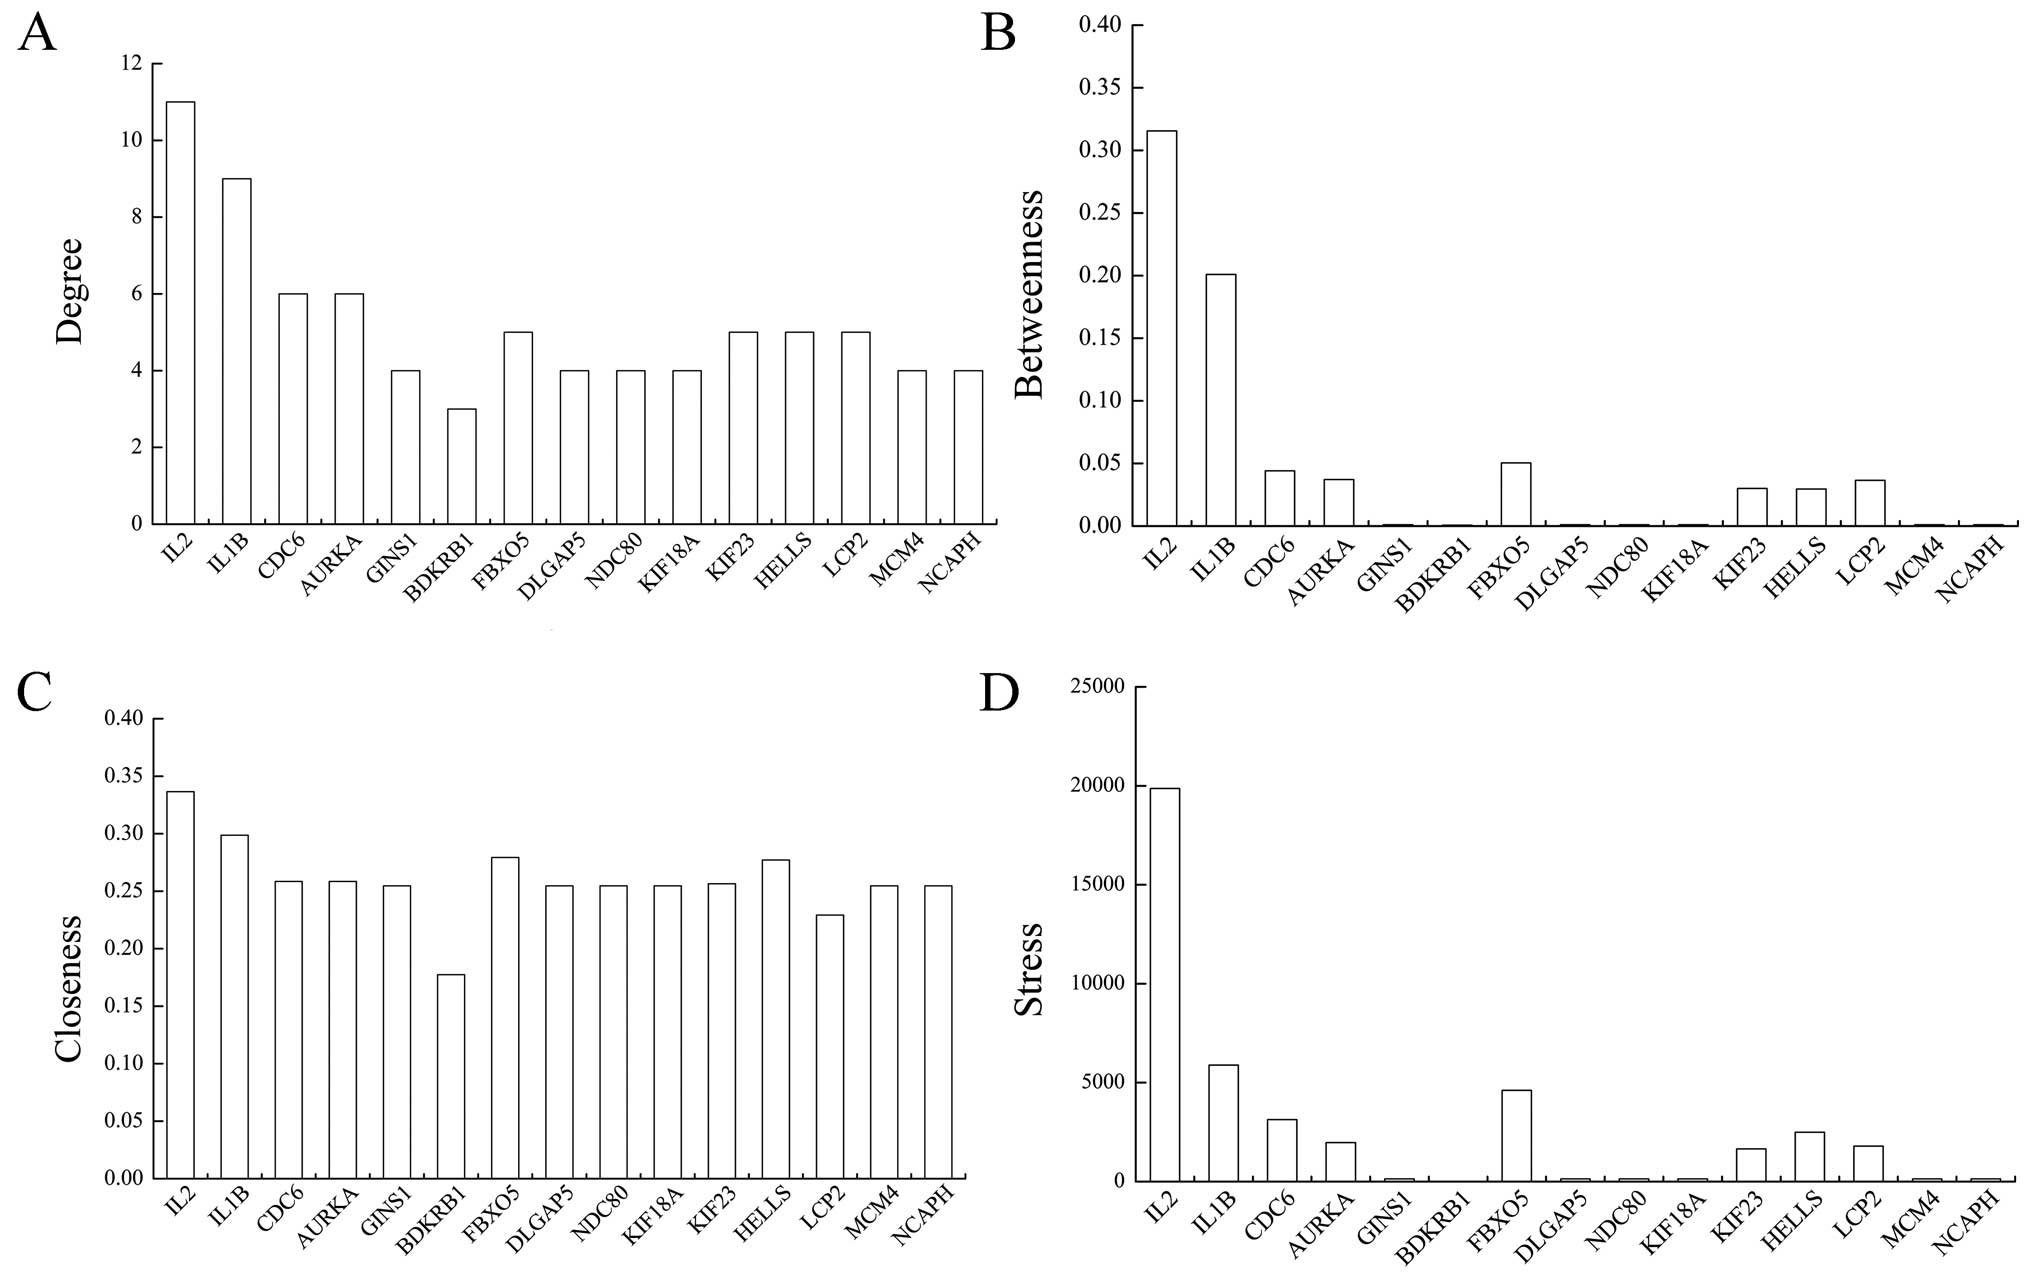
Topological properties of the silenced genes are
illustrated in Fig. 6; note that
VRK1 which only interacted with two seed genes was
discarded. IL2 had the highest values of four topological
induces, IL1B and CDC6 were next. Apart from them,
degree distributions of the other silenced genes were similar, as
well as closeness distribution. Meanwhile, distribution tends
between betweenness and stress were almost the same.
Combining weight values and topological properties
of the candidate genes and silenced genes, PIK3R2,
CCNB1, IL2, IL1B and CDC6 were regarded
as key genes for ovarian cancer treated with decitabine.
Pathway analysis
KEGG pathway enrichment analysis for the seed genes
and candidate genes were carried out, and pathways with P<0.01
which were calculated by EASE algorithm implemented in DAVID are
listed in Table V. A total of 10
pathways were evaluated, of which 5 were signaling pathways
(neurotrophin, ErbB T cell receptor, insulin and mTOR signaling
pathways) and 2 (cell cycle and apoptosis) were related to cell
activities. In addition, the other 3 pathways were cancer pathways
(glioma, chronic myeloid leukemia and AML). The most significant 3
pathways were neurotrophin signaling pathway (P=3.14E-04), cell
cycle (P=3.28E-04) and ErbB signaling pathway (P=4.76E-04).
PIK3R2 actively participated in 9 pathways except the cell
cycle. CCNB1 and CDC6 were enriched in cell cycle,
while IL2 mapped to T cell receptor signaling pathway.
| Table VPathways enriched by seed genes and
candidate genes with P<0.01. |
Table V
Pathways enriched by seed genes and
candidate genes with P<0.01.
| Pathway | Count | P-value | Genes |
|---|
| Neurotrophin
signaling pathway | 7 | 3.14E-04 | KRAS,
JUN, NTRK1, SHC1, AKT3, PIK3R2,
NGF |
| Cell cycle | 7 | 3.28E-04 | CDC7,
CCNB1, CDC6, HDAC1, SFN, MCM4,
GADD45A |
| ErbB signaling
pathway | 6 | 4.76E-04 | KRAS,
JUN, SHC1, MTOR, AKT3,
PIK3R2 |
| Glioma | 5 | 1.272E-03 | KRAS,
SHC1, MTOR, AKT3, PIK3R2 |
| T cell receptor
signaling pathway | 6 | 1.276E-03 | KRAS,
JUN, AKT3, IL2, LCP2,
PIK3R2 |
| Chronic myeloid
leukemia | 5 | 2.429E-03 | KRAS,
HDAC1, SHC1, AKT3, PIK3R2 |
| Insulin signaling
pathway | 6 | 3.413E-03 | KRAS,
RHEB, SHC1, MTOR, AKT3,
PIK3R2 |
| Apoptosis | 5 | 4.165E-03 | NTRK1,
IL1B, AKT3, PIK3R2, NGF |
| mTOR signaling
pathway | 4 | 7.113E-03 | RHEB,
MTOR, AKT3, PIK3R2 |
| Acute myeloid
leukemia | 4 | 9.622E-03 | KRAS,
MTOR, AKT3, PIK3R2 |
Validation of candidate genes by
RT-PCR
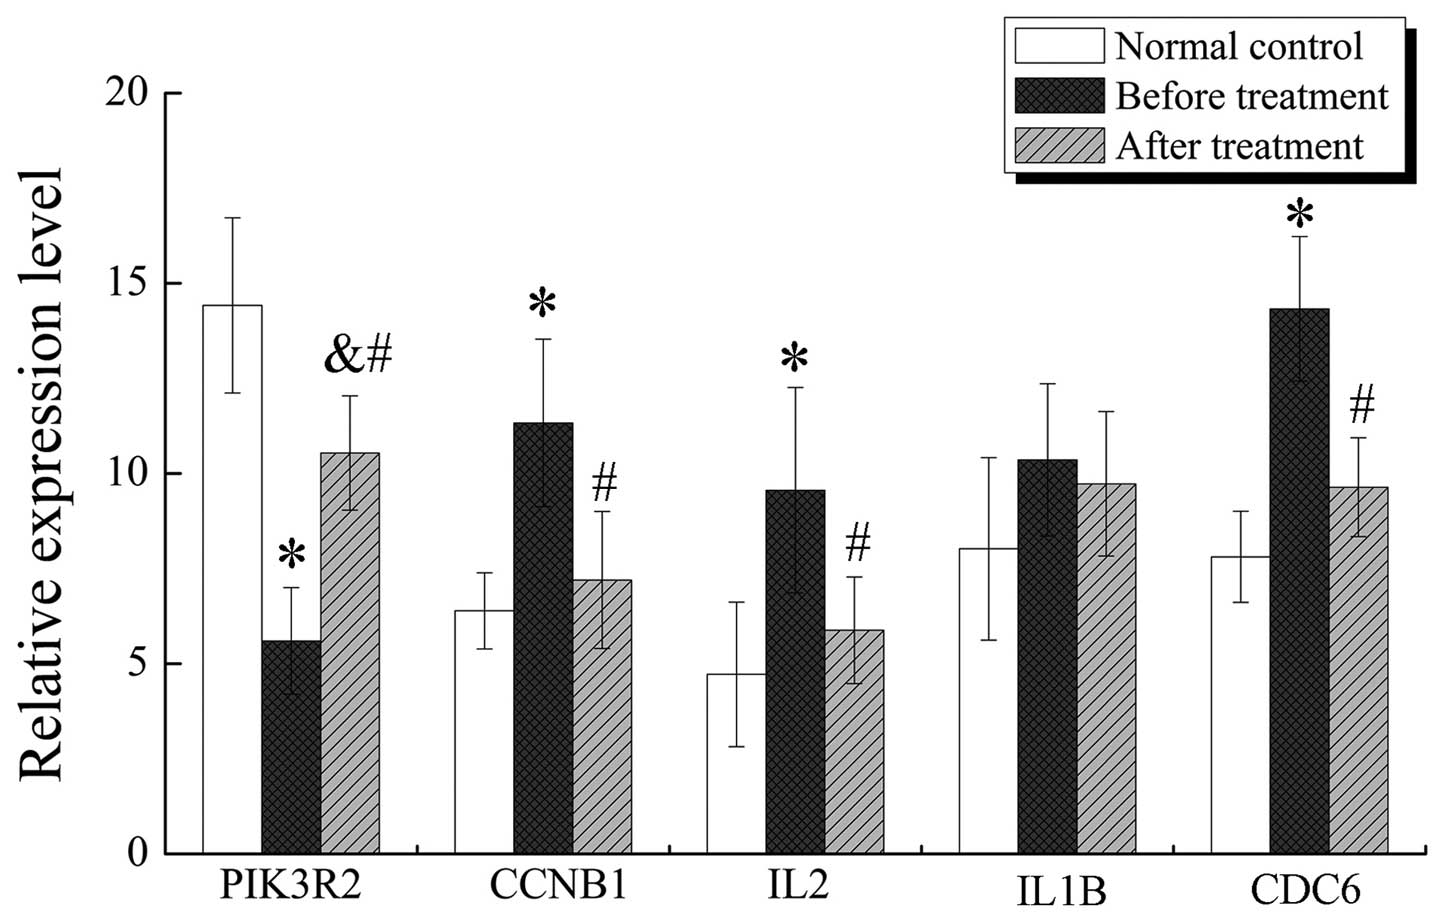
To study the activity and expression levels of
candidate genes in ovarian cancer, we collected ovarian cancer
A2780 cells before and after treatment with decitabine, and 10
ovarian cancer patient tissues to perform RT-PCR analyses. Note
that the normal controls in the RT-PCR assays were para-carcinoma
tissues of ovarian cancer patients. After RNA extraction, the cDNA
synthesis and PCR amplification, we obtained the relative
expression levels of 5 candidate genes (PIK3R2,
CCNB1, IL2, IL1B and CDC6) which were
taken as examples. By assessing the analysis of significance
dependent on SPSS, the results are illustrated in Fig. 7. Apart from IL1B, the other
four genes of ovarian cancer before treatment were significantly
differentially expressed with *P<0.05 compared to
normal controls and ovarian cancer after treatment
(#P<0.05). Only PIK3R2 was differentially
expressed between ovarian cancer after treatment and normal
controls (&P<0.05).
Discussion
In the present study, we predicted key genes
associated with ovarian cancer following treatment with decitabine
utilizing a pathogenic network method. The results identified 5 key
genes, PIK3R2, CCNB1, IL2, IL1B and
CDC6, which had high weight and good topological properties
(degree, betweenness, closeness and stress) in the pathogenic
network before and after treatment. In addition, these genes were
validated by RT-PCR assays.
The phosphatidylinositol 3-kinase (PI3K)
enzyme is an obligate heterodimer composed of a regulatory subunit
(PIK3R) and a catalytic subunit (PIK3C) (26). Once the interaction of PIK3R
with a variety of receptors is recruited, PIK3C is activated
through a conformational switch and produces
phosphatidylinositol-3,4,5-trisphosphate (PIP3), which
functions as a cellular second messenger (27). PIP3 encodes kinases, of which
the most important is AKT that control a multitude of
pathways, including cell growth, survival and metabolism (28). As a consequence, there is a close
relationship between PI3K and AKT. It has been
reported that alterations to the PI3K-AKT signaling
pathway are common in human cancer, for example, in ovarian cancer
(29). We discovered that
phosphoinositide-3-kinase, regulatory subunit 2 (PIK3R2) and
v-akt murine thymoma viral oncogene homolog 3 (AKT3)
co-function in several pathways which also play significant roles
in the process of ovarian cancer, such as neurotrophin signaling
pathway and ErbB signaling pathway (30,31).
Cheung et al (32)
demonstrated PIK3R2 mutations on PI3K signaling in
endometrial cancer, thus we may infer that PIK3R2 mutations
also exist in ovarian cancer.
Cyclin B1 (CCNB1) is a regulatory protein
involved in mitosis and the product complexes to form the
maturation-promoting factor. Its transcription leading to
aberrantly high levels of CCNB1 throughout the cell cycle is
associated with excessive hyperplasia in several human cancers
(33). For example, CCNB1
was found to have significant predictive power in distant
metastasis-, disease- and recurrence-free survival, and overall
survival of breast cancer patients (34). We found that CCNB1 was
overexpressed in an ovarian cancer cell line, but after decitabine
treatment, its level decreased to some extent.
Interleukin 2 (IL2) is a pleiotropic
cytokine produced after antigen activation and has roles in key
functions of the immune system, tolerance and immunity, primarily
via its direct effects on T cells in regards to the mediation of T
cell growth and proliferation (35). In the present study, we found that
IL2 was enriched in the T cell receptor signaling pathway.
In ovarian tumors, myeloid cells are one of the major determinants
of immune suppression, and the accumulation of these
immuno-suppressive activities may lead to further worsen cancer
(36). Duraiswamy et al
demonstrated that therapeutic pathway blockade augments other
modalities of immunotherapy T cell function preventing immune
decline in ovarian cancer (37). We
may infer that IL2 had a potential role in
decitabine-treated ovarian cancer patients through the medium of T
cell.
Cell division cycle 6 (CDC6) is an essential
regulator of DNA replication and plays important roles in the
activation and maintenance of the checkpoint mechanisms in the cell
cycle (38). Deregulation of
CDC6 leads to aberrant DNA replication, DNA damage and
genomic instability, and may even contribute to tumorigenesis
(39). CDC6 has been
associated with the oncogenic activities in human types of cancers,
such as lung (38), breast
(40) and ovarian cancer (41). For instance, Deng et al found
that CDC6 was upregulated, discovered a novel regulatory
signaling pathway of CDC6 and provided a new potential
therapeutic target for ovarian cancer patients (41). In addition, it has been suggested
that a number of genes are inversely correlated with CDC6 in
functional models of the ovarian cancer cell line HEYA8 (42). In the present study, we also found
that CDC6 was upregulated in ovarian cancer samples.
In conclusion, we have successfully identified 5
key genes (PIK3R2, CCNB1, IL2, IL1B and
CDC6) and validated them by RT-PCR. Our findings provide
insight into the molecular mechanisms of decitabine treatment and
may be potential pathogenic biomarkers for the therapy of ovarian
cancer.
Acknowledgments
The present study received no specific grants from
any funding agency in public, commercial or not-for-profit
sectors.
References
|
1
|
Madathil KC, Greenstein JS, Juang KA,
Neyens DM and Gramopadhye AK: An investigation of the informational
needs of ovarian cancer patients and their supporters. In:
Proceedings of the Human Factors and Ergonomics Society Annual
Meeting. SAGE Journals. 57:748–752. 2013. View Article : Google Scholar
|
|
2
|
Network CGAR; Cancer Genome Atlas Research
Network: Integrated genomic analyses of ovarian carcinoma. Nature.
474:609–615. 2011. View Article : Google Scholar : PubMed/NCBI
|
|
3
|
Siegel R, Naishadham D and Jemal A: Cancer
statistics, 2012. CA Cancer J Clin. 62:10–29. 2012. View Article : Google Scholar : PubMed/NCBI
|
|
4
|
Holohan C, Van Schaeybroeck S, Longley DB
and Johnston PG: Cancer drug resistance: An evolving paradigm. Nat
Rev Cancer. 13:714–726. 2013. View Article : Google Scholar : PubMed/NCBI
|
|
5
|
Khaider NG, Lane D, Matte I, Rancourt C
and Piché A: Targeted ovarian cancer treatment: The TRAILs of
resistance. Am J Cancer Res. 2:75–92. 2012.
|
|
6
|
Liu X, Tang WH, Zhao XM and Chen L: A
network approach to predict pathogenic genes for Fusarium
graminearum. PLoS One. 5:e130212010. View Article : Google Scholar : PubMed/NCBI
|
|
7
|
Göhre V and Robatzek S: Breaking the
barriers: Microbial effector molecules subvert plant immunity. Annu
Rev Phytopathol. 46:189–215. 2008. View Article : Google Scholar : PubMed/NCBI
|
|
8
|
Ein-Dor L, Kela I, Getz G, Givol D and
Domany E: Outcome signature genes in breast cancer: Is there a
unique set? Bioinformatics. 21:171–178. 2005. View Article : Google Scholar
|
|
9
|
Zhang L, Li S, Hao C, Hong G, Zou J, Zhang
Y, Li P and Guo Z: Extracting a few functionally reproducible
biomarkers to build robust subnetwork-based classifiers for the
diagnosis of cancer. Gene. 526:232–238. 2013. View Article : Google Scholar : PubMed/NCBI
|
|
10
|
Rodríguez-Paredes M and Esteller M: Cancer
epigenetics reaches mainstream oncology. Nat Med. 17:330–339. 2011.
View Article : Google Scholar : PubMed/NCBI
|
|
11
|
Ballestar E and Esteller M: Epigenetic
gene regulation in cancer. Adv Genet. 61:247–267. 2008. View Article : Google Scholar : PubMed/NCBI
|
|
12
|
Xiang Y, Ma N, Wang D, Zhang Y, Zhou J, Wu
G, Zhao R, Huang H, Wang X, Qiao Y, et al: MiR-152 and miR-185
co-contribute to ovarian cancer cells cisplatin sensitivity by
targeting DNMT1 directly: A novel epigenetic therapy independent of
decitabine. Oncogene. 33:378–386. 2014. View Article : Google Scholar
|
|
13
|
Stephan L and Momparler R: Combination
chemotherapy of cancer using the inhibitor of DNA methylation
5-aza-2′-deoxy-cytidine (decitabine). J Cancer Res Ther. 3:56–65.
2015. View Article : Google Scholar
|
|
14
|
Chen MY, Liao WS, Lu Z, Bornmann WG,
Hennessey V, Washington MN, Rosner GL, Yu Y, Ahmed AA and Bast RC
Jr: Decitabine and suberoylanilide hydroxamic acid (SAHA) inhibit
growth of ovarian cancer cell lines and xenografts while inducing
expression of imprinted tumor suppressor genes, apoptosis, G2/M
arrest, and autophagy. Cancer. 117:4424–4438. 2011. View Article : Google Scholar : PubMed/NCBI
|
|
15
|
Matsumura N, Huang Z, Mori S, Baba T,
Fujii S, Konishi I, Iversen ES, Berchuck A and Murphy SK:
Epigenetic suppression of the TGF-beta pathway revealed by
transcriptome profiling in ovarian cancer. Genome Res. 21:74–82.
2011. View Article : Google Scholar :
|
|
16
|
Li J and Tibshirani R: Finding consistent
patterns: A nonparametric approach for identifying differential
expression in RNA-Seq data. Stat Methods Med Res. 22:519–536. 2013.
View Article : Google Scholar
|
|
17
|
Amberger JS, Bocchini CA, Schiettecatte F,
Scott AF and Hamosh A: OMIM org: Online Mendelian Inheritance in
Man (OMIM®), an online catalog of human genes and genetic
disorders. Nucleic Acids Res. 43:D789–D798. 2015. View Article : Google Scholar
|
|
18
|
Franceschini A, Szklarczyk D, Frankild S,
Kuhn M, Simonovic M, Roth A, Lin J, Minguez P, Bork P, Von Mering
C, et al: STRING v9.1: Protein-protein interaction networks, with
increased coverage and integration. Nucleic Acids Res.
41:D808–D815. 2013. View Article : Google Scholar :
|
|
19
|
Benesty J, Chen J, Huang Y and Cohen I:
Pearson correlation coefficient. Noise Reduction in Speech
Processing. Springer; pp. 1–4. 2009, View Article : Google Scholar
|
|
20
|
Haythornthwaite C: Social network
analysis: An approach and technique for the study of information
exchange. Libr Inf Sci Res. 18:323–342. 1996. View Article : Google Scholar
|
|
21
|
Barthelemy M: Betweenness centrality in
large complex networks. Eur Phys J b Cond Matter Complex Syst.
38:163–168. 2004. View Article : Google Scholar
|
|
22
|
Wasserman S: Social network analysis:
Methods and Applications. Cambridge University Press; 1994,
http://dx.doi.org/10.1017/Cbo9780511815478.
View Article : Google Scholar
|
|
23
|
Fekete SP, Kaufmann M, Kröller A and
Lehmann K: A new approach for boundary recognition in geometric
sensor networks. Proc. 17th Canadian Conference on Computational
Geometry; pp. 82–85. 2005
|
|
24
|
Huang W, Sherman BT and Lempicki RA:
Systematic and integrative analysis of large gene lists using DAVID
bioinformatics resources. Nat Protoc. 4:44–57. 2009. View Article : Google Scholar
|
|
25
|
Wang X and Simon R: Microarray-based
cancer prediction using single genes. BMC Bioinformatics.
12:3912011. View Article : Google Scholar : PubMed/NCBI
|
|
26
|
Vogt PK, Hart JR, Gymnopoulos M, Jiang H,
Kang S, Bader AG, Zhao L and Denley A: Phosphatidylinositol
3-kinase: The oncoprotein. Phosphoinositide 3-kinase in Health and
Disease. Springer; pp. 79–104. 2010, View Article : Google Scholar
|
|
27
|
Herrero-Gonzalez S and Di Cristofano A:
New routes to old places: PIK3R1 and PIK3R2 join PIK3CA and PTEN as
endometrial cancer genes. Cancer Discov. 1:106–107. 2011.
View Article : Google Scholar
|
|
28
|
Fayard E, Xue G, Parcellier A, Bozulic L
and Hemmings BA: Protein kinase B (PKB/Akt), a key mediator of the
Pi3k signaling pathway. Phosphoinositide 3-kinase in Health and
Disease. Springer; pp. 31–56. 2011
|
|
29
|
Wu R, Hu TC, Rehemtulla A, Fearon ER and
Cho KR: Preclinical testing of PI3K/AKT/mTOR signaling inhibitors
in a mouse model of ovarian endometrioid adenocarcinoma. Clin
Cancer Res. 17:7359–7372. 2011. View Article : Google Scholar : PubMed/NCBI
|
|
30
|
De Graeff P, Crijns AP, Ten Hoor KA, Klip
HG, Hollema H, Oien K, Bartlett JM, Wisman GB, de Bock GH, de Vries
EG, et al: The ErbB signalling pathway: Protein expression and
prognostic value in epithelial ovarian cancer. Br J Cancer.
99:341–349. 2008. View Article : Google Scholar : PubMed/NCBI
|
|
31
|
Thiele CJ, Li Z and Mckee AE: On Trk - the
Trkb signal transduction pathway is an increasingly important
target in cancer biology. Clin Cancer Res. 15:5962–5967. 2009.
View Article : Google Scholar : PubMed/NCBI
|
|
32
|
Cheung LW, Hennessy BT, Li J, Yu S, Myers
AP, Djordjevic B, Lu Y, Stemke-Hale K, Dyer MD, Zhang F, et al:
High frequency of PIK3R1 and PIK3R2 mutations in endometrial cancer
elucidates a novel mechanism for regulation of PTEN protein
stability. Cancer Discov. 1:170–185. 2011. View Article : Google Scholar : PubMed/NCBI
|
|
33
|
Egloff AM, Vella LA and Finn OJ: Cyclin B1
and other cyclins as tumor antigens in immunosurveillance and
immunotherapy of cancer. Cancer Res. 66:6–9. 2006. View Article : Google Scholar : PubMed/NCBI
|
|
34
|
Ding K, Li W, Zou Z, Zou X and Wang C:
CCNB1 is a prognostic biomarker for ER+ breast cancer. Med
Hypotheses. 83:359–364. 2014. View Article : Google Scholar : PubMed/NCBI
|
|
35
|
Liao W, Lin JX and Leonard WJ:
Interleukin-2 at the crossroads of effector responses, tolerance,
and immunotherapy. Immunity. 38:13–25. 2013. View Article : Google Scholar : PubMed/NCBI
|
|
36
|
Wilke CM, Kryczek I and Zou W:
Antigen-presenting cell (APC) subsets in ovarian cancer. Int Rev
Immunol. 30:120–126. 2011. View Article : Google Scholar : PubMed/NCBI
|
|
37
|
Duraiswamy J, Freeman GJ and Coukos G:
Therapeutic PD-1 pathway blockade augments with other modalities of
immunotherapy T-cell function to prevent immune decline in ovarian
cancer. Cancer Res. 73:6900–6912. 2013. View Article : Google Scholar : PubMed/NCBI
|
|
38
|
Zhang X, Xiao D, Wang Z, Zou Y, Huang L,
Lin W, Deng Q, Pan H, Zhou J, Liang C, et al: MicroRNA-26a/b
regulate DNA replication licensing, tumorigenesis, and prognosis by
targeting CDC6 in lung cancer. Mol Cancer Res. 12:1535–1546. 2014.
View Article : Google Scholar : PubMed/NCBI
|
|
39
|
Blow JJ and Gillespie PJ: Replication
licensing and cancer - a fatal entanglement? Nat Rev Cancer.
8:799–806. 2008. View Article : Google Scholar : PubMed/NCBI
|
|
40
|
Booher K, Lin DW, Borrego SL and Kaiser P:
Downregulation of Cdc6 and pre-replication complexes in response to
methionine stress in breast cancer cells. Cell Cycle. 11:4414–4423.
2012. View Article : Google Scholar : PubMed/NCBI
|
|
41
|
Deng Y, Jiang L, Wang Y, Xi Q, Zhong J,
Liu J, Yang S, Liu R, Wang J, Huang M, et al: High expression of
CDC6 is associated with accelerated cell proliferation and poor
prognosis of epithelial ovarian cancer. Pathol Res Pract. Sep
18–2015.(Epub ahead of print). pii: S0344-0338(15)30014-5.
View Article : Google Scholar
|
|
42
|
Creighton CJ, Hernandez-Herrera A,
Jacobsen A, Levine DA, Mankoo P, Schultz N, Du Y, Zhang Y, Larsson
E, Sheridan R, et al Cancer Genome Atlas Research Network:
Integrated analyses of microRNAs demonstrate their widespread
influence on gene expression in high-grade serous ovarian
carcinoma. PLoS One. 7:e345462012. View Article : Google Scholar : PubMed/NCBI
|