Introduction
Squamous cell carcinoma (SCC) is the most frequent
type of cancer in the oral and maxillofacial region, and its
metastatic and invasive abilities result in a poor prognosis
(1,2). Standard care for oral cancer includes
a combination of surgery, radiation and chemotherapy. Although
cancer treatment is progressing substantially, the survival rate of
patients with oral cancer has not changed over the past 30 years
(3). Early detection of
premalignant oral mucosal abnormalities and SCC is preferred
because early diagnosis and appropriate treatment decrease patient
morbidity and improve survival (4).
The clinical symptoms of precancerous lesions and early oral
squamous cell carcinoma (OSCC) are varied and may be misdiagnosed
as other conditions, including mucosal inflammation,
hyperkeratosis, or traumatic ulceration.
Autofluorescence is one potential technique that may
be used to facilitate the visualization and detection of oral
precancerous and early cancerous lesions. As early as 1924, it was
discovered that the autofluorescence of tissues could potentially
be used for cancer detection. Autofluorescence works on the
principle that certain biofluorophores present within the tissue
become fluorescent on excitation with a light source of suitable
wavelength (400–460 nm). However, diseased tissues exhibit FV loss
(FVL) due to breakdown in the dispersion of these biofluorophores,
and appear darker in color. Recently, fluorescence imaging studies
for the early detection of oral cancer have used indirect
visualization using either photographic film or a sensitive
charge-coupled device (CCD) camera. De Veld et al provide a
comprehensive review of in vivo autofluorescence
spectroscopy and imaging for oral oncology (5). Onizawa et al (6,7) used a
custom UV-flash photographic system to record porphyrin-like
fluorescence in the oral resin. Fluorescence was energized by the
360-nm spectral peak of a flash lamp and fluorescence was recorded
on photographic film using a 480-nm long-pass filter. The authors
reported 91% sensitivity and 84% specificity for identification of
benign from cancerous lesions. More recently, Svistun et al
reported a system for the direct visualization of oral region
fluorescence (8). In their system,
excitation light was provided by a handheld illuminator and tissue
fluorescence was observed along an axis slightly tilted from the
illumination axis using special glasses. Realized tumor margins, as
decisioned from the fluorescence images and not observed directly
through the viewing glasses, were correlated with histology. The
sensitivity and specificity were 91 and 86% for the identification
of normal tissue from malignant lesions at the best energization
wavelength.
The interaction of light with tissue has generally
been found to best show changes in the structure and metabolic
properties of the areas optically sampled. Concretely, the loss of
autofluorescence is trusted to reveal a complex mixture of changes
to essential tissue fluorophore apportioning. In this way,
structural changes in tissue morphology correlated with malignant
development in both the epithelium and lamina propria lead to
increased absorption of light, which in turn, decreases and
corrects the detectable autofluorescence (8–11).
Recent auxiliary screening technologies may allow
clinicians to detect premalignant and early cancerous lesions. The
technology is based on the prerequisite that normal cells fluoresce
when exposed to fluorescent light, whereas abnormal cells will
absorb fluorescent light and appear dark. We investigated the value
of this device to draw field changes in autofluorescence around
malignant lesions by determining and comparing the histopathologic
changes in margins that retained normal fluorescence visualization
(FVR) with those margins that showed a loss of FV (FVL). The
objective of this study was to investigate the value of this device
using rat tongue carcinogenesis and human oral precancerous and
early cancerous lesions. This is the first such study to use this
rat model.
Materials and methods
Animals
A total of 90 six-week-old male Sprague-Dawley rats
(weighing from 200 to 250 g; Clea Japan, Inc., Tokyo, Japan) were
kept in an animal room maintained at a constant temperature of
24±0.5°C. The tongues of 80 animals of the animals were rubbed with
cleanser on the first day and a solution of 50 ppm 4-nitroquinoline
1-oxide (4NQO) (Nacalai Tesque Inc., Kyoto, Japan) was placed in
their drinking water for 16 weeks. The remaining 10 animals were
used as controls. All experimental protocols involving animals were
reviewed and approved by the Animal Committee of Osaka Dental
University (Osaka, Japan) and conformed with procedures described
in the guiding Principles for the Use of Laboratory Animals.
Tissue preparation
The rats were sacrificed when their tongues showed a
whitened appearance with red areas and papillary lesions. In
preparation for immunohistochemical staining for proliferating cell
nuclear antigen (PCNA), the resected tongue tissues were fixed
overnight in 4% paraformaldehyde (PFA). The specimens were embedded
in paraffin, sectioned at a thickness of 4 µm at right
angles to the mucosal surface, and mounted on silane-coated slides.
Subsequently the resected tongue tissues were immediately frozen at
−80°C for molecular biological examination.
Histopathological observation
Immunohistochemistry was performed to examine the
expression of PCNA. After deparaffinization with xylene, the
sections were rehydrated with 100% alcohol and washed in distilled
water. Endogenous peroxidase activity was blocked by incubating the
sections with 3% H2O2 in methanol for 15 min
at room temperature. Slides were incubated with monoclonal mouse
antibody against human PCNA (PC10; Dako, Glostrup, Denmark) at a
dilution of 1:50 at 4°C overnight. The sections were washed in
phosphate-buffered saline (PBS) and incubated with the secondary
antibody [biotinylated anti-mouse immunoglobulin (Ig)G, or
anti-rabbit IgG] at room temperature 30 min. After washing in PBS
for 5 min, the sections were stained with 3,3′-diaminobenzidine for
5 min, washed in distilled water, counterstained with hematoxylin
and eosin (H&E) and mounted. We observed H&E-stained and
immunohistochemically stained PCNA sections at both regions.
Features of the staining and amount of PCNA immunoreactivity were
evaluated for each region. A scoring percentage was used in which
the mean percentage of positive tumor cells was determined in ≥3
random fields at ×200 magnification in each section.
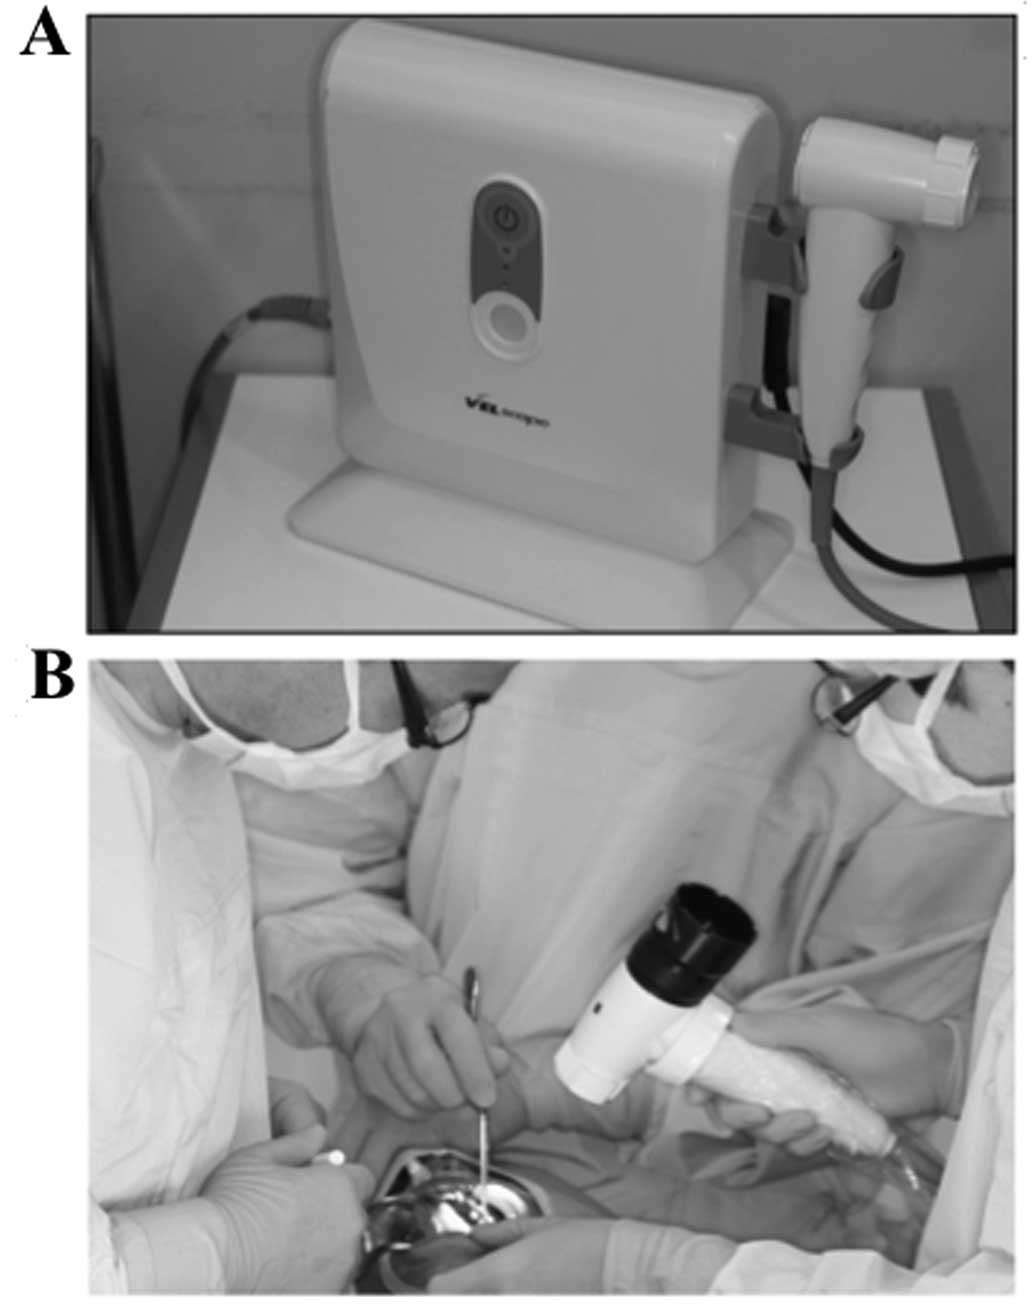
VELscope
This system is a simple manual device developed by
LED medical diagnostics (Burnaby, BC, Canada) in association with
scientists of the British Columbia Cancer Agency (BCCA; Vancouver,
BC, Canada) (Fig. 1). It detects
the loss of fluorescence in visible and non-visible high-risk oral
lesions by applying direct fluorescence. The loss of fluorescence
reflects a complex mixture of alterations to the intrinsic tissue
distribution of fluorophores (12,13).
The VELscope integrates four key elements: illumination,
sophisticated filtering, natural tissue fluorophores, and the power
of human optical and neural physiology. The VELscope has the
ability to surpass many of the restrictions presented by
conventional methods for screening, and aid in the detection of
mucosal lesions including precancerous and cancerous lesions. The
VELscope illuminates tissues with specific wavelengths that
interact with and provide metabolic and biochemical information
concerning the cells just beneath the surface. This provides
clinicians the capability to detect early biochemical changes
before they become apparent, and therefore detect lesions earlier
in the disease process. This system consists of a source of light
that emits a wavelength of 400 to 460 nm and a manual unit for
direct visualization. Under this light, normal oral mucosa gives
off a green auto-fluorescence, whereas abnormal mucosa absorbs the
fluorescent light and appear dark (11,14).
Therefore, early biochemical changes are discovered before their
more obvious appearance, permitting the early detection of
pathological lesions. Reported sensitivity values range from 97 to
98% and specificity from 94 to 100% (10,12,15).
Under direct FV, normal oral mucosa presented various shades of
pale green autofluorescence. Clinical lesions that retained normal
green autofluorescence under FV were defined as FV retained (FVR).
Tissues that showed a reduction in the normal pale green color and
appeared as dark patches were classified as FVL. This distinction
involved a comparison of the lesion site with both adjacent tissues
and, as an anatomic control, with tissues on the contralateral
side. Photographs of tissue fluorescence were acquired using
illumination from the FV device and a digital single lens reflex
camera with a long-pass filter. The camera was prepared with a
macro lens and a ring flash for white-light images.
Patients
Twenty patients with biopsy-confirmed primary cancer
of the oral region were selected for the study. Enrollment criteria
included the presence of early stage disease (T0-T2) scheduled for
surgical excision with the aim to treatment. Tumor staging of the
surgical specimens determined that 6 were carcinomas in situ
(CIS; stage 0), 13 were stage I invasive SCC and 1 was stage II
invasive SCC. The majority of the tumors were from the tongue (15
of 20, 75%), while 2 cases were from the floor of the mouth, 1 from
the gingiva, and 2 from the buccal mucosa.
Tissue sampling and histological
assessment
After resection, a total of 60 samples were obtained
from the tumor margins in each of three regions (anterior,
posterior and medial). All samples were fixed in formalin and
presented for histopathological assessment by pathologists who had
no knowledge of the FV status. The tumor and its surrounding area
were subjected to vital staining. Before the staining, the lesion
was rinsed with water and dried. Iodine staining was performed
using 3% iodine solution for ~20 sec. Images of the lesion were
captured ~2 min after the iodine application. The surgical margin
was determined to be ~3 mm outside the unstained area.
Statistical analysis
The Mann-Whitney U test was used to assess the
statistical significance of differences between samples. P-values
<0.05 were considered to indicate statistically significant
results.
Results
Rat carcinogenesis model
Analysis of the 80 experimental
rats
White, red or papillary lesions appeared in 22 of
the 80 experimental rats. Histologically, 7 were dysplasia, 5 were
CIS and 10 were SCC. The remaining 58 rats had no lesions on the
lateral edge of their tongue.
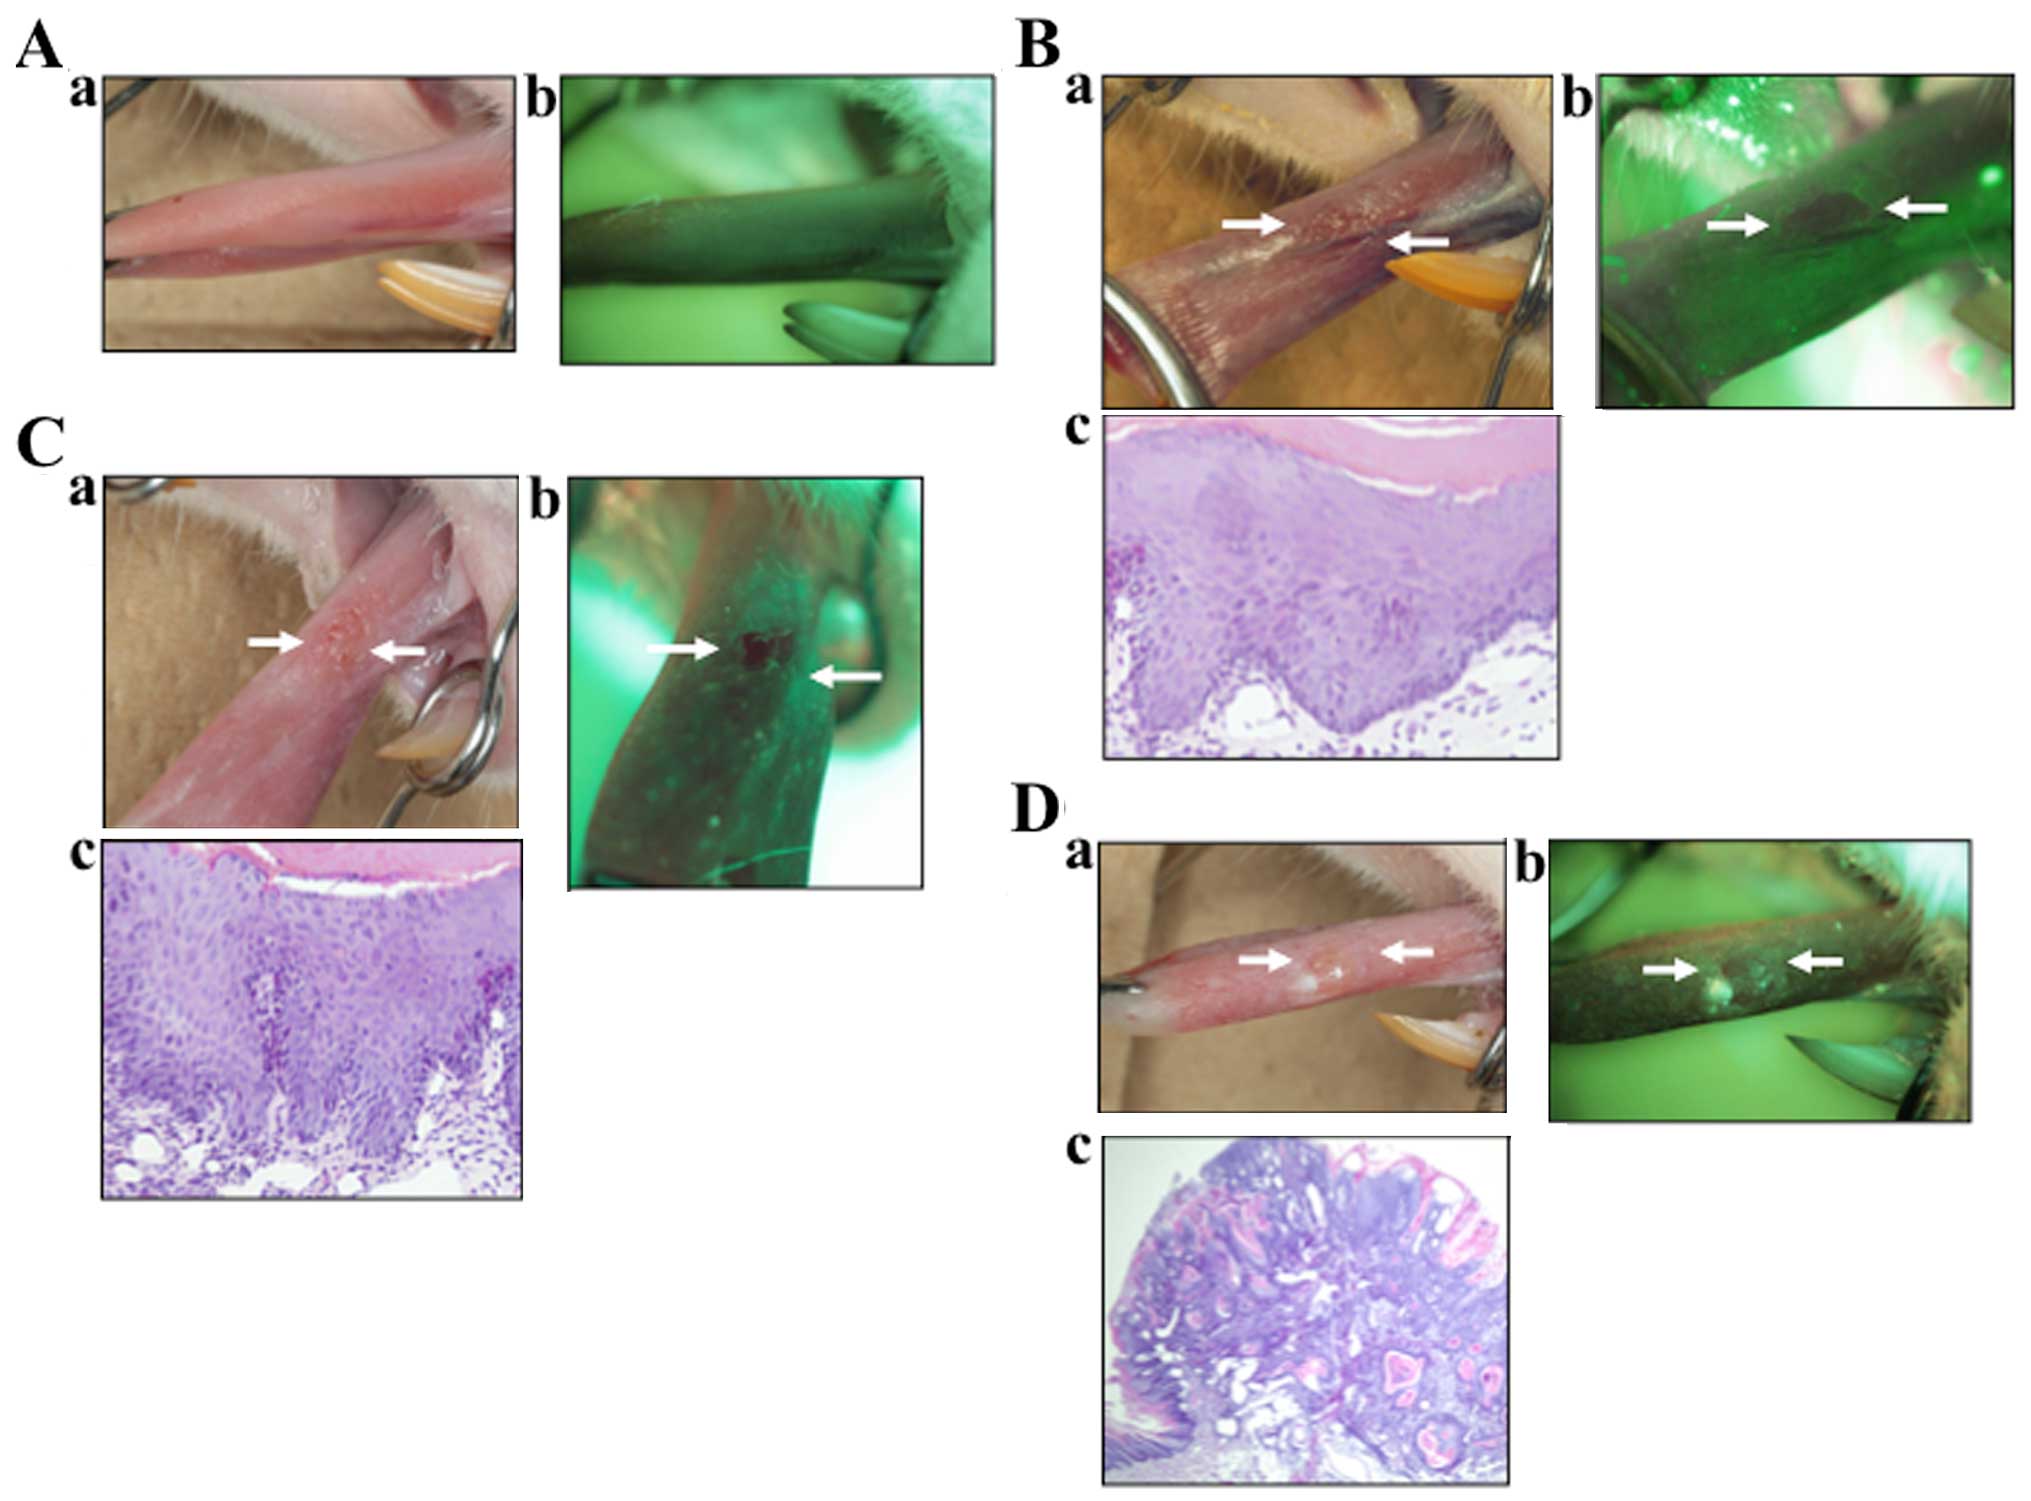
Normal tissues
Under direct FV, the normal oral mucosa emitted
various shades of pale green autofluorescence (Fig. 2A). Clinical lesions that retained
normal green autofluorescence under direct FV were classified as
lesions with FVR.
Dysplasia cases
In the VELscope image (Fig. 2B) this lesion appeared as an
irregular, dark area. This area was confirmed by biopsy to be
dysplasia. Tissues that showed a distinct reduction in the normal
pale green and appeared as dark green to black were classified as
FVL.
CIS cases
In the VELscope image (Fig. 2C) this lesion appeared as an
irregular, dark area. This area was found to be severe dysplasia.
Tissues that showed a distinct reduction in the normal pale green
and appeared as dark green to black were classified as FVL.
SCC cases
In the SCC image (Fig.
2D) this lesion appeared as clear, dark area. This area was
confirmed to be SCC. This assessment involved a comparison of the
lesion site with both adjacent tissue and, as an anatomical
control, with tissue on the contralateral side.
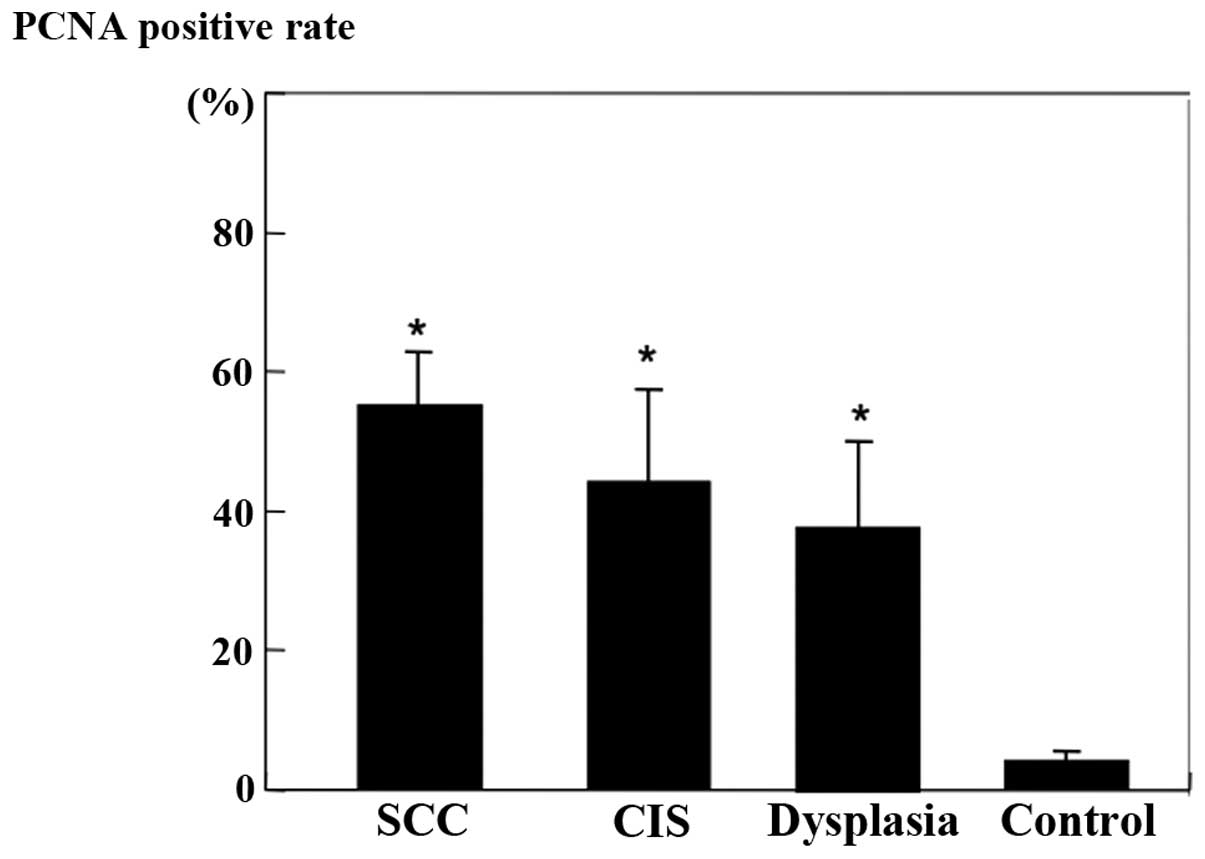
Immunohistochemical analysis
PCNA-positive cells were prominent in the parenchyma
of SCC and in the basal layer of CIS and dysplasia. The
PCNA-positive rate is shown in Fig.
3. PCNA-positive cells generally were increased with the
progression of tumors. A significant increase in the PCNA-positive
rate was observed between the control and dysplasia groups
(P<0.01).
Pathology
As shown in Table I,
of the 32 samples, 11 were FVR, and 21 were FVL. None of the 10
samples with a normal histological diagnosis showed FVL, whereas
92% of precancerous lesions (dysplasia and CIS) and 100% of
invasive SCC showed FVL.
 | Table ICorrelation of direct FV results with
lesion histopathology in the rat model. |
Table I
Correlation of direct FV results with
lesion histopathology in the rat model.
| Normal | Dysplasia and
CIS | Invasive SCC |
|---|
| No. of lesions | 10 | 12 | 10 |
| FVR | 10 (100%) | 1 (8%) | 0 (0%) |
| FVL | 0 (0%) | 11 (92%) | 10 (100%) |
Patients
Direct FV
Under direct FV, normal oral mucosa reflects various
shades of pale green autofluorescence. Clinical lesions that
retained normal green autofluorescence under direct FV were
classified as lesions with FVR. Tissues that showed a distinct
reduction in the normal pale green and appeared as dark green to
black were classified as FVL. This assessment involved a comparison
of the lesion site with both adjacent tissue and, as an anatomical
control, with tissue on the contra-lateral side.
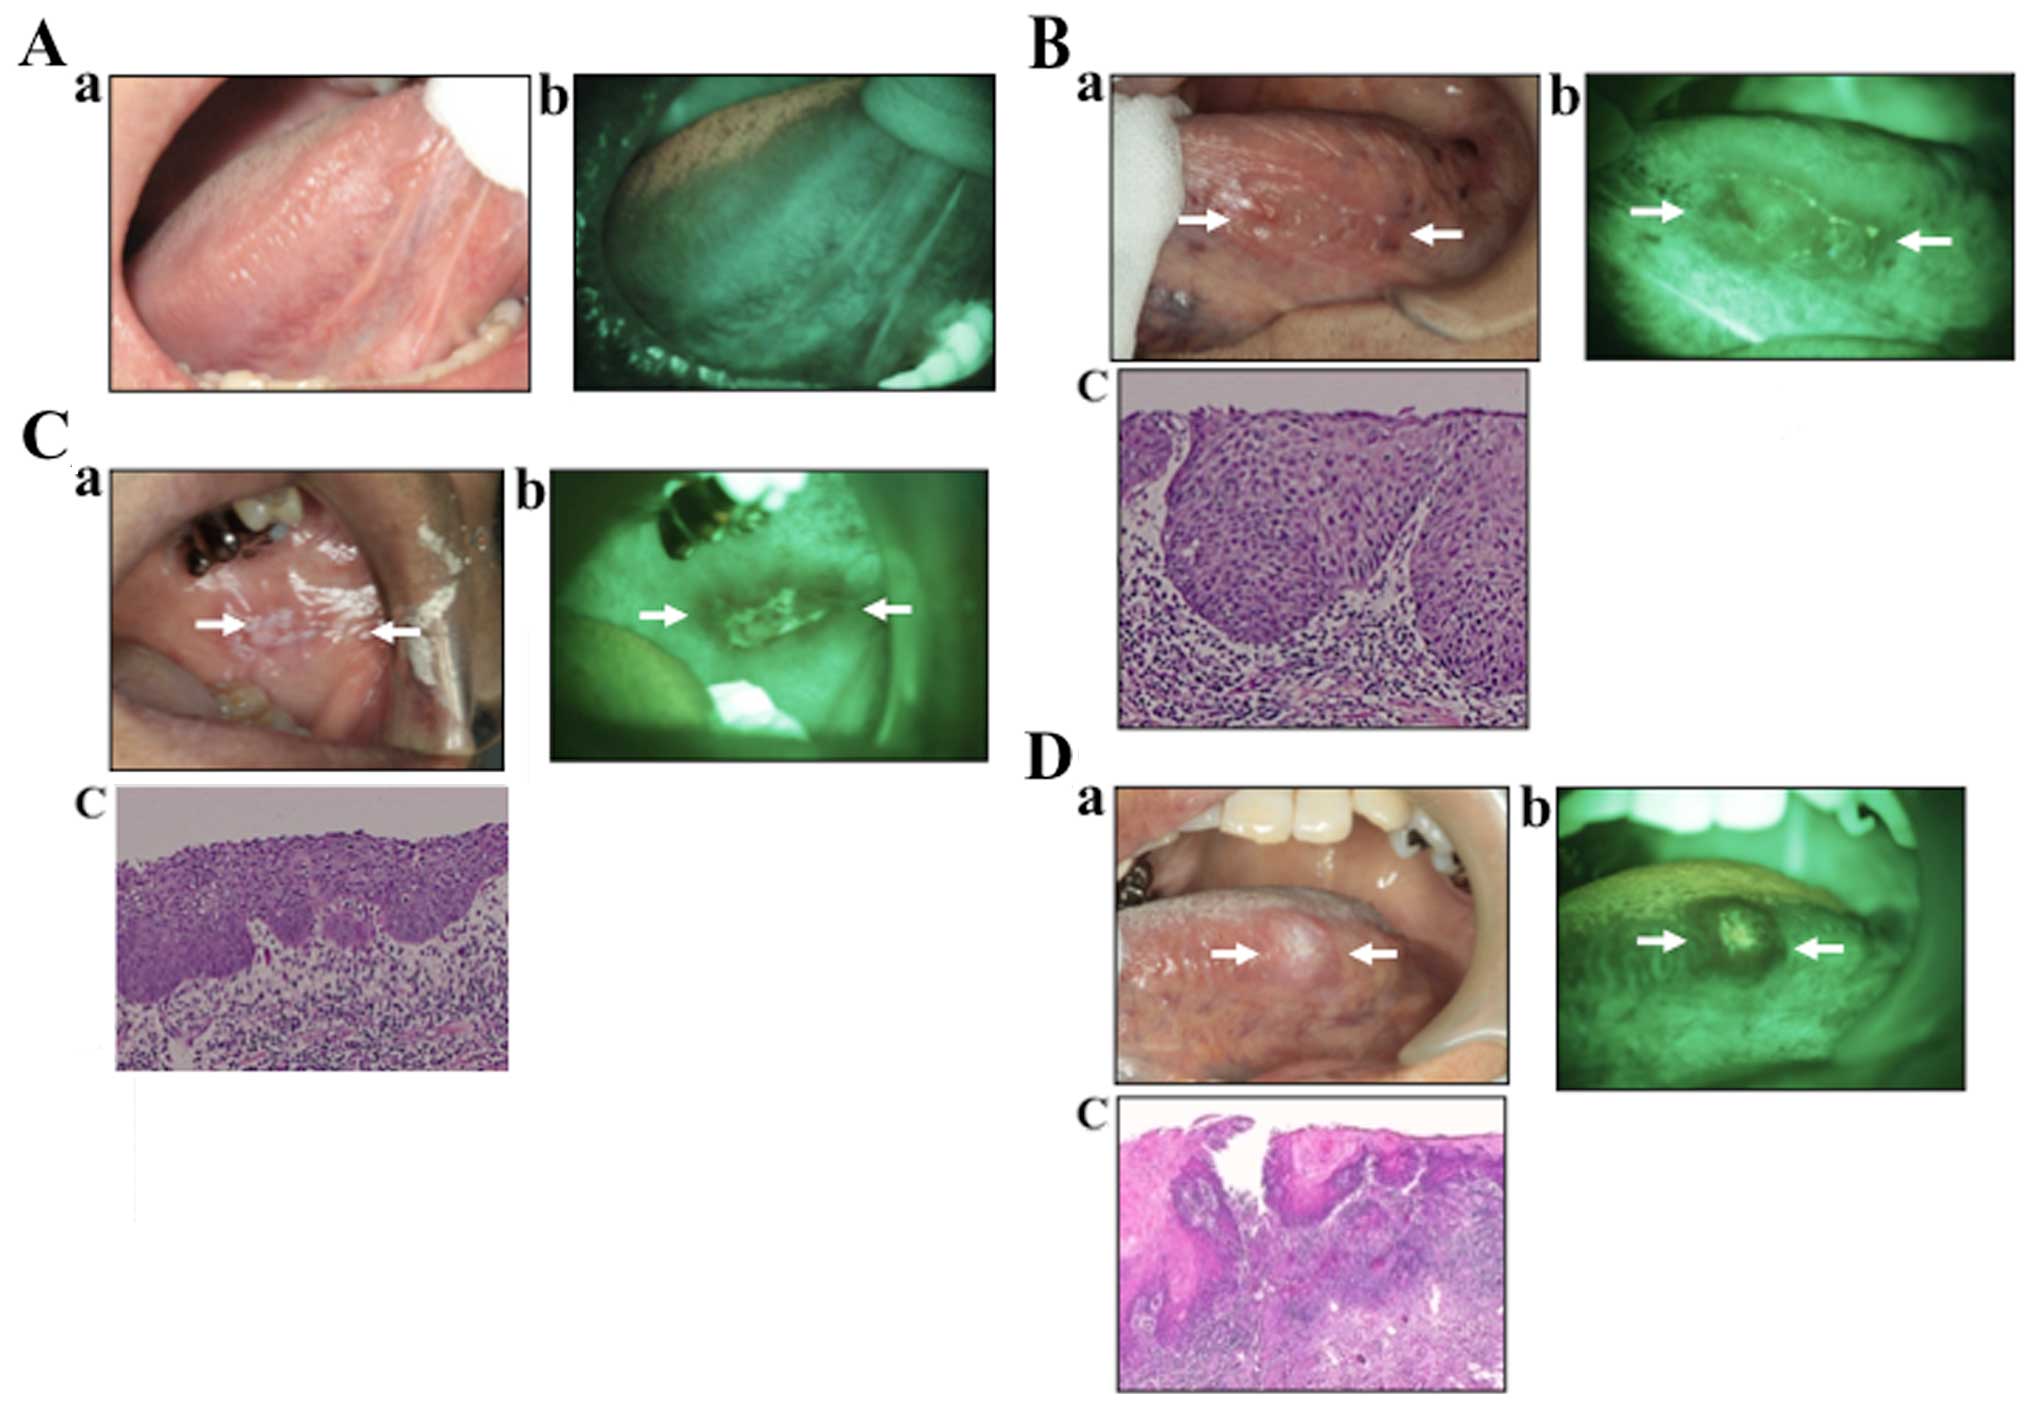
Normal tissues
Under direct FV, the normal oral mucosa reflected
various shades of pale green autofluorescence (Fig. 4A). Clinical lesions that retained
the normal green autofluorescence under direct FV were classified
as lesions with FVR.
Precancerous cases
In the VELscope image, the lesion appeared as an
irregular, dark area. This area was confirmed by biopsy to be
dysplasia. Tissues that showed a distinct reduction in the normal
pale green and appeared as dark green to black were classified as
FVL (Fig. 4B).
Early SCC cases
In the early SCC image (Fig. 3C), the lesion appeared as an
irregular, dark area. This area was found to be severe dysplasia.
Tissues that showed a distinct reduction in the normal pale green
and appeared as dark green to black were classified as FVL.
Invasive SCC case
In the SCC image (Fig.
4D), the lesion appeared as a clear, dark area. This area was
confirmed to be SCC. This assessment involved a comparison of the
lesion site with both adjacent tissue and, as an anatomical
control, with tissue on the contralateral side.
Pathology
As shown in Table
II, of the 60 samples, 13 were FVR, and 49 were FVL. None of
the 7 samples with a histological diagnosis of normal showed FVL,
whereas 90% of precancerous lesions (dysplasia and CIS) and 93% of
invasive SCC showed FVL.
| Table IICorrelation of direct FV results with
the lesion histopathology of the patients. |
Table II
Correlation of direct FV results with
the lesion histopathology of the patients.
| Normal | Dysplasia and
CIS | Invasive SCC |
|---|
| No. of lesions | 7 | 39 | 14 |
| FVR | 7 (100%) | 4 (10%) | 1 (7%) |
| FVL | 0 (0%) | 35 (90%) | 13 (93%) |
Comparison with another report
According to the BCCA, this system has a sensitivity
of 98% and specificity of 100%. Poh et al showed 97%
sensitivity and 100% specificity. This was very similar to our
results of 91% sensitivity and 100% specificity (Table III).
| Table IIISummary of the analyzed studies
referring to visualization systems (VELscope). |
Table III
Summary of the analyzed studies
referring to visualization systems (VELscope).
| Author (ref.) | Type of article | Samples | Sensitivity (%) | Specificity (%) |
|---|
| Poh et al
(10) | Crosssectional
study | 20 | 97 | 94 |
| Kois and Truelove
(12) | Case series | 4 | 98 | 100 |
| Balevi (15) | Opinion article | – | 98 | 100 |
| Ohnishi et al
(Present study) | | 20 | 91 | 100 |
A clinical study concerning the
comparison between FVL and iodine unstained area (IU)
To clarify the usefulness of FV compared to vital
staining with iodine, we investigated the surgical margin of early
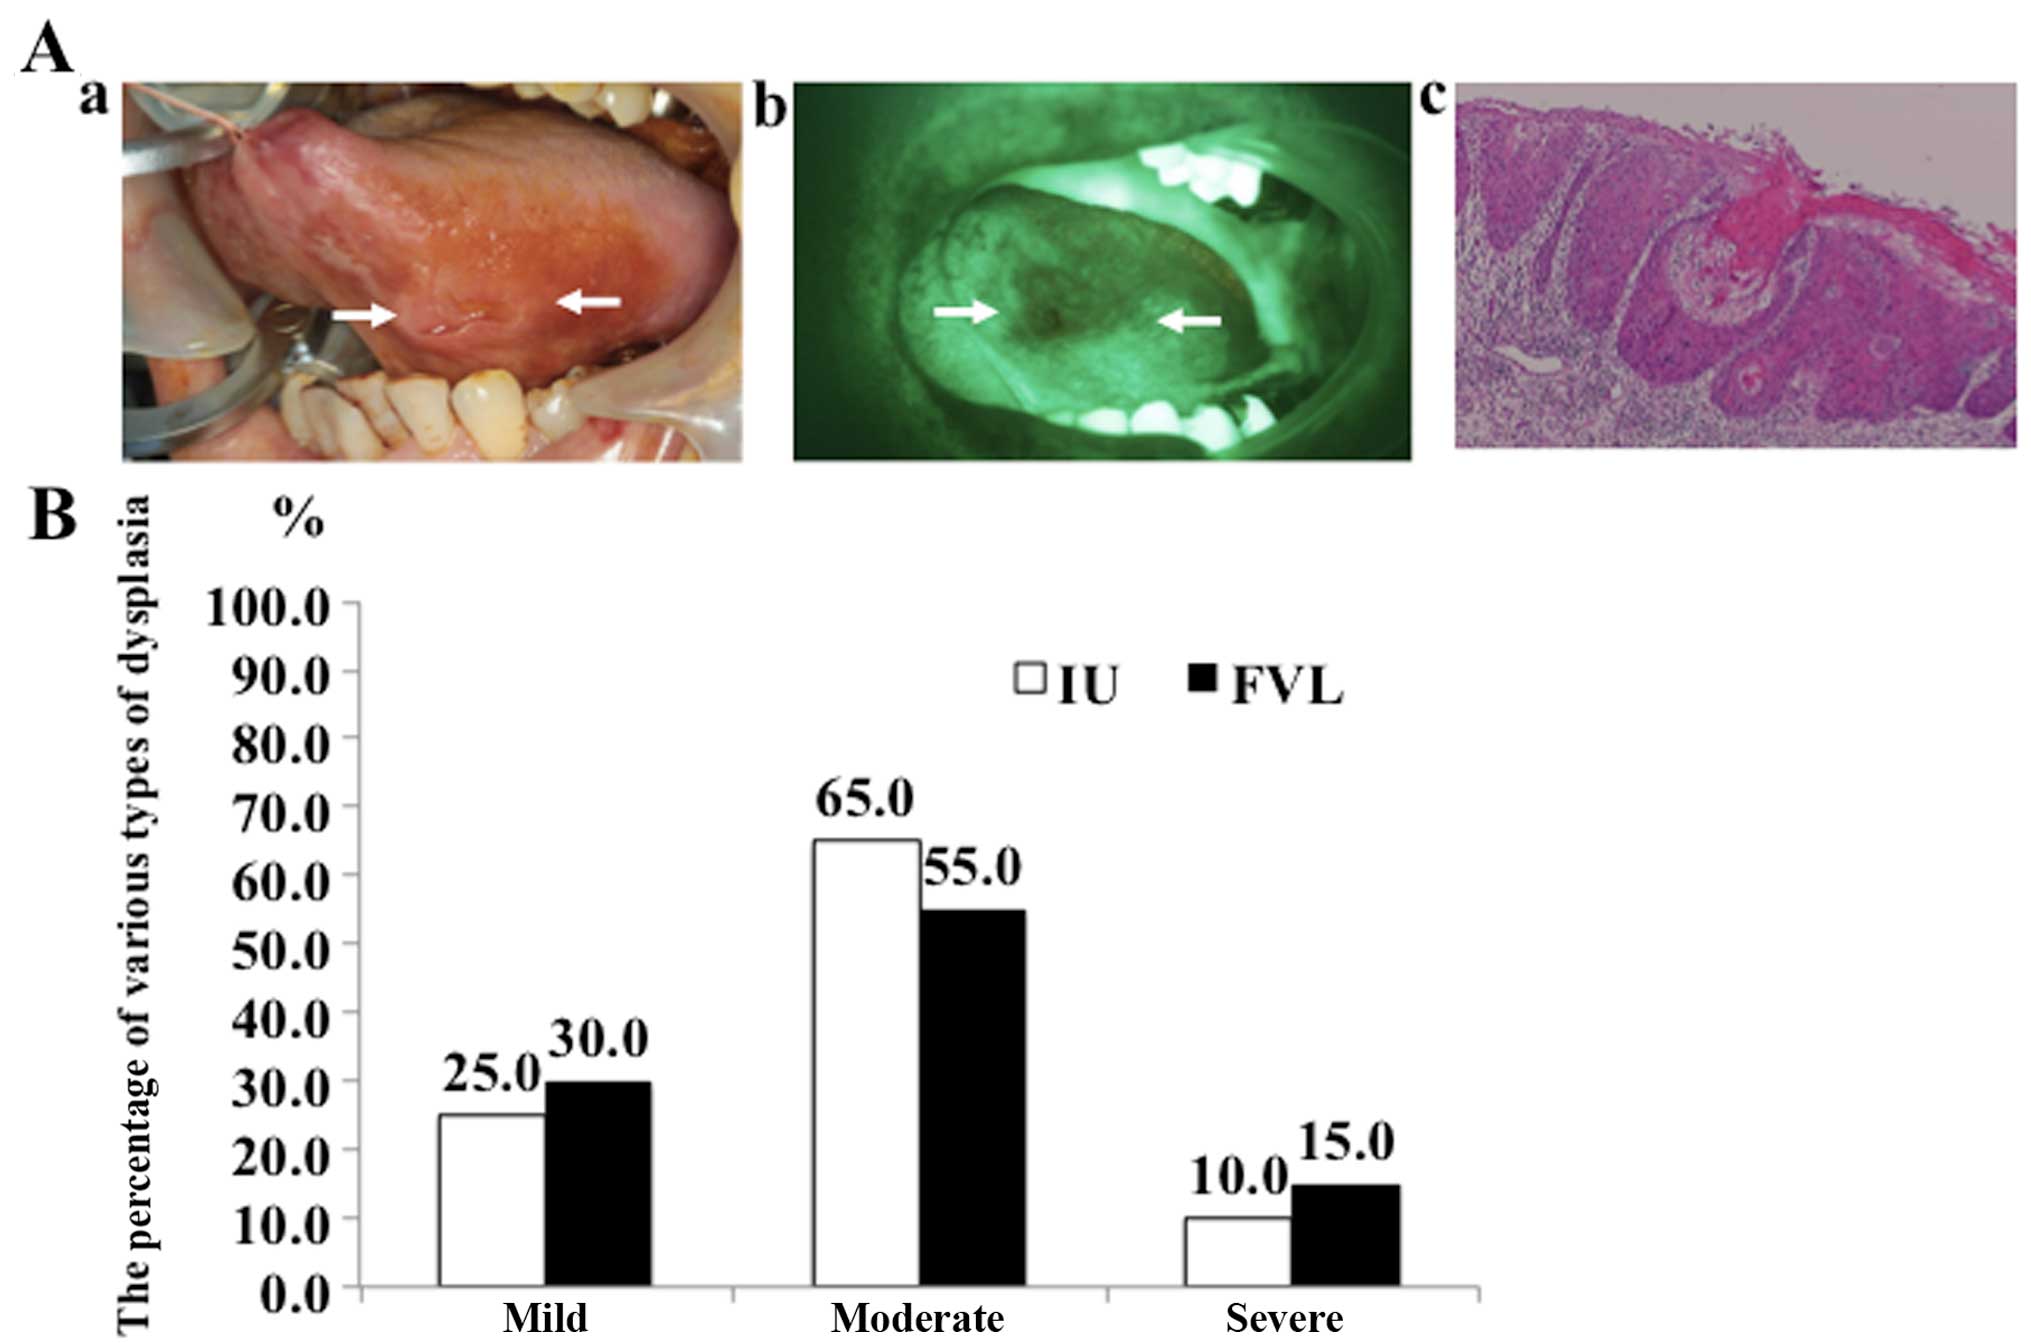
OSCC tissues and compared the FVL and IU (Fig. 5A). Twenty cases of T1 and early T2
OSCC were examined in this study. At the time of surgery, the
surgeon outlined the boundary with vital staining with iodine and
fluorescence visualization. With the operating room lights off, we
examined the lesion and outlined the FVL, measured its size, and
recorded data on the surgical sheet. Moreover, we used vital
staining with iodine and made a comparison between FVL and IU and
resected according to the wider boundary of the outline. As a
result, the entire area by FVL showed various types of epithelial
dysplasia (Fig. 5B). There were no
normal epithelium cells in any of the FVL regions. Furthermore, the
percentages of various types of dysplasia were almost equal between
FVL (mild 30.0%, moderate 55.0% and severe 15.0%) and IU (mild
25.0%, moderate 65.0%, and severe 10.0%). We considered that
determining the surgical margin based on results of FV would not
lead to oversurgery and could help prevent SPTs.
Discussion
The purpose of this study was to assess the accuracy
of autofluorescence examination and to investigate the utility of
autofluorescence as a diagnostic test to detect oral precancerous
and early cancerous lesions in rat tongue carcinogenesis and
patients. We therefore used the 4NQO rat model, which displays
similar developmental morphology to human OSCC. The 4NQO rat model
has been recognized to pass through various stages of OSCC, such as
dysplasia, CIS and SCC.
FVL was observed in the majority of the dysplasia
and CIS lesions that had a relatively higher risk of malignant
transformation. Importantly, FVL was positive in all CIS cases,
with sensitivity of 100%. FVL was also observed in the majority of
cases (85%) that were histopathologically diagnosed as dysplasia.
These results notably demonstrate the ability of the technique to
detect high-risk lesions. Furthermore, using this 4NQO rat model is
the first such study.
In this study, we also investigated the expression
of PCNA during 4NQO-induced carcinogenesis. The level of PCNA
protein gradually increased with progression of carcinogenic
transformation. Significant differences in PCNA expression were
statistically demonstrated between the normal and dysplasia groups.
Levels of protein remained high, especially after the period of
dysplastic change. Higher expression was noted in the SCC cases.
Furthermore the results of PCNA and FVL were correlated.
Moreover, we investigated the value of this device
to delineate field change in autofluorescence around cancers by
determining and comparing the histopathologic changes of margins
that retained normal FV with those margins that showed FVL in the
patients.
According to the BCCA, this system has a sensitivity
of 98% and a specificity of 100% in discriminating between normal
tissues and severe dysplasia, CIS or invasive carcinoma. Our
results were almost the same with 91% sensitivity and 100%
specificity. Thus, we conclude that the VELscope is useful in
assessing surgical margins in patients with oral precancerous and
early cancerous lesions. This makes it extremely valuable in
surgical management.
Important progress has been made in understanding
the mechanisms responsible for endogenous fluorescence from
epithelial tissues and how this fluorescence changes with
dysplastic progression (16–18).
The fluorophores of interest here are those that excite in the blue
spectrum and have properties that have been spectroscopically
correlated with dysplastic progression. The reduced form of
nicotinamide adenine dinucleotide (NADH) and the oxidized form of
flavin adenine dinucleotide (FAD) are important fluorophores that
are good indicators of cellular metabolism. It has been shown that
the strength of fluorescence due to NADH increases with dysplastic
progression, and that of FAD decreases (18,19).
Based on the present study of the origins of
fluorescence and its change with dysplastic progression, we believe
that FVL associated with dysplastic progression in the current
device is primarily due to breakdown of the collagen matrix and
increased hemoglobin absorption. Secondary to these effects is
increased dispersion in the epithelium, epithelial thickening, and
a decrease in FAD concentration.
In the use of iodine staining to diagnose oral
lesions, the iodine monad is absorbed by a spiral of one amylase
which constitutes a normal chain portion of starch existing in the
cytoplasm, and the reaction is visualized as a brown color
(20). Sawataishi et al
(21) reported that glycogen in
cells of the esophageal mucosa react with iodine. This reaction
does not occur in dysplastic mucosa, due to the lack of glycogen
granules in the cytoplasm of these cells. Furthermore,
ultrastructurally glycogen granules in cells of the esophageal
mucosal epithelium decrease with the grade of epithelial dysplasia.
Another study suggested that mild dysplastic epithelia that stain
with iodine may be normal epithelia, whereas both moderate and
severe dysplasia that are unstained with iodine may be malignant
lesions (22). To clarify the
usefulness of FV compared to vital staining with iodine, we
investigated the surgical margins of early OSCC tissues and
compared the results of FVL and IU. As a result, the entire area by
FVL showed various types of epithelial dysplasia. There were no
normal epithelium cells in any of the FVL regions. Furthermore, the
percentages of various types of dysplasia were almost equal between
the FVL and IU results.
These results suggest that this direct FV device has
potential as a simple, cost-effective screening, biopsy guidance,
and margin setting device for oral precancerous and early cancerous
lesions.
Abbreviations:
|
FV
|
fluorescence visualization
|
|
CIS
|
carcinoma in situ
|
|
SCC
|
squamous cell carcinoma
|
|
FVR
|
fluorescence visualization
retained
|
|
FVL
|
fluorescence visualization loss
|
|
IU
|
iodine unstained area
|
Acknowledgments
This manuscript was edited for English language by
Textcheck English consultants. Funding for this study was provided
by Osaka Dental University (K.K.).
References
|
1
|
Chen YJ, Lin SC, Kao T, Chang CS, Hong PS,
Shieh TM and Chang KW: Genome-wide profiling of oral squamous cell
carcinoma. J Pathol. 204:326–332. 2004. View Article : Google Scholar : PubMed/NCBI
|
|
2
|
Pentenero M, Gandolfo S and Carrozzo M:
Importance of tumor thickness and depth of invasion in nodal
involvement and prognosis of oral squamous cell carcinoma: a review
of the literature. Head Neck. 27:1080–1091. 2005. View Article : Google Scholar : PubMed/NCBI
|
|
3
|
Myers JN, Elkins T, Roberts D and Byers
RM: Squamous cell carcinoma of the tongue in young adults:
increasing incidence and factors that predict treatment outcomes.
Otolaryngol Head Neck Surg. 122:44–51. 2000. View Article : Google Scholar : PubMed/NCBI
|
|
4
|
Choong N and Vokes E: Expanding role of
the medical oncologist in the management of head and neck cancer.
CA Cancer J Clin. 58:32–53. 2008. View Article : Google Scholar
|
|
5
|
De Veld DCG, Witjes MJH, Sterenborg HJCM
and Roodenburg JLN: The status of in vivo autofluorescence
spectroscopy and imaging for oral oncology. Oral Oncol. 41:117–131.
2005. View Article : Google Scholar : PubMed/NCBI
|
|
6
|
Onizawa K, Saginoya H, Furuya Y, Yoshida H
and Fukuda H: Usefulness of fluorescence photography for diagnosis
of oral cancer. Int J Oral Maxillofac Surg. 28:206–210. 1999.
View Article : Google Scholar : PubMed/NCBI
|
|
7
|
Onizawa K, Saginoya H, Furuya Y and
Yoshida H: Fluorescence photography as a diagnostic method for oral
cancer. Cancer Lett. 108:61–66. 1996. View Article : Google Scholar : PubMed/NCBI
|
|
8
|
Svistun E, Alizadeh-Naderi R, El-Naggar A,
Jacob R, Gillenwater A and Richards-Kortum R: Vision enhancement
system for detection of oral cavity neoplasia based on
autofluorescence. Head Neck. 26:205–215. 2004. View Article : Google Scholar : PubMed/NCBI
|
|
9
|
Lane PM, Gilhuly T, Whitehead P, Zeng H,
Poh CF, Ng S, Williams PM, Zhang L, Rosin MP and MacAulay CE:
Simple device for the direct visualization of oral-cavity tissue
fluorescence. J Biomed Opt. 11:0240062006. View Article : Google Scholar : PubMed/NCBI
|
|
10
|
Poh CF, Ng SP, Williams PM, Zhang L,
Laronde DM, Lane P, Macaulay C and Rosin MP: Direct fluorescence
visualization of clinically occult high-risk oral premalignant
disease using a simple hand-held device. Head Neck. 29:71–76. 2007.
View Article : Google Scholar
|
|
11
|
Qu J, MacAulay C, Lam S and Palcic B:
Laser induced fluorescence spectroscopy at endoscopy: Tissue
optics, Monte Carlo modeling and in vivo measurements. Opt Eng.
34:3334–3343. 1995. View Article : Google Scholar
|
|
12
|
Kois JC and Truelove E: Detecting oral
cancer: a new technique and case reports. Dent Today. 25:94–97.
96–97. 2006.PubMed/NCBI
|
|
13
|
Poh CF, Zhang L, Anderson DW, Durham JS,
Williams PM, Priddy RW, Berean KW, Ng S, Tseng OL, MacAulay C, et
al: Fluorescence visualization detection of field alterations in
tumor margins of oral cancer patients. Clin Cancer Res.
12:6716–6722. 2006. View Article : Google Scholar : PubMed/NCBI
|
|
14
|
Müller MG, Valdez TA, Georgakoudi I,
Backman V, Fuentes C, Kabani S, Laver N, Wang Z, Boone CW, Dasari
RR, et al: Spectroscopic detection and evaluation of morphologic
and biochemical changes in early human oral carcinoma. Cancer.
97:1681–1692. 2003. View Article : Google Scholar : PubMed/NCBI
|
|
15
|
Balevi B: Evidence-based decision making:
Should the general dentist adopt the use of the VELscope for
routine screening for oral cancer? J Can Dent Assoc. 73:603–606.
2007.PubMed/NCBI
|
|
16
|
Richards-Kortum R and Sevick-Muraca E:
Quantitative optical spectroscopy for tissue diagnosis. Annu Rev
Phys Chem. 47:555–606. 1996. View Article : Google Scholar : PubMed/NCBI
|
|
17
|
Drezek R, Sokolov K, Utzinger U, Boiko I,
Malpica A, Follen M and Richards-Kortum R: Understanding the
contributions of NADH and collagen to cervical tissue fluorescence
spectra: modeling, measurements, and implications. J Biomed Opt.
6:385–396. 2001. View Article : Google Scholar : PubMed/NCBI
|
|
18
|
Drezek R, Brookner C, Pavlova I, Boiko I,
Malpica A, Lotan R, Follen M and Richards-Kortum R:
Autofluorescence microscopy of fresh cervical-tissue sections
reveals alterations in tissue biochemistry with dysplasia.
Photochem Photobiol. 73:636–641. 2001. View Article : Google Scholar : PubMed/NCBI
|
|
19
|
Pavlova I, Sokolov K, Drezek R, Malpica A,
Follen M and Richards-Kortum R: Microanatomical and biochemical
origins of normal and precancerous cervical autofluorescence using
laser-scanning fluorescence confocal microscopy. Photochem
Photobiol. 77:550–555. 2003. View Article : Google Scholar : PubMed/NCBI
|
|
20
|
Tsuboi S, Sato K and Nakajima K: Gendai no
Seikagaku. Kanehara Publishing; Tokyo: pp. 55–56. 1992
|
|
21
|
Sawataishi M, Karaki Y, Kawaguchi M,
Saitoh M, Saeki T, Yamada A, Shimazaki K, Munakata S, Sakamoto T,
Shinbo T, et al: The examination of the coloring mechanism of the
human esophageal epithelium by Lugol's solution. J Jpn
Bronchoesophagol Soc. 40:252–257. 1989. View Article : Google Scholar
|
|
22
|
Yokoo K, Noma H, Inoue T, Hashimoto S and
Shimono M: Cell proliferation and tumor suppressor gene expression
in iodine unstained area surrounding oral squamous cell carcinoma.
Int J Oral Maxillofac Surg. 33:75–83. 2004. View Article : Google Scholar
|